
Abstract
A finite element (FE) approach was used to predict the barrier performance of nanocomposites with respect to fluids permeation. This could be, for example, a polymer with nanoreinforcements like graphene, and used as a coating or a liner. The model was verified with analytical and experimental measurements, and the influence on barrier performance of different flake characteristics – aspect ratio, loading, thickness, angular orientation, as well as distance between adjacent flakes – were studied. It was found that good correlation can be obtained using certain analytical models within their limited range of parameters, but the present work extends the applicability to nanoreinforcements like graphene with greater aspect ratios. In addition, the effect of flake angle was also investigated and found to be both beneficial and disadvantageous for barrier performance, depending on the flake aspect ratio.
Keywords
Introduction
Nanocomposites typically consist of nanoscale reinforcements like carbon nanotubes, graphene and montmorillonite dispersed in a matrix material such as a polymer. The introduction of these reinforcements, even in relatively small amounts, has been shown to significantly affect the overall performance of the nanocomposites, such as barrier properties, tensile strength, shrinkage, bond integrity and wear rates [1-5].
Enhanced barrier properties in polymer nanocomposites can be exploited to produce high performance coatings and liners for pipelines and other corrosion-prone structures to extend their lifespan, especially in highly demanding environments, such as offshore, high CO2 (carbon dioxide) or high H2S (hydrogen sulphide). Hence, understanding the relationship between diffusion barrier properties of the nanocomposite and the type of nanoreinforcements, as well as the manner they are used would allow the optimum design for specific coating applications.
The current work presents a predictive model for determining barrier performance (i.e. improved performance if there is a reduction in diffusion) of a nanocomposite, which would consist of a permeable matrix filled with impermeable flakes. The model is verified with analytical models and experimental measurements, and further developed to look into the effects of different loadings and aspect ratios of the flake, over a range of flake angles. There are many permeation models that have been developed over the years [6-18], and the current work has selected some of them, including Minelli [6, 7], Nielsen [9], Cussler [10], and Dondero [11], for comparison. Most of these models considered the nanoreinforcements to be uniformly aligned perpendicular to the direction of permeation. It has been shown [12] that the FE approach offers greater potential in studying different combinations of factors, which is the aim of the present study by also considering different flake characteristics – aspect ratio, loading, thickness, angular orientation, as well as distance between adjacent flakes – and its effects on barrier performance.
Minelli et al. [6, 7] successfully derived algebraic empirical models to predict the enhancement of diffusion barrier properties in nanocomposites with ordered 2D and 3D flakes in the matrices. They went on to explore random flake systems and different geometries of flakes, but all involving flakes oriented parallel to the surface of the matrix. These results were shown to compare favourably with simulation models developed based on the finite volume method.
The model by Dondero et al. [11] is one of the few analytical models that accounts for the flake orientational disorder, through an order parameter, S, which estimates the mean flake orientation. This is based on a combination of earlier models by Lape et al. [13] and Bharadwaj [14], with Boundary Element analyses for tuning the model.
However, like Minelli, the Dondero model only works within certain boundaries – which will be discussed in this study – and they do not adequately cover the range of values for applications involving large aspect ratio nanoreinforcements like graphene. Tan and Thomas [15] have conducted a comprehensive review of moisture barrier properties of polymer with nanofillers. Specifically for graphene nanocomposites, they have highlighted measured aspect ratios that are significantly high from 500 to 800, and dramatic improvement in barrier properties with just 0.001 wt-% of graphene oxide in solution-casted polyimide. Hence, it is relevant to consider high aspect ratios and low filler loadings in the present study.
In addition, the current work also extends the understanding of the relationship between flake orientation and dimensions on the barrier performance of a nanocomposite. Wolf et al. [19] have shown that the morphology and geometry of flakes in nanocomposites can affect the barrier performance. For the purpose of the present study, square and rectangular flakes are considered so as to facilitate comparisons with the referenced experimental and analytical results.
Simulation models
A parametric study is conducted using a finite element (FE) approach to solve Fick's law of diffusion, to develop an understanding of the relationships between flake dimensions and orientations. The ultimate objective of this is to enable coatings to be customised for specific requirements by controlling the type of nanoreinforcements and the manner in which they are used in a composite.
The ABAQUS FE software solver is used for this work. A model with uniformly distributed flakes is developed first, and validated with analytical and experimental results. Then, the model is further developed to investigate different flake characteristics, namely its percentage/loading, aspect ratio, and angle/orientation. Note that for this work two other parameters, i.e. the distance between adjacent flakes and the slit width, are related to the three parameters stated before and, hence, are not independently studied.
Two-dimensional (2D) models
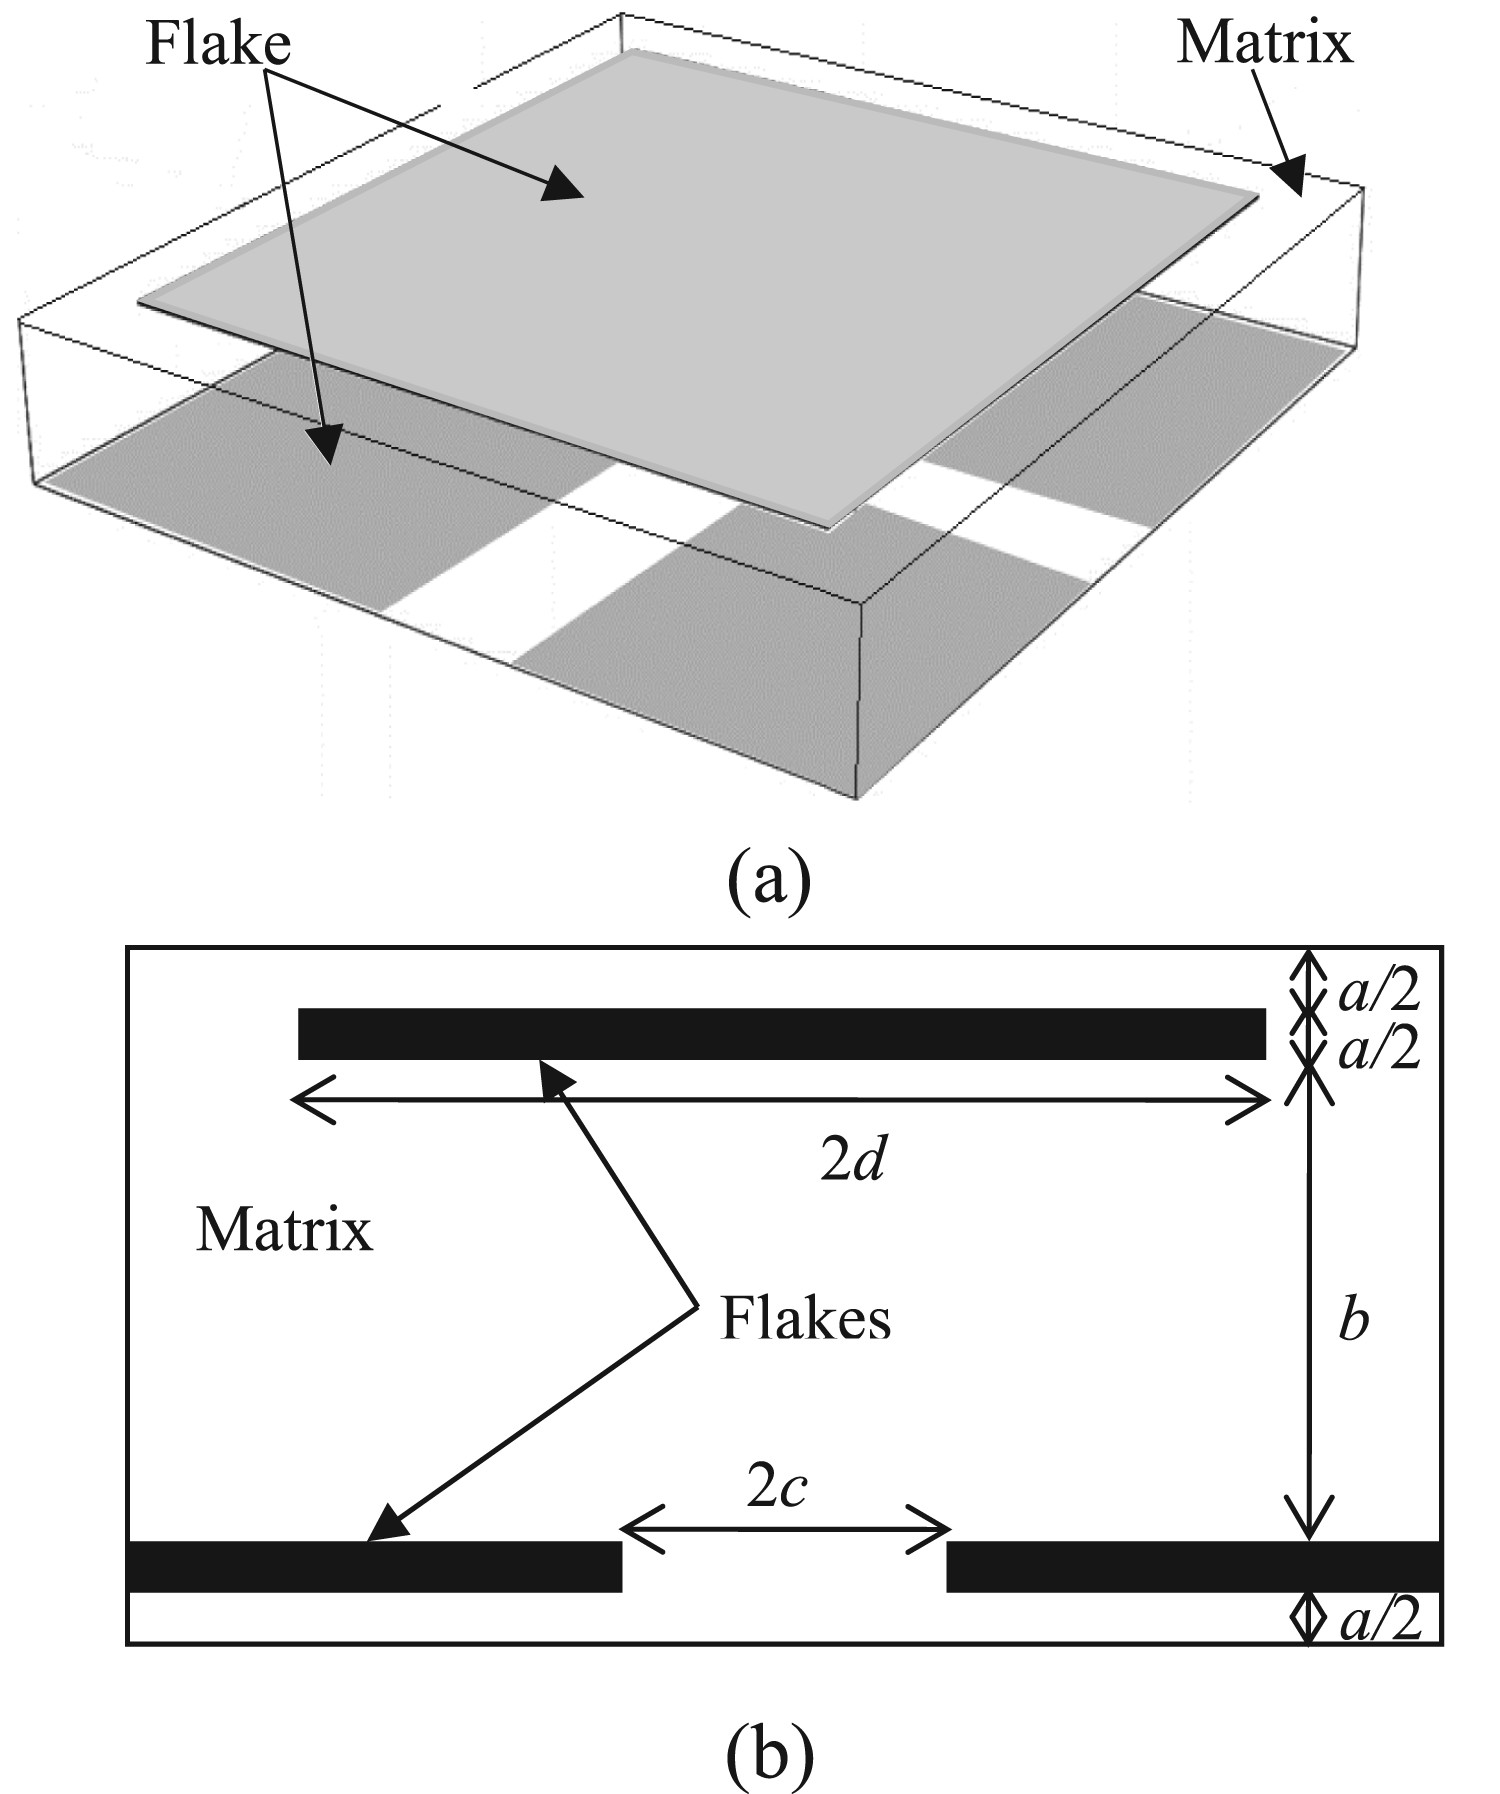
The FE model is assumed to be a matrix with uniformly distributed ‘barrier’ flakes that increase the tortuousness of the path taken by the permeating species, or permeants, as illustrated in Figure 1(a). The main assumption here is that the flakes are all oriented perpendicular to the initial direction of the permeant. This can be represented by a unit cell model, as given in Figure 1(b), with flake half-thickness, a/2, distance between flakes, b, slit width, 2c, and flake length, 2d.
(a) Illustration of the barrier model. (b) Unit cell model with notation of variables.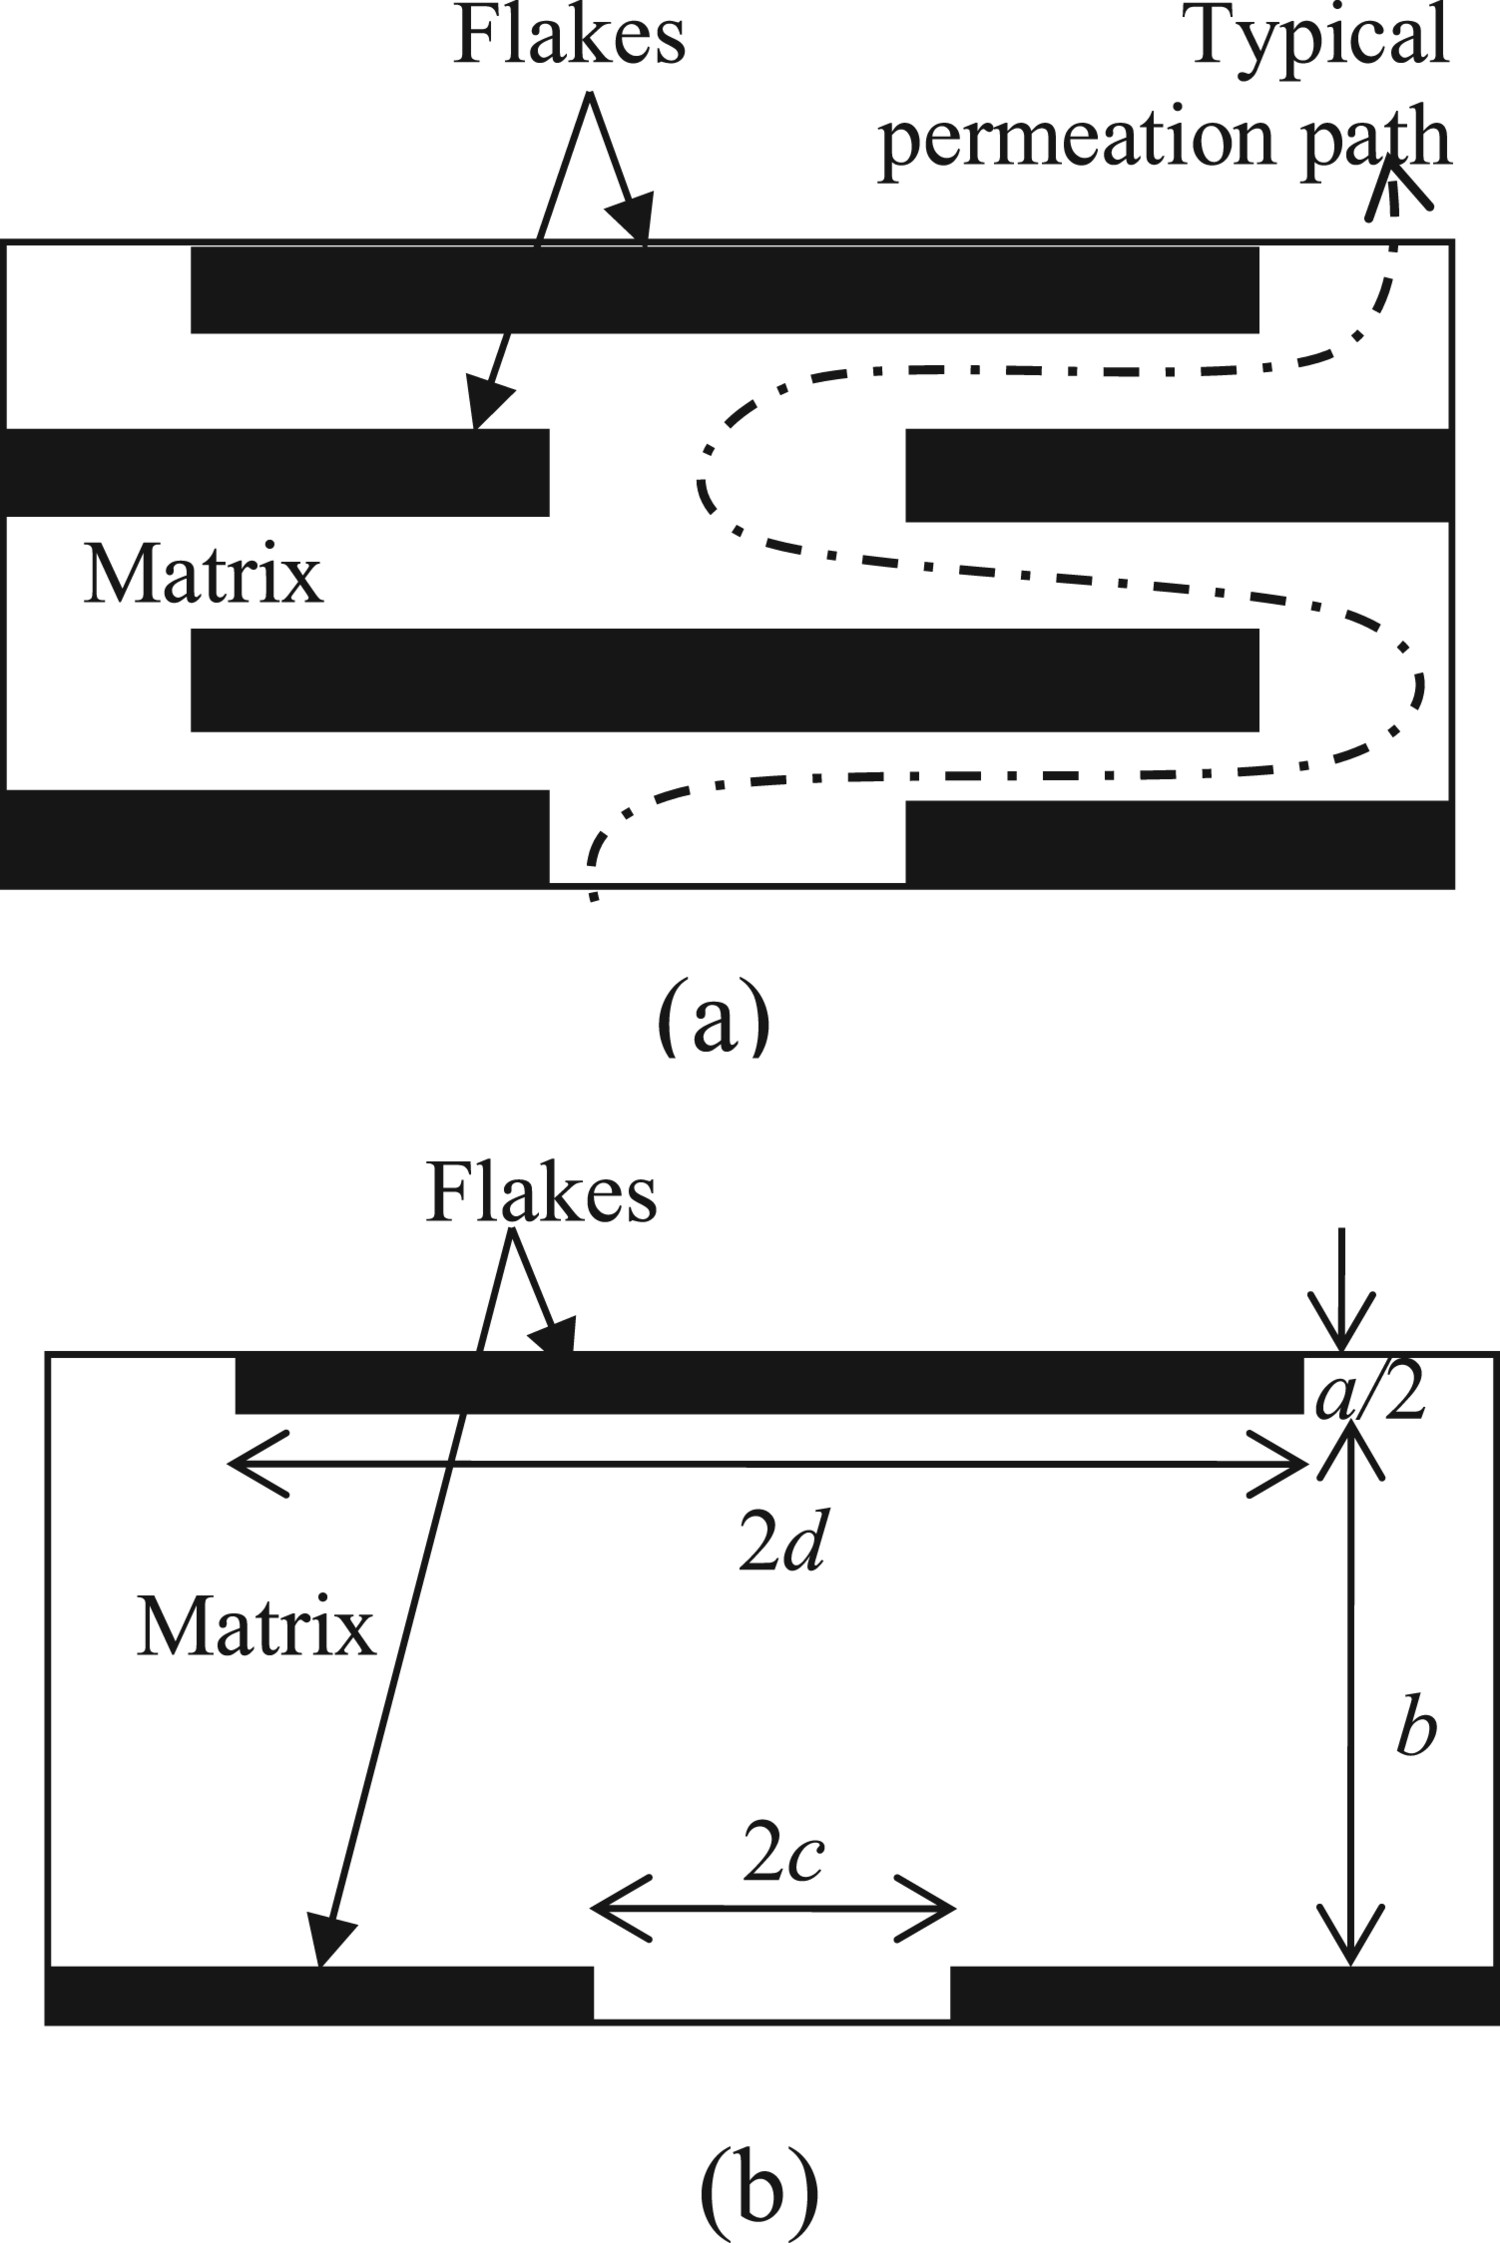
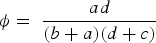
As defined by Minelli et al. [7], the flake aspect ratio,
 , slit shape,
 , and loading,
 are related as follows:


The unit cell has nodes on its left edge that match those opposite on the right edge, having the same y-coordinate. The matching nodes are each assigned equal boundaries to represent a periodic boundary condition.
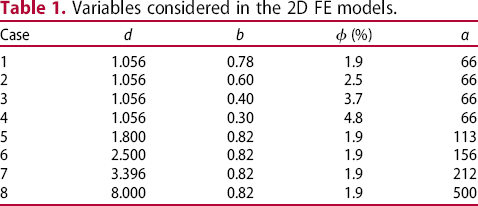
 , is 3.13. Then, a range of flake half-lengths (d = 1.056–8) and flake distances (b = 0.30–0.82) are used to vary the aspect ratio, α, of the models from 66 to 500, while
 is correspondingly varied from 1.9 to 4.8%. These variables are summarised in Table 1.
Variables considered in the 2D FE models.
 (%)
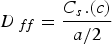
(%)A mass diffusion analysis is carried out on the models to obtain the steady-state mass concentration based on an arbitrary steep concentration difference, Δc of 350 between the bottom edge of the unit cell to the top edge. From the predicted concentrations, the average concentration at the outlet slit, Cs, can be obtained.
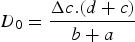
The diffusion resistance of the unit cell is represented as
 , where:
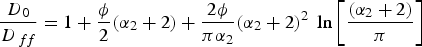
D 0 is the diffusivity of a pure matrix, represented by:
D ff is the diffusivity of a flake-filled nanocomposite, represented by:
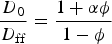
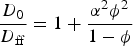
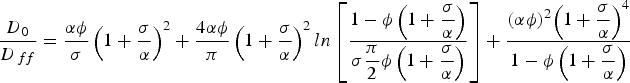
Many analytical solutions are available for this unit cell arrangement, including those by Nielsen [9] (Equation (6)), Cussler [10] (Equation (7)), Minelli [6, 7] (Equation (8)) and Dondero [11] (Equation (10)), that produce predictions with varying degrees of accuracy. These equations are shown below.
For r < 1
For r > 1
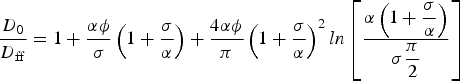
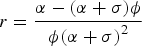
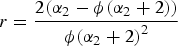
For Equation (8), r is given by:
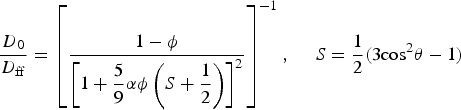
Dondero's Equation (10) takes into account any disorder in flake orientation, considering the flake angle,
 . The limitations of the model are aspect ratios 5 ≤ α ≤ 50, flake loading
 ≤ 10% and flake angle
 ≤ 20°.
Minelli has shown that the prediction using Equation (8) is most accurate in an ordered 2D system, and is hence the main model used in this study for comparison with FE results. It is worth noting that the boundaries of Minelli's study are as follows:
 = 5–300,
 = 0.5–5 and
 = 0.5–10%.
Three-dimensional (3D) models
The 2D FE models are extended to 3D models as shown in Figures 2 and 3. Two approaches are used and compared, one having only a single flake (1F), as illustrated in Figure 2, and another having 2 layers of flakes (2F), as given in Figure 3. The different models are required for comparison with different published analytical and experimental results. The models are assumed to consist of a matrix with uniformly distributed impermeable flakes that increase the tortuousness of the path for permeants flowing through it.
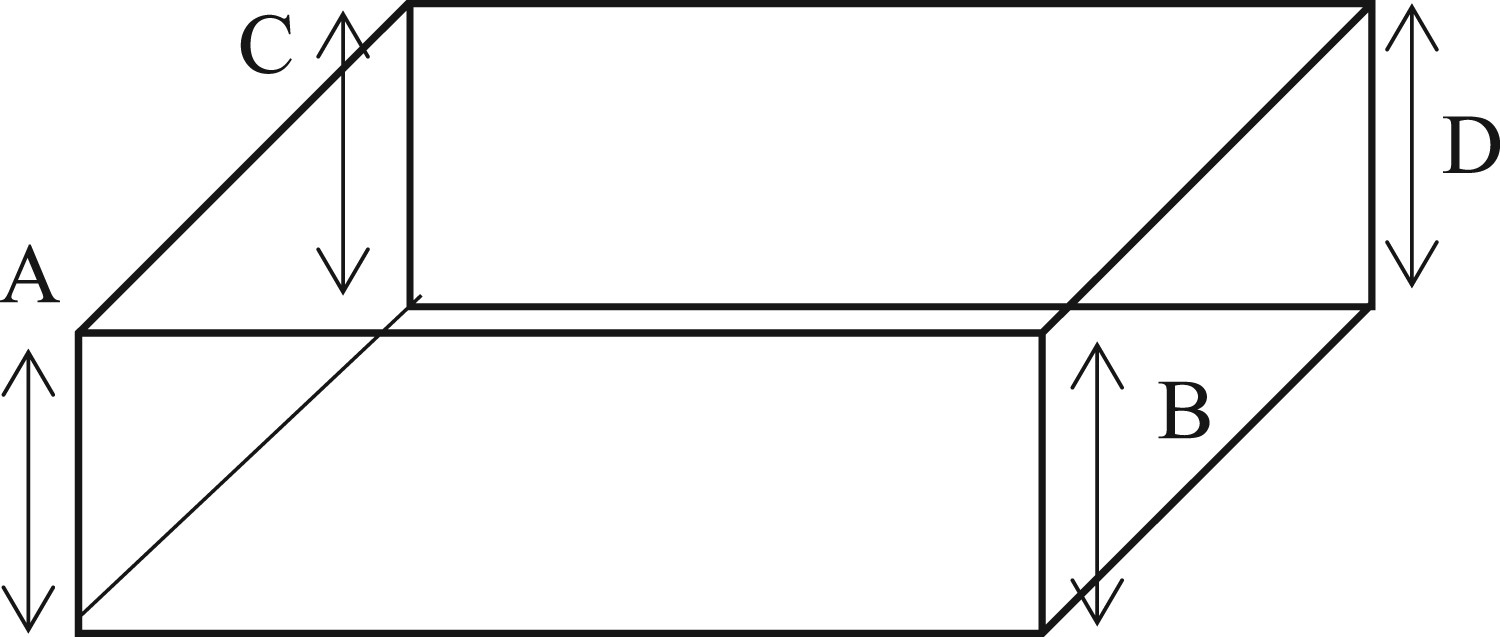
3D single-flake (1F) model with a single flake at the centre of the unit cell: (a) isometric view of unit cell; (b) side view, showing the main dimensions. 3D two-flake (2F) model with two layers of flakes situated, respectively, at the top and bottom of the unit cell, and arranged in a uniformly overlapping pattern: (a) isometric view of unit cell, (b) side view, showing the main dimensions.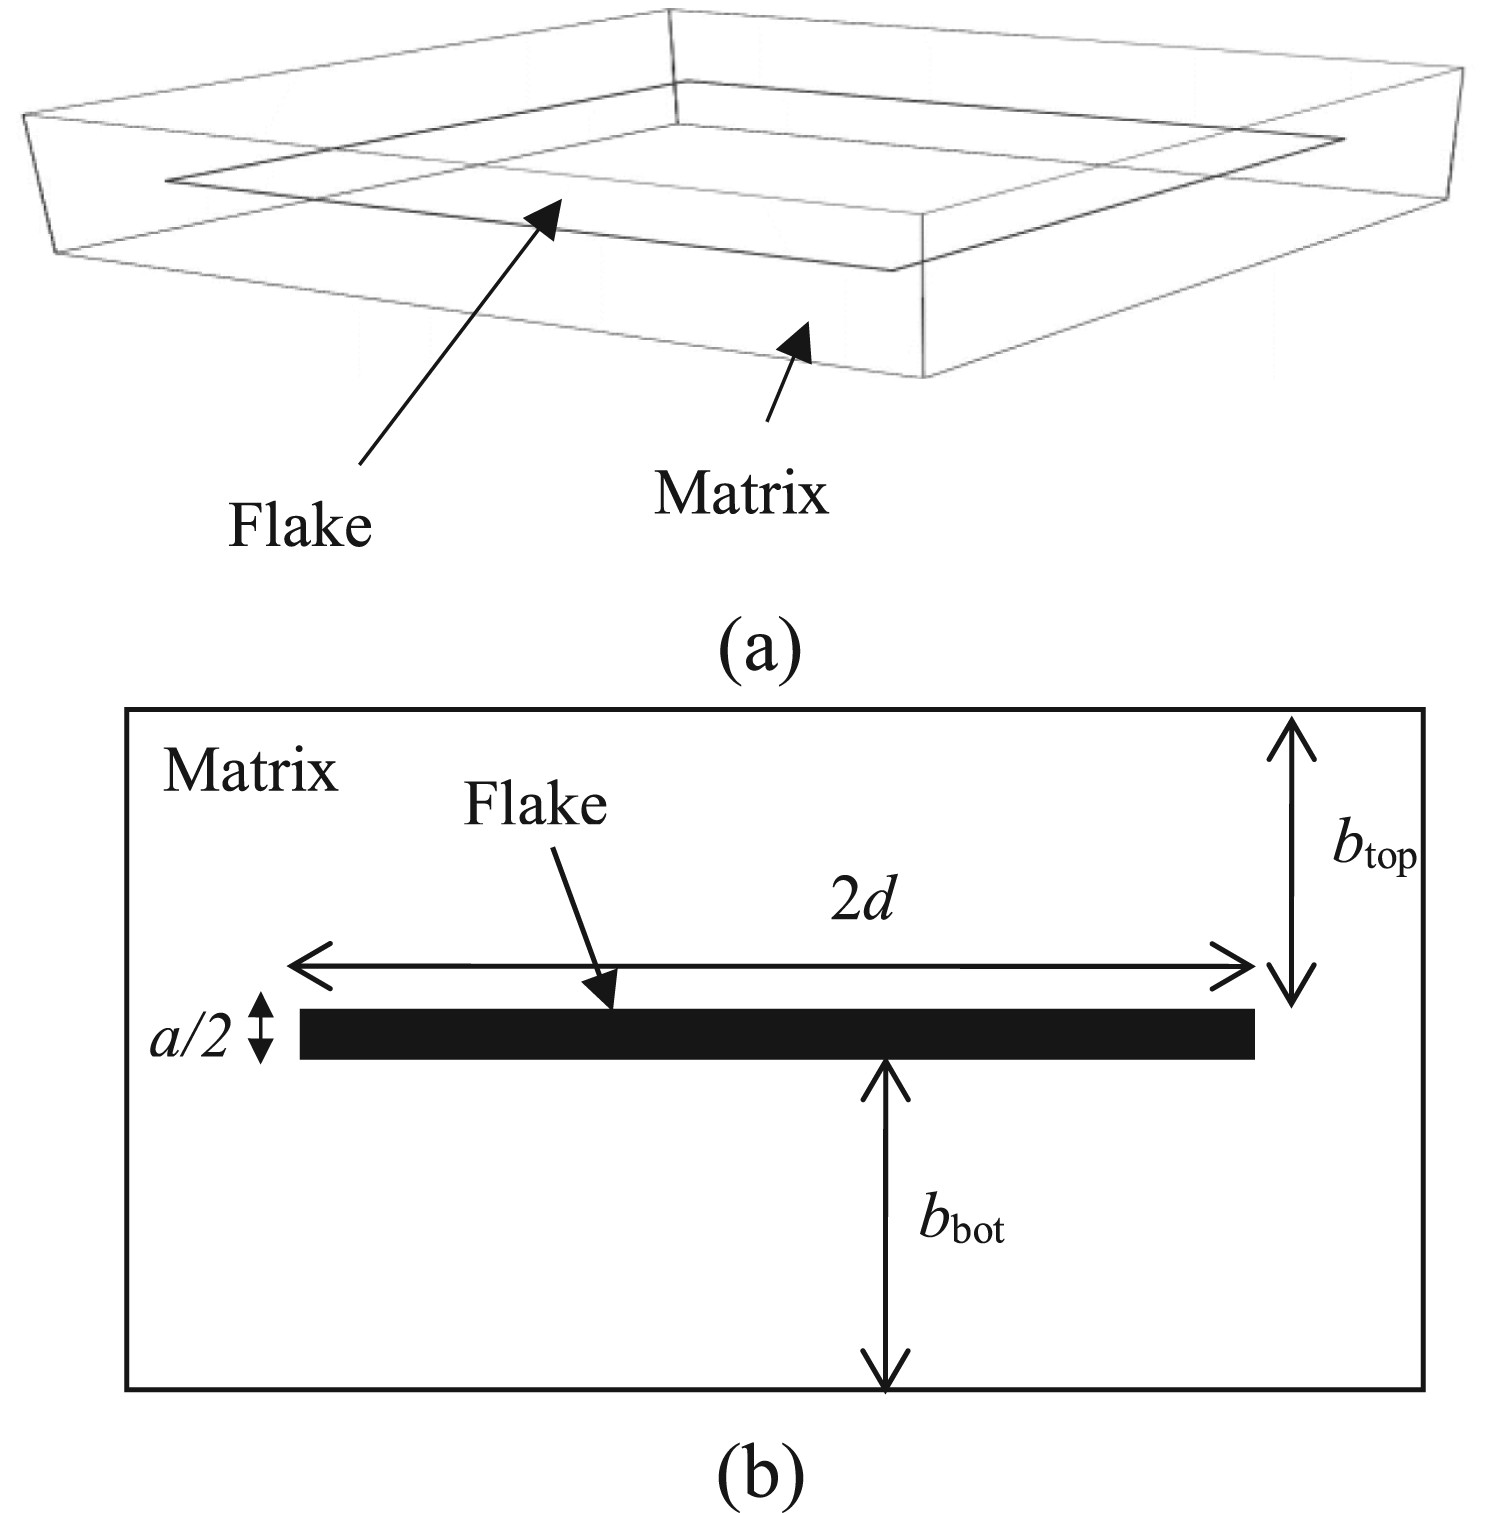
The 1F model is represented by a unit cell of a specific volume and a square (shape ratio = 1) or rectangular (shape ratio < 1) flake at its centre. Figure 2(b) shows the parameters that define the unit cell.
The 2F model is essentially the same as described for the 2D model in the previous section. However, to facilitate modelling for cases with angled flakes, the flakes are embedded one flake thickness away from the top and bottom faces of the unit cell, as shown in Figure 3. Figure 3(b) shows the parameters that define the unit cell for this model, where the variables include flake length, 2d, and half-thickness, a/2, distance between flakes, b, and slit width, 2c. Square flakes, per the x–z plane, are assumed in this study.
The unit cells for 1F and 2F are assigned equal left and right boundaries and equal front and back boundaries to represent a periodic boundary condition. Based on Figure 4, the four corners of the unit cell are also represented by the equation for concentration, U, where:
3D diffusion unit cell, depicting corners.
The 2D analytical solution for an ordered nanocomposite systems by Minelli [7], Equation (8), has been shown to give good correlation even for 3D models, but with modifications to the definition of
 (Equation (12)) and
 (Equation (13)) to cater for the 3D nature of the unit cell.


 , is also analysed for two values beyond the Minelli analytical solution (
 > 5), i.e. 29.3 and 146.5. In addition, the analytical solution for random 3D systems by Minelli is also used for comparison. The flakes are however still assumed to be perpendicular to the direction of diffusion at the inlet. This is described by the following equations. To cater for randomness of flake positioning, this equation does not include the slit shape in its calculation.
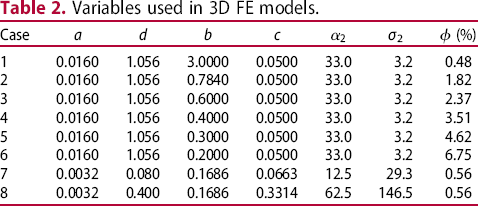
Variables used in 3D FE models.

 (%)
(%)For r < 1

For r ≥ 1
For Equation (14), r is given by:
Experimental comparison
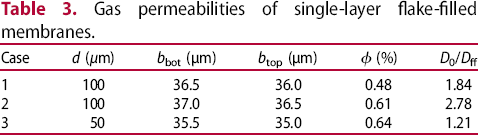
Gas permeabilities of single-layer flake-filled membranes.
 (%)
(%)For the purpose of comparison between predictions from the FE models developed in this study and experimental data derived from the work of Liu and Cussler, 2D-1F and 3D-1F FE models of the membranes are created based on variables summarised in Table 3.
Parametric analyses
Parametric analyses are conducted using the 3D-2F FE model where the two main variables studied are flake angle, θ, as defined in Figure 5, and flake aspect ratio, α.
(a) Flake angle; (b) top and bottom flakes begin to touch each other, as θ increases.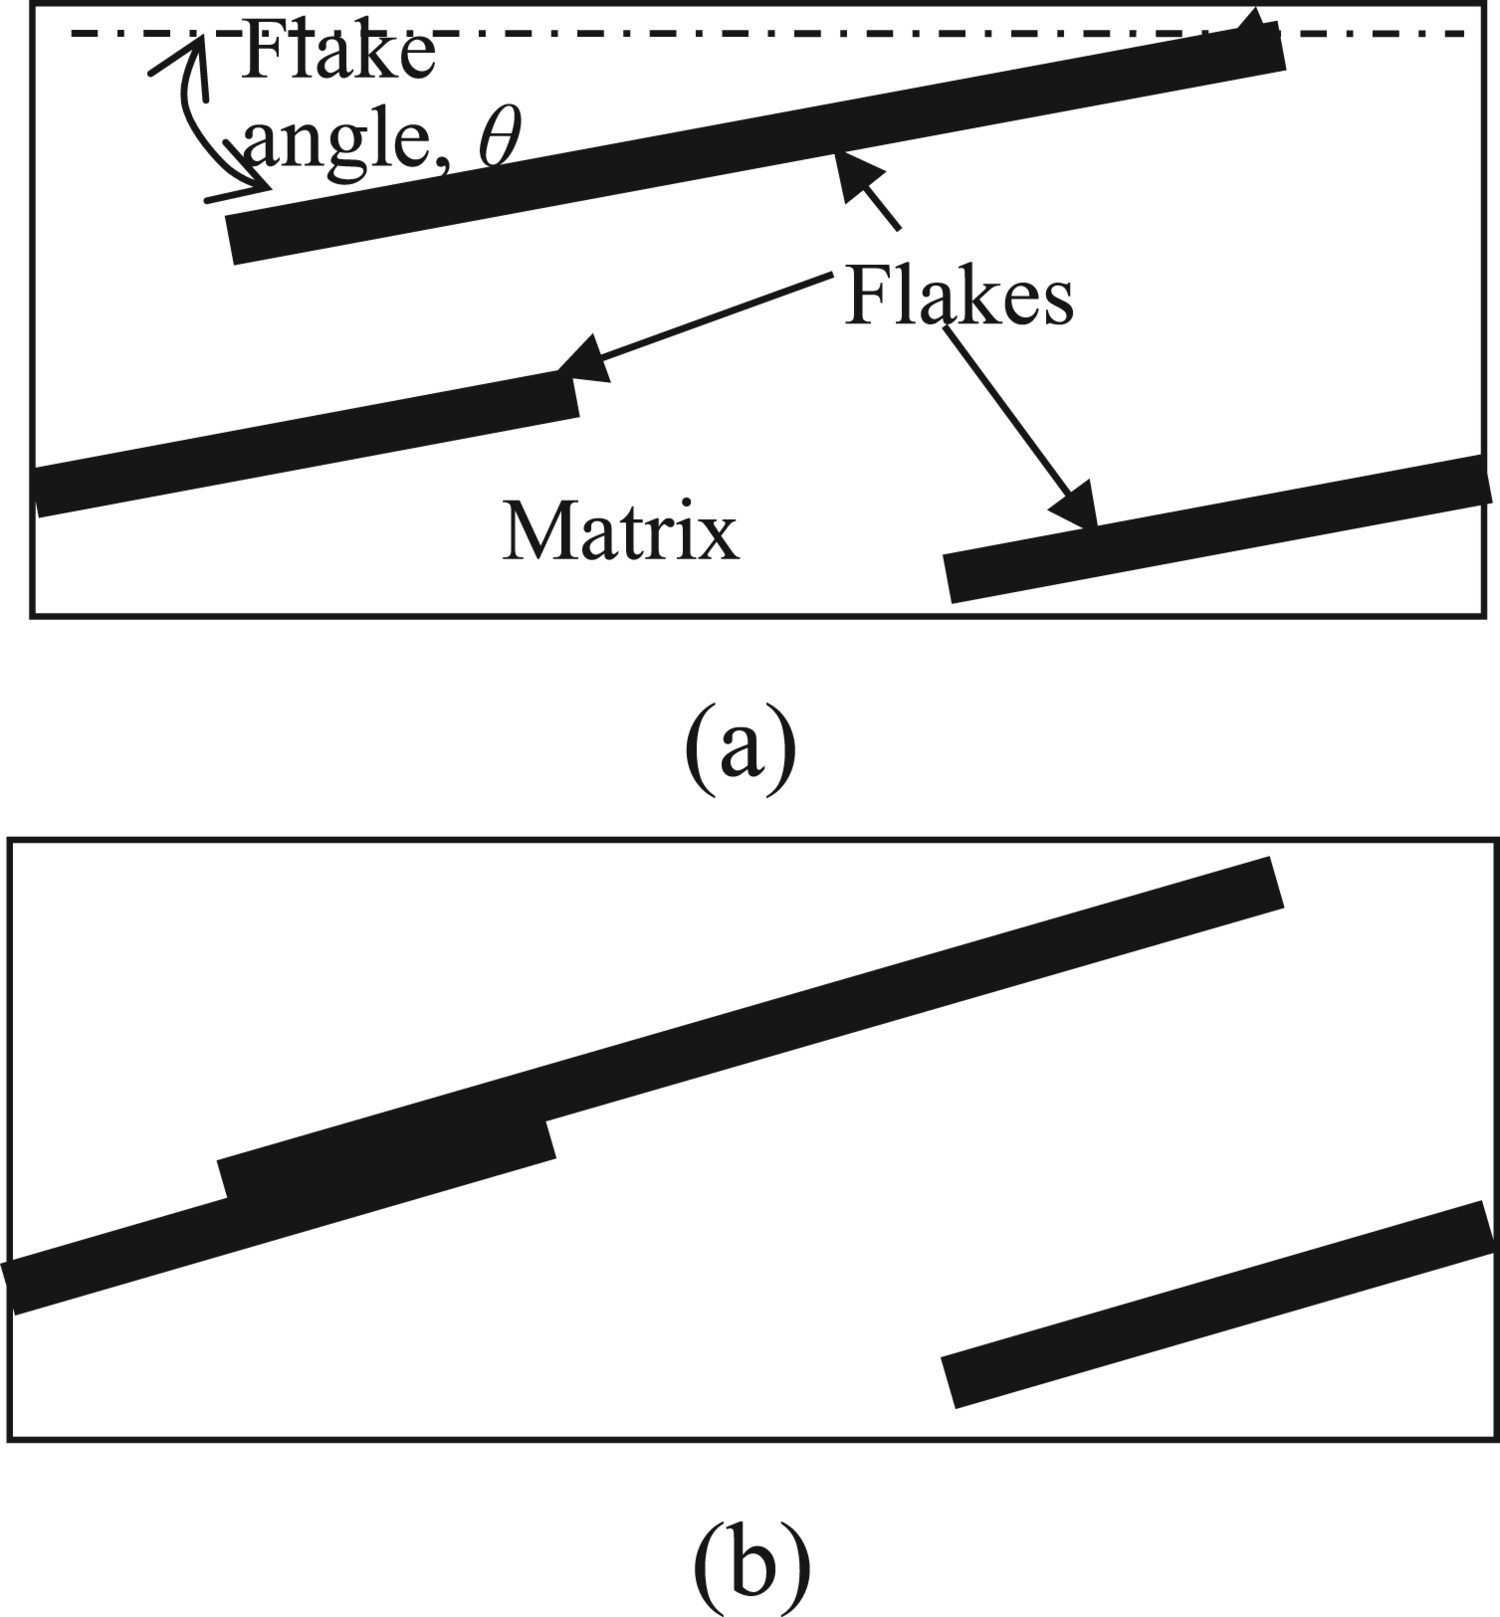
Flake orientations for α = 25.
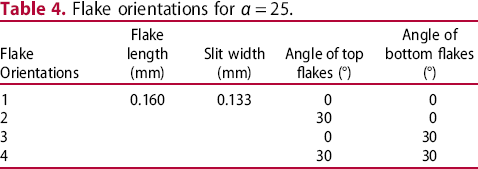
The flakes are also assumed to be angled in the same orientation up to an angle where the top and bottom adjacent flakes start to overlap, as shown in Figure 5(b). The point at which this happens is dependent on the length of the flakes.
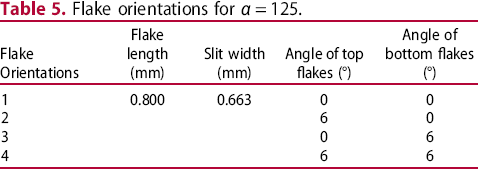
Flake orientations for α = 125.
The barrier property of the model nanocomposites is defined by D 0/D ff, which is a ratio of diffusivity of an unfilled matrix, D 0, to the diffusivity of a filled matrix, D ff. A larger value corresponds to a greater barrier performance, hence, a lower diffusivity, of the nanocomposite.
Results and discussion
Comparison with 2D analytical model
The diffusion predictions, D 0/D ff, of 2D FE models are compared with analytical calculations of Minelli, Dondero, Cussler and Nielsen, as shown in Figure 6. In comparison with Minelli, they correlate very well over the range of aspect ratios from 66 to 500, and the volumetric loadings from 1.9 to 4.8%. The Dondero predictions also match the trends, but under-predicts the diffusion barrier, of the FE predictions. The remaining analytical solutions – based on Cussler and Nielsen – do not correlate as well with the FE results.
Comparison between 2D FEA and several analytical D 0/D ff.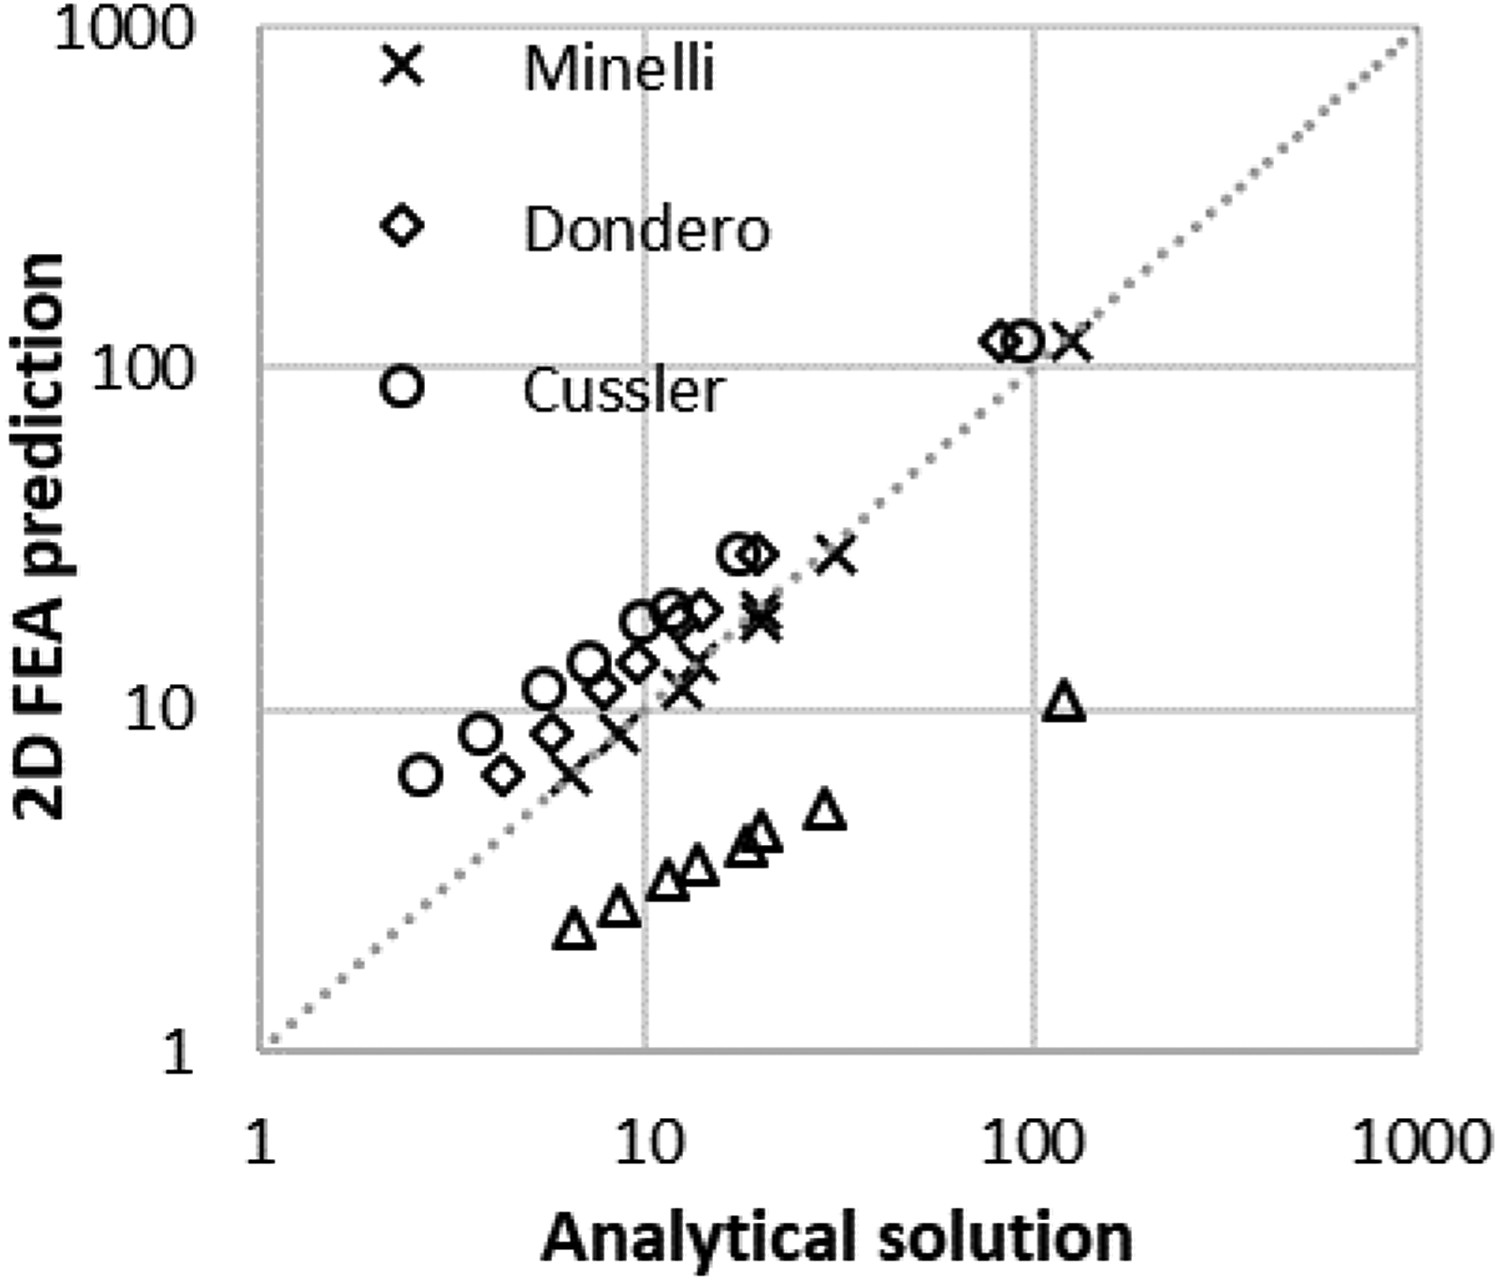
The trends observed for the effects on D 0/D ff, of different aspect ratios and volumetric loadings are shown in Figure 7. As expected, larger flake aspect ratios and volumetric loadings result in improved barrier performance of the matrix. While the two parameters both significantly affect D 0/D ff, it is often not feasible to have the volumetric loading at higher percentages due to greater difficulty in obtaining good dispersion of flakes in the matrix. It is more practical to have a smaller amount of flakes that have larger aspect ratios rather than larger amount of flakes that have smaller aspect ratios. For example, 1.9% loading of flakes having an aspect ratio of around 200 is as good as 4.8% loading of flakes and having an aspect ratio of 66.
2D FE-predicted D 0/D ff over the range of (a) flake volumetric loading (aspect ratio is fixed at 66) and (b) flake aspect ratio (flake volumetric loading is fixed at 1.9%).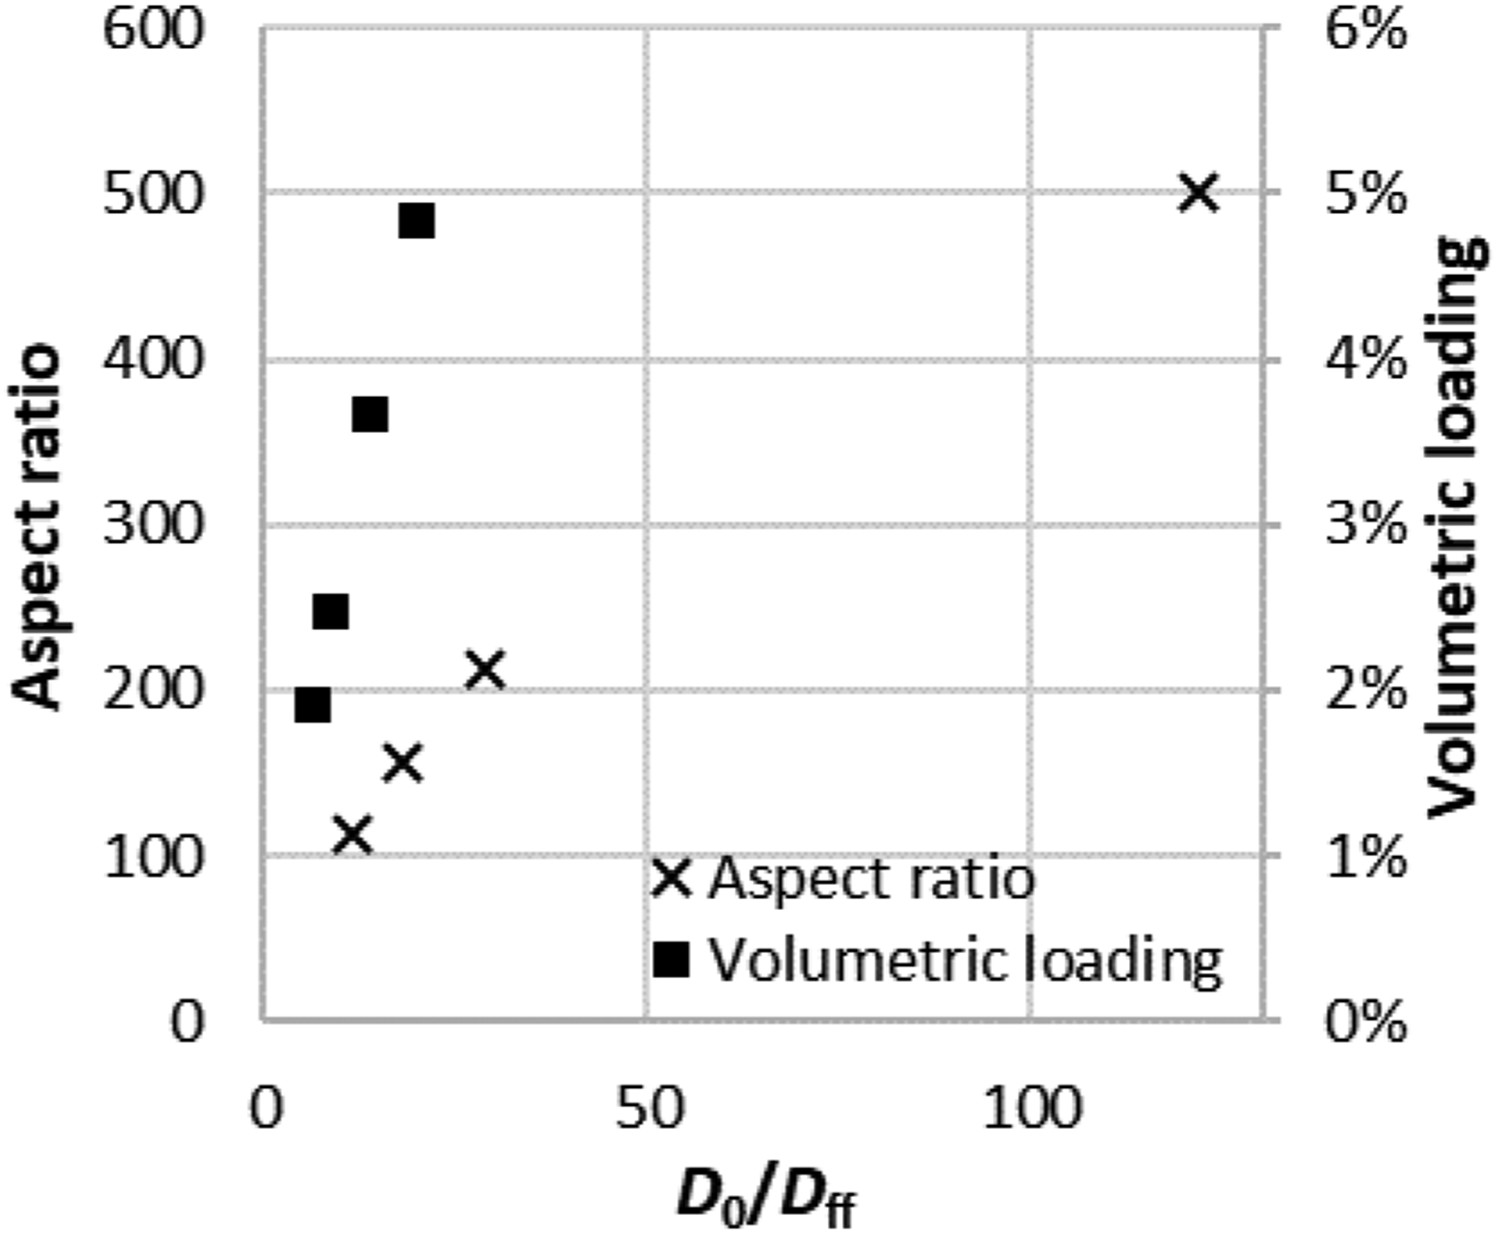
Comparison with 3D analytical model
Figure 8 shows a comparison between the 3D-2F FE model and Minelli's analytical model (defined by Equation (8)) for
2D and 3D numerical predictions compared with the Minelli analytical solution for uniform, ordered flakes (2-layers). ranging from 0.48 to 6.75%. Predictions for the equivalent 2D FE model are also shown for four selected
 = 1.82, 2.37, 3.51 and 4.62%.
The FE models closely correlate with the analytical model. As mentioned earlier, the analytical model was initially developed based on 2D models, before subsequently being applied to 3D models with modifications to the definition of the aspect ratio and slit shape. So, it can be observed that the 3D predictions are lower than the corresponding 2D predictions because of the consideration of flake separation (and hence, more diffusion pathways) in the z-direction.
In Figure 9(a), the 3D FE prediction of D 0/D ff is compared with the Minelli (ordered and random), Dondero and Cussler analytical solutions. Like the 2D models, the Minelli model (ordered) gives the best fit while the Dondero model follows the trend but underpredicts. This is similarly observed for the random solution by Minelli.
3D numerical predictions (2-layers) compared with: (a) Minelli, Dondero and Cussler analytical solutions; (b) Minelli analytical solution for ordered and random flakes.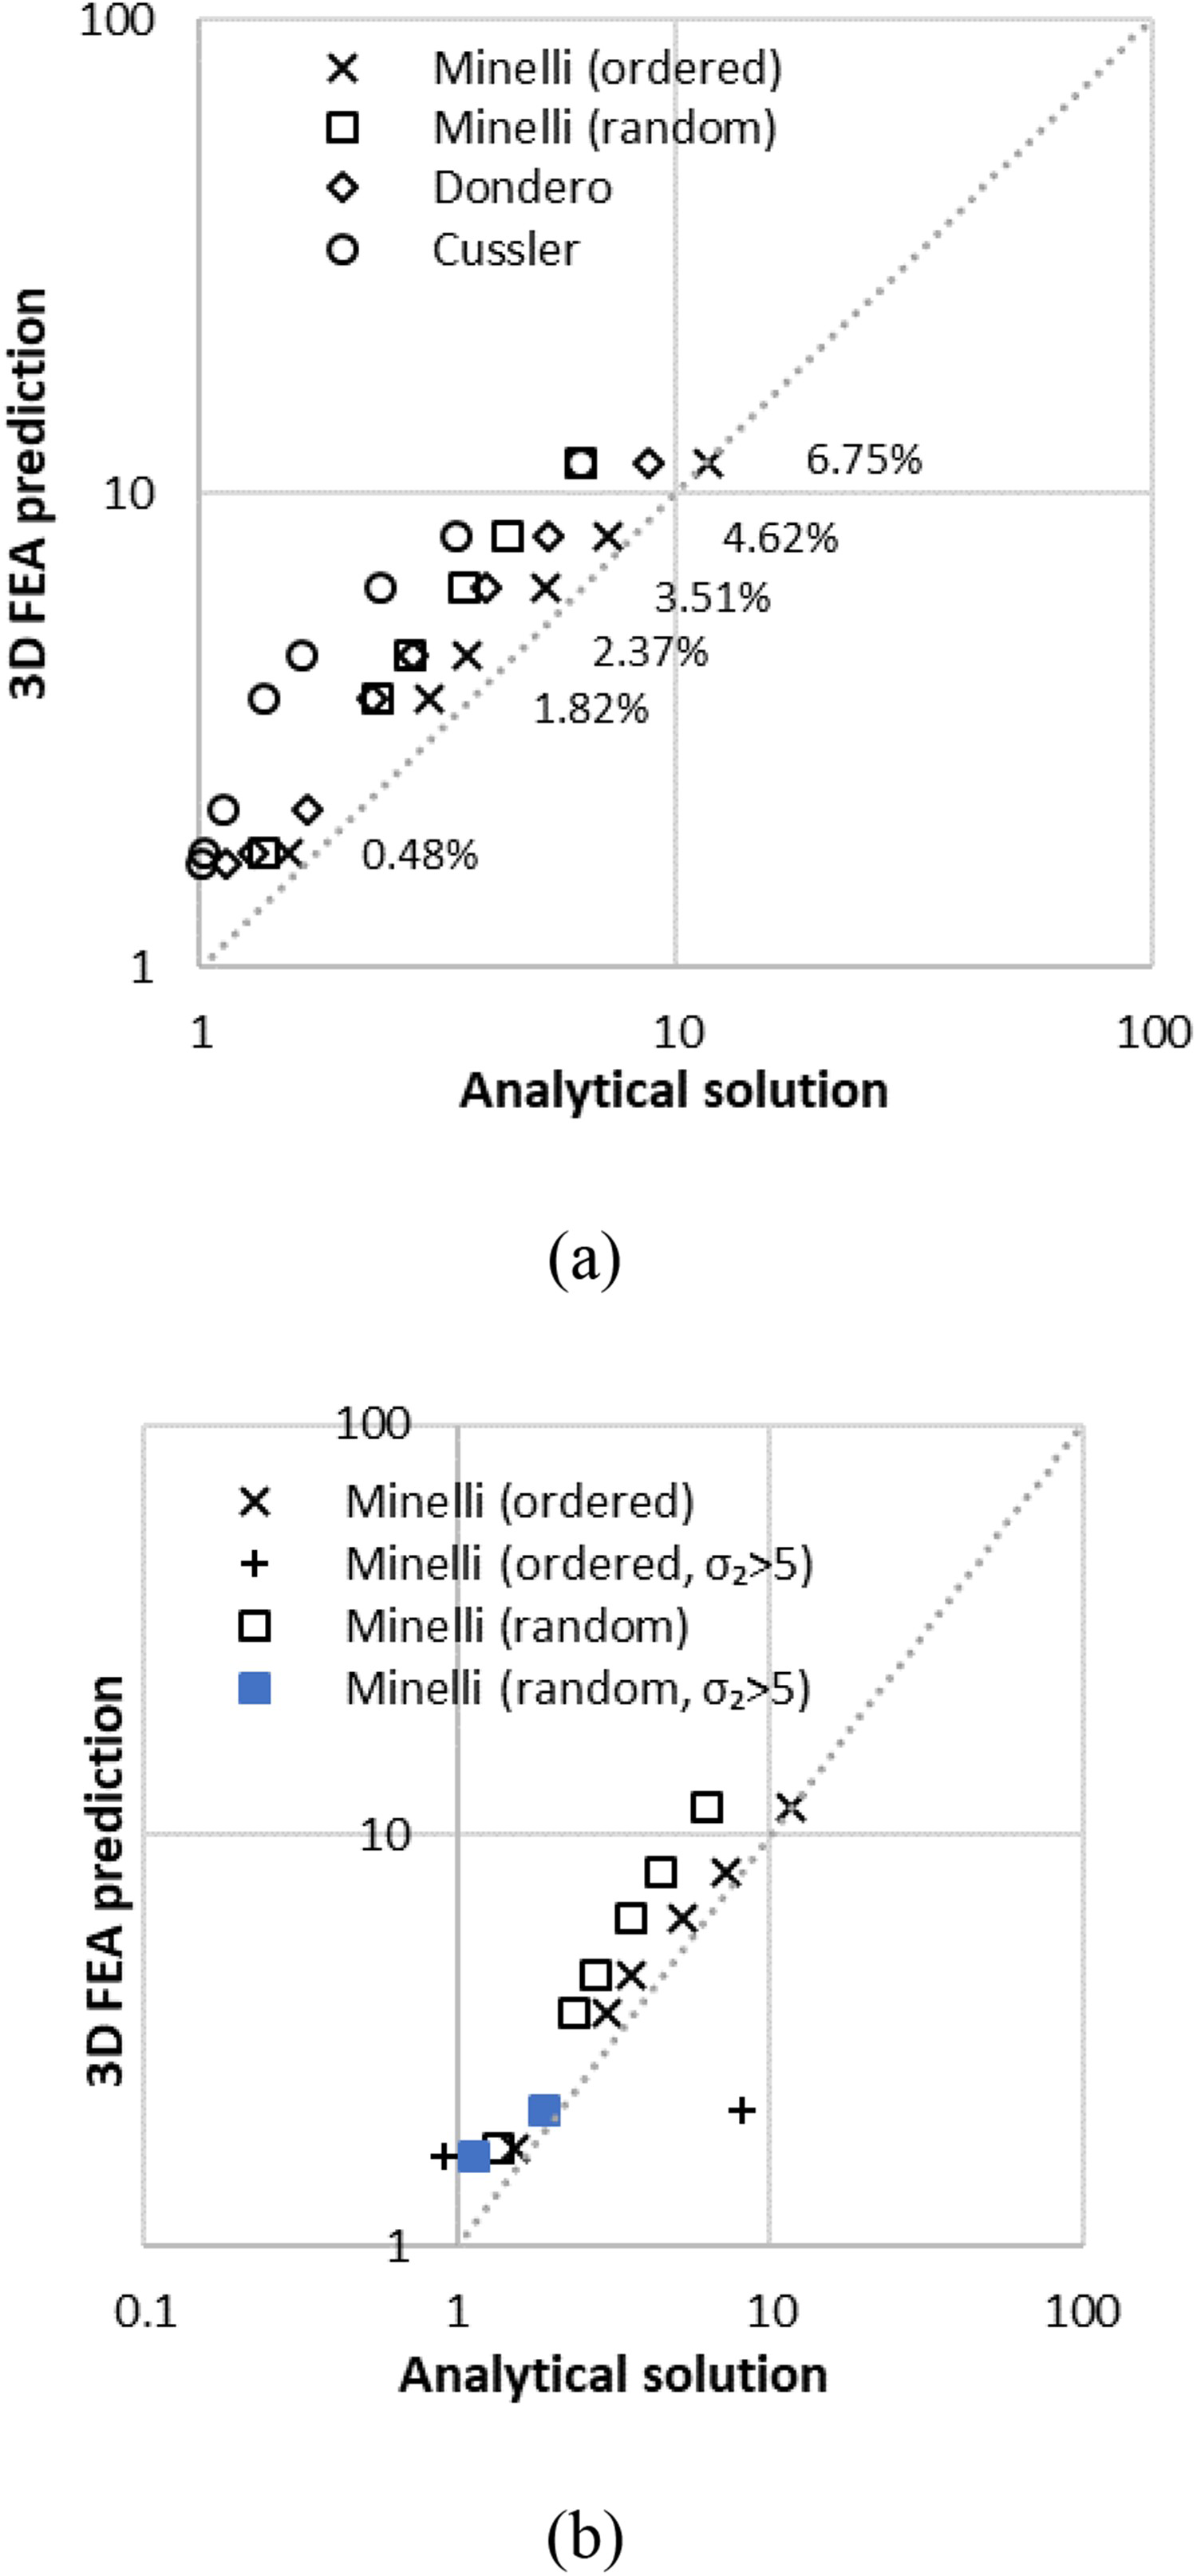
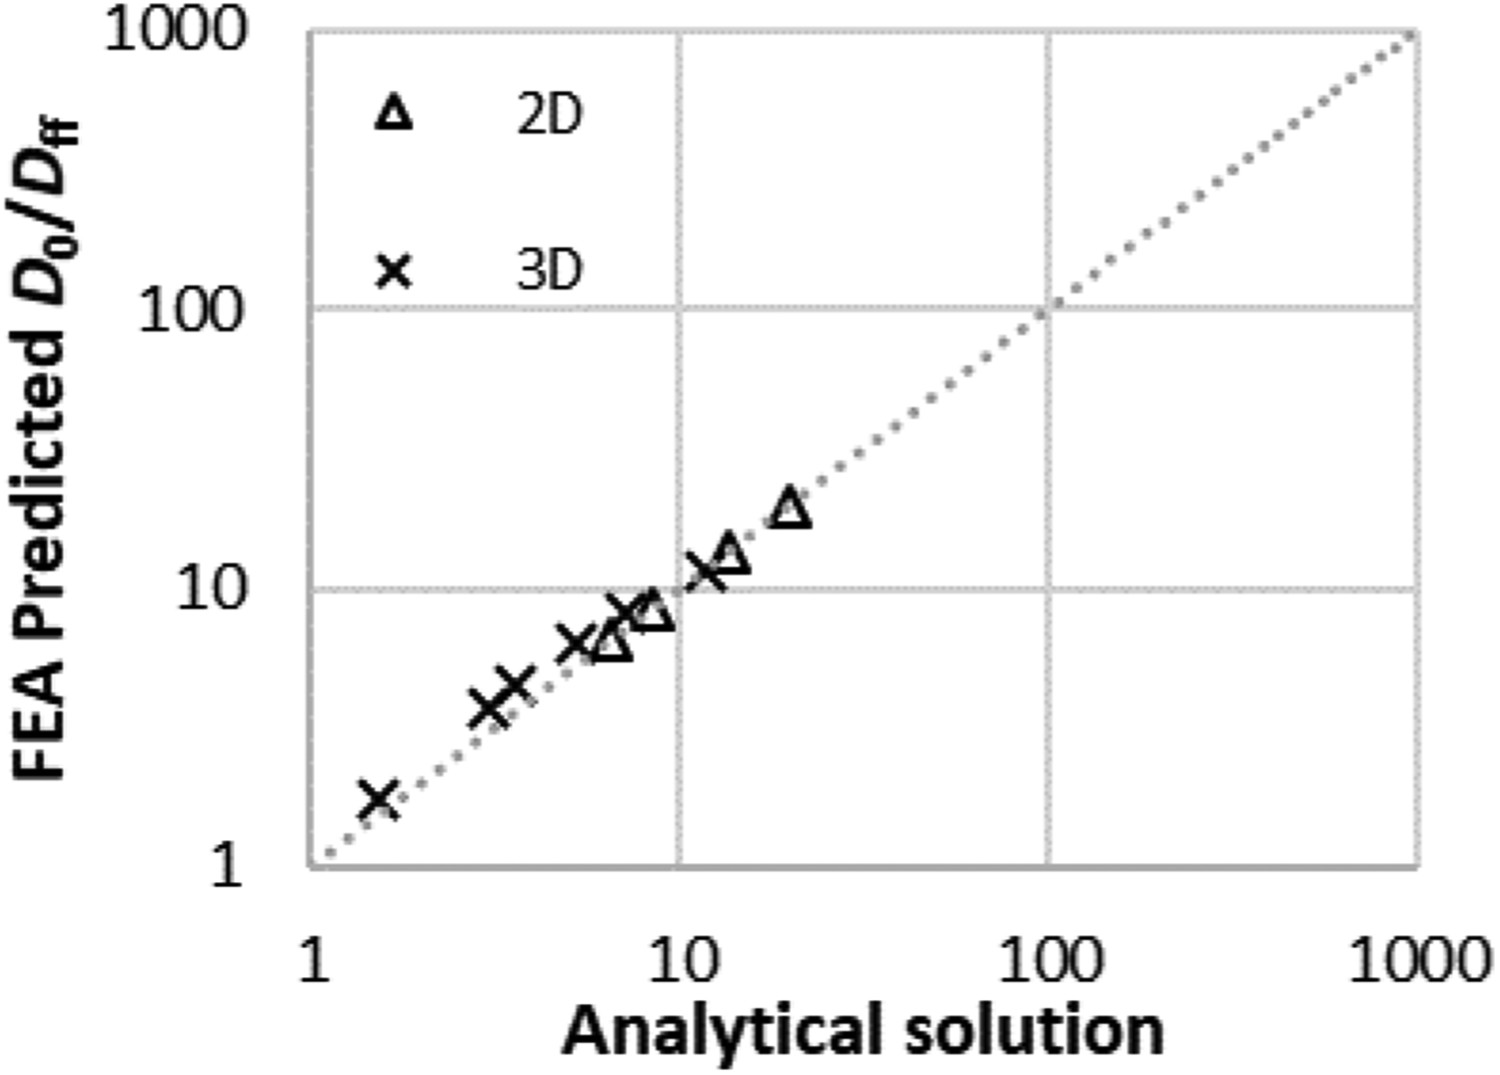
Figure 9(b) shows a comparison of the 3D FE predictions with only the Minelli analytical model, which has been proven to produce the best fit. The comparison also includes unit cells with
 > 5, which are beyond the limits of the Minelli analytical model and hence, not unexpectedly, do not match well with the FE predictions.
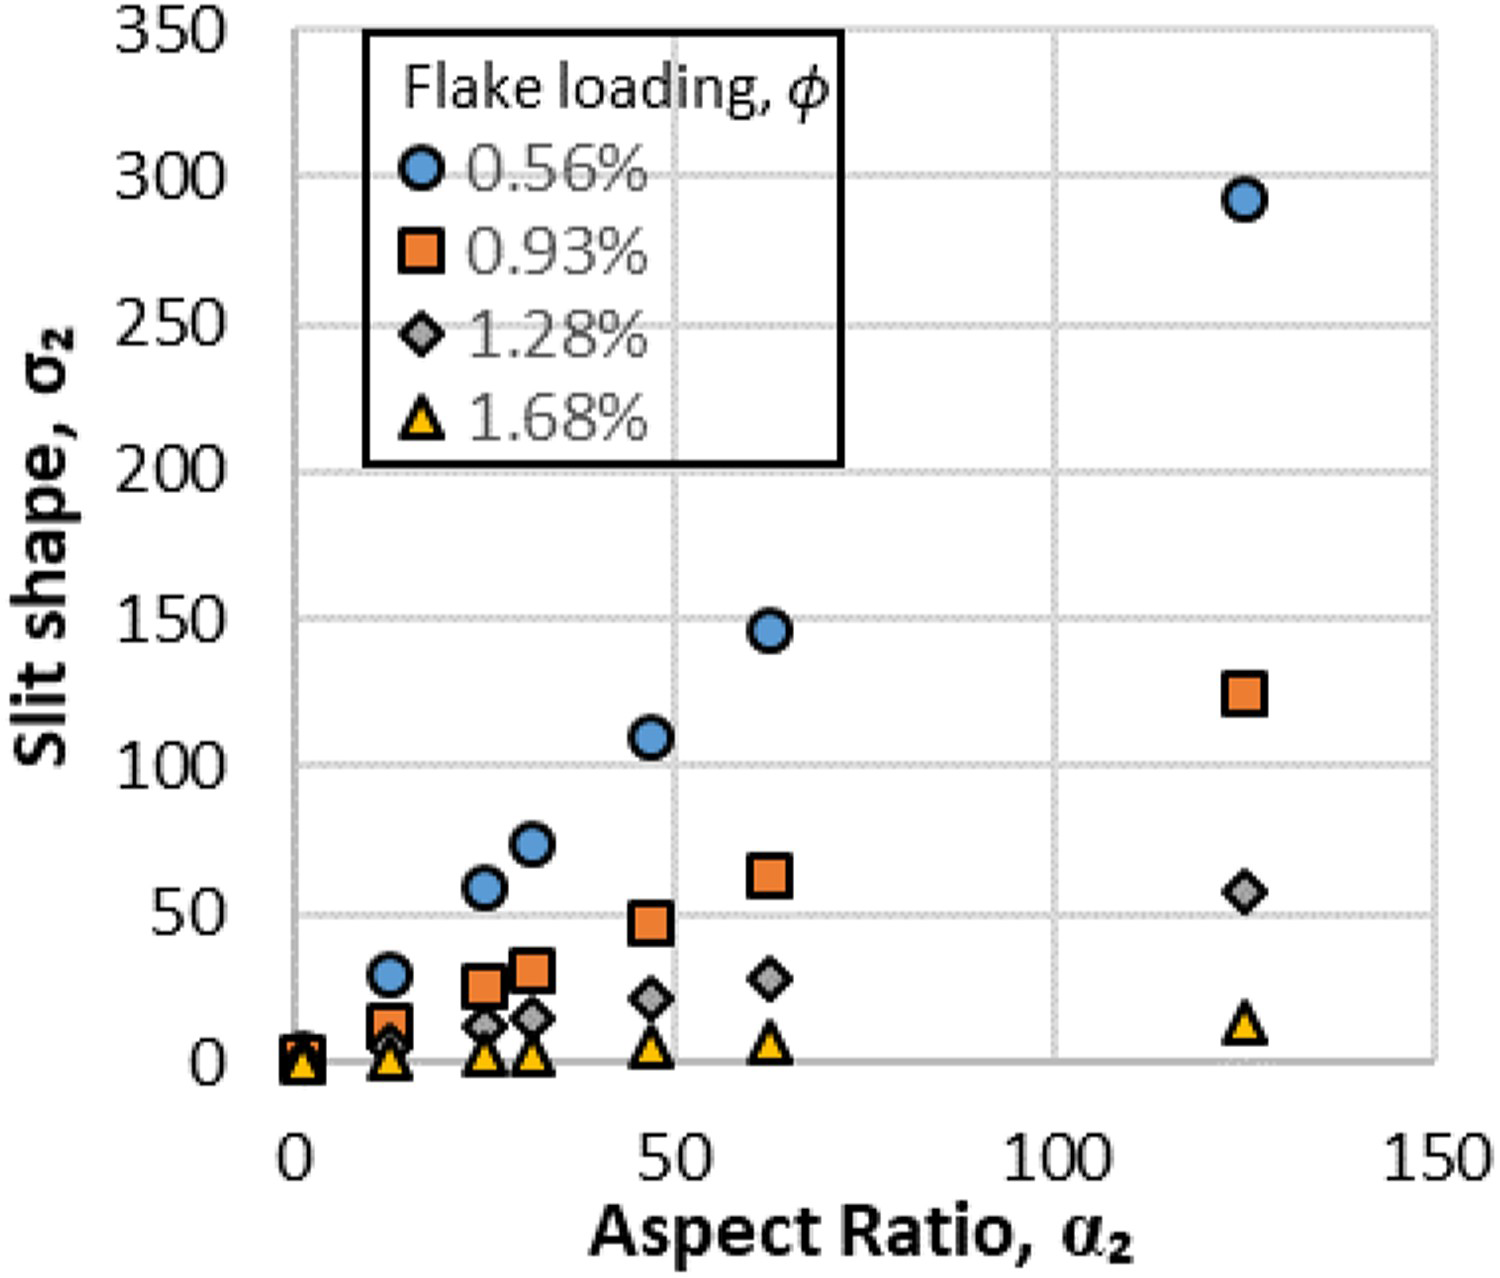
The limitation of the Minelli model with respect to slit shape, is apparent for flakes with high aspect ratios, used at low loadings. Graphene is one such example, because the flakes can have high aspect ratios, therefore less than 0.5% loading can be sufficient to give barrier improvements. Based on Figure 10, for a range of flake aspect ratios up to 125, the slit shape would be well above the range of the Minelli model (i.e. 0.5 >
Relationship between slit shape and aspect ratio for a range of flake loadings. > 5).
> 5).
However, the Minelli model for random flakes neglects the contribution of slit shape and gives predictions that are significantly closer to the 3D predictions for higher
 (see Figure 9(b)). Meanwhile, the random flakes model underpredicts significantly for lower
 . This means that the slit shape parameter is more crucial at lower values; but contributes less to the diffusion resistance when large enough.
Comparison with experimental measurements
The experimental measurements by Liu and Cussler [16] are compared with FE and analytical predictions in Figure 11. As mentioned in their study, the experimental measurement of permeabilities is estimated to be within about 10% accuracy. Consistent with the experiments which is based on a single layer of flake, the 2D and 3D-1F FE models are analysed.
Numerical predictions (2D and 3D, from this study) compared with experimental results (from Liu and Cussler).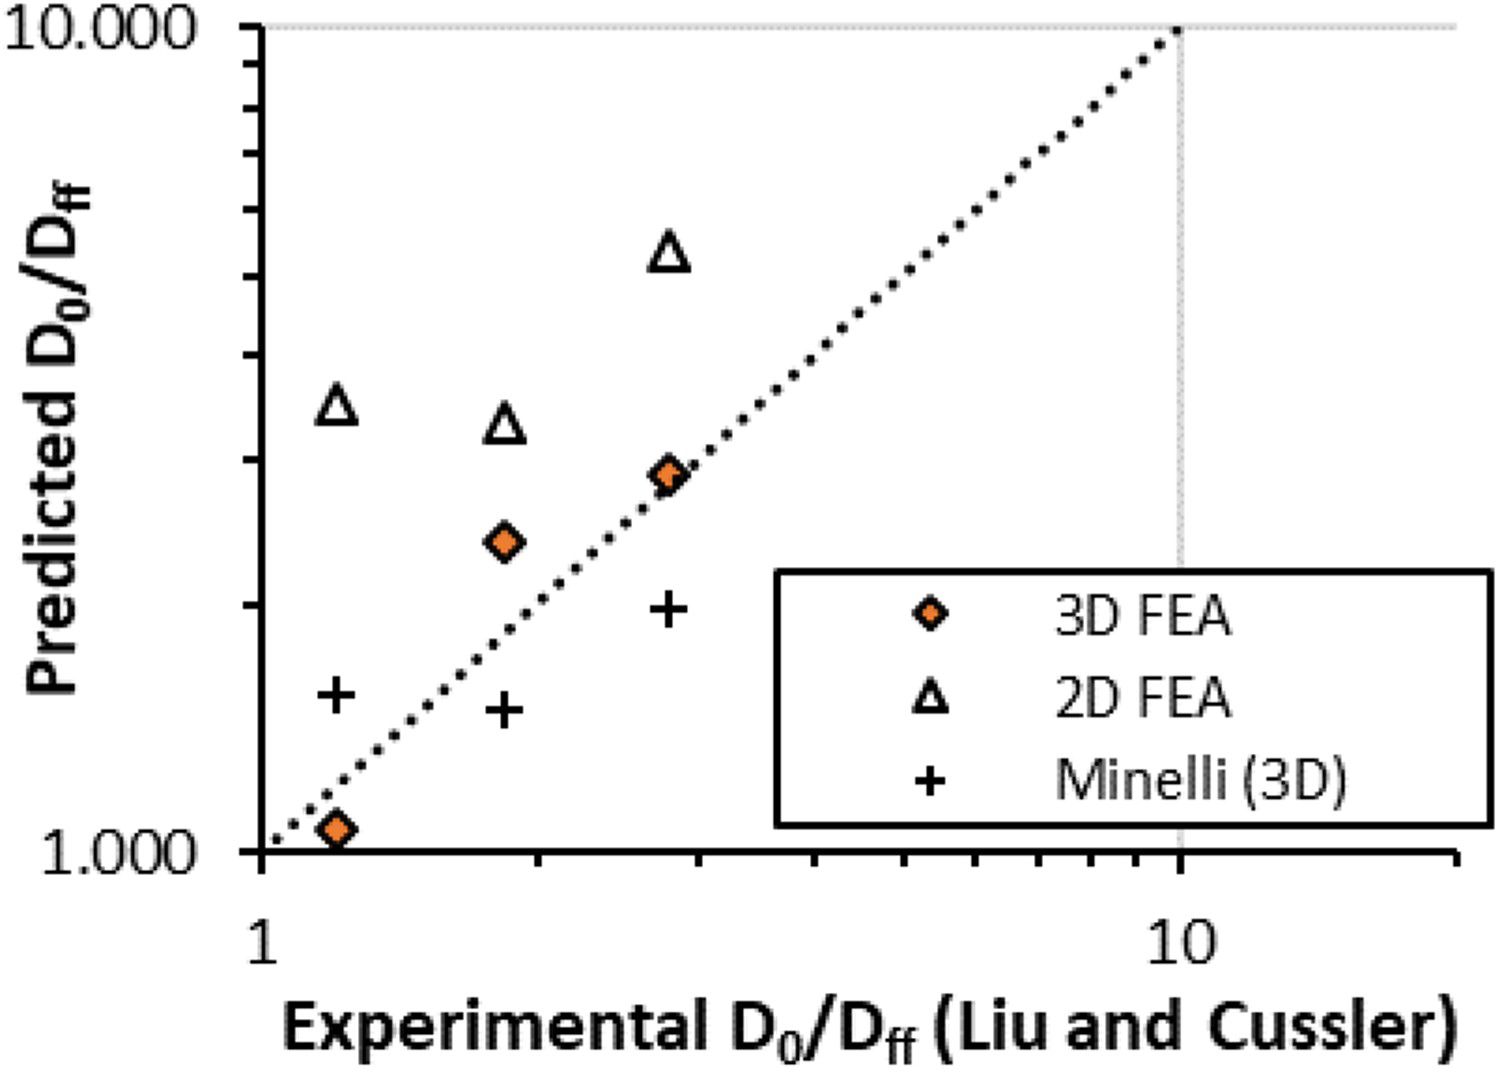
Based on the comparison, the FE models correlate well with the experimental measurements within an average difference of 14.4%, and predicts a similar trend to the experiment. This is followed by the Minelli ordered analytical model, which is within an average difference of 25.4%. Meanwhile, the 2D model significantly overpredicts, emphasising the need for 3D models that better represent the real-life flake arrangement.
Effects of flake content, thickness and shape ratio
The predicted D 0/D ff for flakes of different shape ratio, thickness and content are shown in Figure 12 using 3D-1F models. For 0.05 and 0.10 wt-% flake loading, and the same flake thickness, t, D 0/D ff increases (i.e. barrier performance improves) with increasing shape ratio (from 0.3 to 1). Square flakes (shape ratio = 1) are more effective in increasing D 0/D ff of the nanocomposite compared to rectangular flakes (shape ratio = 0.3 and 0.5). This is because of a greater area of effective barrier coverage.
Numerical predictions of D 0/D ff for different filler percentage, flake thickness and flake shape ratio.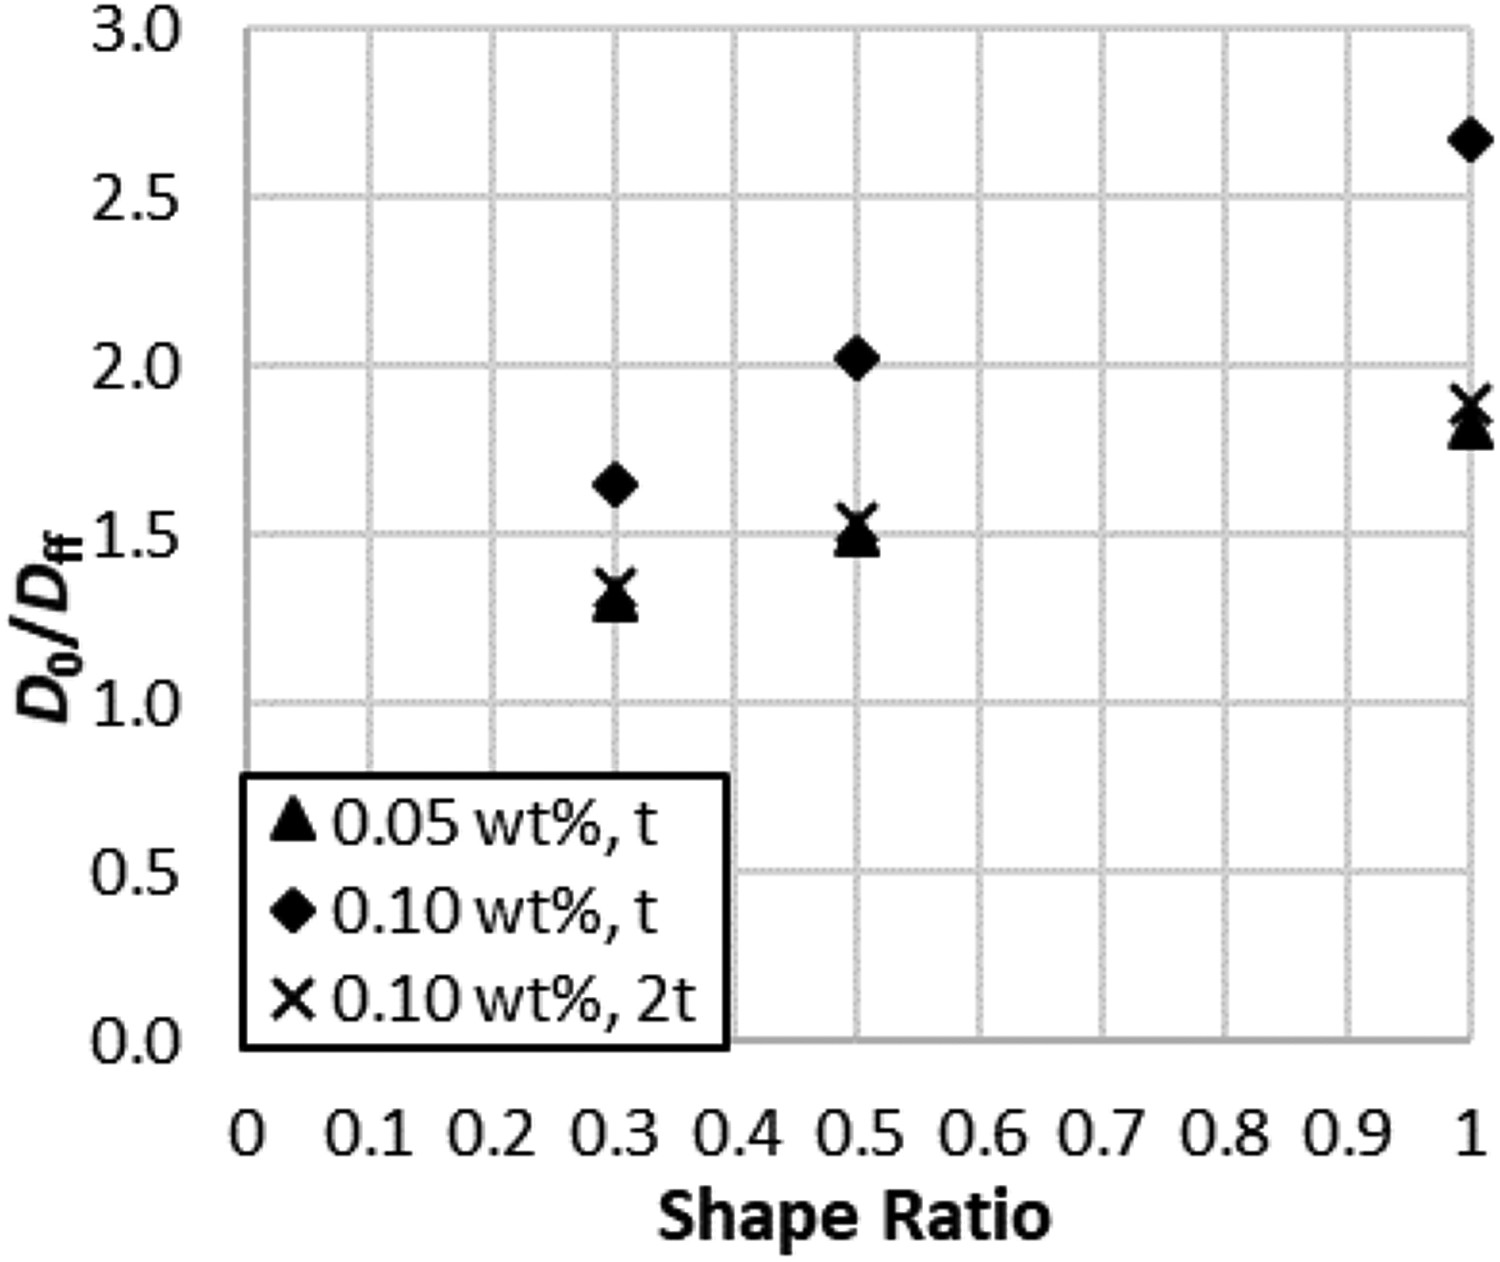
Higher flake loadings also give higher D 0/D ff because there is a larger quantity of flakes providing barrier to the permeants. Doubling the amount of flakes from 0.05 to 0.10 wt-%, the predicted D 0/D ff increases by 25, 35 and 47%, respectively, for shape ratios 0.3, 0.5 and 1.
The influence of thickness on D 0/D ff is shown to be very significant. Results in this study show that 0.05wt-% fillers of single thickness flakes, t, is comparable to 0.10 wt-% fillers of double thickness flakes, 2t. The implication of this is that while some experiments might attempt to increase D 0/D ff of an epoxy by using higher percentages of fillers, the outcome may not be favourable due to flake stacking, or even agglomeration that increases the overall flake thickness. This then, may result in a reversal of barrier improvement because of thicker flakes (hence also, lower aspect ratio).
Therefore, to optimise the use of nanoflakes like graphene as a barrier enhancer, the flakes need to be thin and also not elongated (preferably with shape ratio close to 1). This results in a flake with large aspect ratio, thus affording maximum area of coverage. Thereafter, the percentage of fillers can then be adjusted to achieve the required barrier.
Effects of flake aspect ratio and orientation
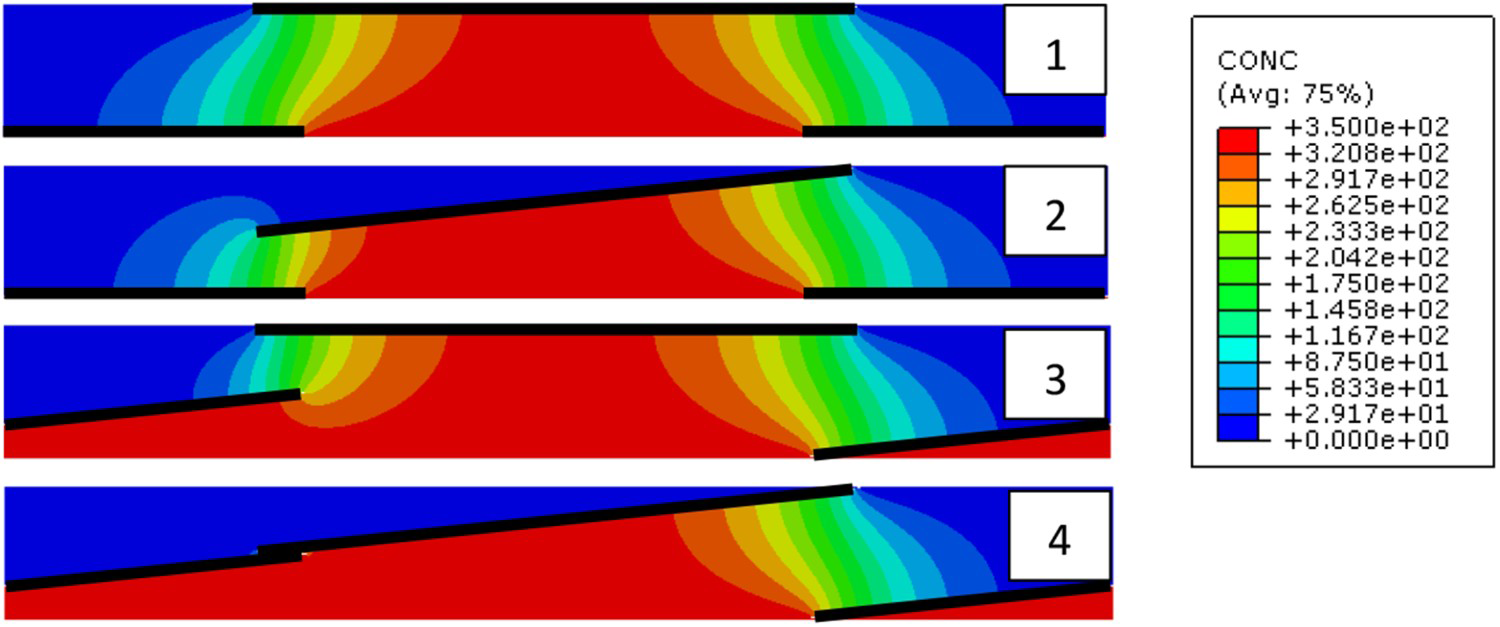
Figure 13 shows the cross-sectional concentration distribution as predicted by 3D-2F models with four different combinations of flake orientations; these are referred to as Flake Orientations 1–4. The aspect ratio of flakes is 25. By comparison, in Figure 14, the concentration distribution is for an aspect ratio of 125.
Concentration distribution for different flake angles (Flake Orientations 1–4); aspect ratio = 25. Concentration distribution for different flake angles (Flake Orientations 1–4); flake aspect ratio = 125.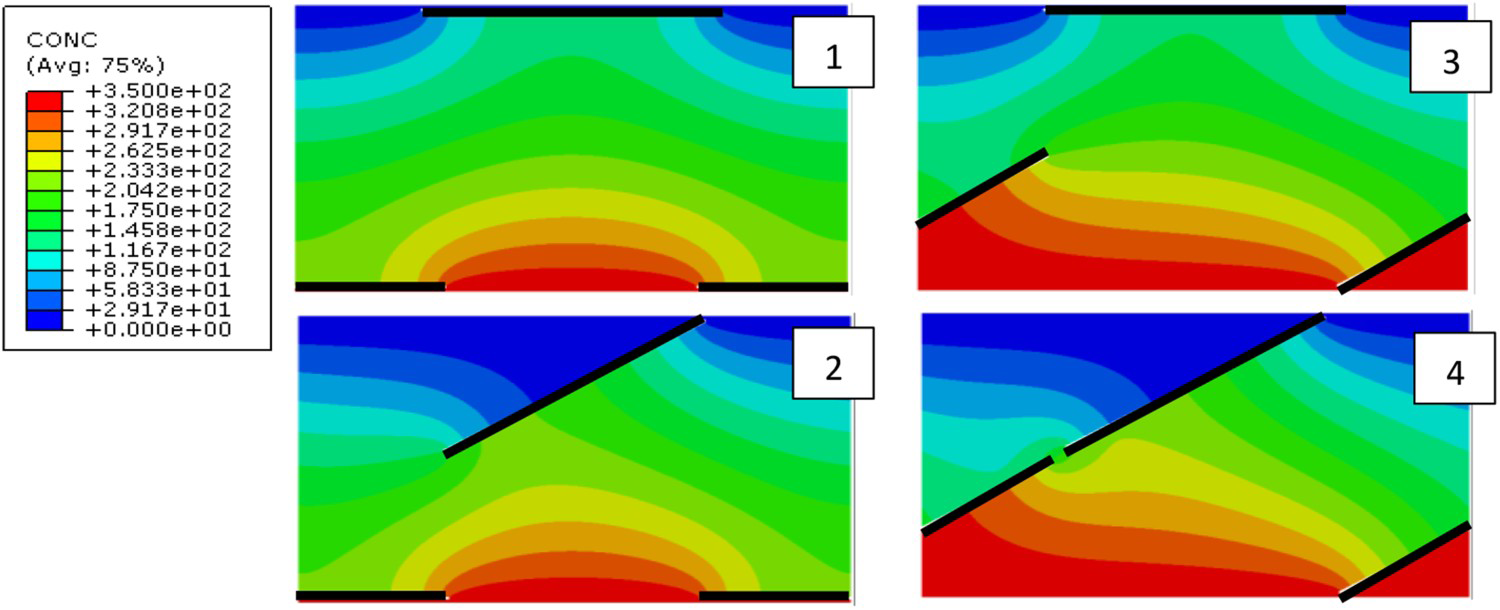
The predicted barrier performance D 0 /D ff for Flake Orientations 1–4 of 25 and 125 flake aspect ratios is shown in Figure 15. Overall, the higher aspect ratio gives a higher barrier. For aspect ratio 125, D 0 /D ff varies between 2.14 and 2.62, while for aspect ratio 25 it is between 1.54 and 1.66.
Barrier performance (D 0/D ff) of Flake Orientations 1–4 for aspect ratios of 25 and 125.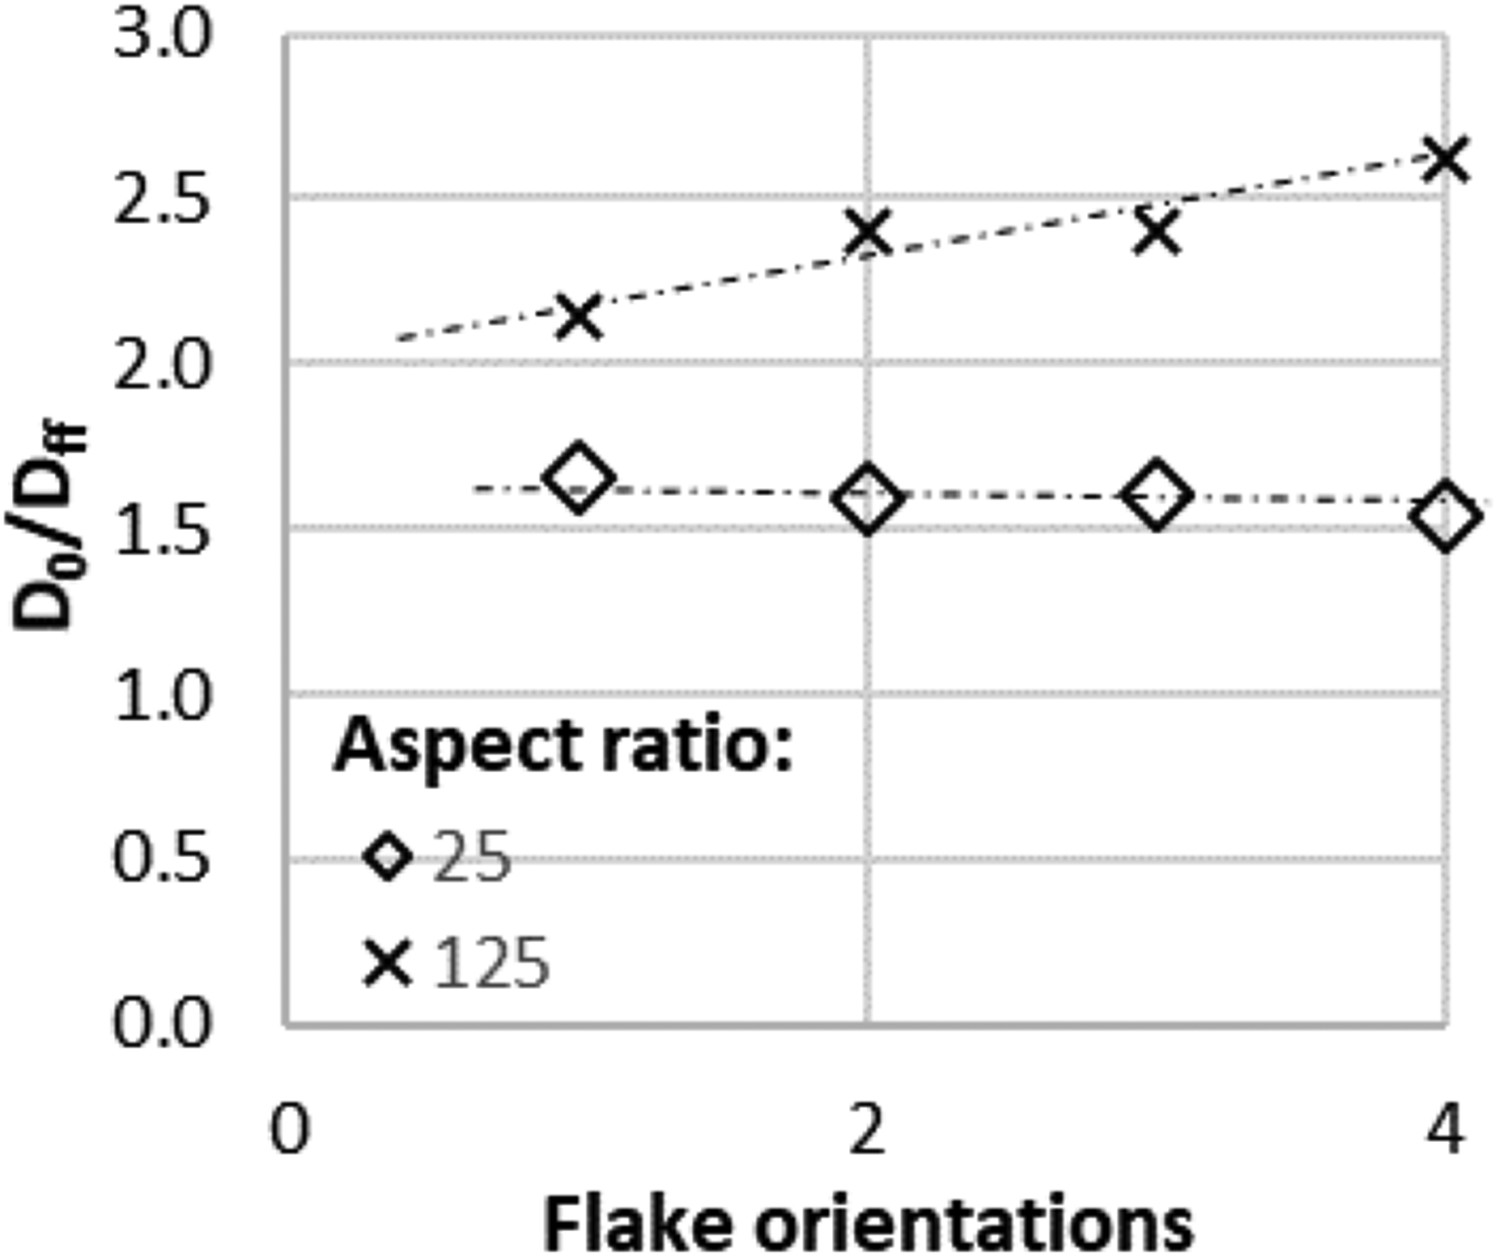
It can be observed that for a higher aspect ratio, the predicted D 0 /D ff increases with the presence of angled flakes. The highest barrier property is for Flake Orientation 4 where the top and bottom layers of adjacent flakes come closest together, effectively combining two flakes into a single longer one, thus providing a longer path for the permeants.
This observation, however, is different for flakes with the lower aspect ratio. The predicted D 0 /D ff is not significantly different for all four combinations of flake angle. Moreover, at low flake aspect ratio, as the flakes approaches zero angle, permeants are forced to take the most tortuous path.
It is worth noting that the Dondero calculation (Equation (10)) for aspect ratio 25 gives D 0 /D ff between 1.35 and 1.47. which is within of the FE predictions. Meanwhile, for aspect ratio 125, Dondero gives D 0 /D ff between 4.16 and 4.21, significantly overpredicting the FE results. This is because Dondero is limited to aspect ratios 5 ≤ α ≤ 50.
Advantages of the FE models
In addition to giving greater accuracy in diffusion predictions, one main advantage of FE models is its applicability to flakes of large aspect ratios and slit shapes, unlike analytical models that have set limits. Minelli, for example, is limited only to aspect ratios 5 ≤ α ≤ 300 and slit shapes 0.5 ≤
 ≤ 5. Very low filler loading can also be modelled in FE, which is important for nanofillers like graphene where filler loading is very low and aspect ratios and slit shapes are significantly higher. FE models also give added flexibility to consider different combinations of angled flakes, allowing greater insight into the factors that affect the barrier performance of the composite.
Conclusions
A 2D numerical FE model has been developed and compared well with certain 2D analytical solutions. However, comparison with the 3D FE models show that the 3D predictions give lower diffusion predictions than the corresponding 2D predictions because of the consideration of more diffusion pathways in the z-direction. This is why the 3D models can give more accurate predictions.
Hence, two 3D FE models have been developed to predict permeation through a nanocomposite: 1F using a single barrier flake and 2F using two layers of flakes. The models were validated with experimental measurements on polymer membranes with titanium barrier flakes, which were tested for permeation of helium. FE predictions showed greater accuracy in predicting the actual diffusion compared to the analytical model.
The models were compared with several analytical models and found to be in good agreement with the Minelli model. However, it was also highlighted that Minelli's model is constrained to lower slit shapes, hence the advantage of 3D FE models for larger aspect ratio and lower loading content nanoflakes like graphene. In this case, the Minelli model for random flakes (instead of ordered flakes) gives predictions that are significantly closer to the 3D FE predictions. This shows that when the slit shape is large, it has a less significant influence on the barrier performance.
The FE models also demonstrated how a number of flake characteristics influence the barrier performance of the filled nanocomposite. As expected, high flake contents result in greater barrier behaviour to the nanocomposites because there is a larger quantity of fillers providing resistance to the path of the permeants. However, this is dependent on the overall flake thickness (fewer layers is more desirable) and flake shape ratio (square or circular is more desirable). Ideally, flakes with large aspect ratio, hence providing greater area of coverage, would maximise the effect of a certain flake content. So, it is important to ensure that the flakes are well dispersed in the matrix because in some instances, higher concentration of fillers could lead to stacking or agglomeration of flakes that would reduce the aspect ratio, thus the barrier performance of the nanocomposite.
The effect of flake angle was also investigated and found to be dependent on the flake aspect ratio. To enhance barrier performance, flakes with low aspect ratios need to be kept close to zero angle, while flakes with high aspect ratio can benefit greatly if they are angled so as to form a more tortuous path for the permeants.
Finally, it is noteworthy that the present work has demonstrated some of the wide range of parameters that can be investigated using FE models compared to analytical models. This includes large aspect ratios and very low filler loadings frequently seen in graphene nanocomposites, as well as flakes with different orientations.
Footnotes
Acknowledgements
Thanks are due to A. Y. L Leong of PETRONAS Research, and Dr. C. Mattevi and Professor E. S. Gutierrez of Imperial College London, for useful discussions.
Disclosure statement
No potential conflict of interest was reported by the author(s).