
Abstract
In the production of brake pad composites, a well-designed new composition formulation plays a key role in improving performance. The purpose of this study; was to investigate the effectiveness of a specifically developed formulation under brake-test conditions. The composition of the brake lining consists of 18 powder materials. As the friction adjuster, Petro-coke powder was used instead of Cashew, which is cheaper and more readily available. The wear tests were carried out in a special design test device simulated close to the real environment. The results obtained have been compared with commercial brake pads. The friction coefficient values decrease with increasing disc temperatures. Brake tests showed that as a friction modifier, petro-coke provided a more effective stabilizer for the friction coefficient and improved the specific wear rate. Also the study can be utilized effectively in determining the friction coefficient and the specific wear rate of designed brake composites.
Introduction
The kinematic energy generated during the movement of vehicles turns into thermal energy via friction between the disc and the pad during braking [1, 2]. The temperature increases during braking. In particular, the highest heat occurs between the brake pad and the disc [3, 4]. Brake pad materials are heterogeneous, having the diverse physical, mechanical, and chemical properties of their developed formulation [5]. The performance of the brake pad produced by creating a new composition cannot be estimated according to the physical and mechanical properties of the elements that make up the composition. Because there are many factors such as production methods and other conditions that affect the performance [6-9]. Brake composites are expected to have certain features. They should perform at different speeds, temperatures, pressures, and environmental conditions. They must provide a stable friction coefficient and a low wear rate and vibration characteristics under all conditions [10, 11]. In order to meet braking performance conditions, it is necessary to choose the elements that make up the composition and to determine the production conditions correctly [12, 13]. Supplements, fillers, and organic powders play an important role in determining the strength, hardness, thermal stability, wear, and friction properties of the brake pad. To this purpose, the tribological behaviour and physical and mechanical properties of brake composites are determined by the many friction materials that have been used in various ways, including various fibres and polymer matrices [14-16]. Brake pads composite ingredients are classified into four categories, modifiers, binder, fillers and friction modifiers [16]. With the development of automobile technology, the development of brake composites continues to increase due to the high performance, low cost, and availability of raw materials. For this reason, many brake composites with different features have been produced. Finding alternative materials is also important because resources are not unlimited [17, 18].
Several investigations have shown that another aspect influencing the tribological contact of friction systems is the wear debris on the contact plateaus between the disc and brake composite. This debris is reported to be primarily formed of tough, metallic fibres and coarse, hard particles that lead to the build-up of secondary plateaus from the compaction of the wear debris [19] formed on the primary plateaus [20-22], as shown in Figure 1.
Schematic of the contact situation between brake composite and disc, with plateaus.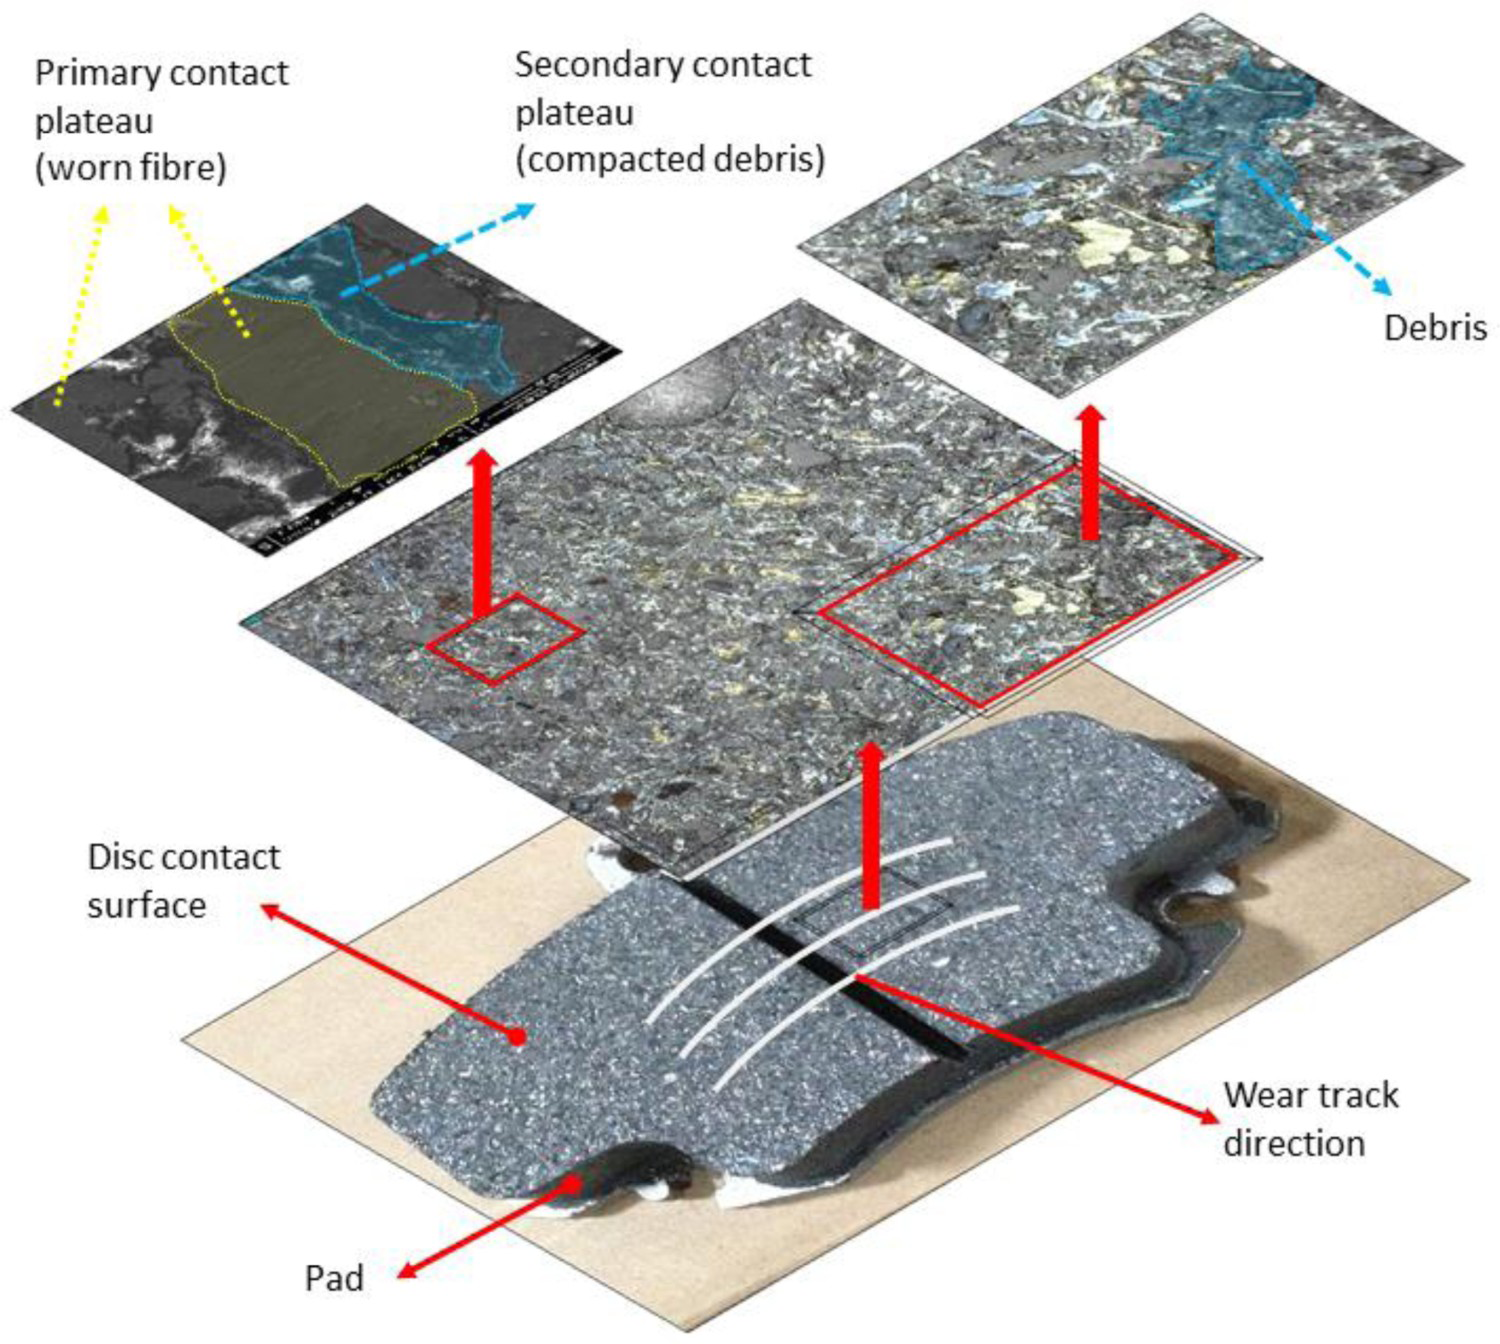
To effectively satisfy customer demands, brake pad manufacturers use friction materials to create novel formulations for brake composites that provide a steady friction coefficient and lower wear rates [23-25]. In creating these formulations, many experimental works have been conducted to investigate the role of ceramic [26], metallic [27], organic [28, 29], and inorganic [30] dusts on the formulation of brake composites in terms of high thermal stability, a stable friction coefficient, and higher wear resistance [31-33], along with good mechanical strength and improved fade resistance. Dong et al. [34] showed that lapinus fibres in the brake pad formulation led to higher fade resistance. Other studies [35, 36] focused on examining the friction morphology of brake composites and their wear mechanisms. Researchers have used scanning electron microscopy (SEM) micrographs to evaluate the microstructure of the worn surfaces on the brake composites where primary and secondary contact plateaus had occurred in the friction layer between brake composite and disc. Results of a literature survey indicated that current studies are not sufficient to meet the demands for developing the brake pad industry. Although the topics mentioned above have been widely researched, some points have not yet been addressed. Most of the studies in the literature have focused on simplified formulations composed of a reduced number of friction dust materials and simple experimental setup systems to determine the performance and the standard dimensions of the brake composites.
A novel friction-testing machine was employed to measure the performance of the brake composites by means of the values of friction and wear within the realistic dimensions of the brake composites. In addition, this new wear test device detects the friction coefficient, wear rate, and service life of the brake composites under different temperature conditions. It helps to obtain more accurate results as it performs these tests using real brake composite samples [37, 38]. The friction tester used in this study has capability of measurement of friction coefficient, specific wear rate; noise level (if it can be mounted to a stable apparatus). Also, this friction tester is computer controlled and supported by interactive with a SCADA analysis interface. Moreover, in survey of the works in literature [Refs. 18-20, 31], it will be seen that most of these type friction testing machines are not developed and neither simple such as pin-on-disc nor is commercial (chase type). In addition, most of these machines are used to test to the frictional characteristics of samples in small and standard dimensions. Furthermore, any correction factor was not used for calculating the friction coefficient. With this way, it can be said that this friction tester has high performance. The friction tester has been developed according to the SAE J-661 Standards.
In this article, unlike the studies in the literature, cheaper and more easily available friction adjuster Petrocoke powder was used instead of Cashew [39], which is widely used in general lining formulations. Thus, the production cost of the lining sample has been reduced to a certain extent. In addition, by using wollastonite powder that supports the function of Petrocoke, the friction coefficient has been kept stable at high temperatures [35]. When the studies in the literature are examined [34-36, 39, 40], the number of powders used in chemical lining compositions in most of the studies is between 6 and 10. However, it is not very realistic to produce real brake pad composite with these powder numbers. In addition, it will cause the desired braking performance and service life to be very low when used under real conditions of use or on a vehicle. One of the important points that distinguishes this study from the studies in the literature is that positive moulding process with gradual pressure pressing method was used in the manufacture of brake linings. A direct comparison of the designed brake composites with commercial brake composites was performed to demonstrate the role of the friction dusts used in the formulations, taking into consideration the tribological behaviour of friction and wear. In order to understand the contact phenomenon, the micrographs of the friction surfaces were analysed via SEM techniques. In conclusion, the designed brake composites produced more applicable and reliable results for the friction coefficient and specific wear rate.
Experimental details
Raw materials and the designed formulations
From the literature survey it was observed that formulations developed in the production of brake composites are generally similar in terms of common raw materials. In this study, two types of brake composites were compared and were utilised to investigate the effect of tribological contact during brake tests. The formulations for the first type, commercial brake composites, were not completely known. However, it was speculated that they included raw materials such as reinforcing fibres (32%), binders (9%), fillers (45%), friction modifiers (4%), lubricants (especially 9% dust graphite), and abrasives (4%). Moreover, unlike all the other raw materials, the filler dust contained 5% graphite granules. The second type included the formulations of the designed eco-friendly brake composites, whose relative percentages (wt. %) are presented in Table 1. The table presents the raw materials consisting of five groups including friction dusts as reinforcements, fillers, binders, friction modifiers, and abrasives. The raw materials were homogeneously mixed using a 5-kg capacity mechanical mixer for a period of 20 min before transferring them to a mould. Positive moulding method was used in the moulding process. In the positive moulding method, pressure is applied directly to the composite material. The purpose of gradual pressure pressing is to eliminate the air or gas gaps that occur when compressing the composite material. In this method, the gas and air are discharged with low pressure first, and then the desired density is reached by the compression process at the second pressure. The friction dusts were then prepared by hot-press moulding at a pressure of 150 kg cm−2 and a temperature of 180°C at intervals of 6 min open-close time as shown in Figure 2. The pure-curing process was applied at a temperature of 150°C for the following 7.5 h. The composites were finally polished using a polisher-grinder to obtain the finished brake composites.
Fabrication of the designed brake composites. Designed brake pad formulation.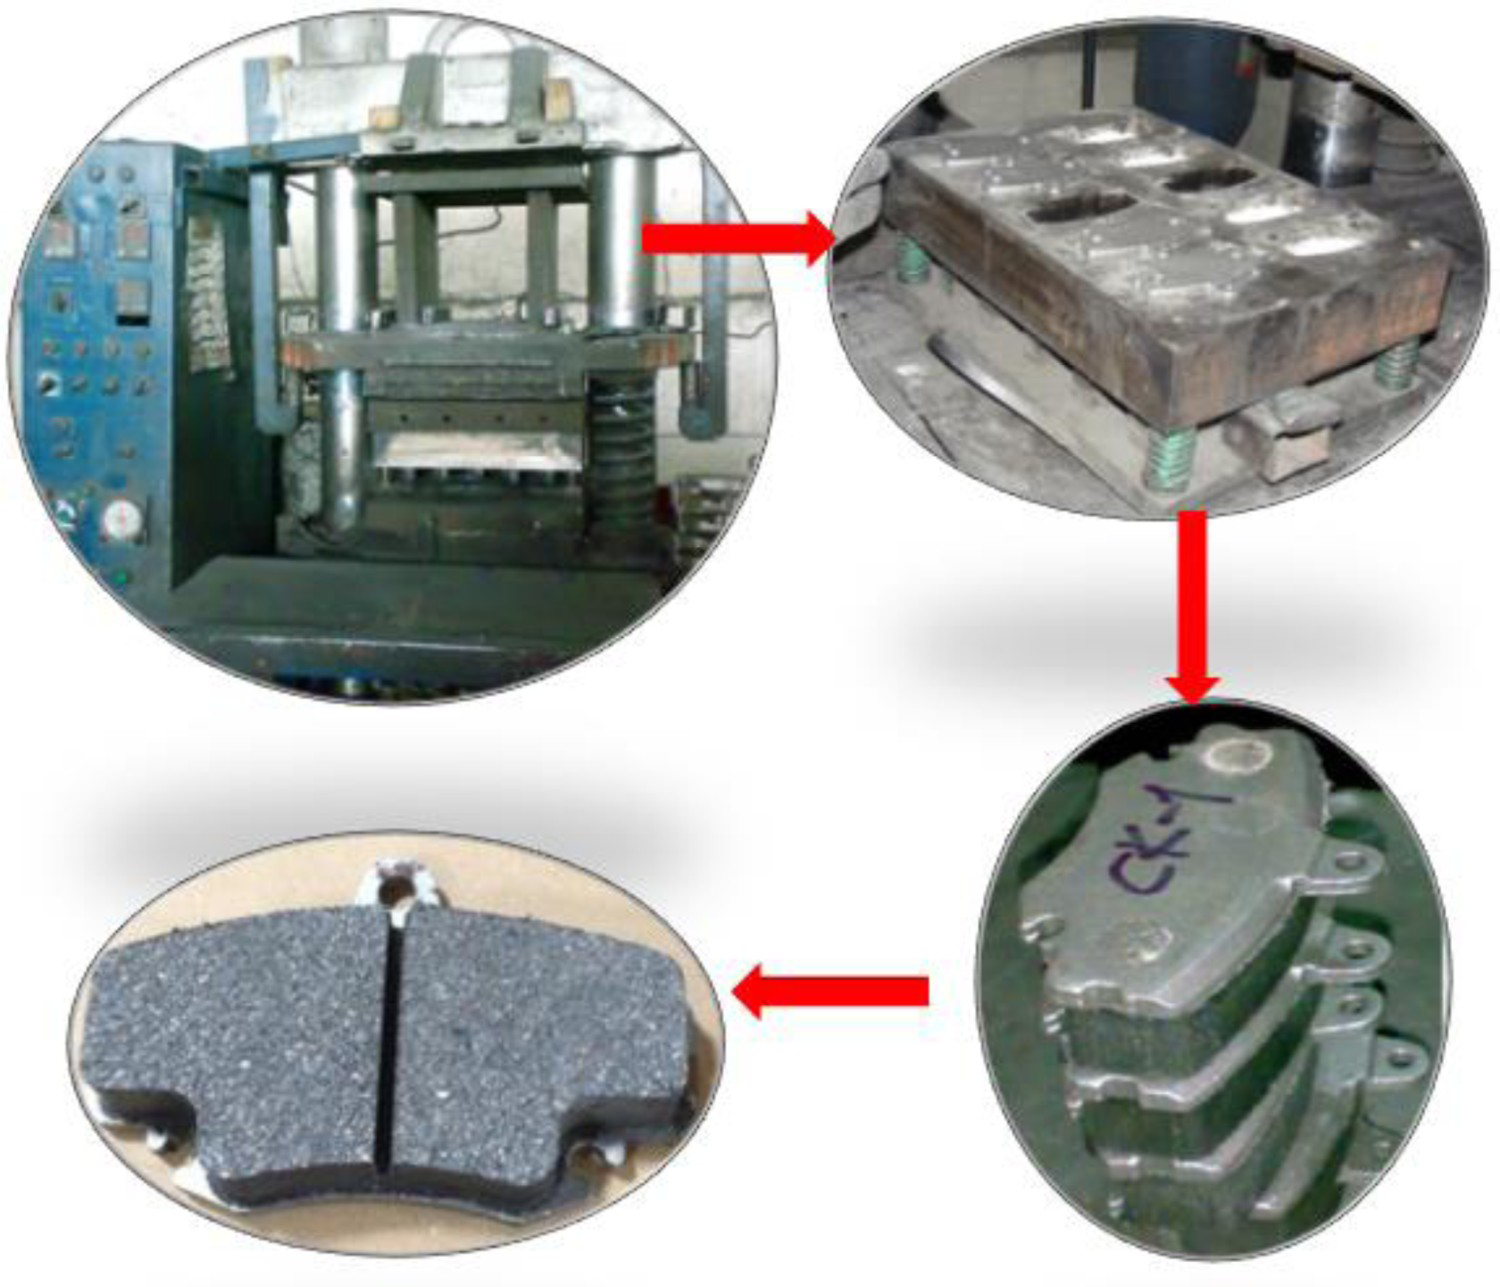
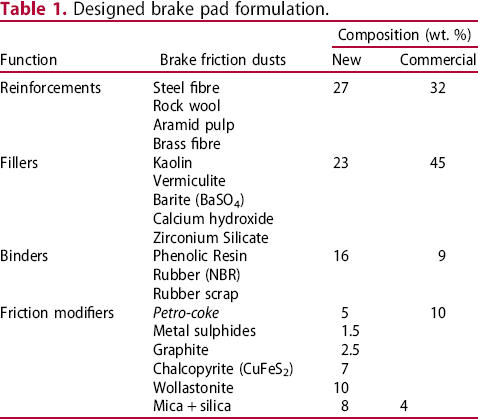
The roles of some friction dusts used in the brake composites given in Table 1 and their importance are explained below. In the evaluation of the tribological contact of the designed brake composites, petro-coke dust in particular among the friction modifiers played a key role. Petro-coke improves friction stability and increases frictional performance. Steel fibre, rock wool, and aramid fibre provide thermal resistance. Barite is stable at high temperatures and may aid in wear resistance. Kaolin is effective on elasticity and strength as dust material for brake composites. Vermiculite acts as a noise isolator by increasing interior porosity when heated. Wollastonite is a good friction stabiliser. Rubber (NBR) decreases the glass-to-rubber transition and the fracture of the resin. Rubber scrap is used to prevent noise. Metal sulphides are effective lubricants on friction surfaces under sliding conditions. Mica and silica help maintain friction films and abrasive dust build-up, thus keeping the bonding surfaces clean. Zirconium silicate increases the friction coefficient and calcium hydroxide is used to avoid corrosion in Fe additives. In this study, petro-coke dust was accepted as the reference friction material in the investigation of the tribological contact in the designed brake composites.
Frictional testing
Frictional testing was applied using a specially designed friction tester as shown in Figure 3. The temperatures of the friction wear tests were determined as 100°C, 150°C, 200°C, 250°C, 300°C, and 350 °C according to SAE J-661 International Standard [41]. Disc speeds of 600, 800 and 1100 rev min−1 were used in the experiments. The friction coefficient has been made in this device by simulating the real braking environment. Friction tests to determine the friction coefficient was repeated at least twice. Each test braked 100 and 500 times to determine the friction coefficient. In each braking, the brake pads applied pressure to the disc with a hydraulic system for 3 s and braked. After braking was released, the system was free-running for 5 s. In this study, friction coefficients (µ) were calculated by the following formula. Fs = FN.µ, FS = Friction force, FN = Normal force, µ = Friction coefficient. Friction force (Fs) was measured with a load-cell; FN is calculated by pressure in obtained from hydraulics unit and brake composite area (Pressure × Pad area) [37]. This force which normal force is applied brake composite area. In measurement of Fs values, 10 values at least were used for 100 and 500 braking cycles. The average of 5 values in each 100 braking cycles was also taken. Indeed, a total of 50 Fs values were taking into consideration to calculate a single value of friction coefficient (µ). The experiments were carried out by applying a pressure of 2 MPa. To better provide contact between brake pad and disc, the surfaces were abraded using sandpaper. The friction tester was designed, assembled, and manufactured using the Solidworks CAD/CAM program. The new type of friction tester is completely computer controlled and has data collection capability to adjust test parameters. An electric motor (AC, 15 kW, 1440 rev min−1/112.5 Nm torque) provides continuous power transfer at maximum torque by using an electro-mechanical clutch pad. Also included are a hydraulic unit (0–160 bar pressure), an automation control unit, three cooling units (1.5 kW, 2800 rev min−1), the first to cool the electro-mechanic clutch pad, the second to cool the brake disc, and the third to cool the fluid oil moving from the hydraulic unit to the pipe of the brake pad system. In addition, it has a digital temperature indicator, a load cell, resistance (4 × 1 kW) heat to the brake, disc flange couplings, a main shaft (diameter of 30 mm), an infrared sensor made to measure the brake pad temperature, and a cast iron brake disc to use with the brake composites. The specific wear rate was measured using the weight difference before and after the friction test. Each test was repeated at least twice.
Real brake friction tester.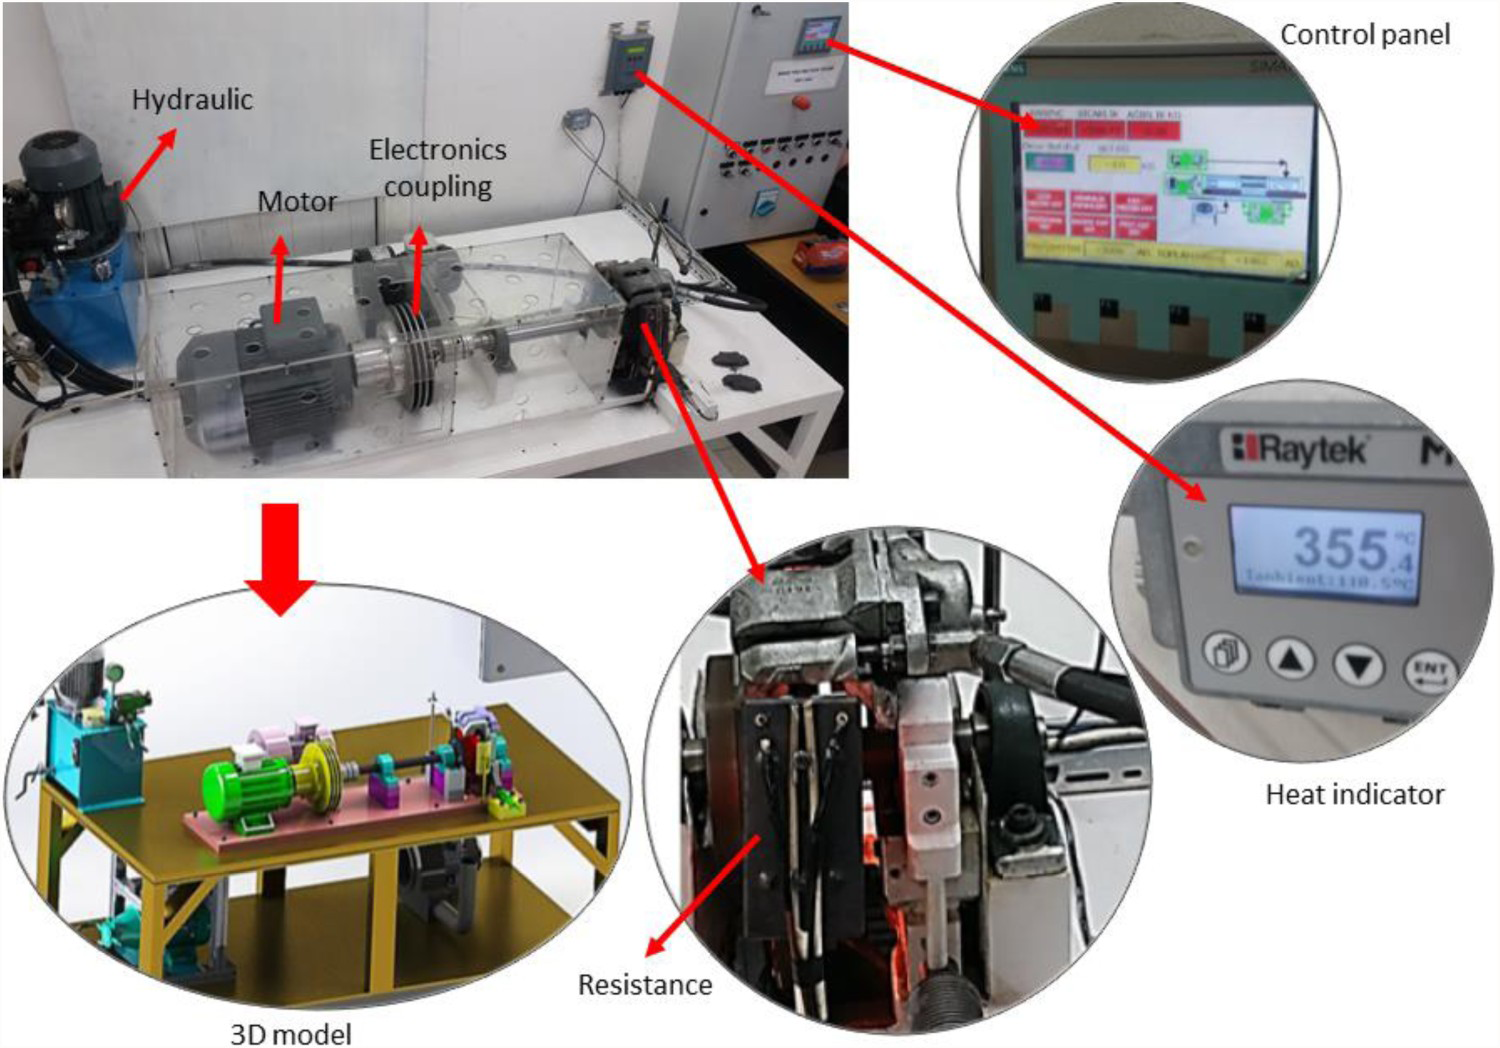
The wear rate of the new brake pad was calculated according to the formula in Equation (1).
Results and discussions
Tribological contact
A total of 48 brake tests were carried out to compare the designed brake composites with the commercial brake composites under different conditions of disc speed, temperature, and the number of brakes. For the designed brake composites, 24 brake tests were performed, and the same number were conducted for the commercial brake composites. The densities of the newly produced brake composite and commercial brake composite are 2.35 and 2.23 g mm−3, respectively. The density of the new brake composite is higher than that of a commercial brake composite. The density of brake composites is due to the production methods and the properties of the powders that make up the composite. The density of the brake composite affects its properties such as porosity, braking performance and hardness. The friction coefficient and specific wear rate results were then plotted (Figures 4–9) in accordance with the studies in the literature [23, 24, 36].
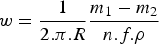
Figure 4 shows the development of the friction coefficient according to the disc speed in the designed brake composites for 100 brakes. The friction coefficients in Figure 4 varied in the range of 0.28–0.45. In the figure, it is clear that the friction coefficient values decrease with increasing disc temperatures [43]. The friction coefficients at 100°C, 200°C, 250°C and 350 °C at 1100 rev min−1 disc speed were determined to be 0.45 µ, 0.43 µ, 0.42 µ and 0.28 µ respectively. The friction coefficients obtained are in accordance with the industrial standard values [44]. As expected, this situation can be attributed mainly to the thermal fade. However, with increasing disc speed, the friction coefficient values rose up to 350°C and then decreased. The sudden reduction in the friction coefficient at the temperature of 350°C may have been associated with the variation in the contact area on the disc surface at excessive temperatures [6, 7].
Evolution of friction coefficient as a function of speed and temperature in designed brake composites for 100 brakes.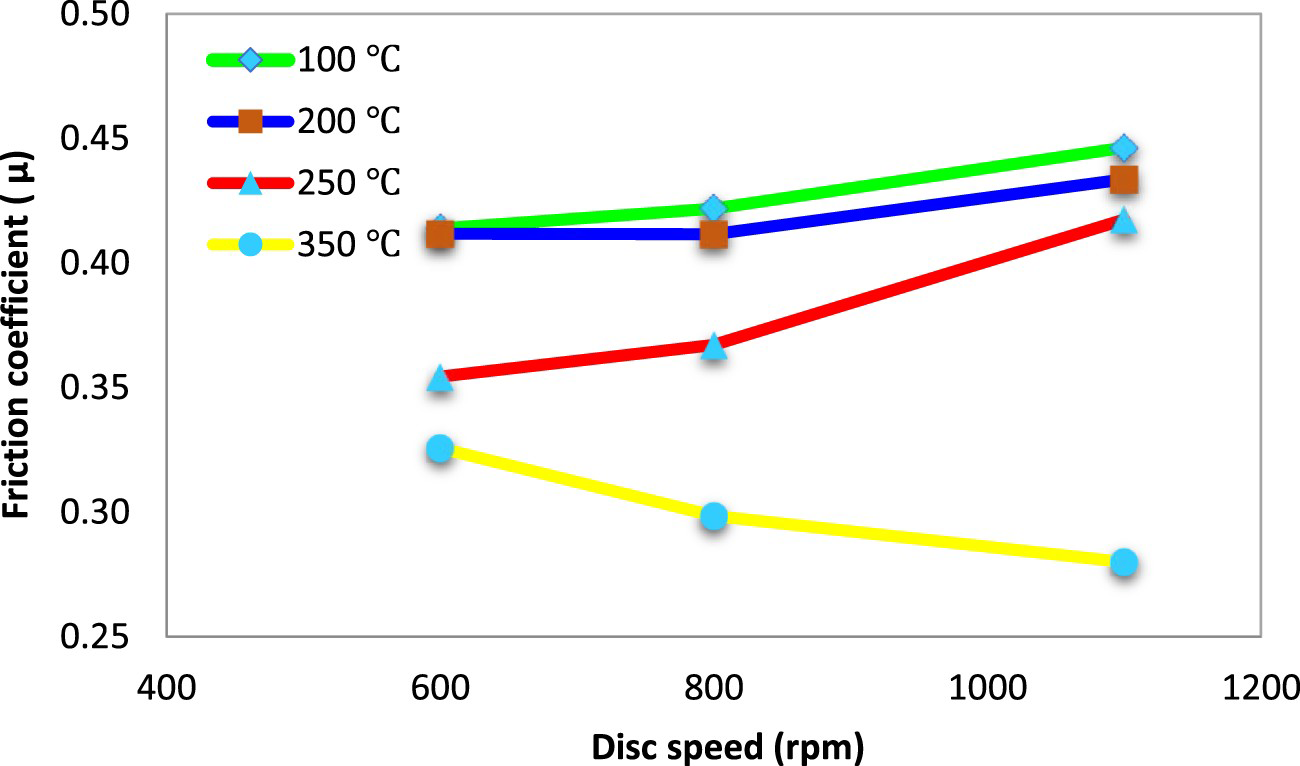
Figure 5 shows the evolution of the friction coefficient as a function of disc speed and temperature in the designed composites for 500 brakes. The friction coefficients in the figure varied in the range of 0.30–0.435. It can be seen that the friction coefficient values decrease due to the increase in disc temperatures. The friction coefficient increases with rising disc temperature can clearly be related to the thermal fade [6, 7]. Nevertheless, the friction coefficients increased up to 350°C and after this point decreased with rising disc speed [45]. This decrease in friction coefficient can be considered as a result of the change in the contact area of the disc surface at high temperatures [6]. Above 250 °C, the friction coefficient decreased due to softening consistent with some of the phenolic resins and whitening was observed on the tested surfaces. Thus, it can be said that these samples can be used under 250°C braking conditions.
Evolution of friction coefficient dependent on speed and temperature in designed brake composites for 500 brakes.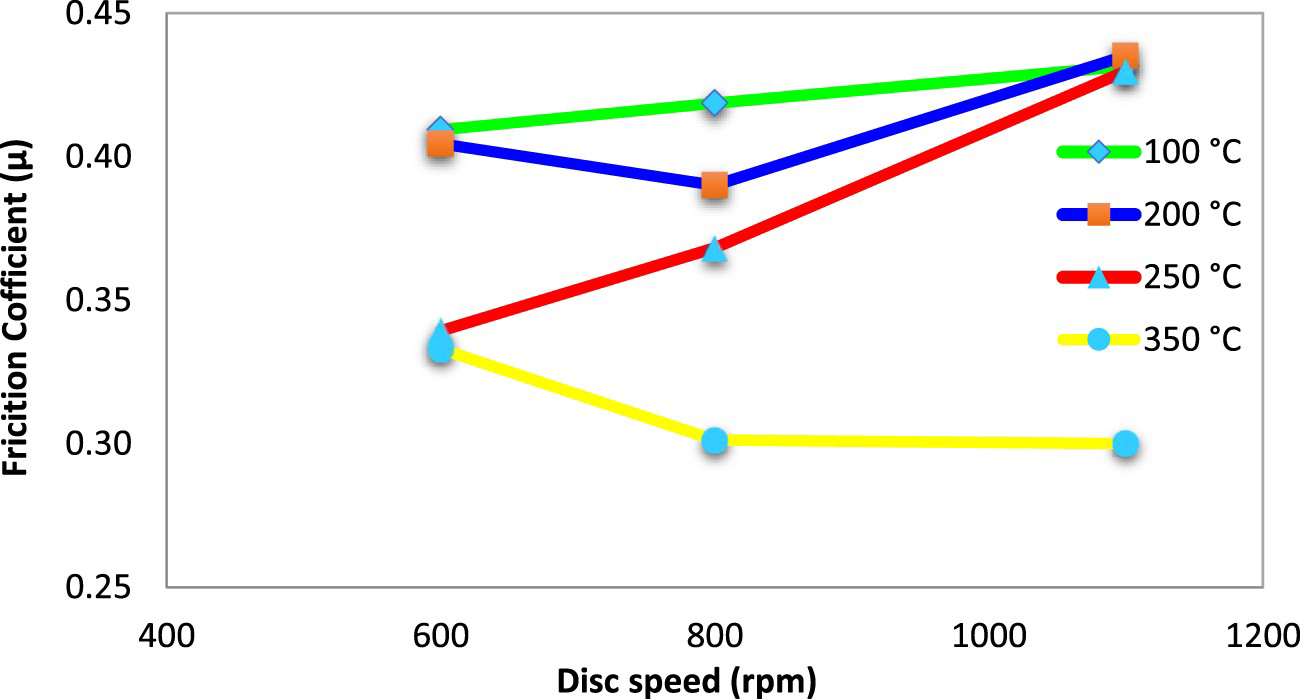
Figure 6 illustrates the evolution of the specific wear rate in the designed brake composites and the commercial brake composites for 100 and 500 brakes at a disc speed of 800 rev min−1. The specific wear rate values in Figure 6 were calculated between 2.84 × 10⁻⁷ and 1.034 × 10⁻⁵ N m cm−3. As can be seen, the values of the specific wear rate continuously increased with rising disc temperatures at 100 and 500 brakes. Figure 6 shows that the wear rate of the brake composites increased with the decreasing values of the friction coefficient, dependent on the temperature. In most cases, there will be no normal relationship between friction and wear. If the friction value is higher, the wear rate will also follow the trend of the higher values [46]. Furthermore, a considerable increase in the specific wear rate was observed at temperatures from 250°C to 350 °C. This could have been due to the higher disc speeds at extreme temperatures, as mentioned previously. The specific wear rate values in the figure were calculated as between 2.63 × 10⁻⁷ and 4.40 × 10⁻⁶ N m cm−3. The higher the braking temperature, the higher the wear rate. The wear rate at 100 °C and 350 °C (100 braking and 800 rev min−1) was measured at 1.12,792×10−7 N m cm−3 and 1.03,401×10− 5 N m cm−3, respectively. Especially at 350 °C, the wear rate increased abruptly. Figure 9 shows that at 100 and 500 brakes, the wear rate also increases due to the increase in disc temperature. The specific wear rate values at 100 brakes, as expected, were lower than those at 500 brakes. In addition, a sharp rise in the specific wear rate occurred after the disc temperature of 200 °C for each of the two numbers of brakes; however, a similar trend was observed at 250 °C for the designed brake composites, as seen in Figure 6.
Evolution of specific wear rate in the new designed brake composites and commercial brake composites for 100 and 500 brakes.
Figure 7 presents the friction coefficient and temperature in the commercial brake composites for 100 brakes. The friction coefficients in the figure exhibited a fluctuation in the range of 0.30–0.387. During the brake tests, the friction coefficients decreased with rising temperature from 200 °C to 350 °C, whereas this tendency lessened at the temperature of 100 °C, when tribological contact between the disc and brake pad was not sufficient. Increasing the number of braking has slightly reduced the friction coefficient. The coefficient of friction at 100 and 500 braking was measured as 0.390 µ and 0.389 µ, respectively. The values obtained are too small to be neglected. But the temperature change changed the friction coefficient. As the temperature increased, the friction coefficient decreased. The friction coefficient, which was 0.39 µ at 100 °C, decreased to 0.30 µ at 350 °C. On the other hand, Figure 7 clearly shows that the friction coefficients generally increased with increasing disc speed at all temperatures. However, as the 200°C disc speed increases, the friction coefficient tends to decrease slightly. The actual contact area between the disc and the pad, that is, the pad regions where most of the kinetic energy is dissipated by friction, has a significant effect on the braking interface temperature. The thermal load on the brake pad contact surface does not occur homogeneously. Long-term experiments show that hot rings on the disc move within the contact zone on the disc by changing their radius [47]. It can be said that dusts such as rubber and plastic in the brake composition at 200°C have a negative effect on their thermo-elastic properties. It is also known that the pad/disc contact surfaces will change their surface combat properties during the polishing process caused by friction, wear and other mechanical or chemical interactions at the interface in the friction braking process. The polishing process will change with the process of developing the interface layer. If abrasion residues fill the ‘open’ area on the pad surface by mechanical or chemical means during the process, the affinity between the two contact surfaces may increase. This can ensure that the two contact surfaces are correctly positioned to form an adhesive bond. This may cause unexpected consequences in the friction coefficient [48].
Evolution of friction coefficient as a function of speed and temperature in commercial brake composites for 100 brakes.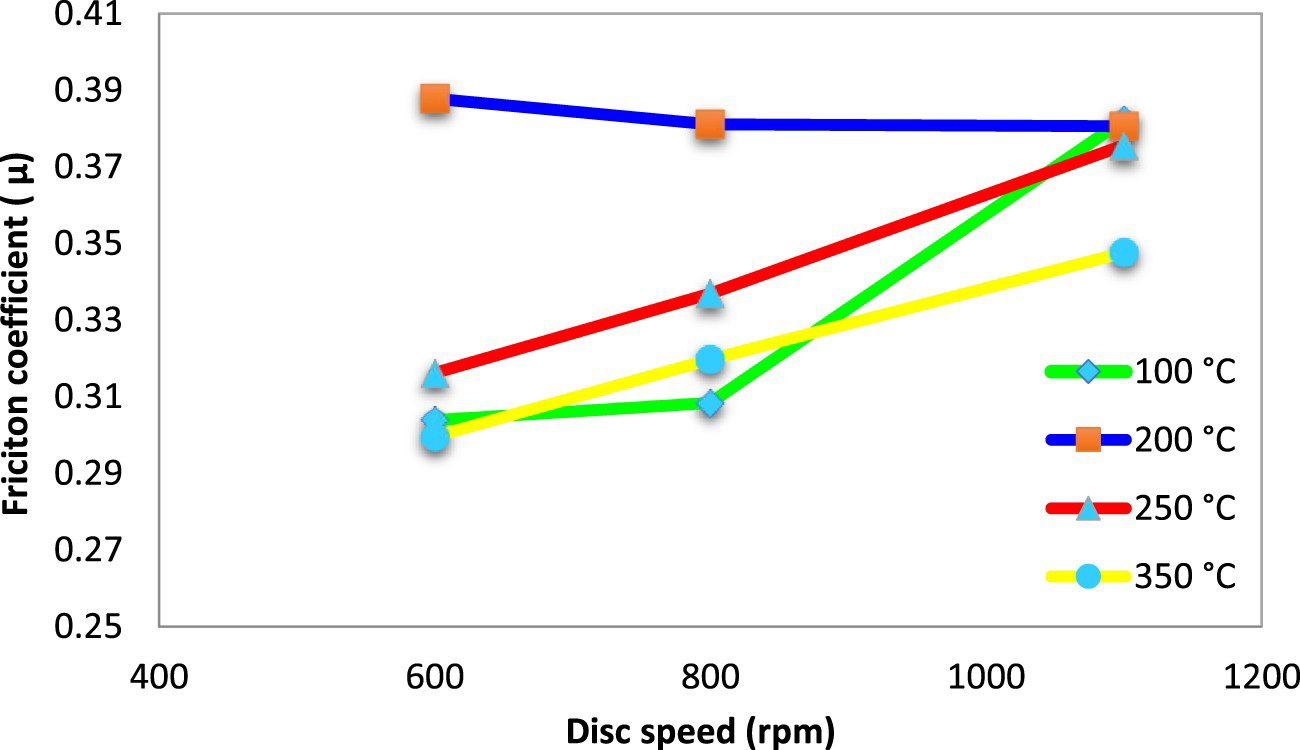
The reason for this may have been the variation in the contact area on the disc surface at higher speeds [7, 35]. As a result, the commercial brake composites displayed a different trend for friction coefficients and specific wear rates compared to the designed brake composites.
Figure 8 shows the evolution of the friction coefficient and temperature in the commercial brake composites for 500 brakes. The friction coefficients in the figure showed a change in the range of 0.30–0.388. It can clearly be inferred following the brake tests that, except for slight differences, the friction coefficients demonstrated a trend similar to that in Figure 7.
Evolution of friction coefficient dependent on speed and temperature in commercial pads for 500 brakes.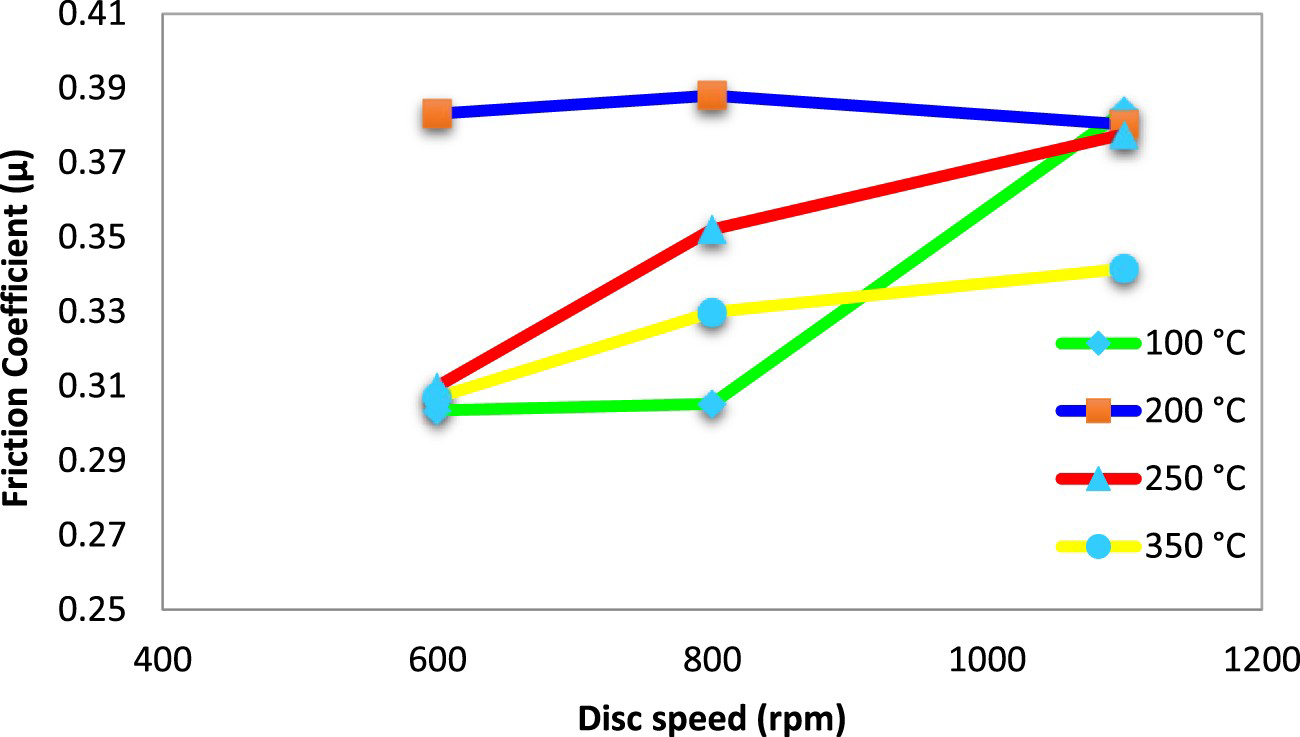
The abrasives in the new brake pad composition have a more important effect on improving the friction coefficient than other types of friction powders. They were also more effective in improving wear resistance. During the fade, the friction regulators were more effective in stabilising the friction coefficient. During the recovery, the abrasives were more effective in stabilising the friction coefficient. The new composite brake pad showed that the friction coefficient was reduced by disc speed. The decrease of the friction coefficient with the disc speed was linked to the blinding of the abrasive particles and clogging of the gaps between the abrasive particles with the metallic wear residue. Particular morphology also plays an important role in determining friction. Sharp edges tend to increase friction and wear. Developed friction composites have a similar tendency to initially increase the friction ratio and after testing, the sharpness decreases, causing a decrease in value [49].
Characterisation of worn surfaces
The characterisation of the worn surfaces is a significant analytic tool in evaluating the morphology of the designed and commercial brake composites tested under different conditions. In order to understand the morphology and wear mechanism of the brake composites, SEM analysis was performed using the micrographs of the worn surfaces. In the present study, the SEM micrographs of the worn surfaces of the brake composites were examined by considering the variation of the specific wear rate dependent on the temperature.
The SEM micrographs of the worn surfaces given in Figure 9(a–c) indicate the distinct characteristics of the friction-contact plateau-wear debris associated with different wear modes for the designed brake composites at temperatures of 100 °C, 250 °C, and 350 °C. Figure 9(a) shows that a good interfacial locking had occurred between the matrix and the fibre resulting from the tribological contact of the designed brake composites. In addition, fibre cracks and wear tracks appear in the worn zone. The micrograph of the worn surface in Figure 9(b) shows the secondary contact plateaus, matrix cracks, and excessively worn tracks. A distinct crack can be seen in the matrix of the worn surface of the designed brake composites. Figure 9(c) shows abrasive wear caused by the deformation of the metallic particles and fibres formed between the disc and the brake pad. The wear debris is compacted and has formed secondary plateaus, which were highly affected by the friction dust material and reinforcing fibres that played a crucial role in the process of their formation [13]. As shown by the relevant cross-section views, a debonded line has occurred in the worn surfaces between two secondary plateaus. In addition, it can be clearly seen from the figure that sub-surface damage has occurred due to the shear stress and thermal stress.
Graphs of the designed brake composites. (a) 100 °C, (b) 250 °C, (c) 350 °C.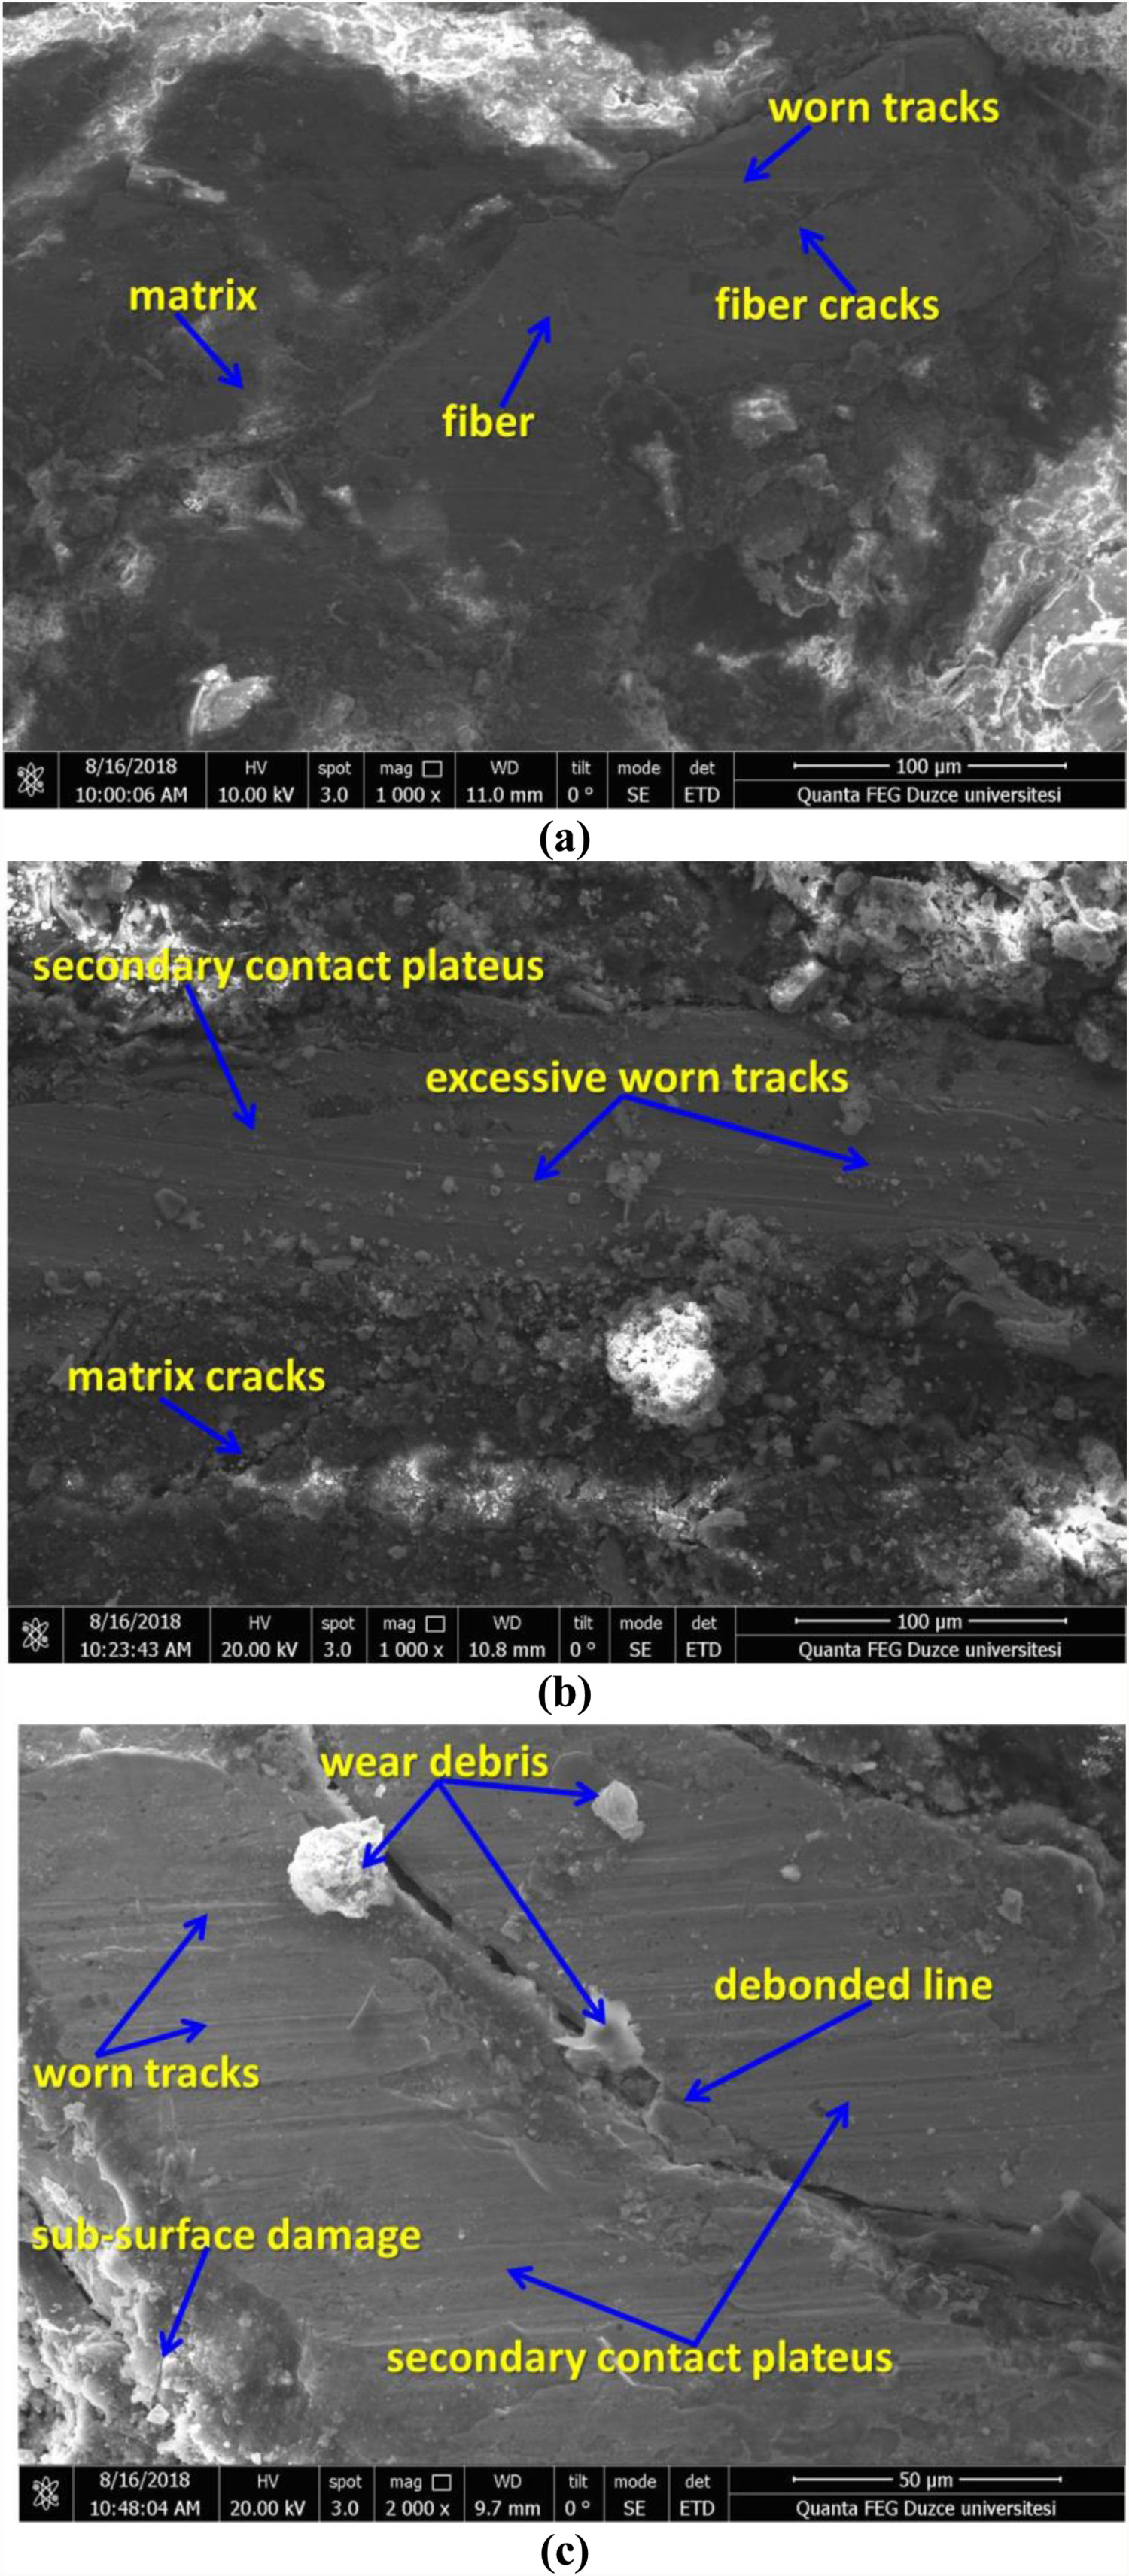
The SEM micrographs of the worn surfaces in Figure 10(a–c) display the distinct characteristics of primary-secondary contact plateau-wear debris, grooves, and micro-cracks associated with different wear modes at temperatures of 100 °C, 250 °C, and 350 °C for the commercial brake composites. From Figure 10(a), it can be observed that the worn tracks on the secondary plateaus are deeper than those seen in the designed brake composites. This feature can be attributed to the fact that the specific wear rate value of the commercial brake composites was greater than that of the designed brake composites. The new formulation with low wear showed a relatively small frequency. This result demonstrates that some of the abrasives can play important roles in noise and vibration during braking. In Figure 10(b), primary and secondary plateaus appear on the worn surface. The micrograph of the brake composites in Figure 10(c) illustrates the hard worn tracks and wear debris on the third body layer. Moreover, in the last micrograph, a good bonding can be observed in the matrix. These results suggest that the morphology of the worn surface was significantly affected by the wear resistance of the friction materials.
Wear micrographs of the commercial brake composites. (a) 100 °C, (b) 250 °C, (c) 350 °C.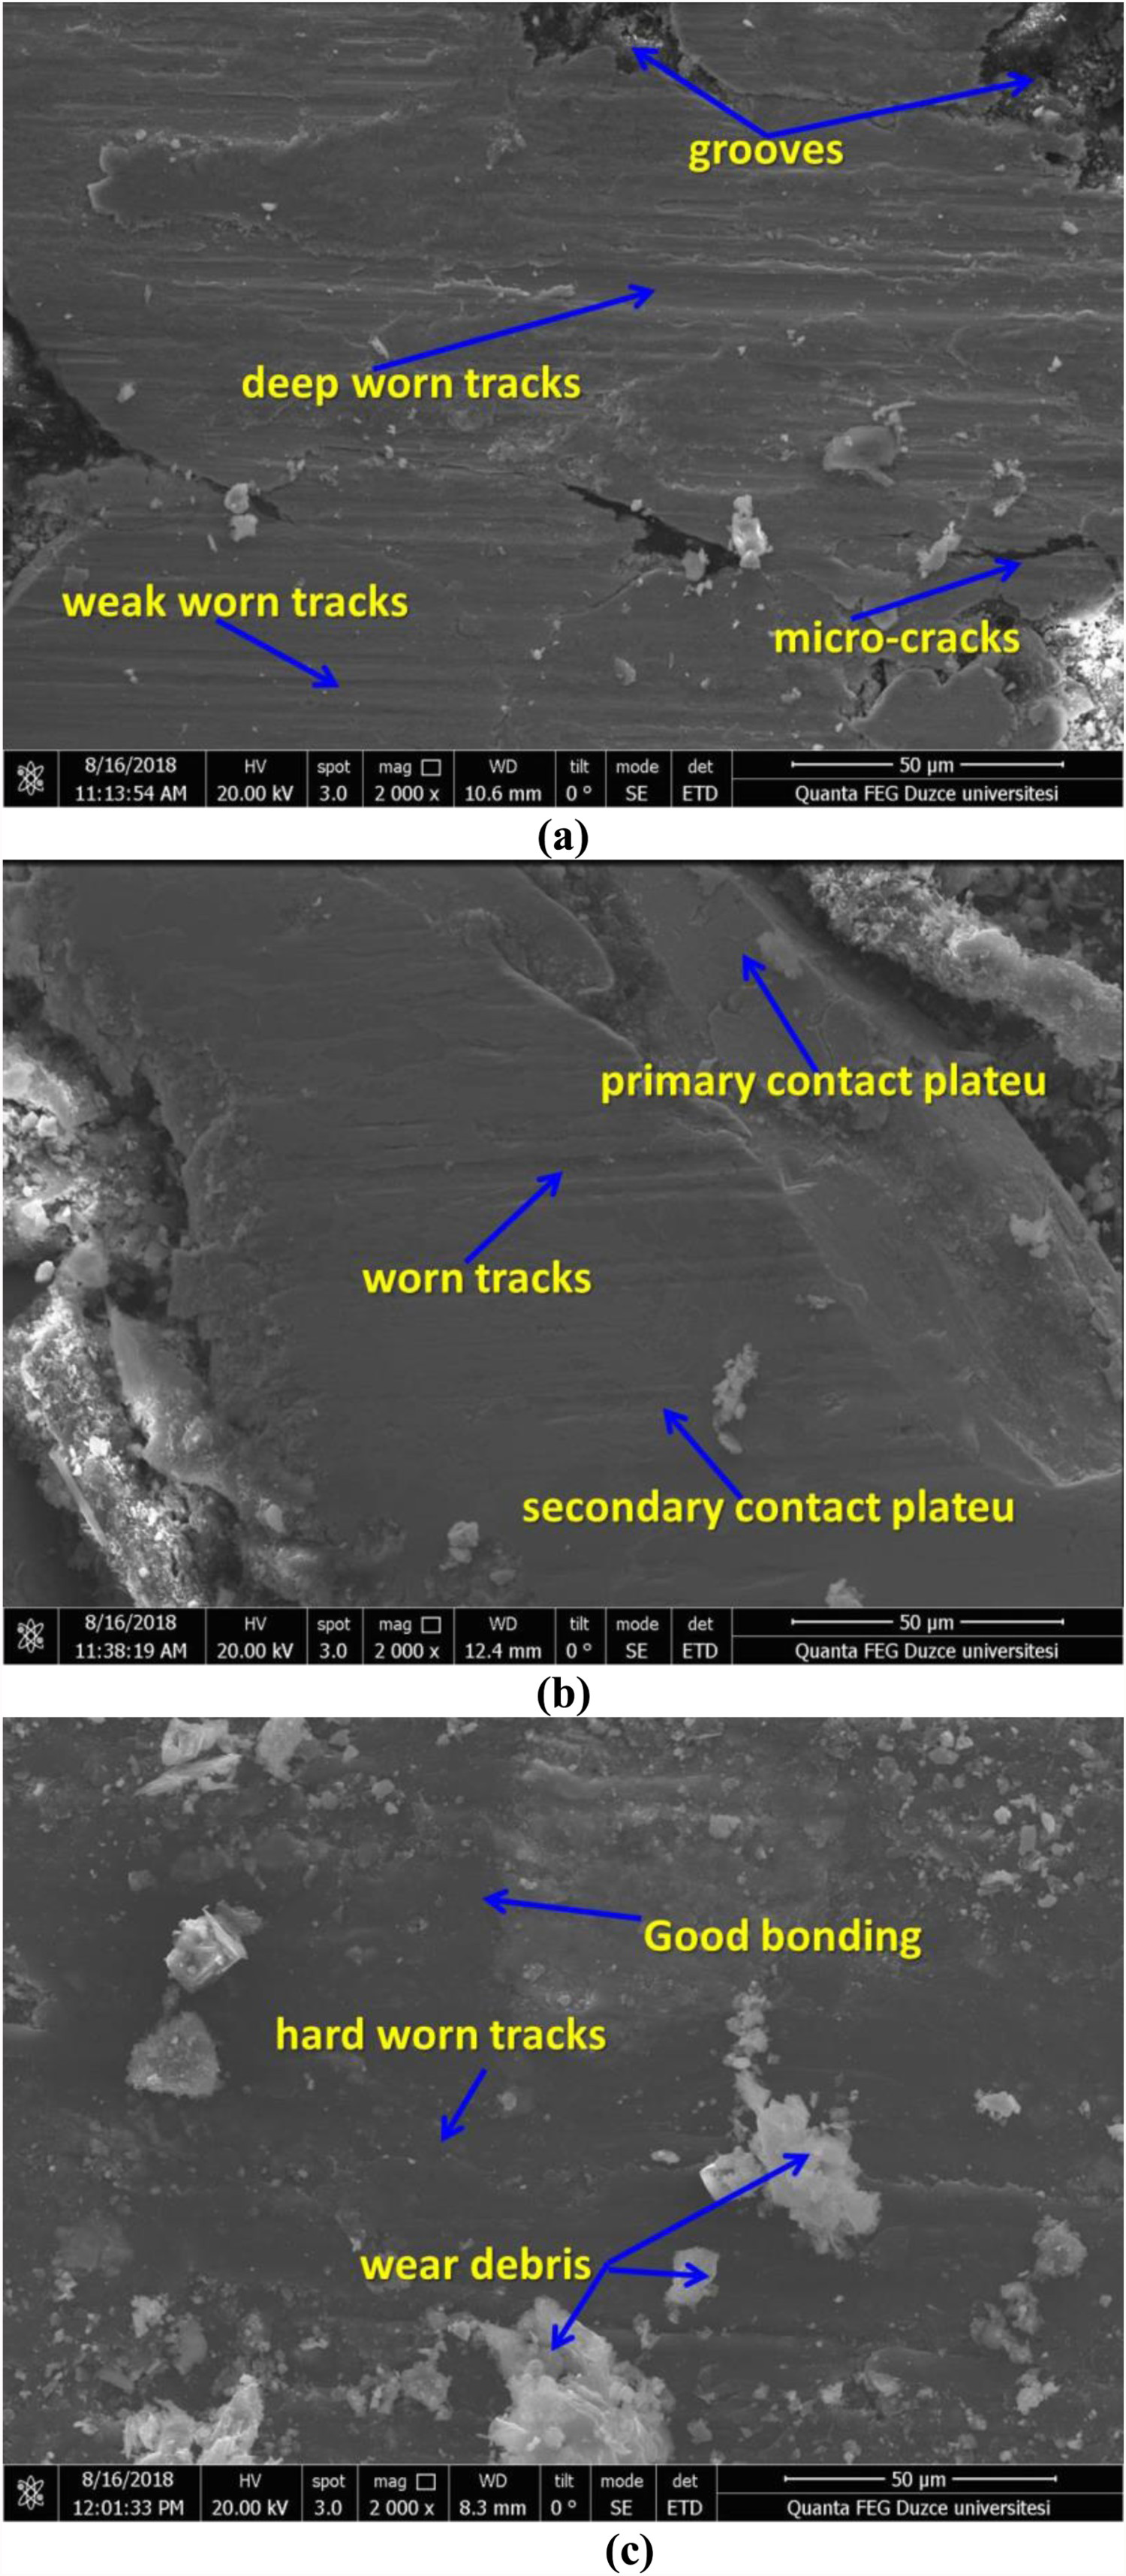
Conclusions
This research focused on a comparison of the tribological contact of the designed brake composites and the commercial brake composites containing petro-coke dust and other friction dust materials. The friction-wear tests were conducted using a specially designed friction tester under different brake test conditions of temperature, disc speed, and number of brakes. The following conclusions resulted from the above investigations:
The highest and the lowest friction coefficients were obtained for the designed brake composites, whereas the highest and the lowest specific wear rates were calculated for the commercial brake composites. Petro-coke dust, known as a friction modifier, generally proved the most beneficial in improving the friction coefficient of the brake composites compared to the other dust materials. In addition, wollastonite dust also helped to increase the wear resistance of the brake composites. The friction coefficients at 100°C, 200°C, 250°C and 350°C at 1100 rev min−1 disc speed were determined to be 0.45, 0.43, 0.42 and 0.28 µ. The friction coefficient values for the designed brake composites generally decreased with rising temperatures from 100 °C to 350 °C, whereas they increased with rising disc speed. Increasing the number of braking has slightly reduced the friction coefficient. The coefficient of friction at 100 and 500 braking was measured as 0.390 µ and 0.389 µ, respectively. The specific wear rate was highly influenced by disc temperature. The higher the braking temperature, the higher the wear rate. The wear rate at 100°C and 350 °C (100 braking and 800 rev min−1) was measured at 1.12,792×10− 7 N m cm−3 and 1.03,401×10− 5 N m cm−3, respectively. The SEM micrographs showed that more worn tracks had occurred on the commercial brake composites than on the designed brake composites. This situation can be attributed to the specific wear rate of the commercial brake composites, which was higher than that of the designed brake composites. As an overall conclusion, the friction coefficient values and specific wear rates of the designed brake composites proved them to be reliable and efficient alternatives to the commercial brake composites.
Footnotes
Acknowledgements
The authors wish to thank the Düzce University Scientific Research Center (DUBIT) for reviewing the SEM micrographs and we also thank MSc. Hamdi KARAKAŞ at Brake Pad Commercial.
Disclosure statement
No potential conflict of interest was reported by the author(s).