
Abstract
In this study, it is aimed to reveal the effect of deficiencies that may occur during thermoplastic production stages which affects both the low-velocity impact behaviour and mechanical strength of the composite materials. To investigate the low-velocity impact performances of thermoplastic composites with embedded delaminations, specimens were manufactured without delamination materials and by using different embedded delamination materials. Two different delamination diameters were also used so as to investigate the delamination diameters on the impact behaviour of composites. All specimens were subjected to low-velocity impact tests at different energy levels ranging from 10 to 50 J. From the test results, the maximum contact force of the specimens increases with the increment of the delamination diameter.
Introduction
Fibre-reinforced thermoplastic composites are heavily utilised as load-carrying components for many structural applications due to their high specific properties such as high stiffness and strength to weight ratios. Despite their superior structural capacity in carrying transverse loads and bending stiffness, these materials are sensitive to low-velocity impact loading which may lead to serious damages such as matrix cracking, delamination and fibre failures. These damages can decrease the mechanical performances of the composites during their service life. In this context, many researchers have been carried out experimental and numerical studies on the impact behaviour of the fibre-reinforced thermoplastic composites, for a long time [1-12].
Besides above-mentioned studies, Vieille et al. compared the response of TS-based (epoxy) and TP-based (PPS or PEEK) laminates under low-velocity impact loadings [13]. They performed C-scan inspections and found that the impact led to diamond-shaped damage resulting from different failure mechanism. Low-velocity impact response and damage behaviour of both Carbon/PEEK and Carbon/epoxy were investigated experimentally and numerically under unified conditions by Sun et al. [14]. Finite element analysis was conducted using a continuum damage mechanics (CDM) approach based on a material model and Weibull theory predicting ply damage and a cohesive zone model (CZM) material model. They obtained that projected delamination areas observed in the thermoset material were highly directional, which shows strong interaction between matrix cracks and delaminations. Saghafi et al. [15] investigated the influence of the interleaf sequence on impact delamination of nano-modified composites. They designed woven composite lamina using CZM and analysed the generated models on Abaqus/Explicit. In limited studies, fatigue tests were applied as well as impact tests [16, 17]. Furthermore, the effect of the absorbed energy and sustain damage of TP-based composites at different temperature values were investigated by some authors [18, 19]. Mosleh et al. [20] developed a number of composite laminates which have different steel fibre architectures with thermoplastic and thermoset matrices, and they applied low-velocity impact test to these materials. They observed that steel plies are installed, indicating a major positive impact of hybridisation on the outside surfaces. Pinto and Meo [21] manufactured composite laminates have been hybridised by the incorporation of a shape memory alloy network within the laminate structure and they carried out low-velocity impact tests. They concluded that a significant amount of energy is absorbed when the inner delamination of extension was reduced in the alloy wires embedded laminates.
As stated previously, thermoset and thermoplastic composites are continuously finding applications areas in the field of many engineering disciplines. Hence, in order to investigate the mechanical behaviour of those structures, reasonable tests under static and dynamic loading conditions need to be studied. Composites may be subjected to impact loading in their service life. Especially in marine and aerospace structures, realistic impact cases are experienced. These impacts may cause or expand the damage of composite structures and consequently may affect the subsequent mechanical performance of the structure. In these cases, although impact velocities are small, the effect of the mass of the impactor is larger which directly affect the performance of the composites. Related papers about the impact response of thermoset and thermoplastic composites can be only simulated the impact cases after the composites were manufactured. On the other hand, matrix cracking and fibre failures may be occurred during the manufactured process. For example, embedded delamination may be existed in the interfaces of the laminates during the curing process of the composite materials. These invisible damages consisting of internal delamination can cause severe reductions of composites. The composite materials may be subjected to impact loads along with the inherent invisible damages such as embedded delaminations.
According to the best of authors’ knowledge, although a great deal of studies were published on the impact behaviour of composite structures with thermoset and thermoplastic resins, there is no study related to the investigation of thermoplastic composites fabricated by glass-reinforced thermoplastic composites with embedded delaminations. In this study, embedded delamination was created on the thermoplastic composites by using two different materials which are vacuum bag and release film. Thus, delaminations with different thicknesses were created in composites and the low-velocity impact properties of these samples were compared. Within this context, single impact responses of composites reinforced with glass reinforced thermoplastic prepregs with embedded delaminations were investigated at ambient temperatures. A number of impact tests were performed through various impact energy levels ranging from 10 to 50 J. As an embedded delamination, two different delamination materials (i.e. vacuum bag and release film) were used. Besides, in order to investigate the effect of diameter of the embedded delamination, the composites were manufactured with two different embedded diameters of 13 and 26 mm.
Materials and methods
In this study, the polypropylene laminates and granules were supplied from Nuh Kompozit Inc. (Turkey). The granules and laminates are of 50 wt-% glass fibre (GF) reinforced. The sizes of the granules are approximately 12 mm. Vacuum bag and release film were used as a delamination material. Vacuum bags are generally used as the top layer of composite productions via vacuum infusion method. This material comes 110 in. wide after unfurling from 55 in. rolled width. Release films ensure the correct discharge of the making a difference fabric utilise for vacuum bagging. Release films are put straightforwardly in contact with the cover. They isolated the cover from breather/bleeder textures, which have no discharge characteristics. These two delamination materials were produced from different polymers, where vacuum bag is produced from Nylon polymer, release film material produced from low-density polyethylene (LDPE). The thickness of the vacuum bag and release film is 75 and 30 micrometre, respectively.
Fabrication of thermoplastic composite specimens
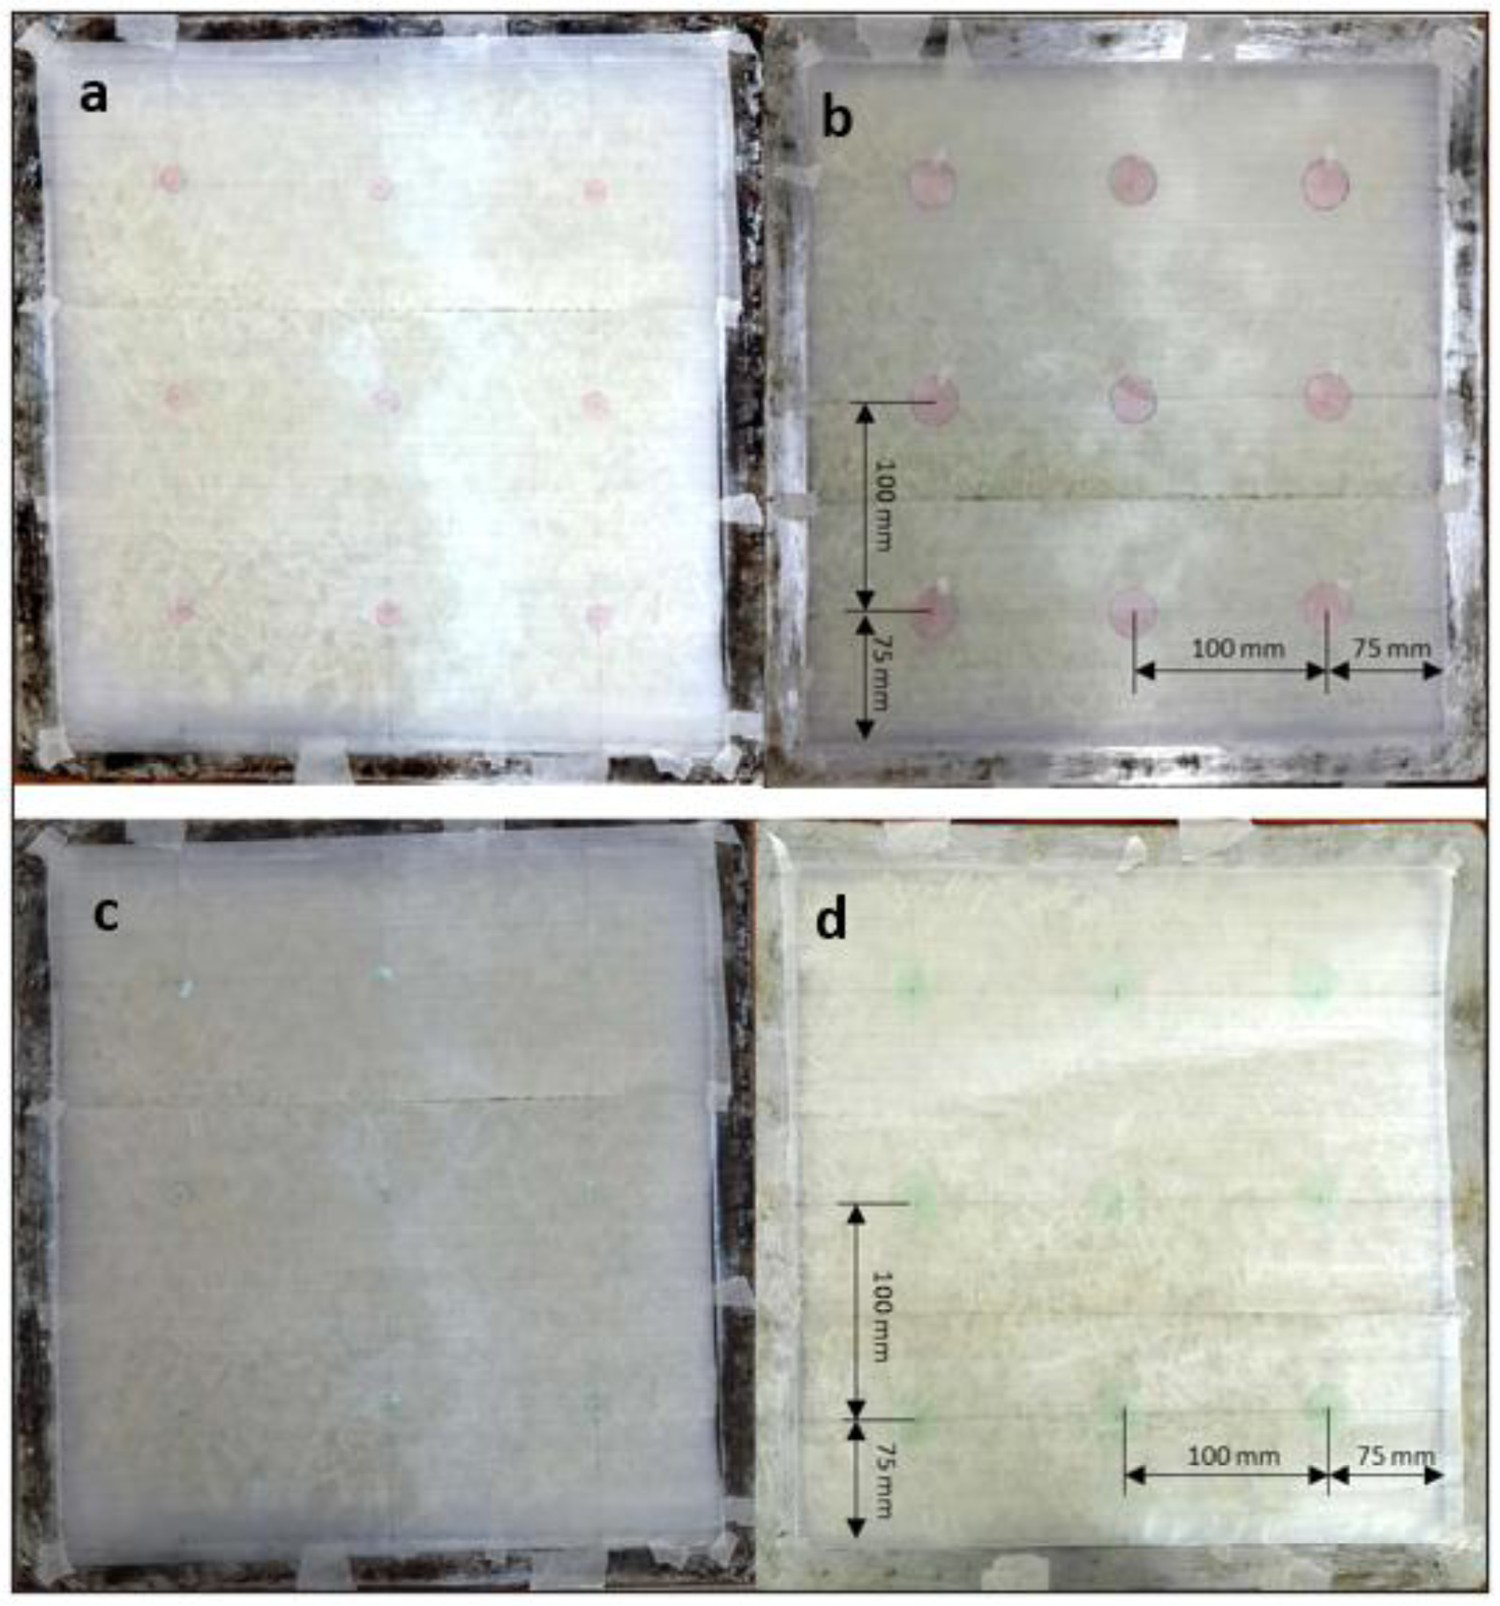
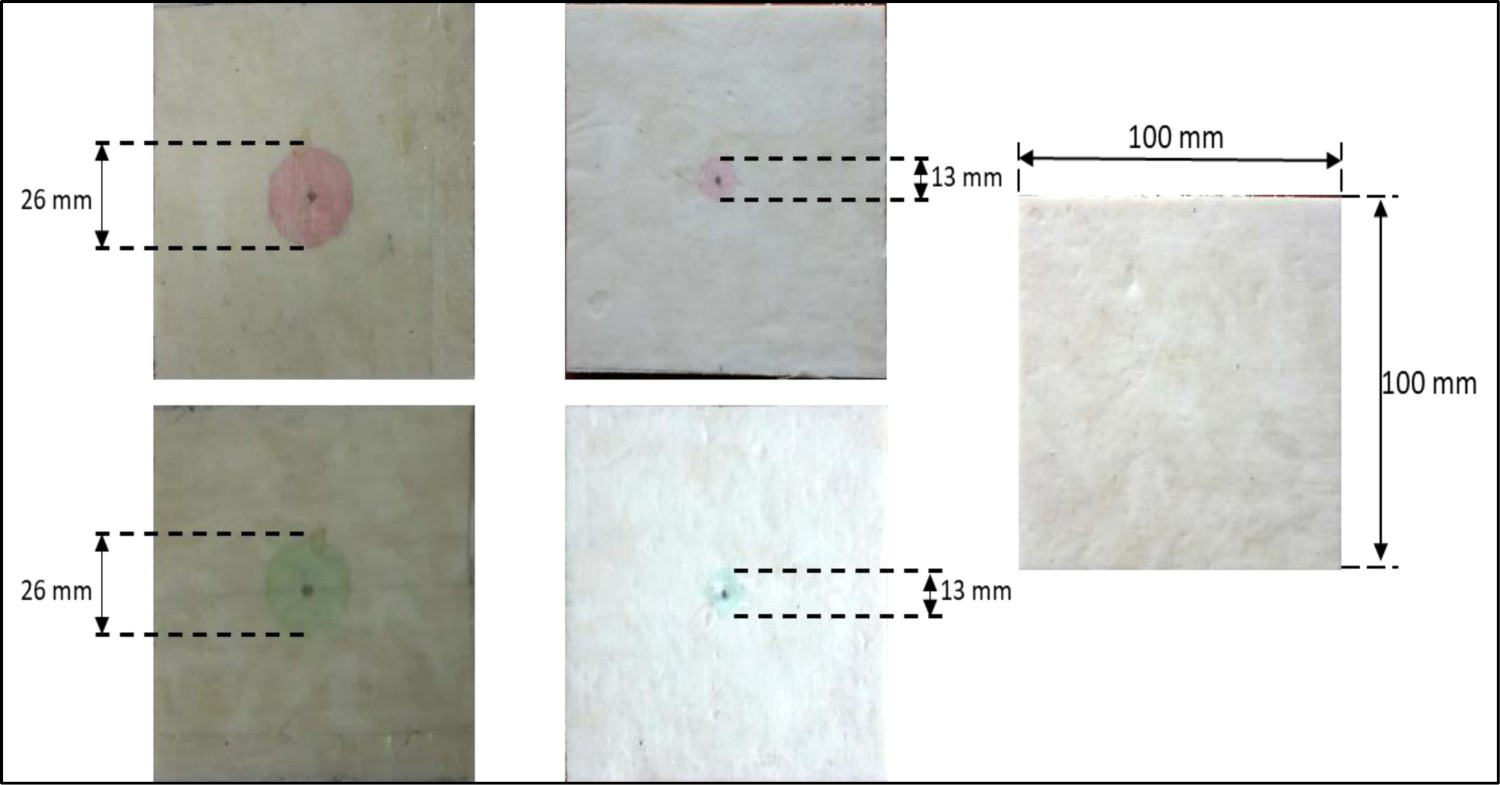
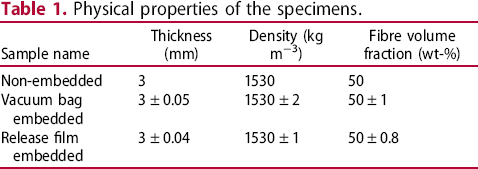
It was aimed to produce a composite that has not been produced before by using materials consisting of polypropylene (PP) and GF with different forms (continuous and short) for the production of thermoplastic composites. Thermoplastic composite specimens used in the present study were produced by hot-pressing method. The density of the laminates and granules used in the study is 1530 kg m−3. The thickness of 4 laminas is approximately 1.2 mm, and the thickness of granule is 1.8 mm. For this reason, 340 g granules were used in the production of composites by utilising the volume–density relationship of the granule. In the first step, four plies of unidirectional GF-reinforced PP laminates were cut into a dimension of 350 × 350 mm. After that, 340 g Duramax LFT50-PP long GF-reinforced granules were randomly and homogeneously distributed in between the top and bottom laminates by using volume–density relationship. The stacking sequence of the thermoplastic composites was [0/90/granules/90/0]. These materials were then placed in the mold which have a thickness of 3 mm. Manufacturing steps of the thermoplastic composites are given in Figure 1. After the preparation stage, the specimens were placed in the hot-pressing device. During hot pressing, the specimens were processed for 1 h under a pressure of 0.625 MPa at 180 °C. At the end of the 1 h, this structure was left to cool for 7 h while applying 0.625 MPa pressure in order to prevent warping. Two different embedded delamination materials having diameters of 13 and 26 mm were placed between top 0/90 layers. The same manufacturing parameters were also used for the thermoplastic composites with embedded delamination materials. The images of composite panels with different embedded diameter dimensions are given in Figure 2. It is seen from the figure that there are nine different delamination zones in each composite panels. In other words, nine specimens were obtained in each production. Finally, the specimens were cut in 100 × 100 mm size and made ready for impact test. The final specimens before impact tests are also given in Figure 3. It can be also noted that delamination zone is in the middle of each specimen. Besides, non-embedded thermoplastic composite materials were produced, and all samples were compared after that applying low-velocity impact tests. Physical properties of whole specimens were given in Table 1.
Manufacturing steps of the thermoplastic composite. The images of thermoplastic composite panels (a) 13 mm embedded release film, (b) 26 mm embedded release film, (c) 13 mm embedded vacuum bag and d) 26 mm embedded vacuum bag. The final specimens with/without embedded delaminations before impact test. Physical properties of the specimens.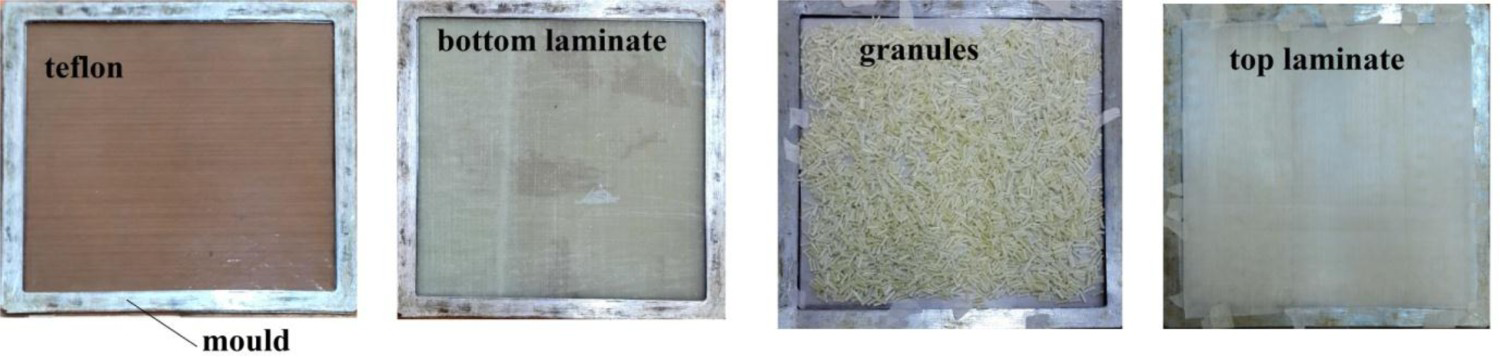
Drop weight impact testing tower (CEAST-Fractovis Plus - Ceast Inc., Italy) was used for conducting low-velocity impact tests which were carried out in accordance with ASTM 7136 standard with the dimensions of 100 × 100 mm. The instrument works according to the weight reduction principle. Impact tests can go up to a maximum of 1800 Joule (J) energy levels. During the performing tests, it prevents the formation of repetitive impacts by means of the anti-rebound system. The impactor tip used in the experiments is a hemispherical form. Its weight is 626 g and its diameter is 12.7 mm. Load capacity of the force transducer attached to the impactor tip is 22.4 kN. With the data reader connected to the impactor tip, experimental data are obtained in the test performed according to the energies that set by the desired levels. In this study, the energy levels applied to the specimens are 10, 20, 30, 40 and 50 J. It can be also noted that, in the impact test applied to specimens with embedded delamination, attention was paid to the impactor tip hitting the delaminated area.
Results and discussion
During the impact tests, the energy is gradually increased from impact energy level of 10 J up to 50 J. Impact tests were applied to delaminated specimens manufactured with different materials and diameters (i.e. vacuum bag and release film) in order to investigate the effect of the size of embedded delamination in thermoplastic composites. In order to minimise the error that may occur during the test, three different experiments were carried out under the same conditions for each energy level. In an effort to investigate embedded delamination in thermoplastic composites, diagrams were created with the data obtained by data acquisition system (DAS).
Diagrams of thermoplastic composites with vacuum bag delamination material
In this section, embedded delaminated specimens with vacuum bag material were examined through contact force–deformation, contact force–time and energy–times curves. Data diagrams were obtained from the results of the experiments performed at different energy levels. It should be also noted that the average values were used to examine the results.
From Figure 4(a,b), it has been observed that there is no perforation and penetration situation in any specimen in this energy level since all curves are closed form. That means the descending section of the curves are in the closed form. It is also seen that the maximum contact force is close to each other for the un-delaminated specimen (0 mm) and 26 mm diameter, but it is lower for the specimen with embedded diameter of 13 mm. When the diameter of the impactor (12.7 mm) and delamination (13 mm) used in the study are close, the delamination material placed in the top layers reduced the maximum contact force value because it created an interface between the impactor and the fibres. However, this situation was not seen in the case where the delamination diameter was 26 mm in terms of maximum contact force. Similarly, specimens with 13 mm delamination absorb more energy. In these specimens, both in terms of deformation and absorbed energy, it was thought that the elastic property of the placed delamination material was caused. In specimens where the delamination diameter value was 26 mm, this situation decreased the impact characteristics due to the clear appearance of the interface effect. As seen in the energy–time diagrams (Figure 4(c)), it was observed that there were rebounding case in all specimens. For the delamination diameter in 13 mm, the absorbed energy is the highest, while the other two specimens are closer to each other. Since the specimens do not absorb the applied impact energy, most of the remaining energy (elastic energy) is used to bounce off the impactor from the surface, while some of it is transformed into frictional energy. Ultimately, it can be said that the delaminated specimen with 13 mm is more deformed than the others.
For specimens with embedded vacuum bag delamination impacted at 20 J energy level, (a) contact force–deflection curves (b) contact force–time curves and (c) energy–time diagrams.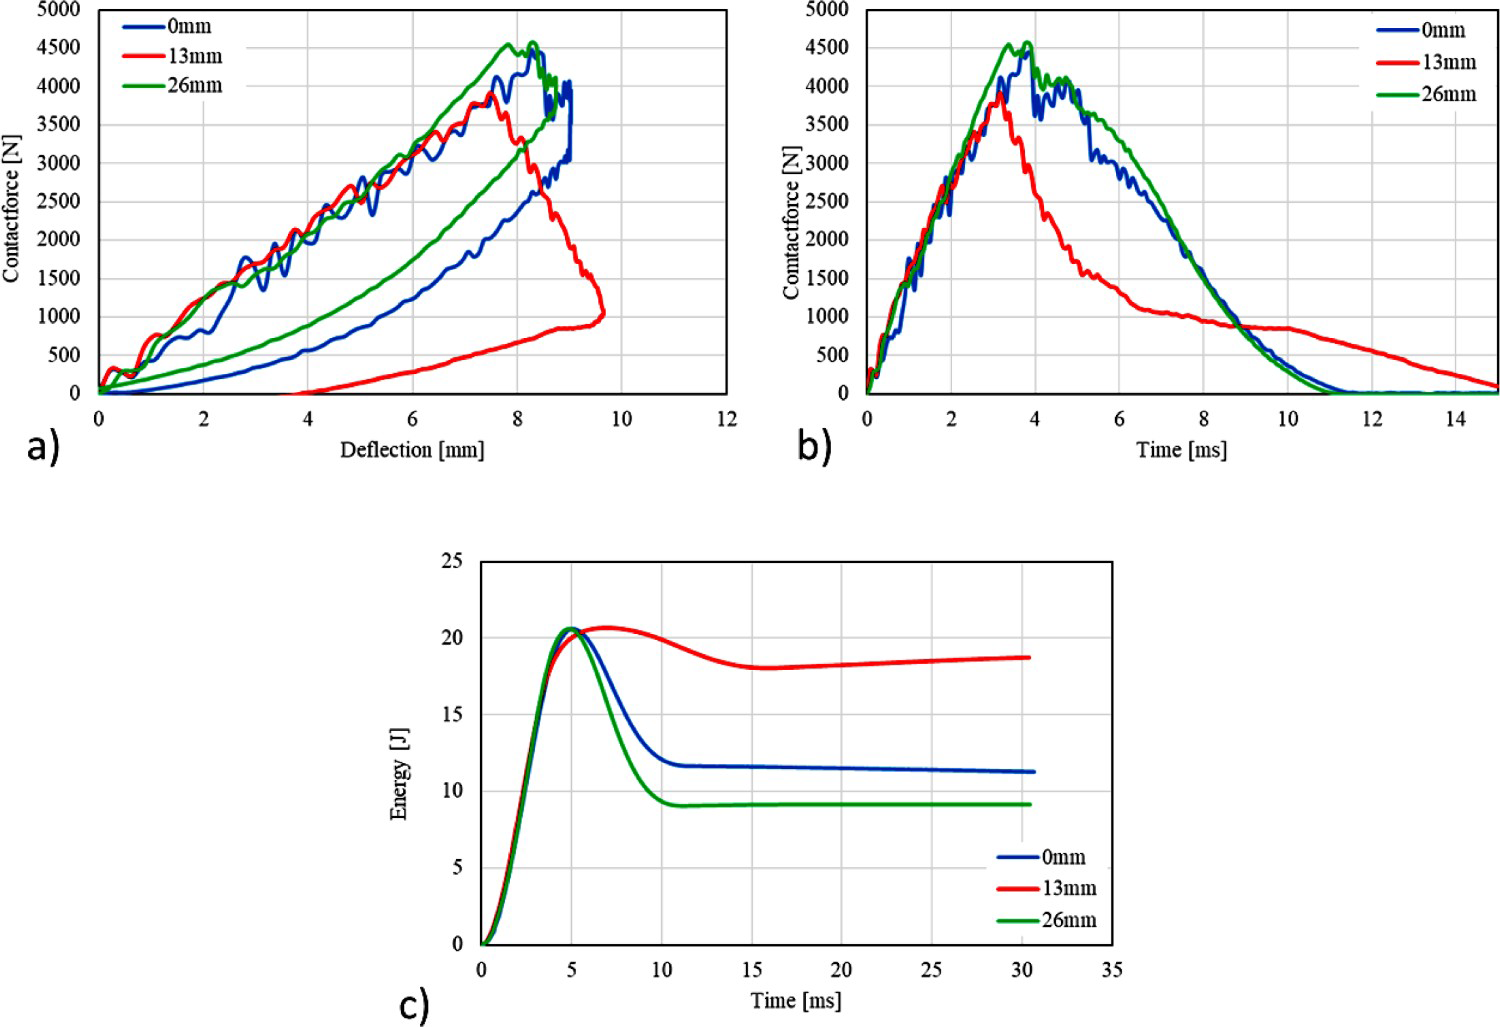
Considering the 30 J energy value, it was concluded that all the specimens were perforated since all curves were open in Figure 5(a). It is seen that the maximum contact force is the highest in the specimen with a delamination diameter of 26 mm, while the specimen with a delamination diameter of 13 is the lowest. There is no significant difference in the times to reach the maximum contact force (peak time). From Figure 5(c), it is also seen that the specimens with a delamination diameter of 0 and 13 mm are perforated at 30 J energy level. On the other hand, the specimen with a delamination diameter of 26 mm was perforated at energy level of about 27 J.
For specimens with embedded vacuum bag delamination impacted at 30 J energy level, (a) contact force–deflection curves (b) contact force–time curves and (c) energy–time diagrams.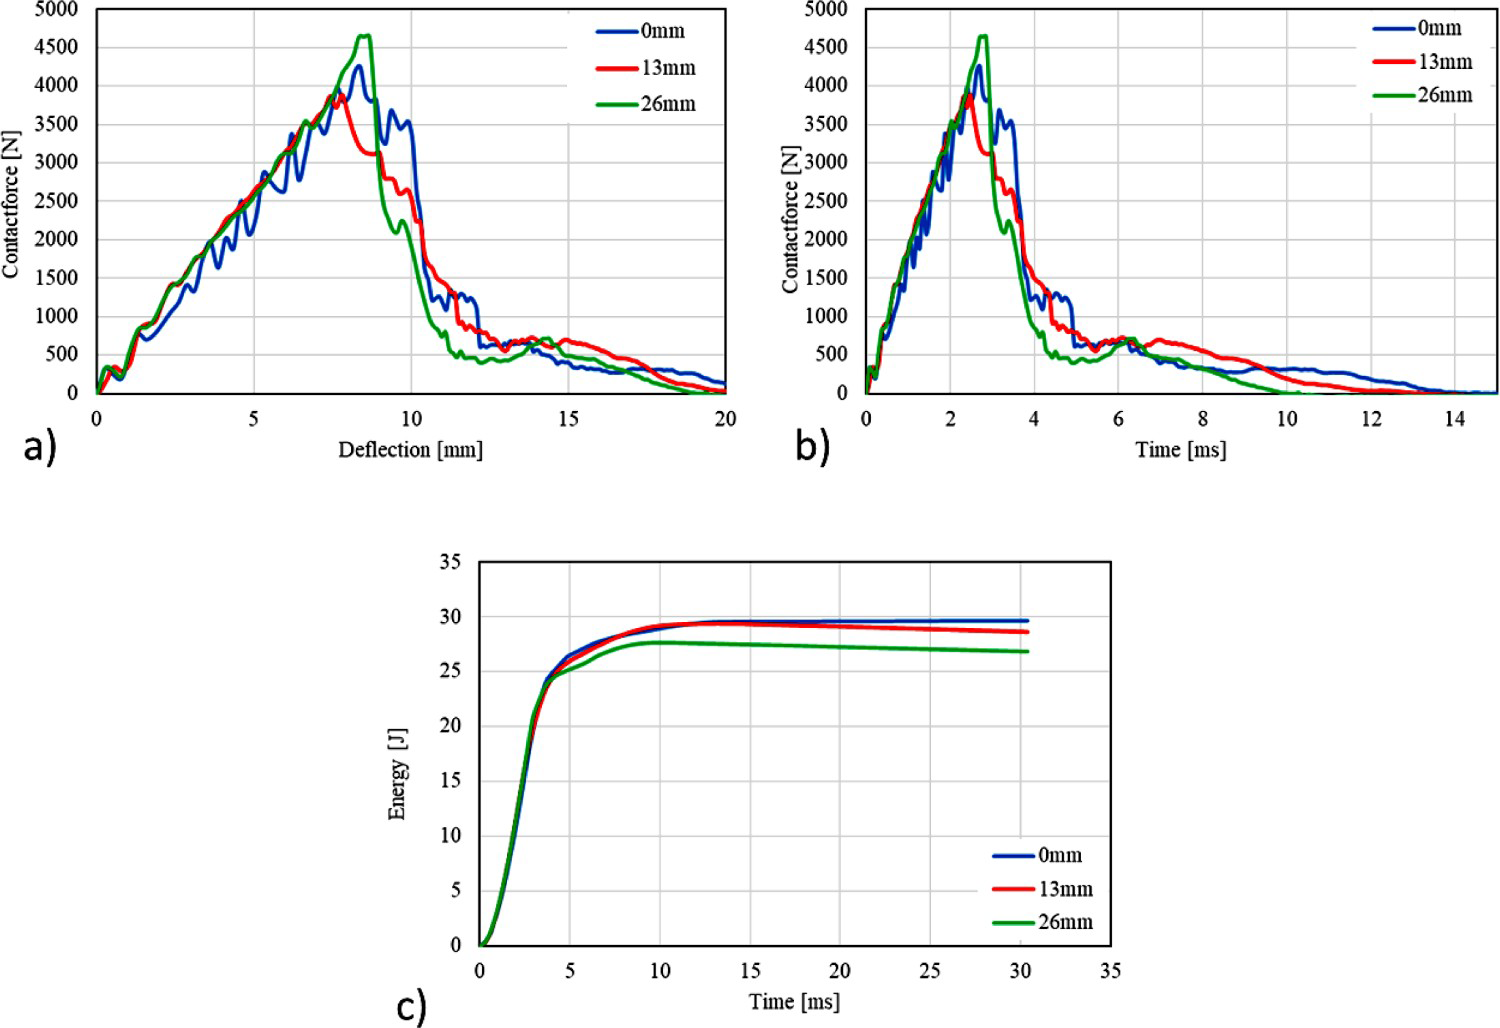
Figure 6(a,b) shows that the maximum contact force is the highest in the un-delaminated specimen, whereas it is lower in the specimens with embedded delamination. In addition to this, it is observed that there is a slight increase in the maximum contact force with the increment of the delamination diameter. There is also no significant difference in the test time to reach the maximum contact force (peak time). When there is a perforation in the specimen, the force value should be zero, but as seen in the curve, the tip of the curve has progressed parallel to the horizontal axis as friction occurs between the specimen and the impactor. As seen in the energy–time diagrams (Figure 6(c)), it can be said that the 40 J energy applied to all specimens only absorbs energy close to the perforation threshold (30 J).
For specimens with embedded vacuum bag delamination impacted at 40 J energy level, (a) contact force–deflection curves (b) contact force–time curves and (c) energy–time diagrams.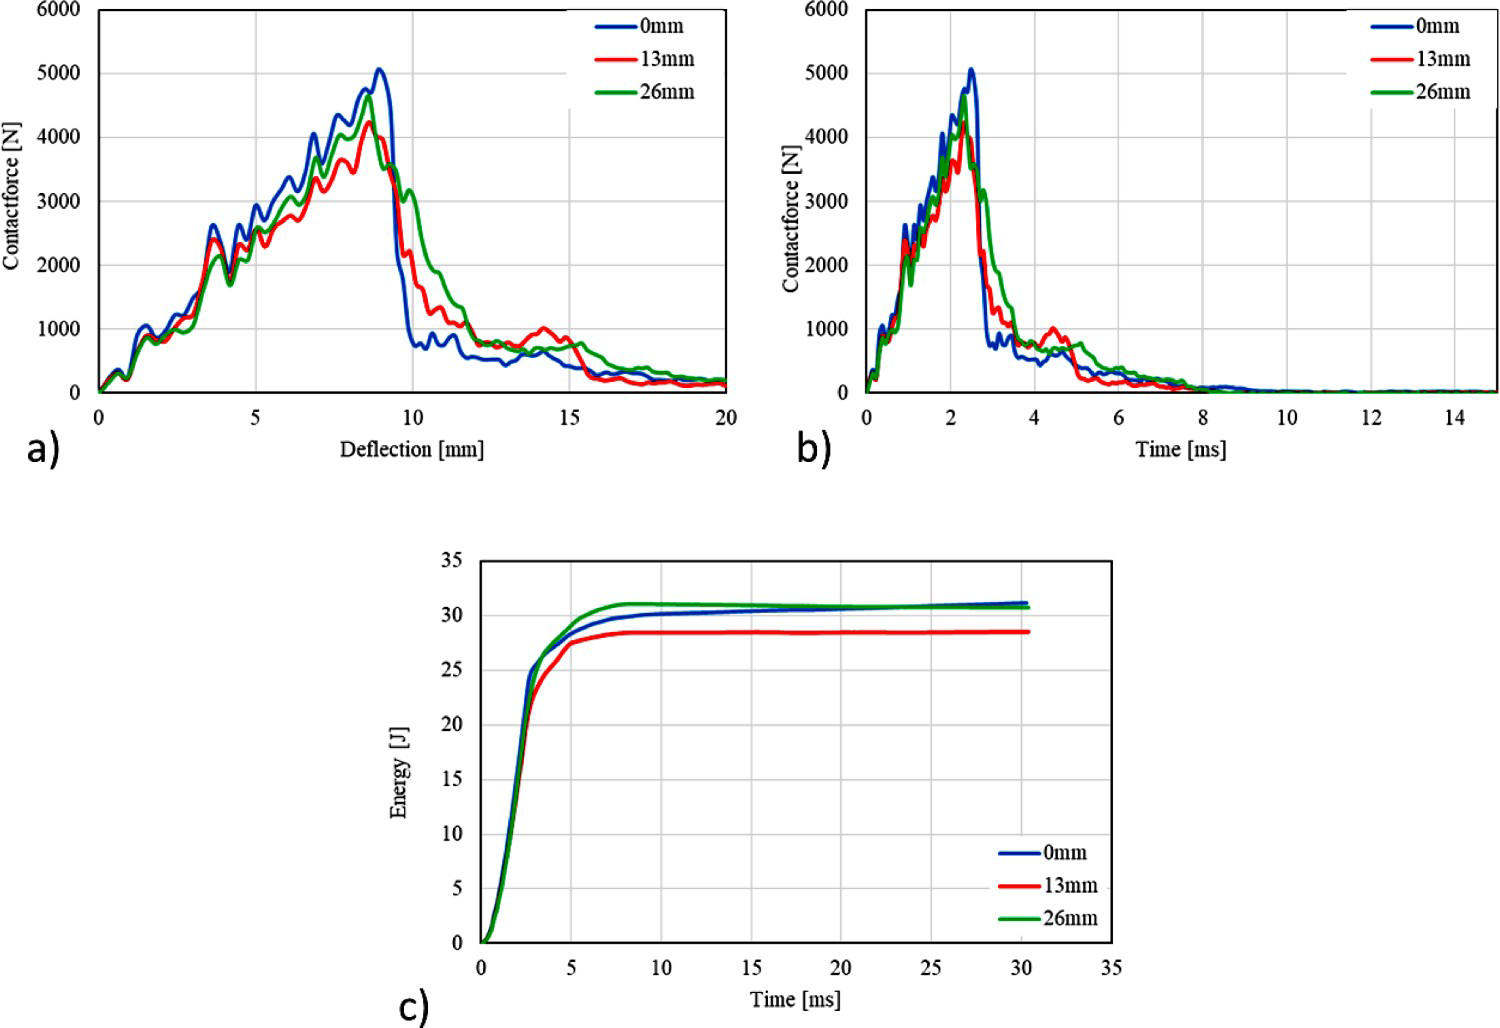
When the diagrams in Figure 7(a,b) are examined together, it is observed that the maximum contact force is close to each other in all specimens. Besides, there is no significant difference in the times to reach the maximum contact force (peak time). When there is a perforation in the specimen, the force value should be zero, but as seen from the curve, the tip of the curve has progressed parallel to the horizontal axis as friction occurs between the specimen and the impactor as similar to specimen impacted at 50 J. From Figure 7(c), while the diagrams of the delamination diameter 0 and 13 mm specimens are overlapped, a decrease in the delamination diameter of the 26 mm specimen is observed in the absorbed energy. In this case, it can be said that there is no significant difference in energy levels that exceed the perforation threshold.
For specimens with embedded vacuum bag delamination impacted at 50 J energy level, (a) contact force–deflection curves (b) contact force–time curves and (c) energy–time diagrams.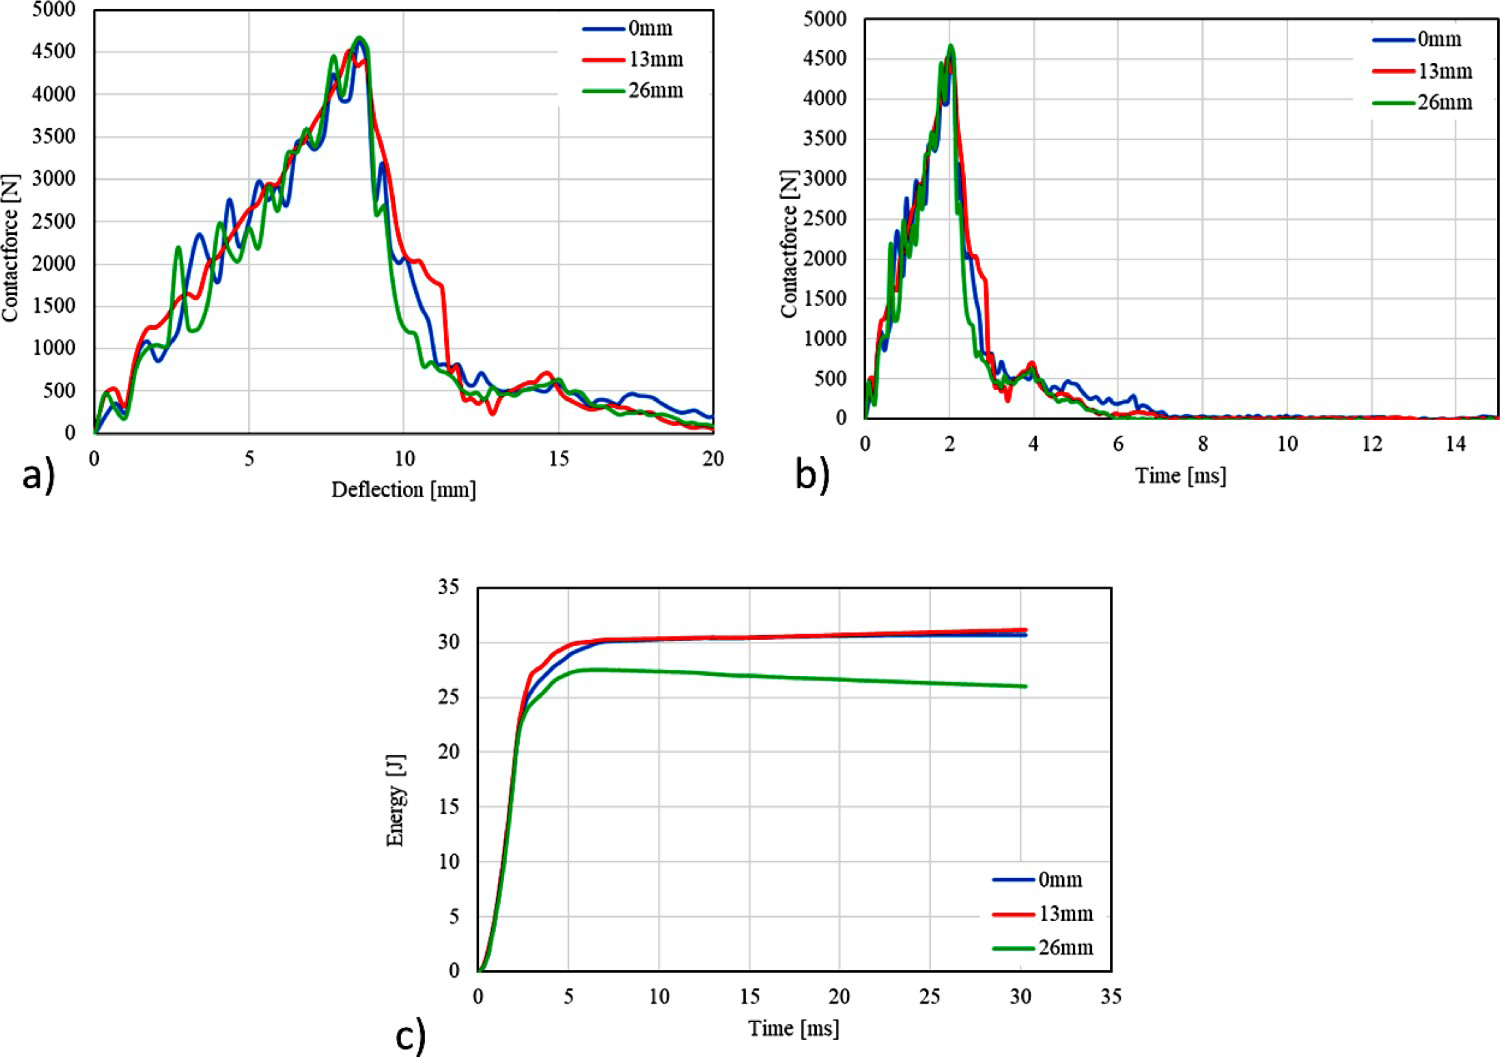
It was observed from Figures 5 to 7, that impact behaviours of specimens impacted from 30 to 50 J impact energy levels were close to each other, excluding at an energy level of 40 J. The delamination with a diameter of 13 mm placed at the applied impact energies prevented the contact between the impactor and the fibres by creating an interface. However, the diameter effect of delamination was not clearly seen at 40 J impact energy. This may be explained by the absence of fibres in the granules at the parts where the impactor touches the specimen.
Figure 8 shows the change of maximum contact force, maximum deformation, and absorbed energy of the specimens with delamination material vacuum bag according to the increasing impact energy level 10 to 50 J. In Figure 8(a), the maximum contact force increased with the increasing impact energy in all specimens, while there was a decrease in the maximum contact force at a value close to the perforation energy (at 30 J). Since the 30 J impact energy value is the energy value at which all the specimens start to be pierced, the maximum contact force value continues horizontally in increasing energy values, since the specimen cannot react to the impactor from this energy value. When the contact force increased from 30 to 50 J, the delamination size of 0 and 13 mm specimens formed close curves, while the specimen with delamination size of 26 mm differed at 50 J energy levels. In Figure 8(b), it is seen that the maximum deformation value at 50 J energy levels in all specimens approached a certain value. The effect of different delamination diameters placed on the interfaces on the displacement caused by the impactor on the specimen, especially at low energies was not seen. Our results are consistent with the study conducted by Sabancı et al. [22]. At the previous energy levels, it has been observed that all curves close to each other. From Figure 8(c), the energy absorbed by the specimens and the perforation energy of the specimens can be evaluated with equal energy diagrams. It is seen that the energy absorbed by the specimens increases almost linearly up to 30 J energy level. After the perforation energy level, it is observed that all specimens form curves close to each other in the horizontal direction. All energy values applied to specimens with different delamination diameters at energies up to 30 J were absorbed by the specimens. In other words, the impactor bounced off the top surface of the specimen. This energy value applied and absorbed by the specimen increased up to 30 J energy level. However, after this energy value, the specimens cannot absorb the applied energy value as they were pierced. For this reason, the absorbed energy value continued almost horizontally.
For specimens with embedded vacuum bag delamination impacted at 10–50 J energy levels, (a) maximum contact force–impact energy curves (b) maximum contact force–impact energy curves and (c) absorbed energy–impact energy curves.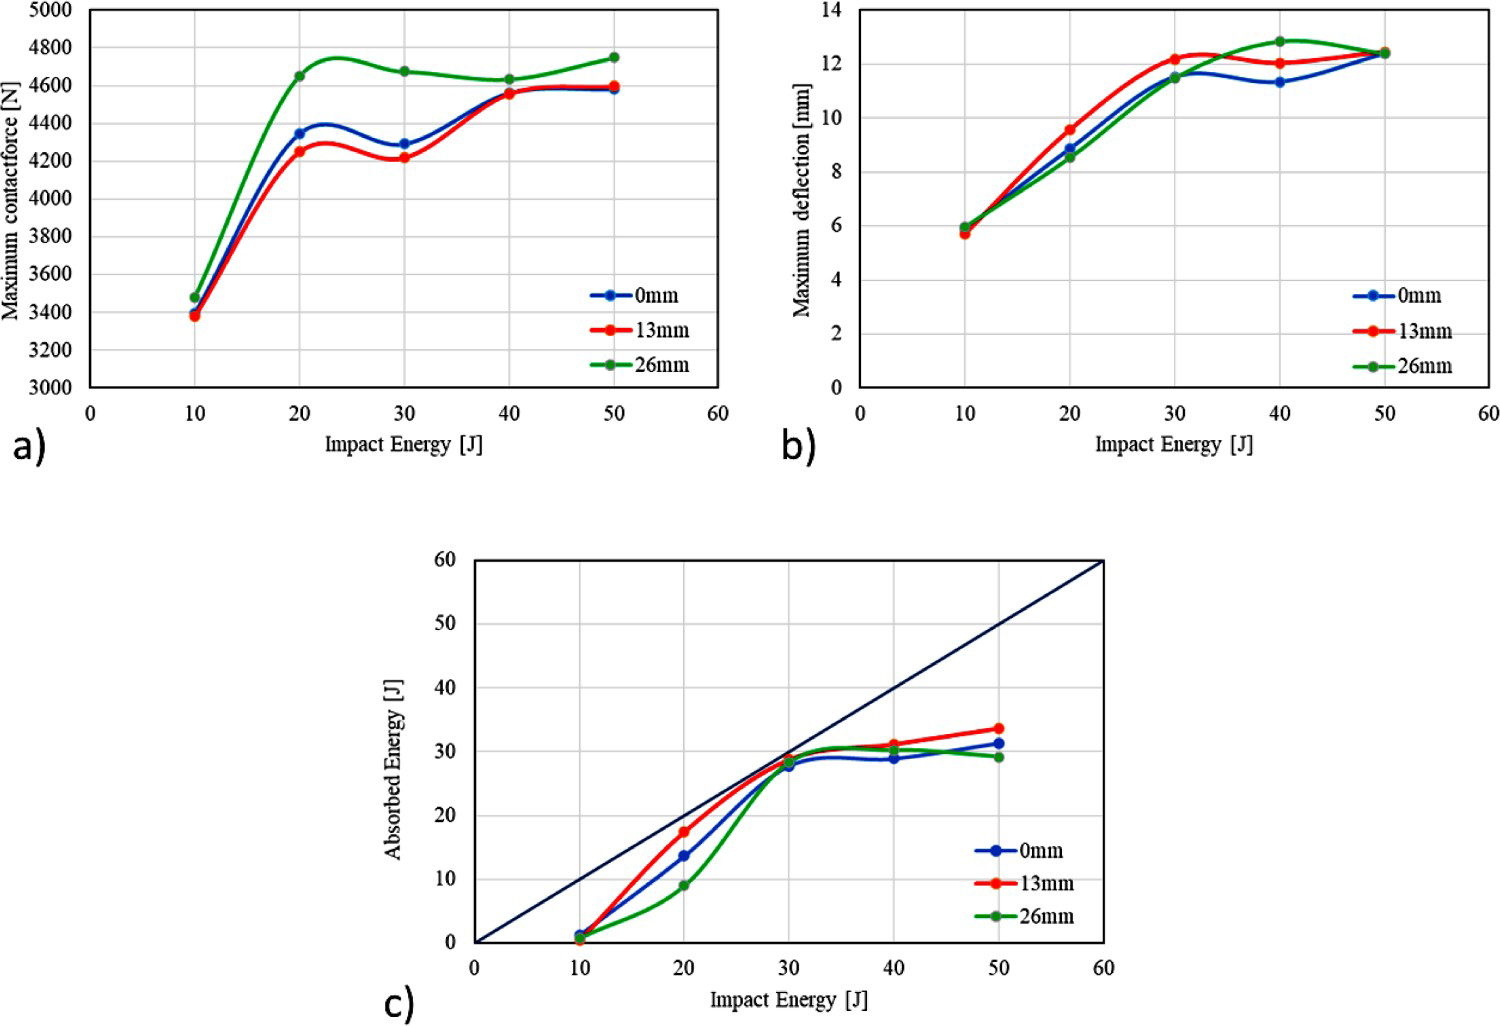
In this section, embedded delaminated specimens with release film material were examined through contact force–deformation, contact force–time and energy–times curves. Data diagrams were obtained from the results of the experiments performed at different energy levels. It should be also noted that the average values were used to examine the results.
Considering the 20 J energy value, it has been observed that there is no perforation case in any specimen since all curves are closed form as seen in Figure 9(a). While the maximum contact force of the specimens with a delamination diameter of 13 and 0 mm is close to each other, it is seen that it is higher in the specimen with a delamination diameter of 26 mm. From Figure 9(b), it can be said that there is no significant difference in the contact force time of the specimens. Moreover, it can be said that the test time to achieve the maximum contact force is close. It was also observed that there was a rebounding situation in all specimens as seen in the energy–time diagrams (Figure 9(c)). Since the specimens do not absorb all the impact energy, most of the remaining energy (elastic energy) is used to bounce off the impactor from the surface, while some of it transformed into frictional energy.
For specimens with embedded release film delamination impacted at 20 J energy level, (a) contact force–displacement curves (b) contact force–time curves and (c) energy–time diagrams.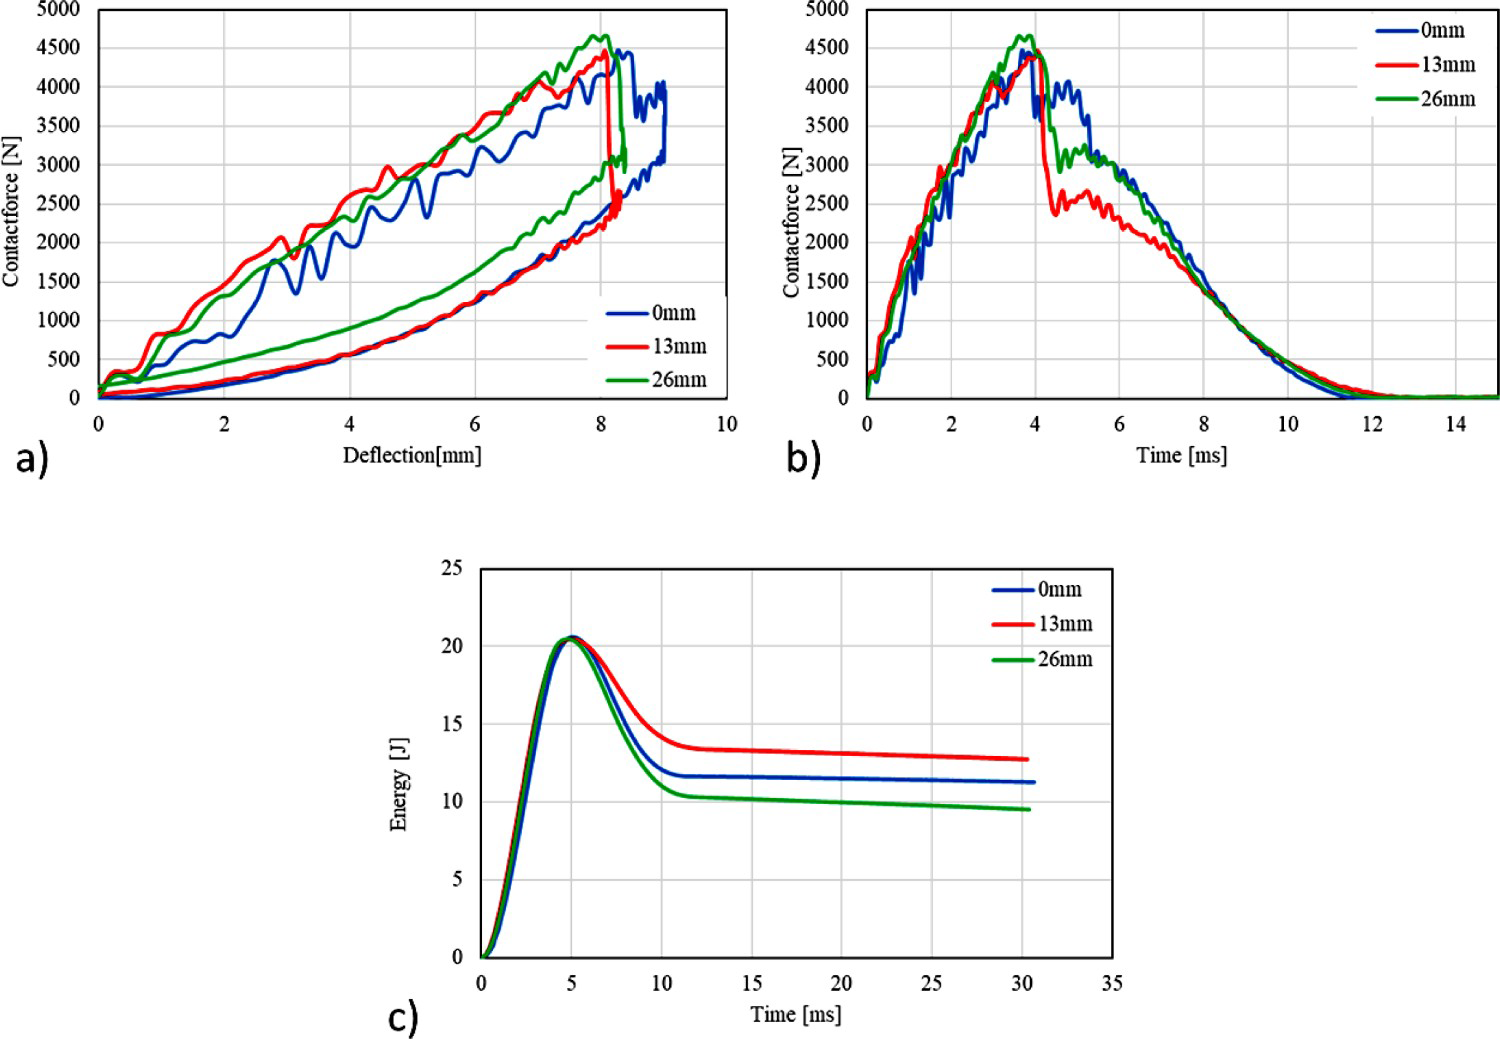
When the 30 J energy value is examined, it is concluded that all of the specimens are perforated since all curves are in the open form as seen in Figure 10(a). It was concluded that the maximum contact force is the highest in the specimen with a delamination diameter of 13 mm, whereas it is lower and close to each other in other specimens. Figure 10(b) shows that the test time of the specimens reach the maximum contact force are close to each other. The energy–time diagrams (Figure 10(c)) clearly shows that the specimen with a delamination diameter of 0 and 26 mm absorbs all the applied impact energy. On the other hand, it was observed that the specimen with a delamination diameter of 13 mm was perforated at the energy level of 25 J.
For specimens with embedded release film delamination impacted at 30 J energy level, (a) contact force–displacement curves (b) contact force–time curves and (c) energy–time diagrams.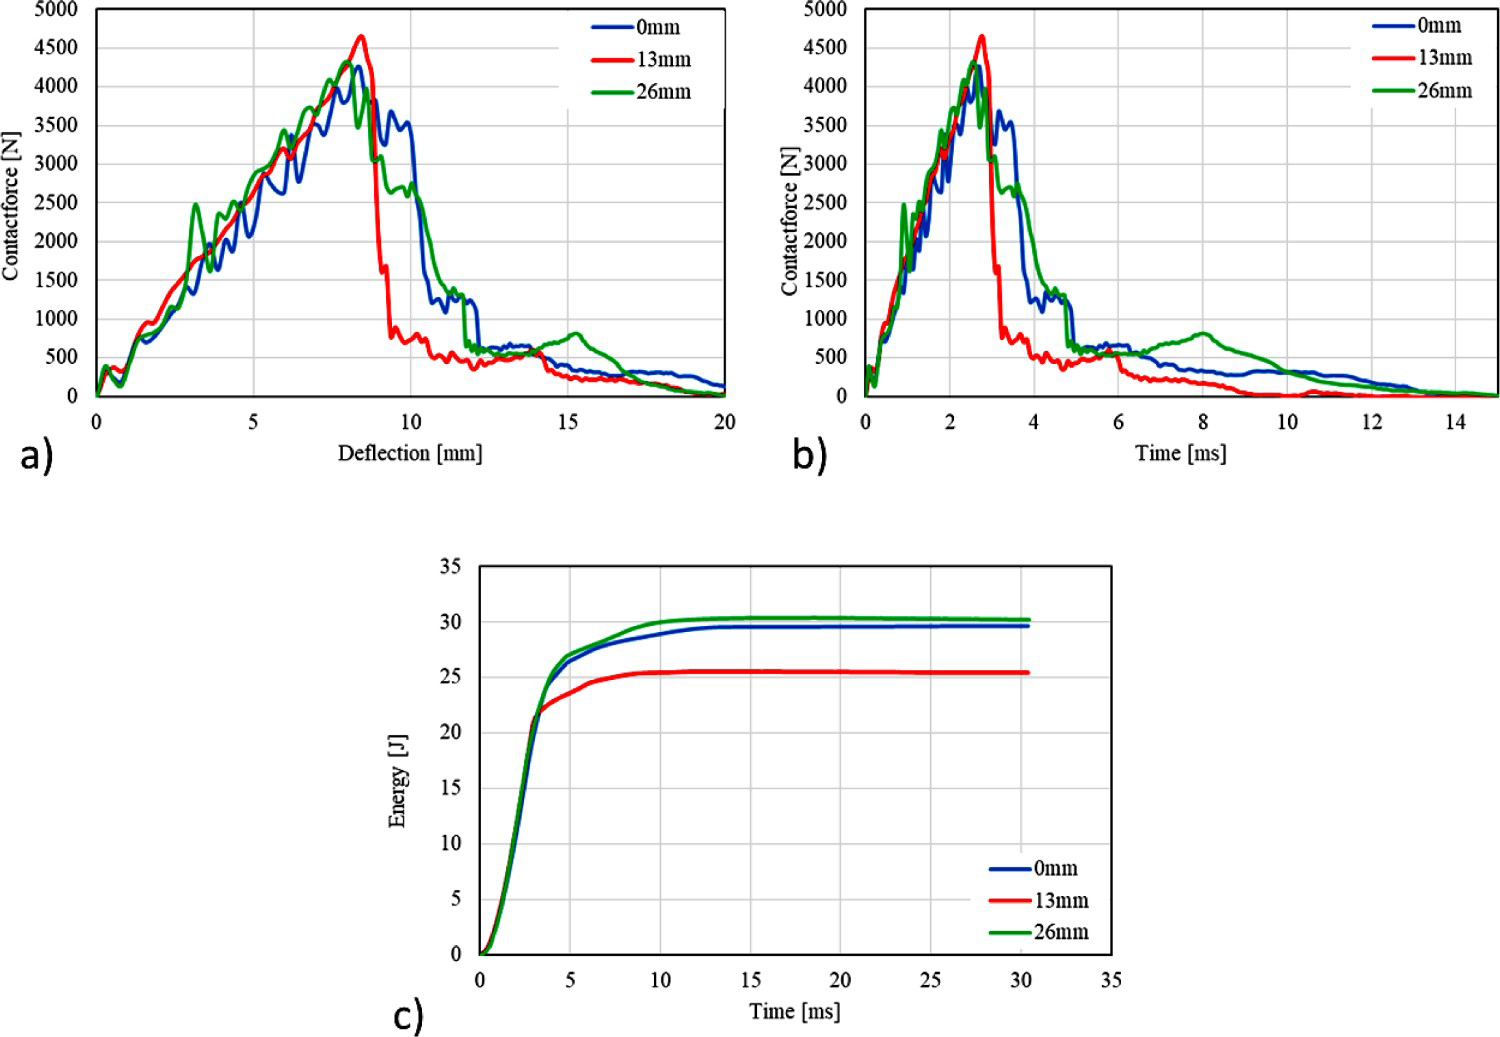
When the diagrams in Figure 11(a,b) are examined for the impact energy level of 40 J, it is seen that the maximum contact force is the highest in the specimen without delamination (pre-undamaged specimen), while it is noticeably lower in the specimen with a diameter of 13 mm. When there is a perforation in the specimen, the contact force value should be zero, but as seen from the curve, the tip of the curve has progressed parallel to the horizontal axis as friction occurs between the specimen and the impactor. From Figure 11(c), it can be said that all specimens absorb as much energy as their perforation threshold. Thus, while the delamination diameter 0 and 26 mm specimens are at 30 J energy level, the other specimen is close to 25 J energy level.
For specimens with embedded release film delamination impacted at 40 J energy level, (a) contact force–displacement curves (b) contact force–time curves and (c) energy–time diagrams.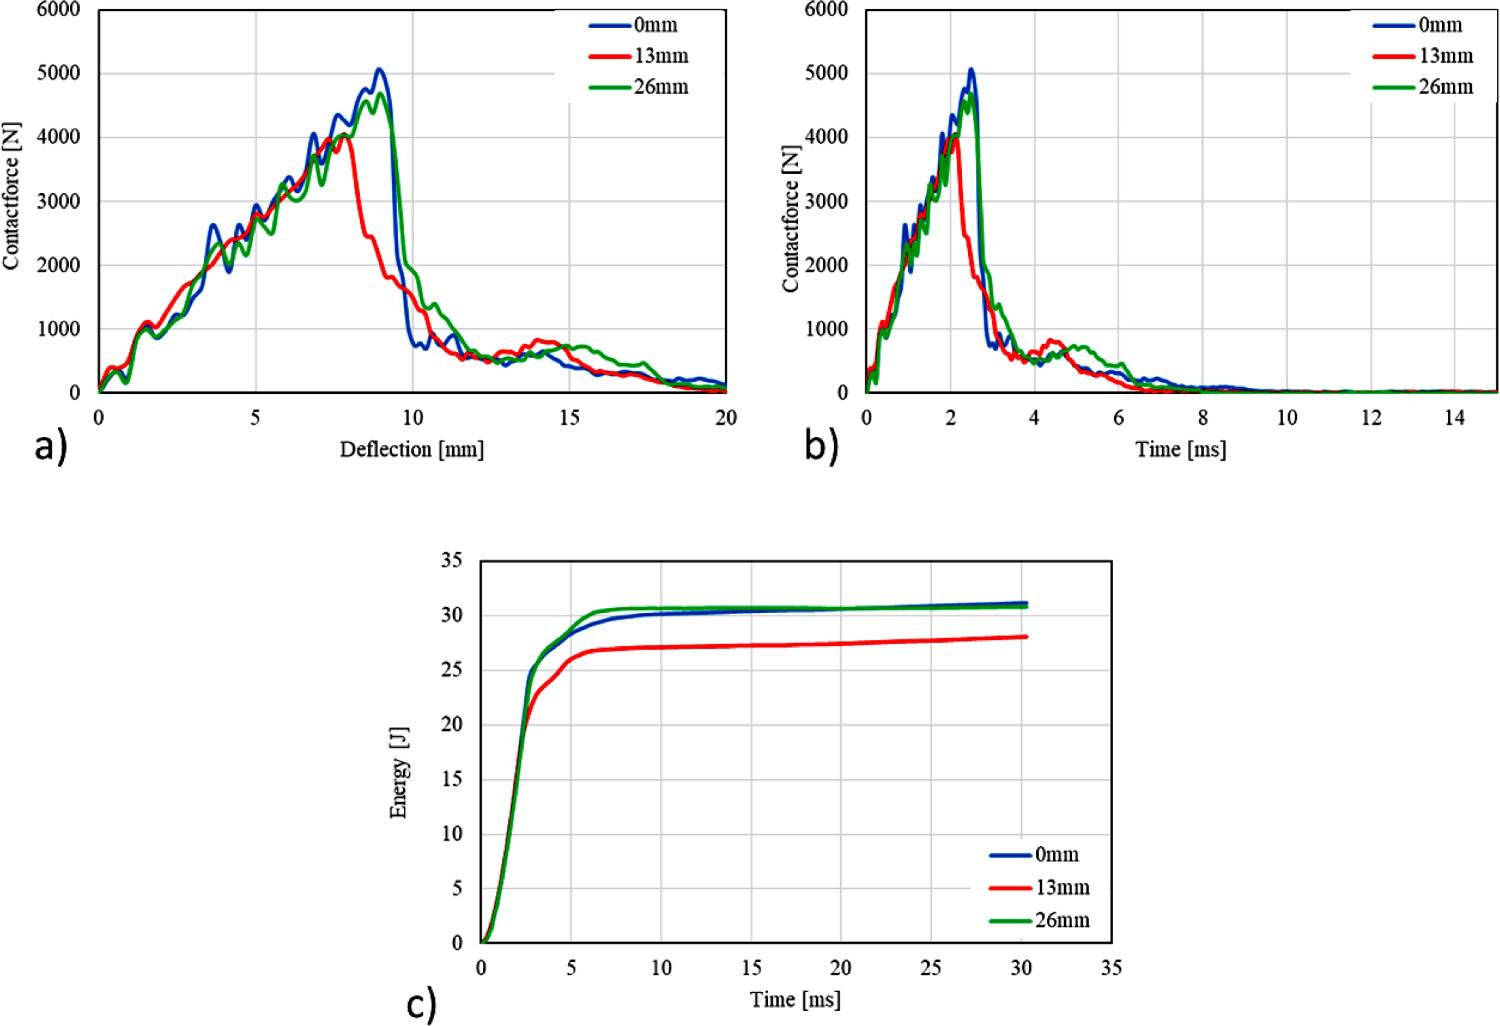
As can be seen from Figures 10 to 12, it was observed that the impact behaviour of specimens with embedded release film delamination affected by impact energy levels between 30 and 50 J, except for an energy level of 50 J, were close to each other. The delamination with 13 mm diameter which was placed on the applied impact energies, prevented the contact between the impactor and the fibres by creating an interface. However, the effect of delamination's diameter change on impact energy at an energy value of 50 J was not clearly seen. This is due to the absence of fibres in the granules where the impactor touches the specimen.
From Figure 12(a,b), the maximum contact forces of the specimens with a delamination diameter of 0 and 13 mm were almost the same, a high increment was observed in the specimen with a delamination diameter of 26 mm. Besides, there is no significant difference in the test time to reach the maximum contact force (peak time). When there is a perforation in the specimen, the force value should be zero, but as seen from the curve, the tip of the curve has progressed parallel to the horizontal axis as friction occurs between the specimen and the impactor. Figure 12(c) shows that the energy absorbed in the specimen without delamination (pre-undamaged specimen) is lower than those of the others. So, it can be said that the material used to create embedded delamination increases the absorption energy of the specimen at 50 J energy levels.
For specimens with embedded release film delamination impacted at 50 J energy level, (a) contact force–displacement curves (b) contact force–time curves and (c) energy–time diagrams.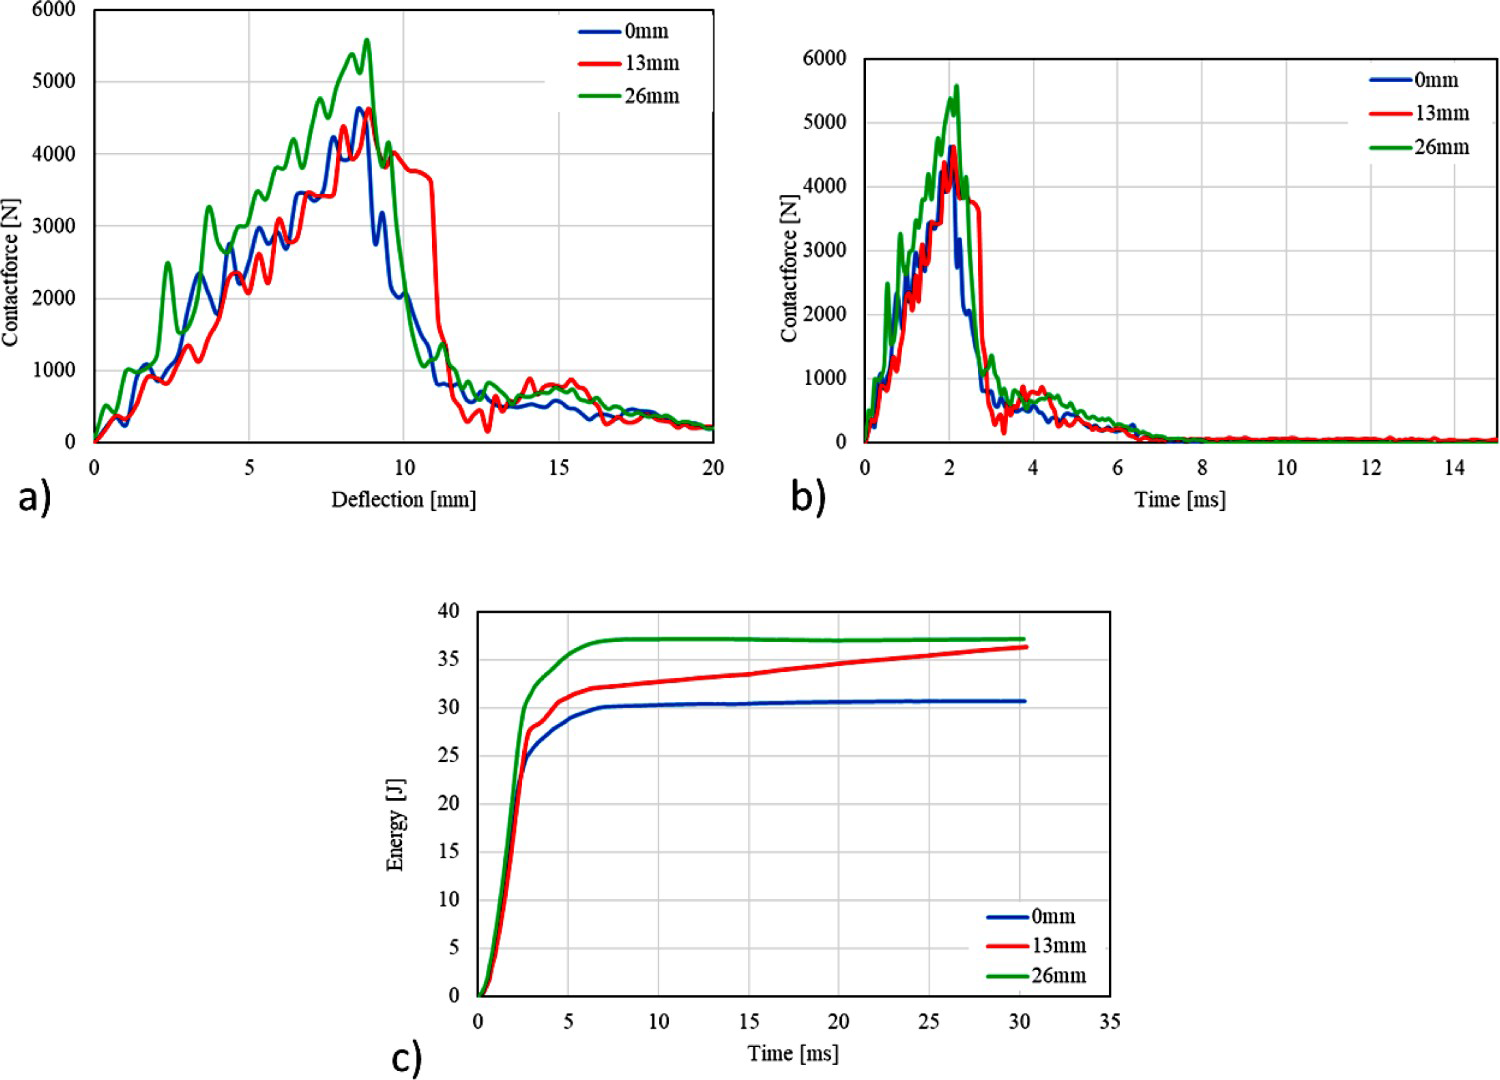
Figure 13 shows the diagrams of the average maximum contact force, average maximum deformation and absorbed energy according to the increasing impact energy of the specimens. Figure 13(a) shows that there is an increase in the maximum contact forces of all specimens from 10 to 30 J. Since the energy value at which all specimens start to be pierced is at an energy level of 30 J, the specimen cannot react to the impactor at this energy level. For this reason, the strength value continues horizontally with increasing energy value. Besides, at 40 and 50 J impact energy levels, specimens with a delamination diameter of 0 and 13 mm have a close maximum contact force, while specimen with a delamination diameter of 26 mm has a higher maximum contact force at 50 J. Hence, the increase in the delamination diameter of the specimen at the same energy level did not make a significant difference. From Figure 13(b), it can be said that all specimens data close to each other and almost linear curves up to 30 J energy level. At 40 J energy level, delaminated specimens are close to each other and have higher maximum deformation values than pre-undamaged specimen. It appears that different delamination diameters placed at the interfaces at low energy levels do not have an effect on the displacement caused by the impactor on the specimen. A similar result was also emphasised in the study conducted by Sabancı and Karakuzu [22]. From Figure 13(c), it is seen that there is an increase in the absorbed energy of all specimens up to 30 J energy level. After the perforation energy level, close curves advanced in the horizontal direction. It is concluded that the impactor bounces back at all impact energies of specimens with different delamination diameters applied up to the impact energy level of 30 J, thus the energy is absorbed. After 30 J impact energy level, the impactor gets stuck in the specimen. Thus, the absorbed energy value moves almost horizontally since the energy cannot be absorbed.
For specimens with embedded release film delamination impacted at 10–50 J energy levels, (a) maximum contact force–impact energy curves (b) maximum contact force–impact energy curves and (c) absorbed energy–impact energy curves.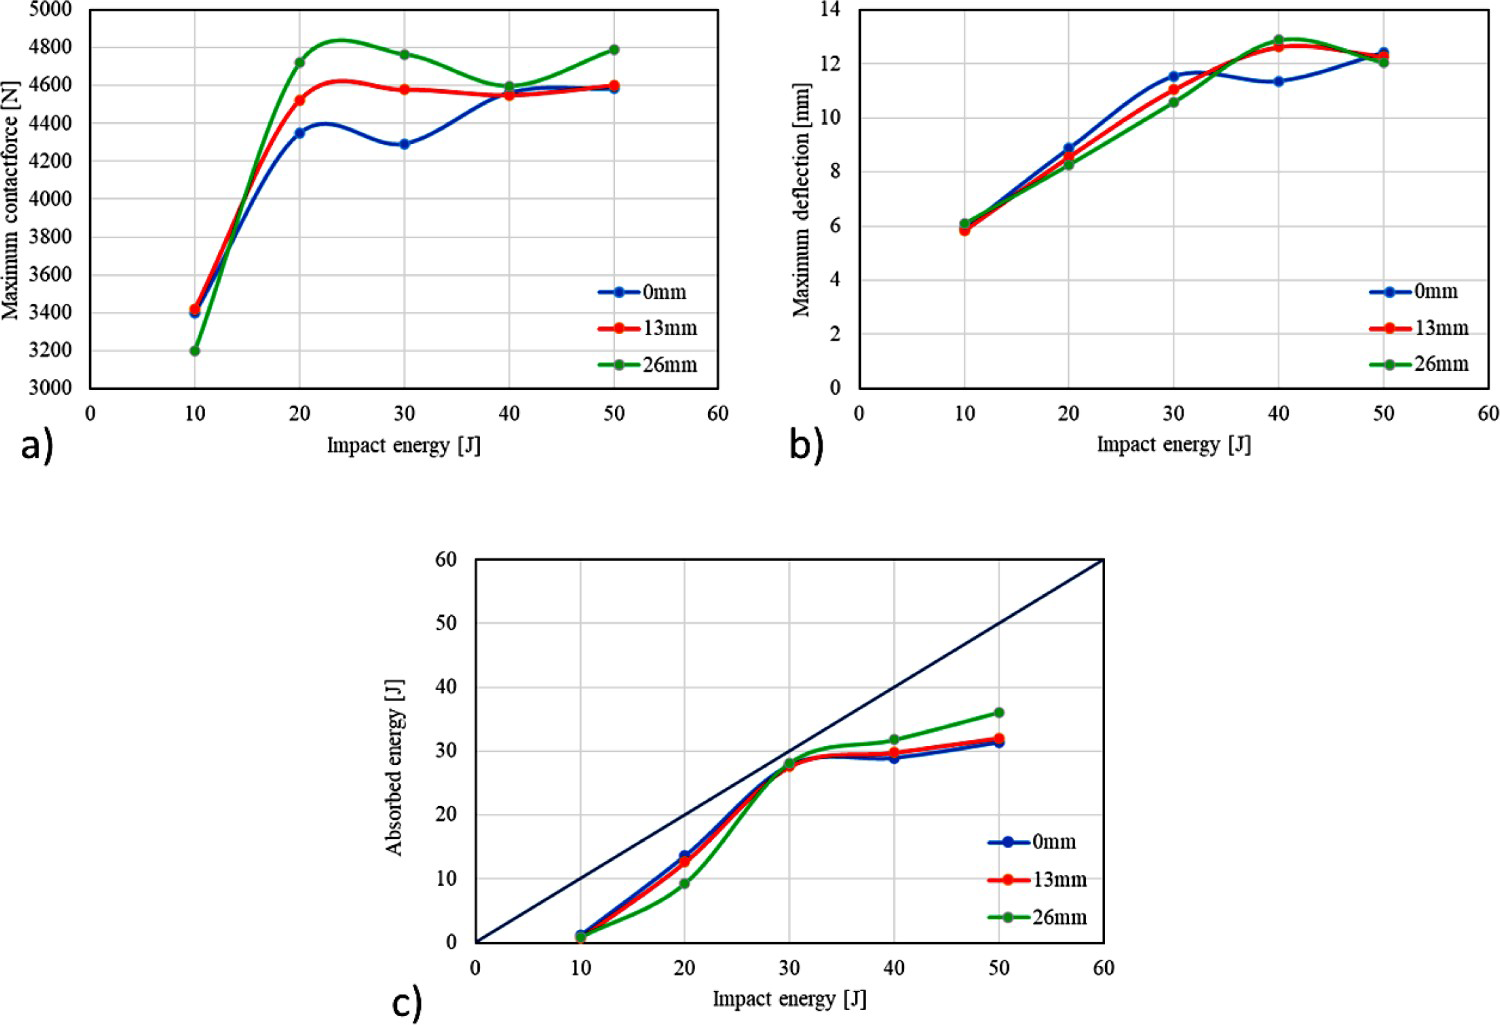
This study aims to investigate the effects of embedded delamination material (i.e. vacuum bag and release film) and delamination diameter (13 and 26 mm) in GF-reinforced thermoplastic composites on the low-velocity impact loadings. The specimens were produced E-GF-reinforced thermoplastic materials with and without embedded delamination materials. Single impact tests are performed on those specimens. Damage process of the specimens is examined and compared for the delamination material and delamination diameter through force–deflection (F–D), force–time (F–T) and equal energy diagrams. Having conducted low-velocity impact tests on the thermoplastic composites the following major conclusions can be summarised from the investigation as follows:
Rebounding case was observed in all specimens manufactured with and without delamination materials at an impact energy levels of 10 and 20 J. The un-delaminated and embedded delaminated thermoplastic specimens were perforated by the impactor under the applied impact energy level of 30 J. In the absorbed energy with increasing impact energy, no significant difference was observed between embedded delaminated specimens and un-delaminated specimens. A decrease in the maximum contact force was observed in the 13 mm delaminated specimens manufactured by vacuum bag material when compared to the other specimens. It was observed that the maximum contact force was greater in all specimens with an embedded delamination diameter of 26 mm compared to other specimens. When the different delamination materials placed in the specimens were compared at similar impact energies, it was seen that the release film had a more positive effect on the impact characteristics of the specimens than the vacuum bag.
From the above conclusions, it can be said that the delamination diameter has notable effects on the impact behaviour of the thermoplastic composite structures. Besides, although the current experimental study substantially contributes to the knowledge of the thermoplastic composites, new possible investigations are required to be performed; especially, to investigate the effects of temperature, i.e. high temperature. Moreover, different embedded delamination material and delamination diameter would be an interesting study for future researchers.
Footnotes
Data availability statements
The datasets generated during and/or analysed during the current study are available from the corresponding author on reasonable request.
Disclosure statement
No potential conflict of interest was reported by the author(s).