
Abstract
This is a statistical study of the dynamic humidity diffusion through the polyester/glass fibre composite. It analyses the influence of the environmental conditions like the temperature, the flow velocity and the pressure on the humidity diffusion through the composite material. It is divided into an experimental plan and a data analysis, which exploit the experimental results in order to analyse the process of humidity diffusion by highlighting the effects of the influencing parameters. The increase in the temperature, the pressure, the flow velocity and the percentage of fillers additives (ASP400) induce an augmentation in the diffusion coefficient and the amount of absorbed humidity. We can affirm that the flow velocity and the pressure have a higher impact on the diffusion parameters than the temperature. Moreover, the increase in the percentage of the fillers additives (ASP400) decreases the effect of the pressure and the flow velocity on the diffusion parameters.
Introduction
Composite materials present advantages such as a decent resistance to chemicals, an ease of handling, a low viscosity and a low humidity absorption at environmental conditions. As a result, they are highly utilised in the industrial field. While, environmental conditions, like the temperature, the humidity and the flow velocity, have negative effects on the composite materials. It decreases the material properties and its life duration.
The humidity diffusion through the composite material process can be characterised by the free volume theory: the numbers and the sizes of the free volumes, existing in the composite material, determine the amount of the absorbed humidity [1, 2]. In addition, the molecular approach, based on the hydrophilic character of the composite material, is utilised: the hydrophilic sites bonds to the humid molecules, through hydrogen bonds [1].
The humidity absorption has a negative effects on the composite material properties: the fibres resistance and the transition temperature (Tg) decrease [3, 4]. Furthermore, a debonding on the fibre/matrix interface is noted, which could allow the creation of a micro-crack in the composite material [5, 6]. Also, the matrix undergoes a plasticisation [1].
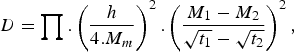
The humidity diffusion phenomena is characterised by two parameters: the amount of absorbed humidity at saturation (Mm) and the diffusion coefficient (D). The diffusion coefficient, influenced by the temperature [7, 8], is presented as follows [9, 10]:
The humidity diffusion is influenced by some environmental parameters such the pressure, the temperature and the flow velocity. In fact, the researches of Pollard et al. [10] proved that the increase in the diffusion coefficient and the amount of absorbed humidity is a result of the augmentation in the exposed pressure to the composite material. Similarly, the rise in the pressure induces an elevation in the diffusion parameters through the polyester/glass fibre composite [11, 12]. In addition, Hamidi et al. [13] affirmed that the acceleration of the diffusion process, manifested by the increment in the diffusion coefficient and the amount of absorbed humidity, is in the interest of the extension in the pressure. Also, the humidity diffusion is influenced by the temperature: Ben Daly et al. [14] and Ounaies et al. [15] demonstrated that the raise in the temperature generates an acceleration of the diffusion process, as a result the amount of absorbed humidity and the diffusion coefficient through the polyester glass fibre composite increase. In fact, the rise in the temperature offers more agitation to the diffusing molecules [16], which facilitates the humidity diffusion. Moreover, Carrascal et al. affirmed that the expansion in the temperature causes the improve in the diffusion coefficient [17]. Furthermore, the flow velocity has an impact on the humidity absorption procedure: Davis et al. [18] approved that the increase in the flow velocity causes an increment in the diffusion coefficient. As far as, Pilli et al.[19] and Humeau et al. [20] showed that the raise in the flow velocity induces the humidity diffusion phenomena acceleration. The research of Zhang et al. [21] revealed that using the obtained regression equation, the temperature has a high influence on the diffusion process, especially for diffusion velocity.
Moreover, the humidity diffusion is affected by the type and the volume fraction of the filler of the composite material. In fact, Sugiman et al.[22] showed that the amount of absorbed humidity is higher in the case of the cement filler than the CaCO3 and the Fly ash fillers. Also, the rise in the volume fraction of the cement filler increases the quantity of the absorbed humidity contrarily to the CaCO3 and the Fly ash fillers. Furthermore, Sugiman et al. [23] confirmed the influence of the microstructure and the fillers type on the hygrothermal behaviour of the composite material.
As the composite materials are characterised by their resistance to degradation due to water absorption, the current work focuses on studying the resistance to humidity diffusion of the polyester/fibreglass composites subjected to different water immersion conditions.
Material and experimental procedure
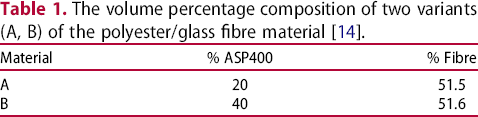
Material
The volume percentage composition of two variants (A, B) of the polyester/glass fibre material [14].
Experimental procedure
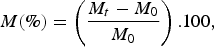
Two experimental devices have been utilised to characterise the effect of the flow velocity and the pressure. Regularly, the absorption process is stopped and the sample is removed from the experimental device. Then, the sample is dried with an absorbed paper and weighed with a Gibertini E-42-B electronic scale with an accuracy of 0.1 mg. Then, it is put back in the assembly and the process starts again. The humidity content is calculated by the following formula:
Flow velocity effect
As showed in Figure 1, the water inside the container is heated and maintained to the desired temperature, 45°C and 65°C, using a heating resistance. The water flow, pumped by the pump, is controlled by a flow meter. The used flow velocity, 0.77 and 8.17 m s−1, are kept fixed by means of the pump. The PVC pipes are 8 m length and are covered with an insulating layer in order to ensure a constant temperature. The samples are placed in the sample holder. The experimental procedure lasts seven months.
Experimental device for the flow effect.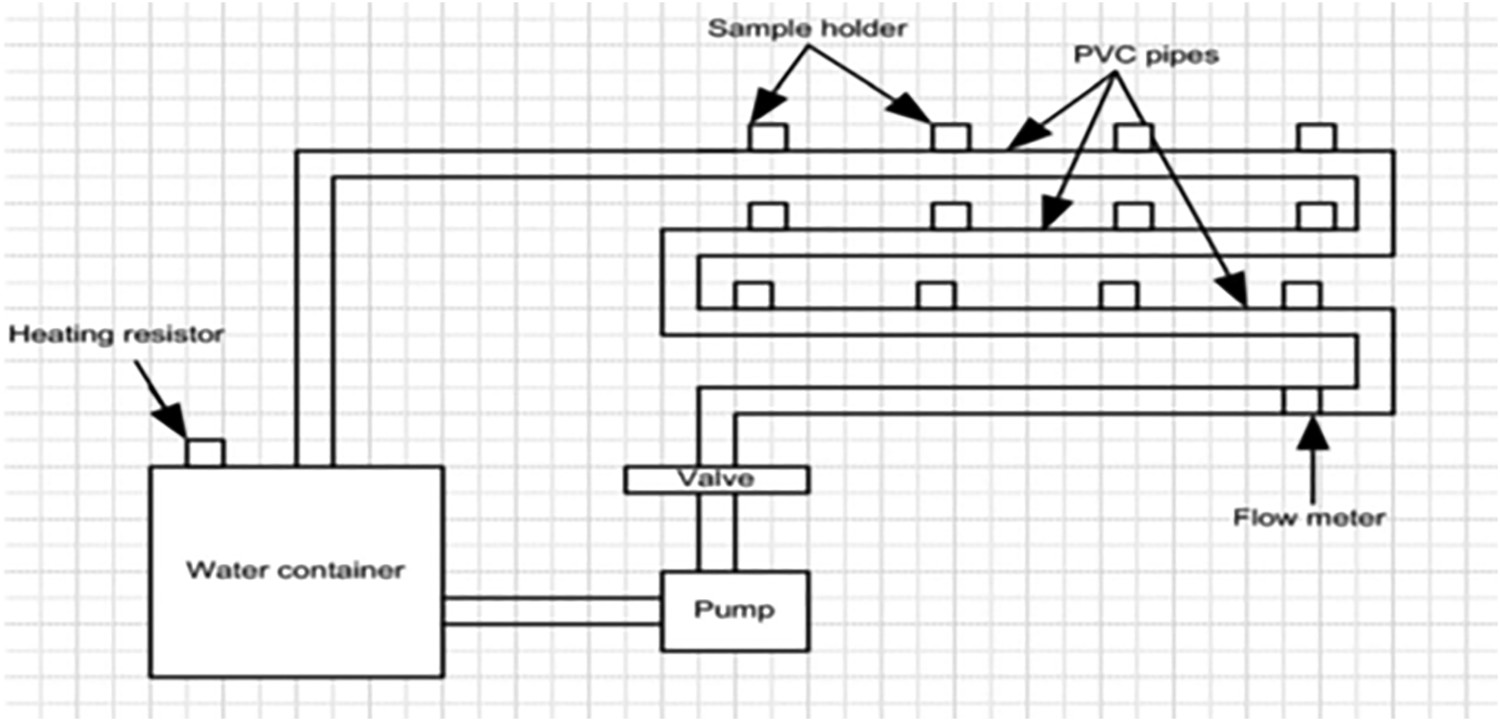
Figure 2, a sectional view of the experimental device, presents the disposition of the samples inside the sample's holder. The PVC pipes present different diameters (63, 75, 90 mm), for the purpose of varying the flow velocity.
A sectional view of the experimental device.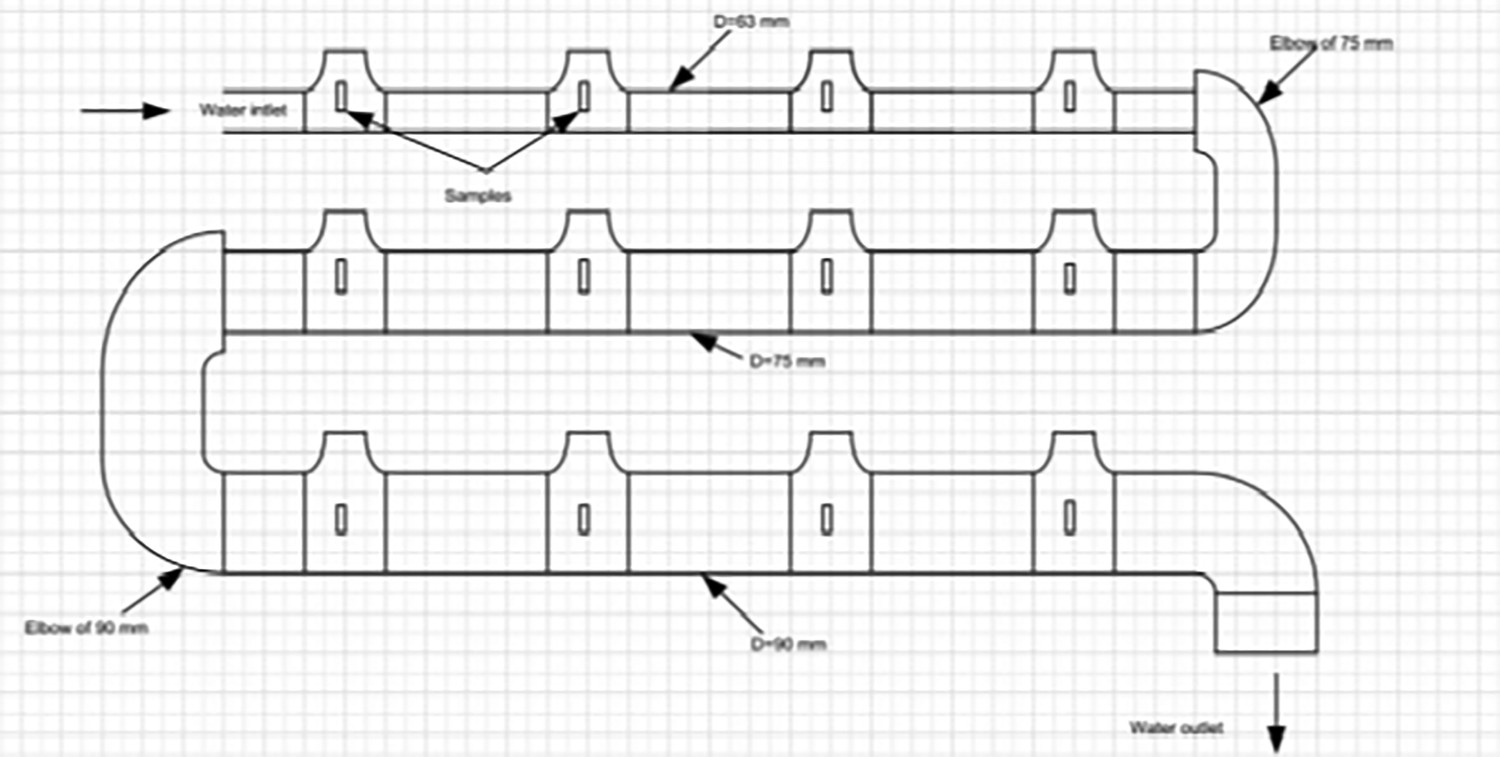
The pressure effect
As illustrated in Figure 3, the sample is exposed to humidity through one lateral side. The container is filled with water through the filling funnel. Then, the sample is placed. A pressure of 2 and 50 bars is applied to the sample through the piston and it is variated using the handle of the device. The applied pressure is displayed on the manometer. The water inside the container is heated to the desired temperature, by means of a heating resistor. The experimental procedure lasts seven months.
Components of the experimental device for the pressure effect.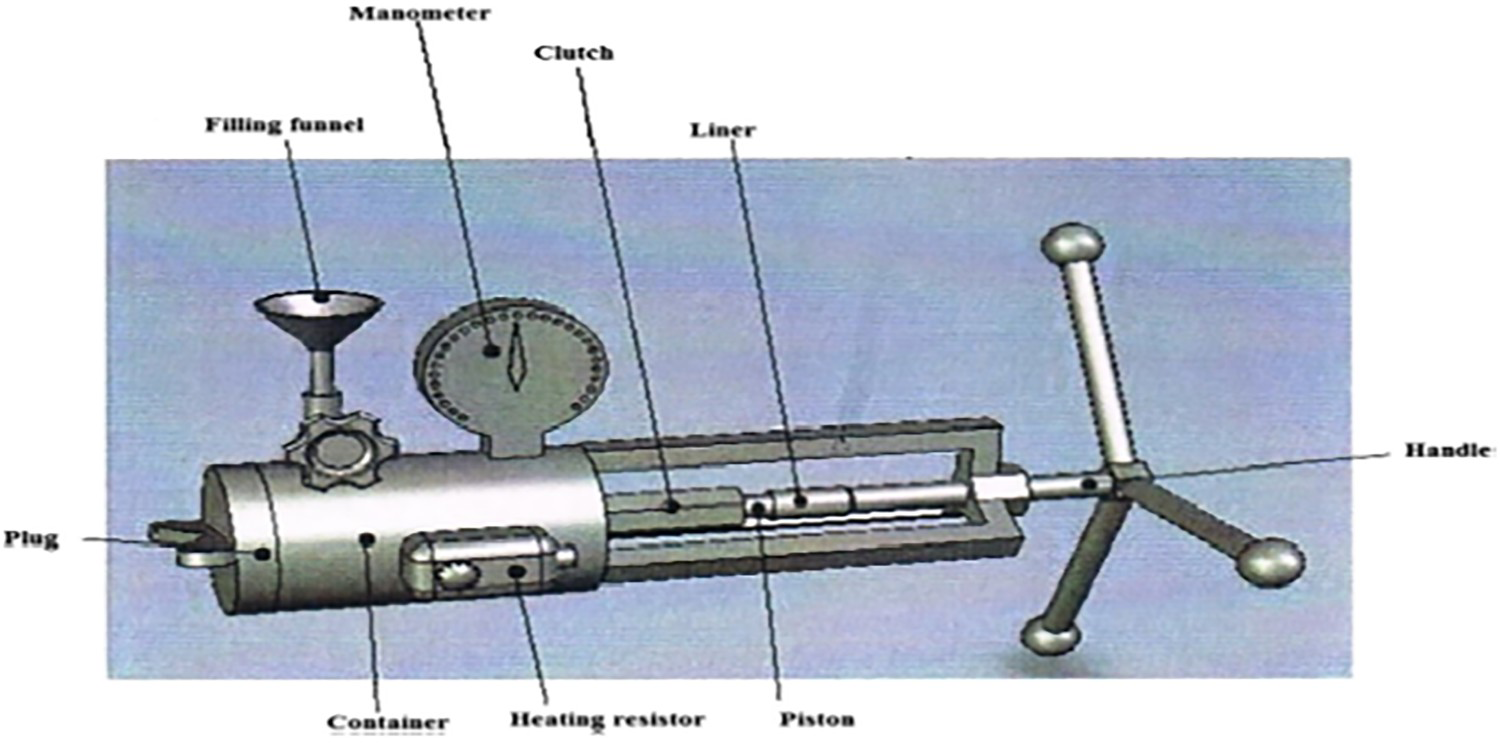
Results and discussion
In this section, we present the experimental results of the humidity diffusion under the temperature, the flow velocity and the pressure effects. Then, in order to present the influence of the environmental parameters on the diffusion coefficient and the amount of absorbed humidity, an experimental plan and a data analysis are generated.
Experimental plan
In order to manage the effect of the three parameters: the temperature, the flow velocity and the pressure, an experimental plan has been prepared. It determines the effect of each parameter and the interactions between the factors. The experimental plan also makes it possible to identify a favourable protocol, that is to say to foresee the level of adjustment of the factors which have an effect on the responses. The humidity diffusion is tested, for materials (A) and (B), in the following cases:
The temperature /the flow velocity The temperature/the pressure
The temperature/the flow velocity
Experimental results of the humidity diffusion through materials (A) and (B).
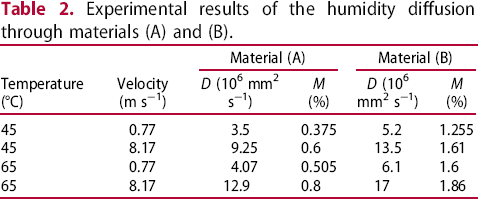
The increase in the temperature causes an augmentation in the diffusion coefficient as it offers more mobility to the diffusing molecules, which facilitates the diffusion phenomena. In addition, the rise in the flow velocity increases the flow diffusing through the composite material and the amount of absorbed humidity. Moreover, material (B) absorbs a higher amount of humidity than material (A), in fact, the elevation in the percentage of the fillers additives (ASP400) generates a decrease in the rigidity of the matrix/fibre interface, causing the raise in the diffusion parameters: the diffusion coefficient and the amount of absorbed humidity.
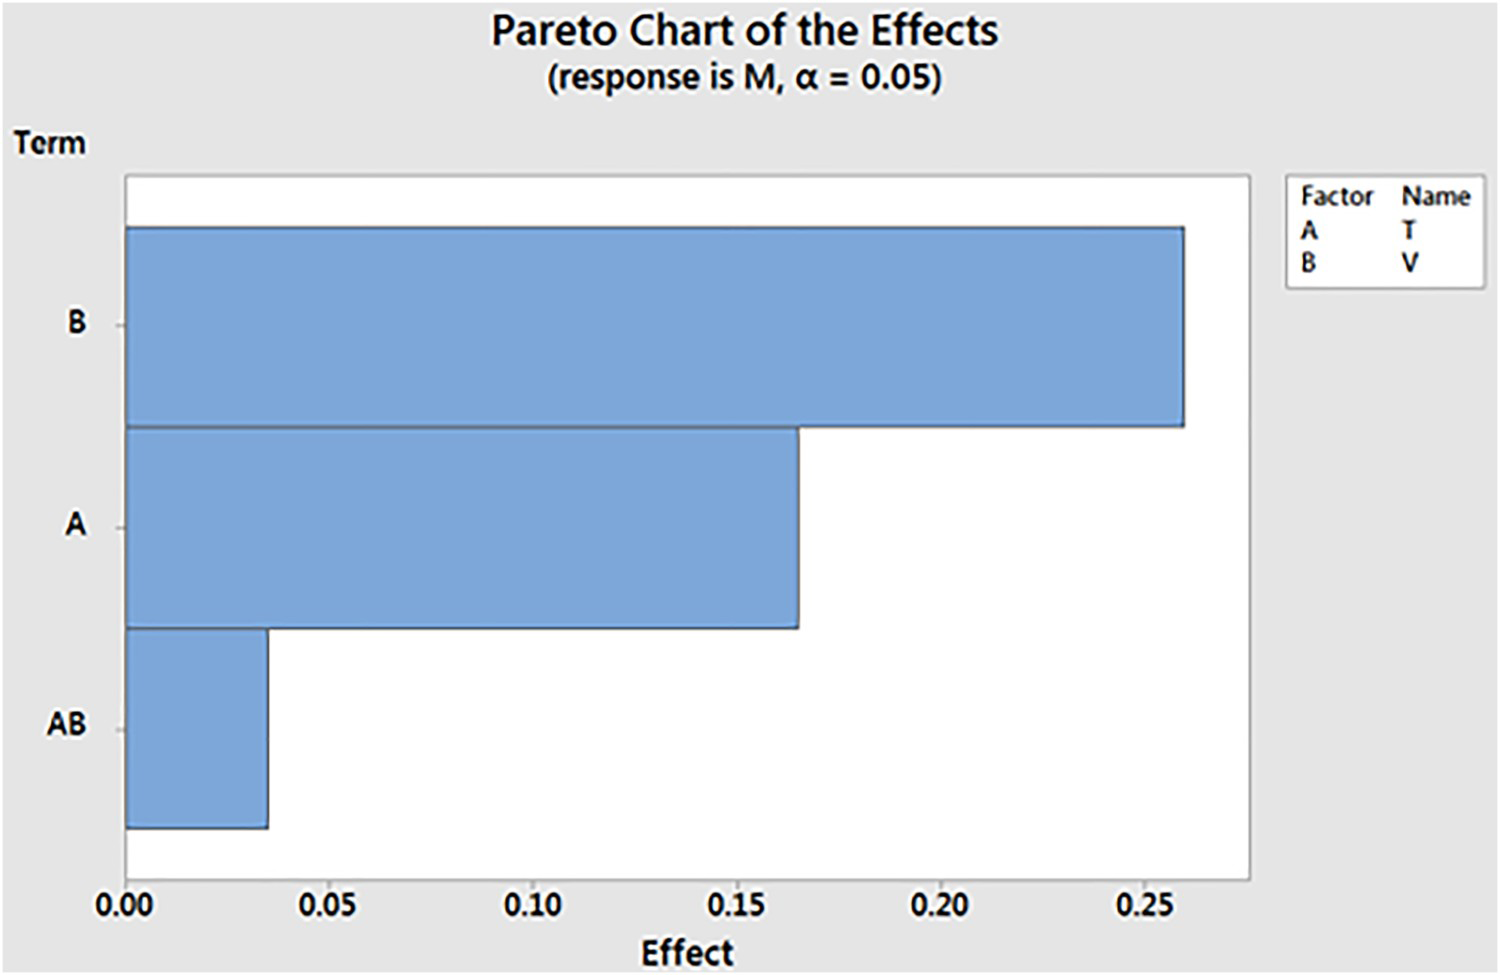
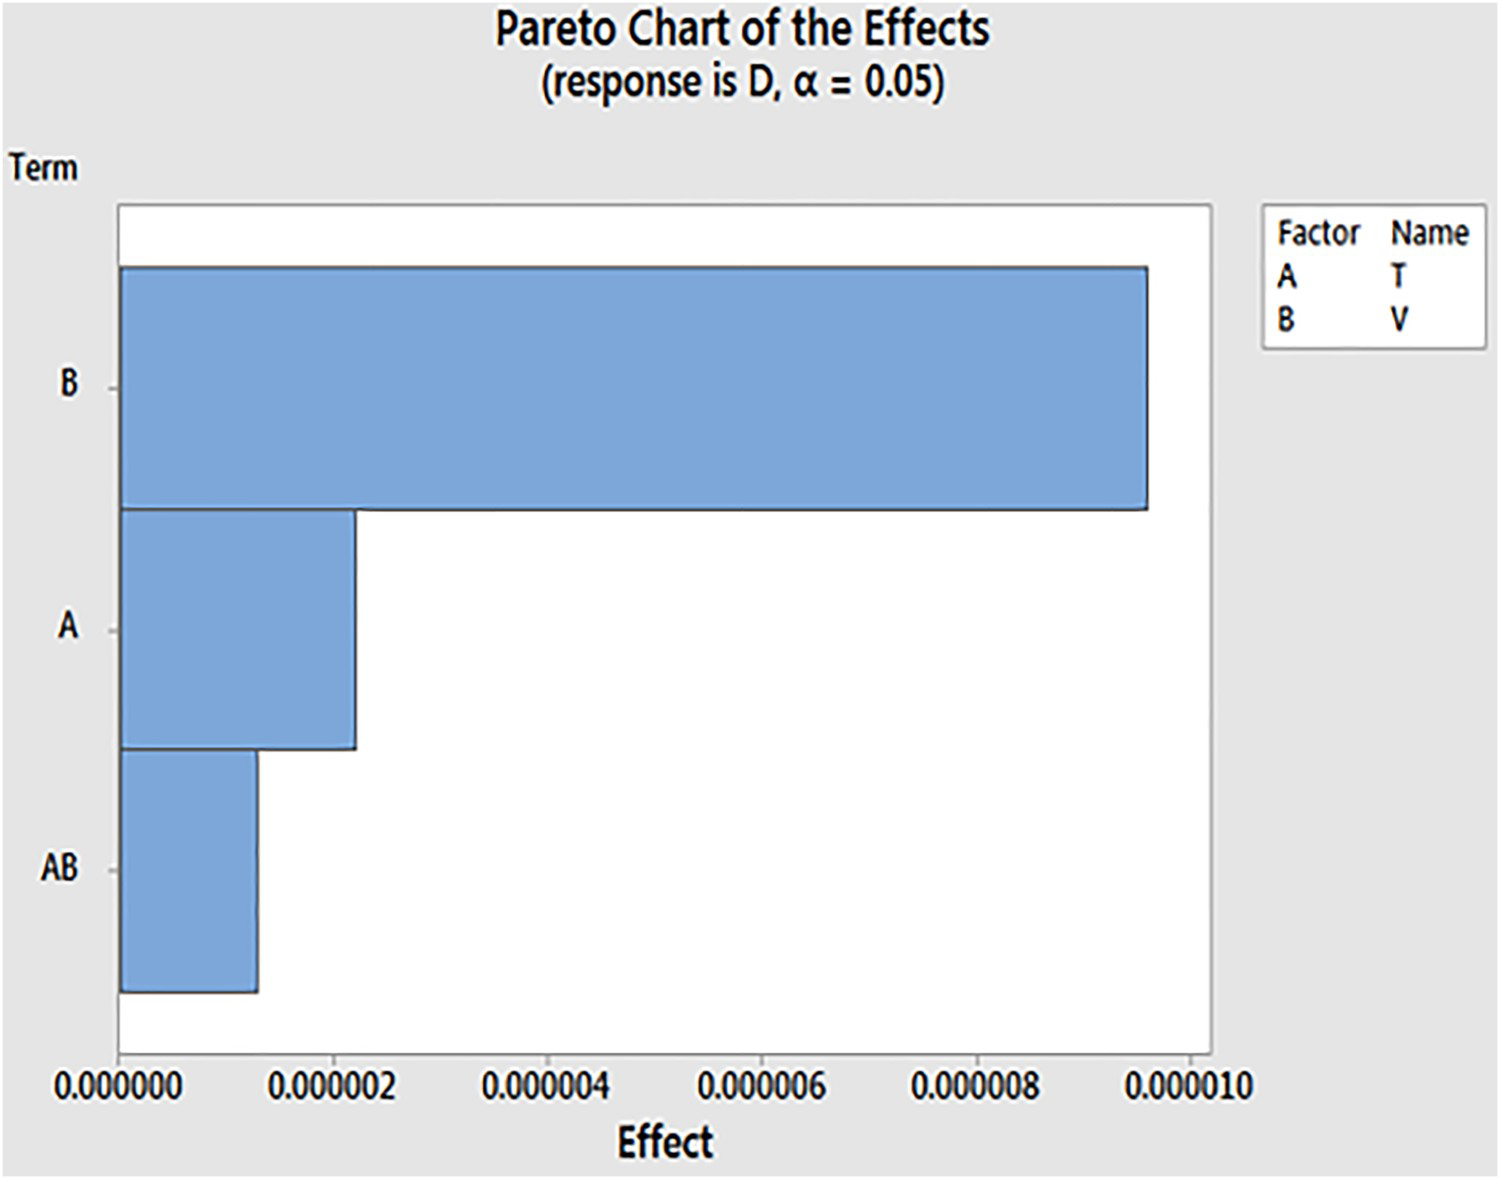
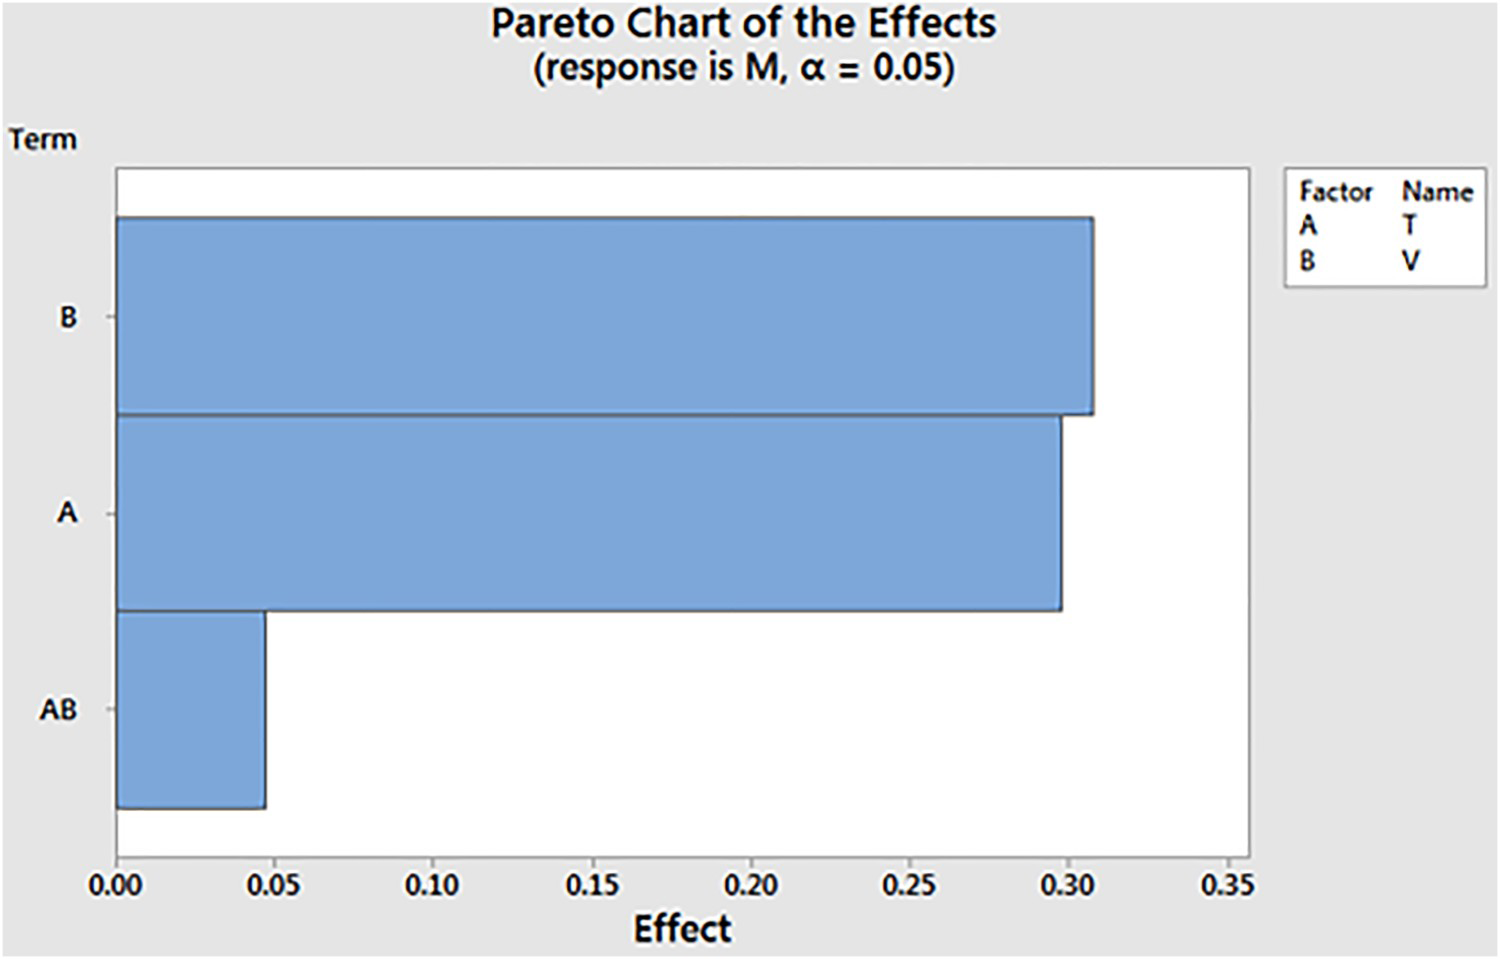
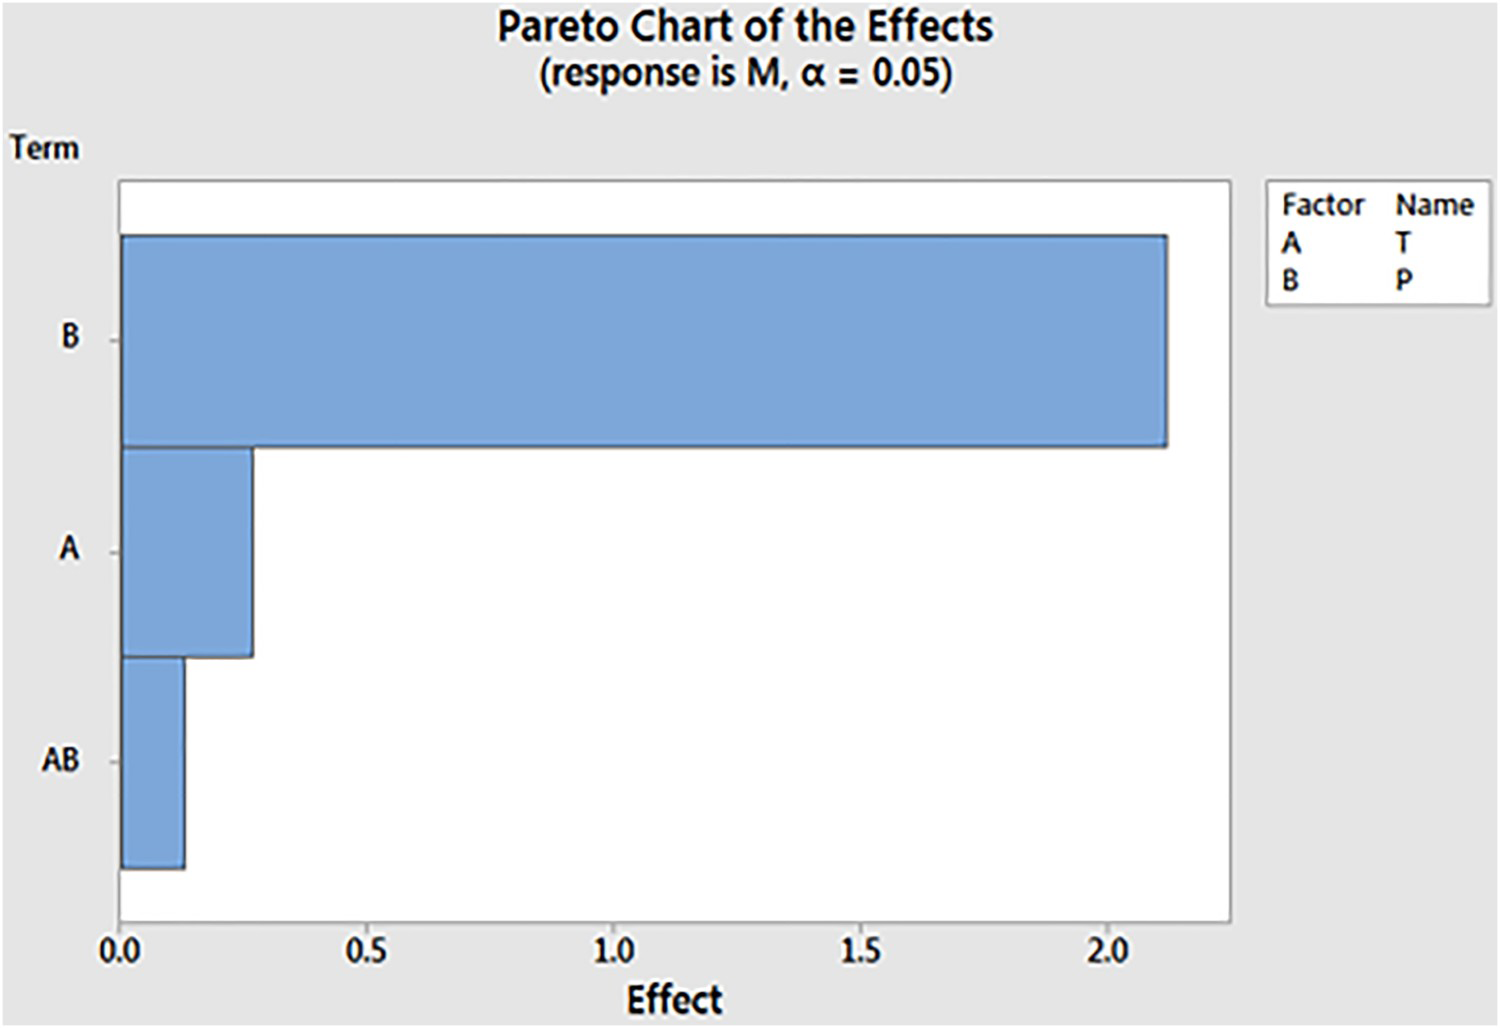
In order to create an experimental plan, the Minitab software has been used. The outputs are the diffusion coefficient (D) and the amount of absorbed humidity (M). The pareto diagram for material (A), presented in Figures 4 and 5, affirmed that the diffusion parameters (D, M) are influenced in the following order: the flow velocity, the temperature and the temperature/flow velocity: in fact, the rise in the speed of the flow facilitates the humidity diffusion. For material (B), as presented in Figures 6 and 7, the diffusion coefficient presents a similar order to material (A), as long as the temperature and the velocity have almost a similar effect on the amount of absorbed humidity. Effectively, the expansion in the percentage of the fillers additives (ASP400) decreases the rigidity of the composite material, which increases the effect of the diffusing flow. We can affirm that the humidity diffusion through the composite material is highly influenced by the flow velocity than the temperature.
Pareto chart of effects for the diffusion coefficient of material (A). Pareto chart of effects for the amount of absorbed humidity of material (A). Pareto chart of effects for the diffusion coefficient of material (B). Pareto chart of effects for the amount of absorbed humidity of material (B).
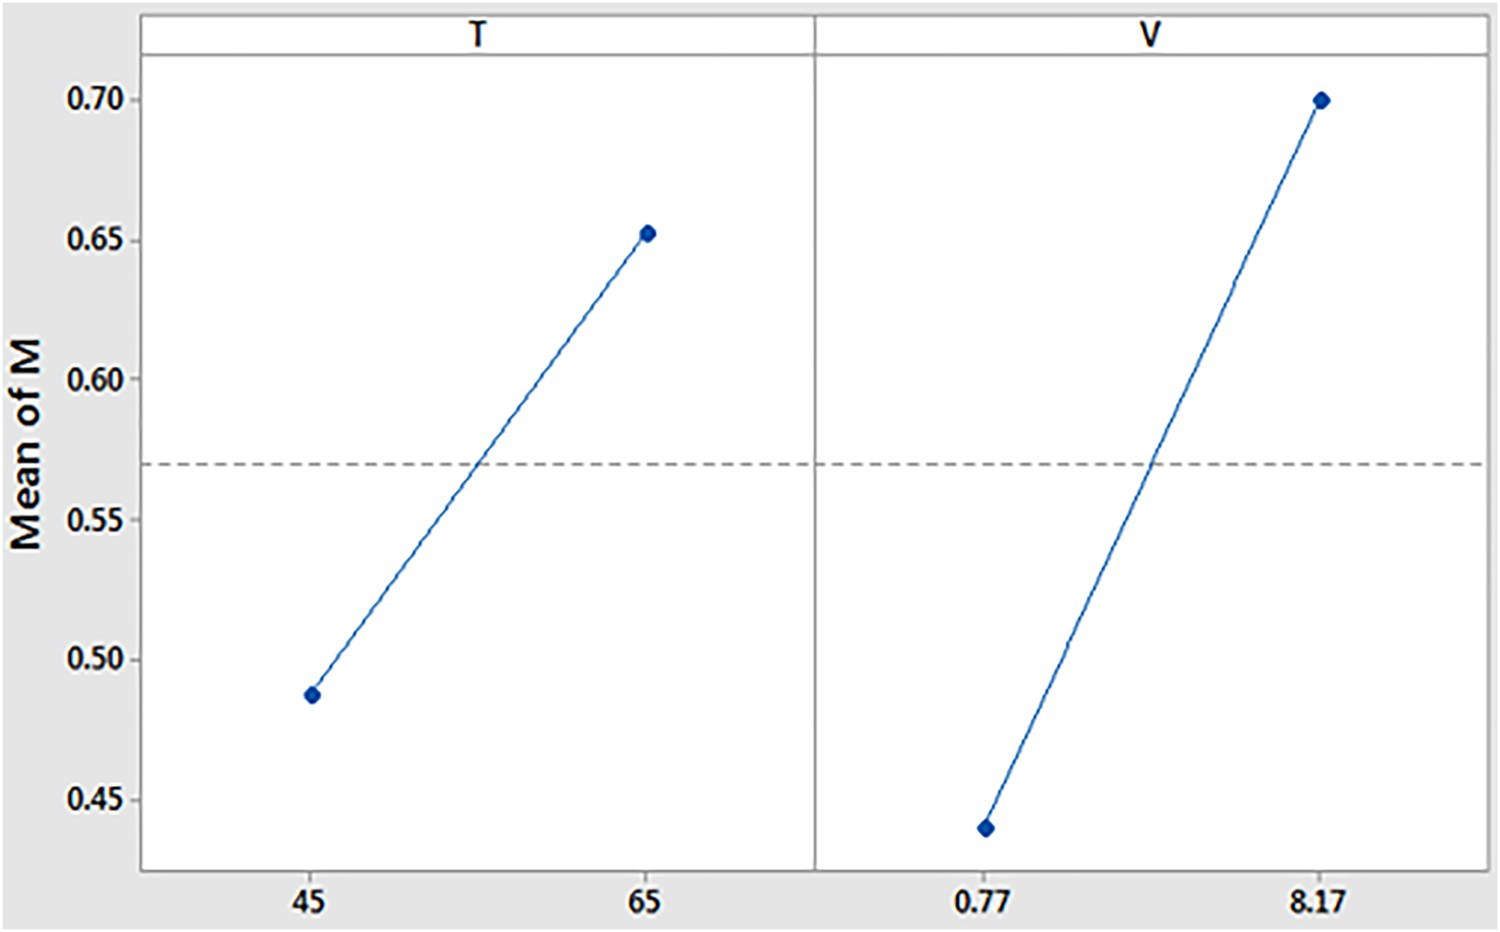
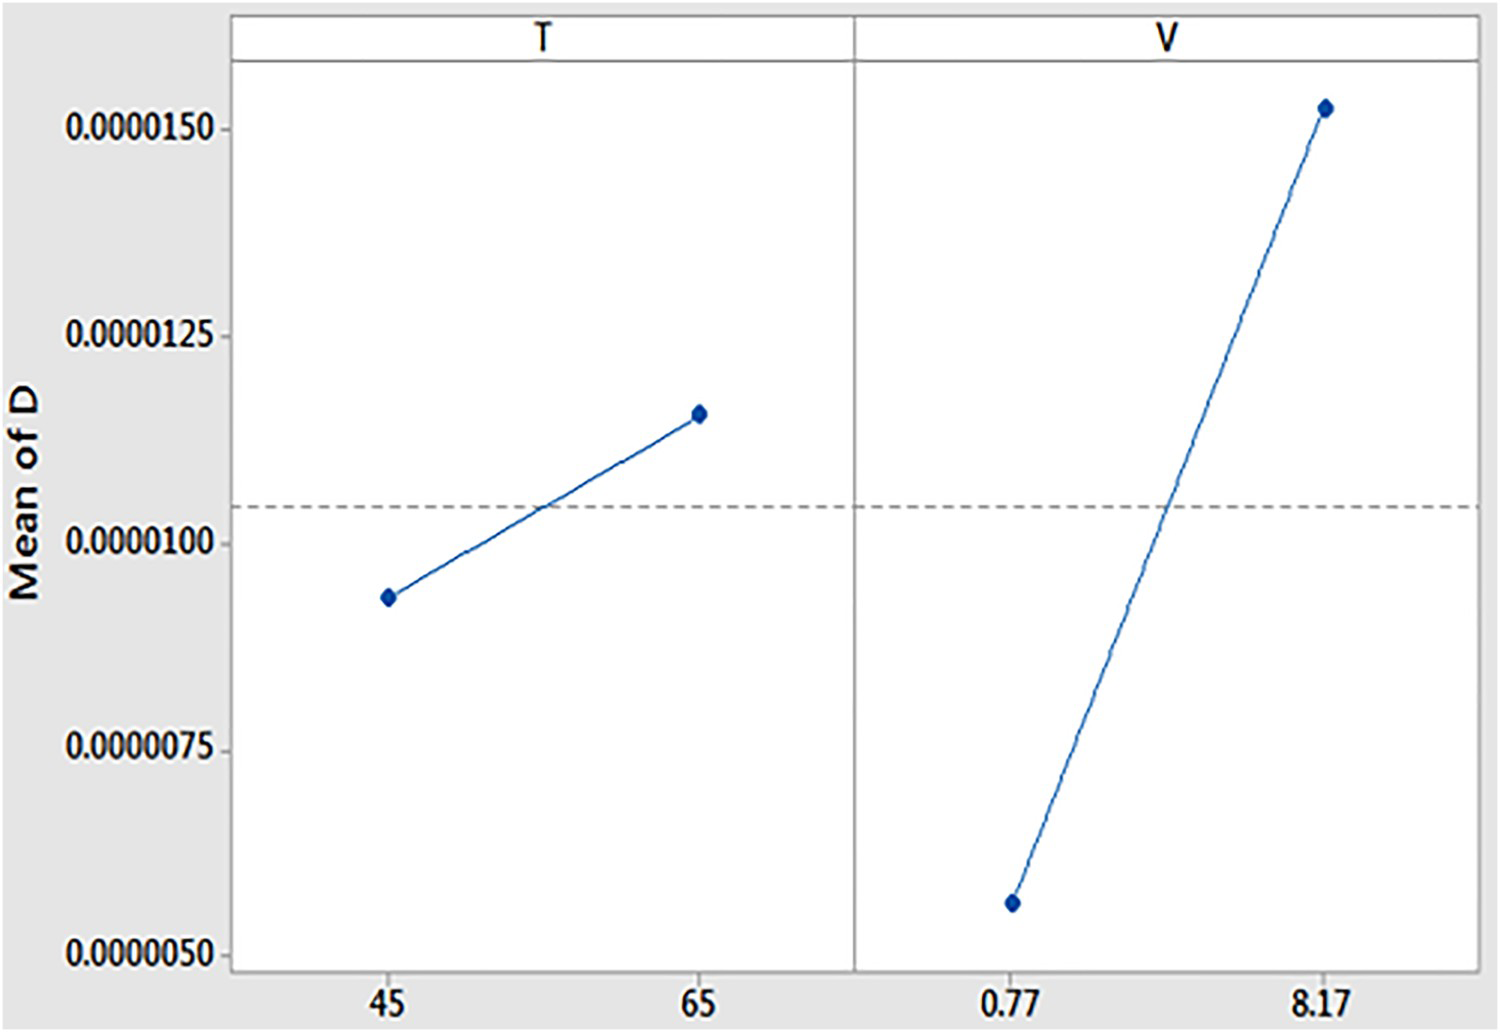
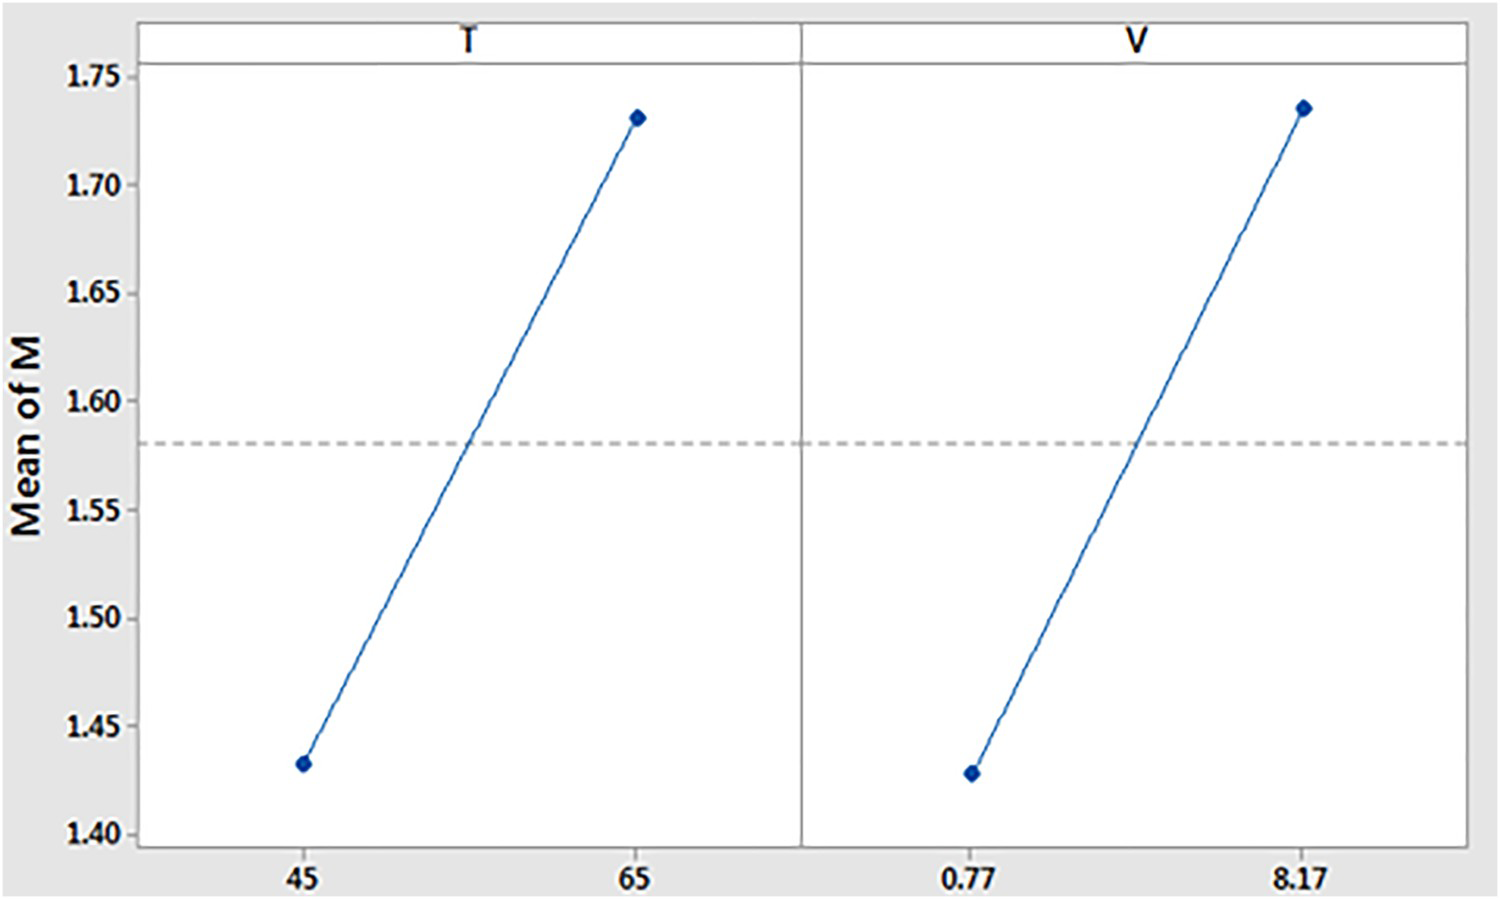
As well, the main effects graph, presented in Figures 8 and 9 for material (A) and in Figures 10 and 11 for material (B), show that the temperature and the flow velocity have a higher impact on the quantity of absorbed humidity (M) than the diffusion coefficient (D). In fact, the humidity diffusion coefficient isn't highly influenced by the environmental conditions.
The main effects graph for the diffusion coefficient of material (A). The main effects graph for the amount of absorbed humidity of material (A). The main effects graph for the diffusion coefficient of material (B). The main effects graph for the amount of absorbed humidity of material (B).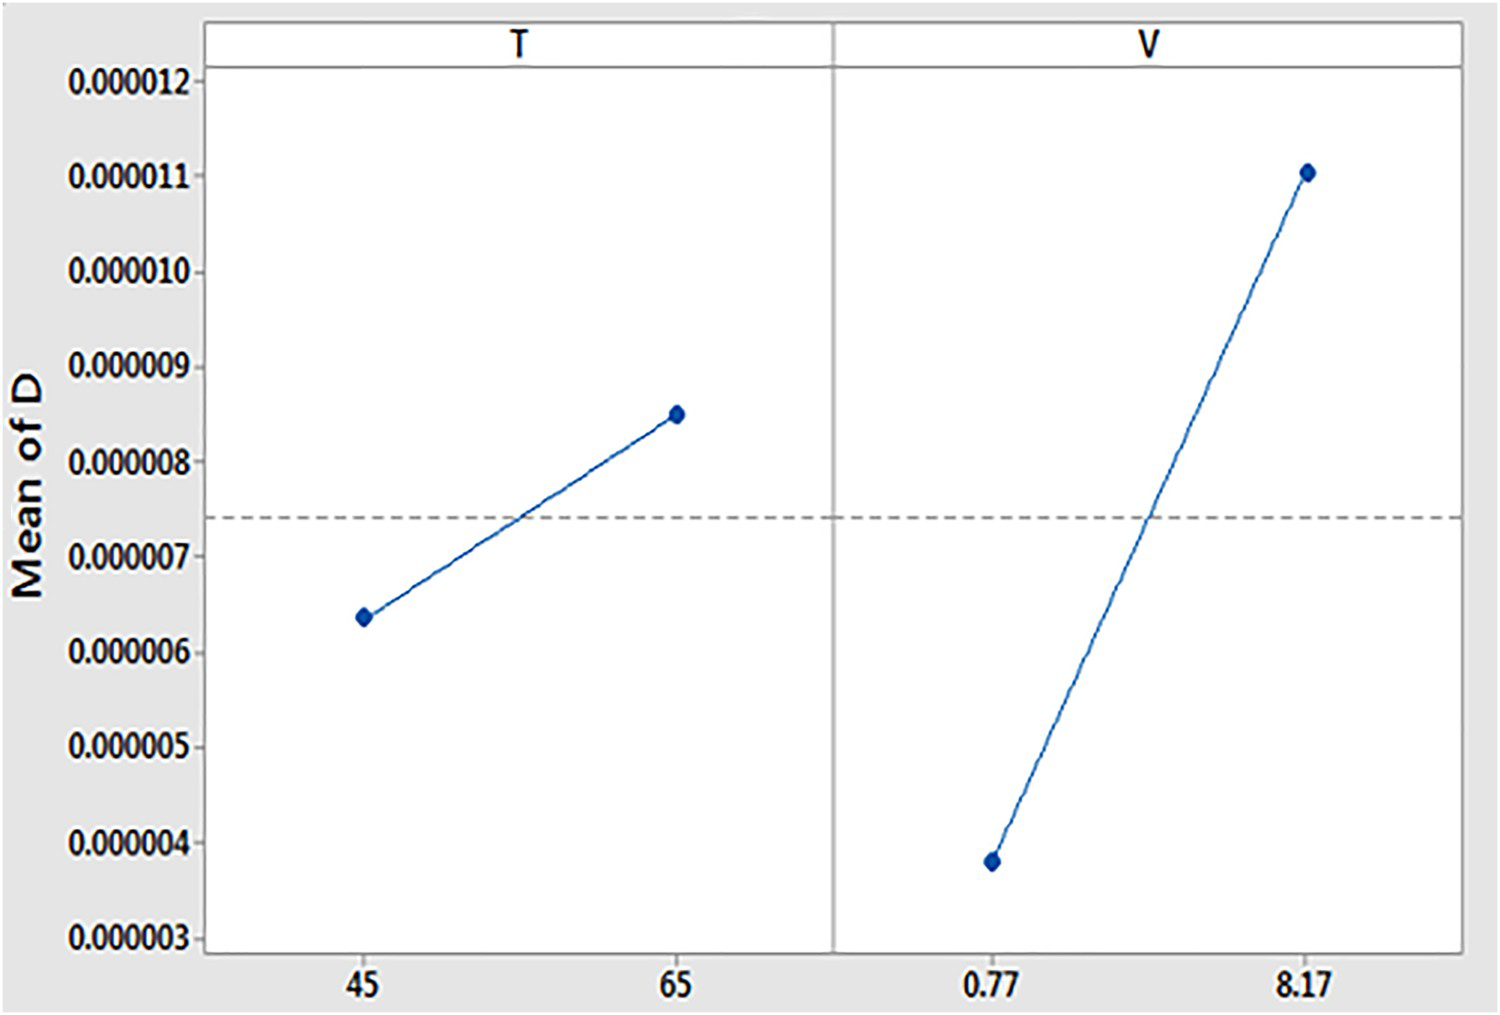
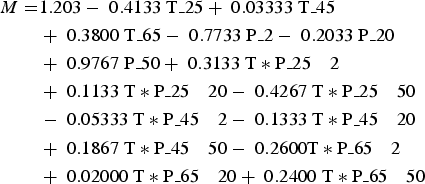
The regression equations allow us to predict the diffusion coefficient (D) and the amount of absorbed humidity (M), in function of the temperature and the flow velocity parameters. They are generated, for materials (A) and (B), as follows:
Material A:


The temperature/the pressure
The experimental results for the temperature/pressure effect on materials (A) and (B).
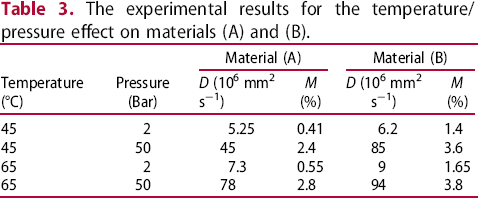
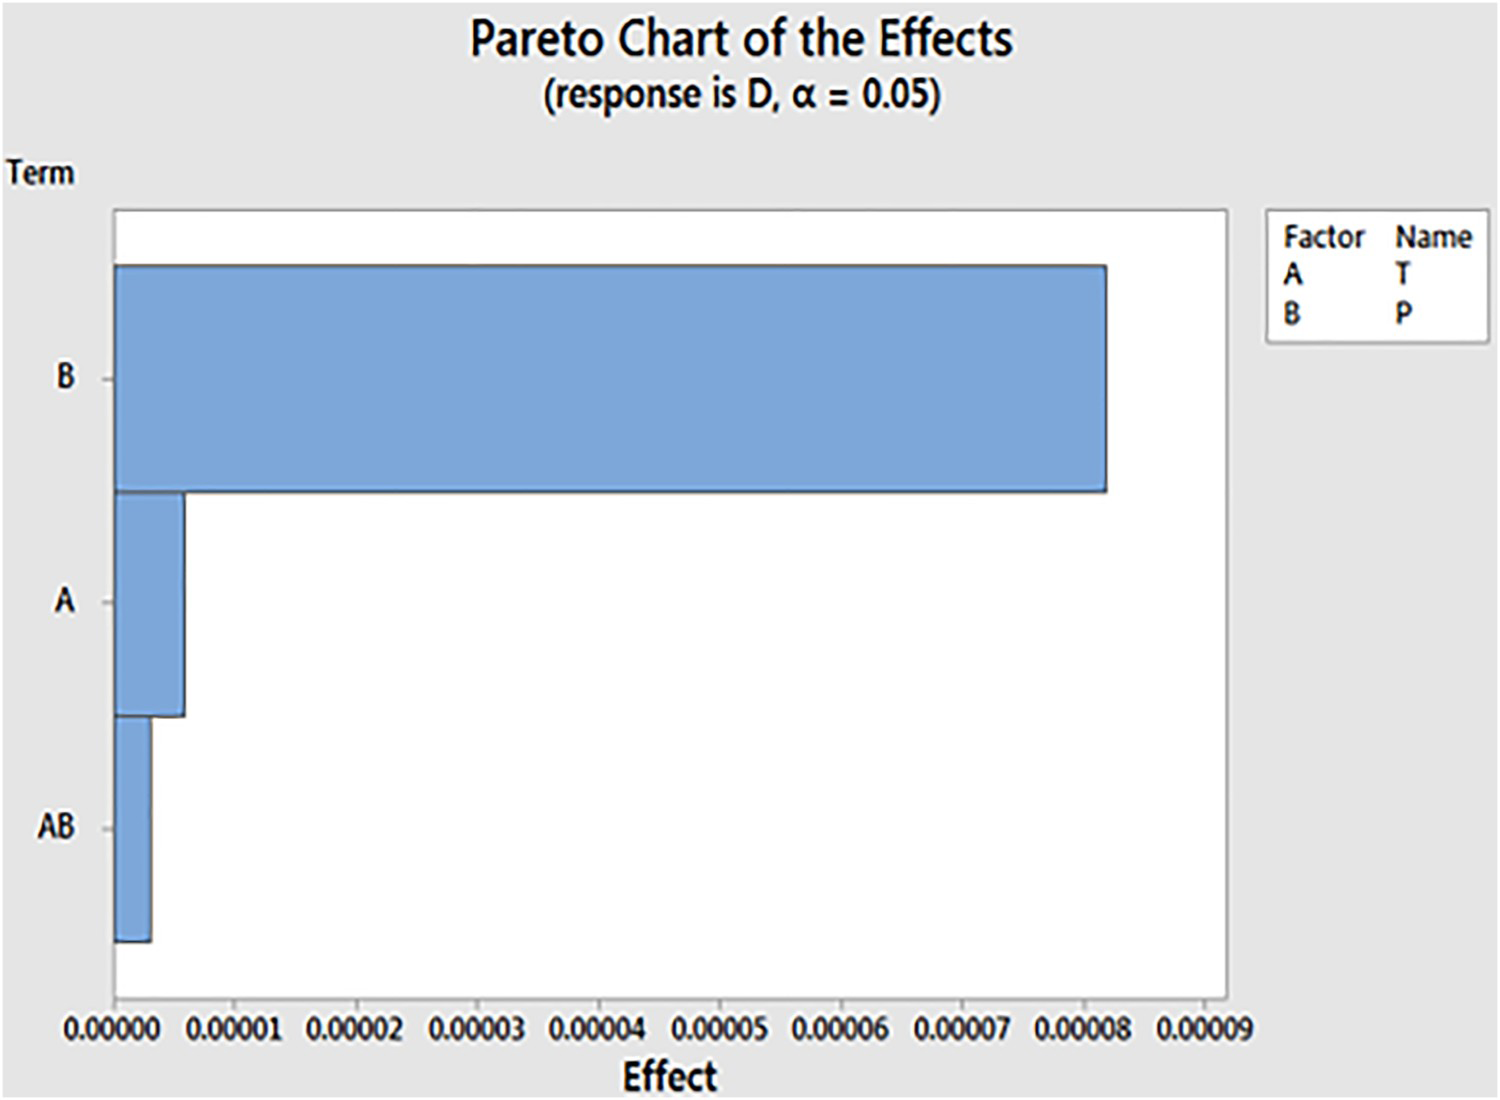
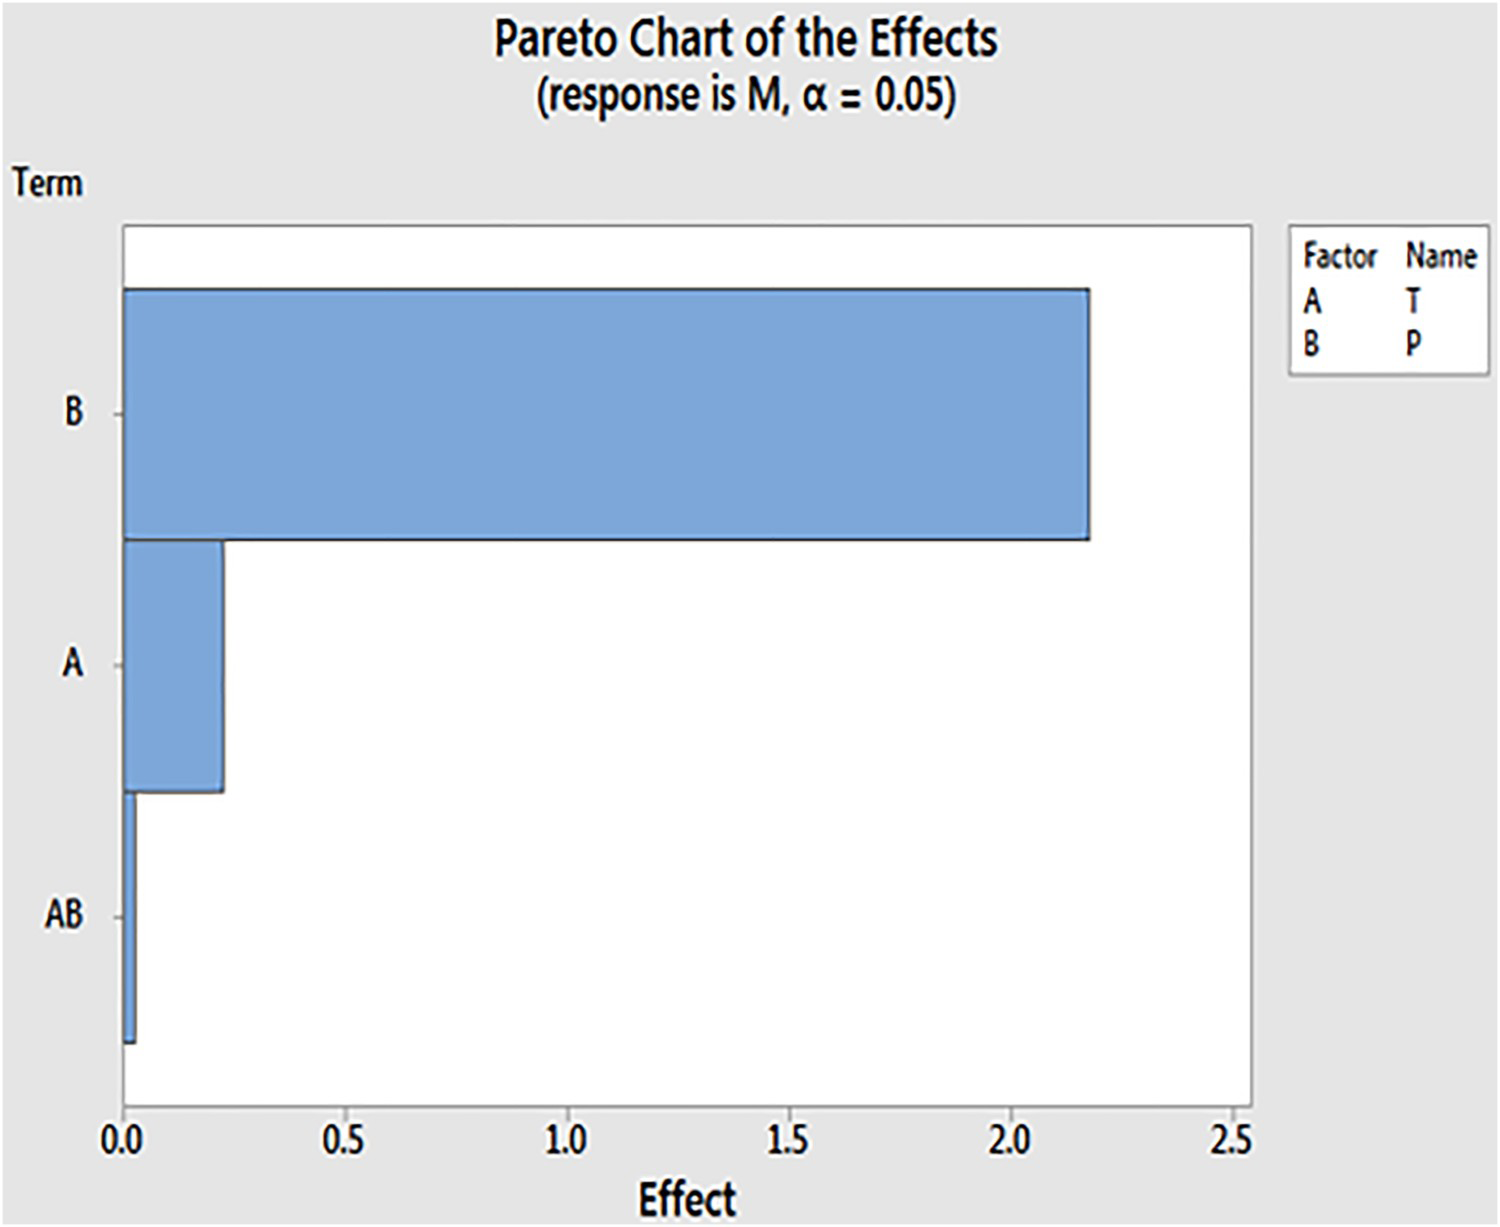
By means of the Minitab software, the pareto diagram, illustrated in Figures 12 and 13 for material (A) and in Figures 14 and 15 for material (B), shows that the diffusion coefficient (D) and the amount of absorbed humidity (M) are influenced in the following order: the pressure, the temperature and the temperature/pressure couple. In fact, the pressure, due to the speed that offers to the diffusing molecules, has a higher effect in the humidity diffusion process than the temperature.
Pareto chart of effects for the diffusion coefficient of material (A). Pareto chart of effects for the amount of the absorbed humidity of material (A). Pareto chart of effects for the diffusion coefficient of material (B). Pareto chart of effects for the amount of the absorbed humidity of material (B).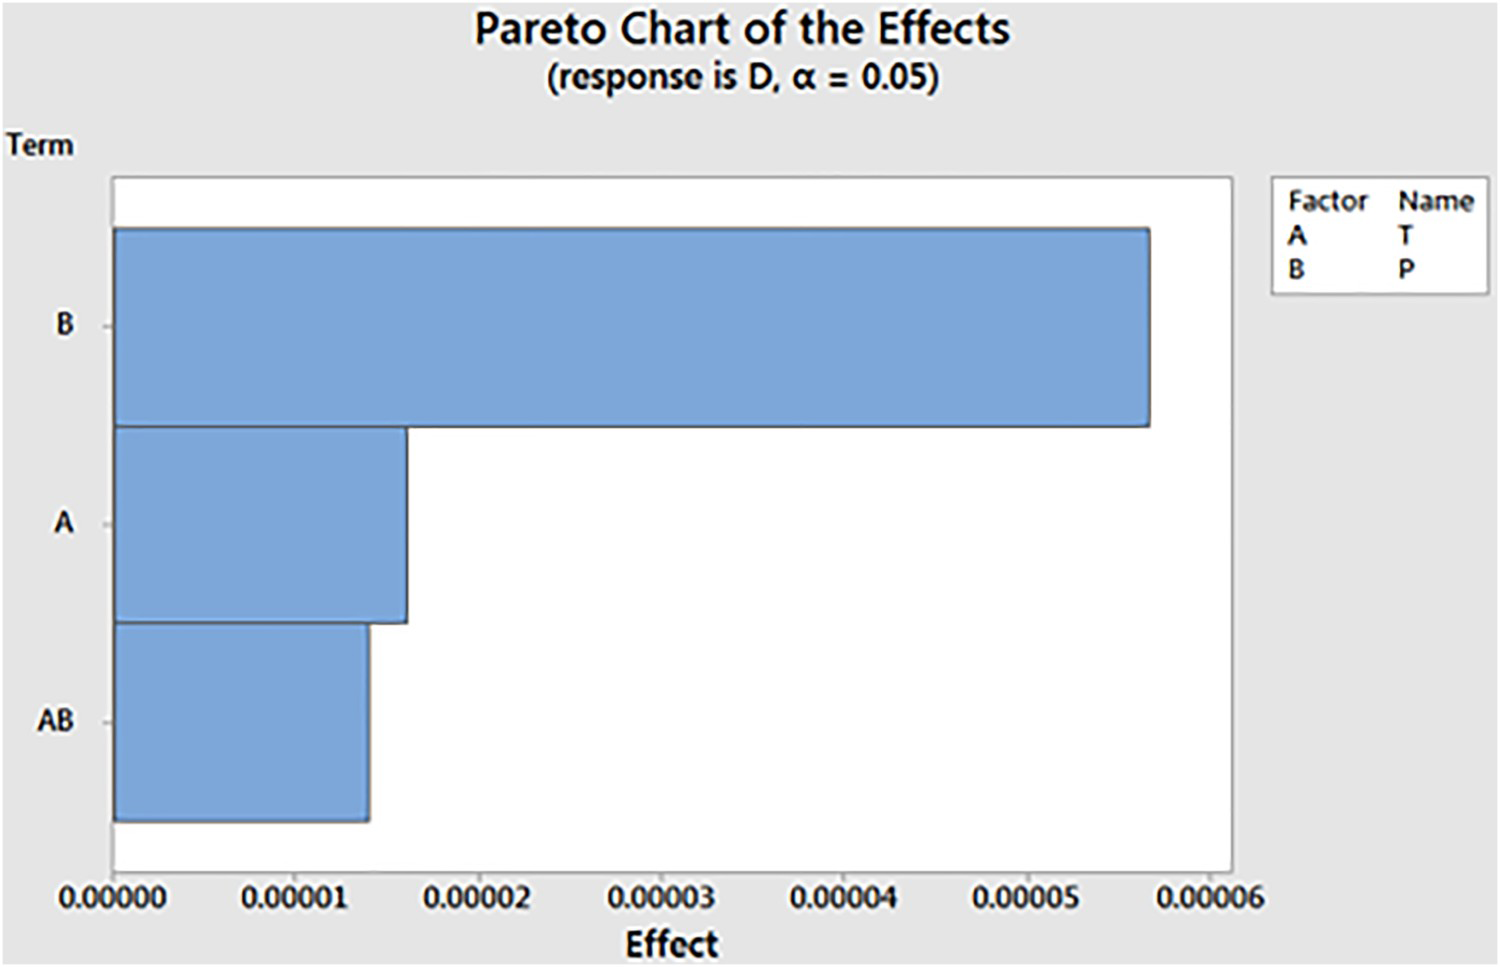
Figures 16–19 present the main effects graph for material (A) and (B). For material (A), the temperature has a higher influence on the diffusion coefficient (D) than the amount of absorbed humidity (M), unlike the pressure. For material (B), the pressure and the temperature have similar effect on the diffusion coefficient (D) and the amount of absorbed humidity (M). Effectively, the increase in the percentage of the fillers additives (ASP400) decreases the rigidity of the composite material, which grows the effect of the diffusing pressure.
The main effects graph for the diffusion coefficient of material (A). The main effects graph for the amount of absorbed humidity of material (A). The main effects graph for the diffusion coefficient of material (B). The main effects graph for the amount of absorbed humidity of material (A).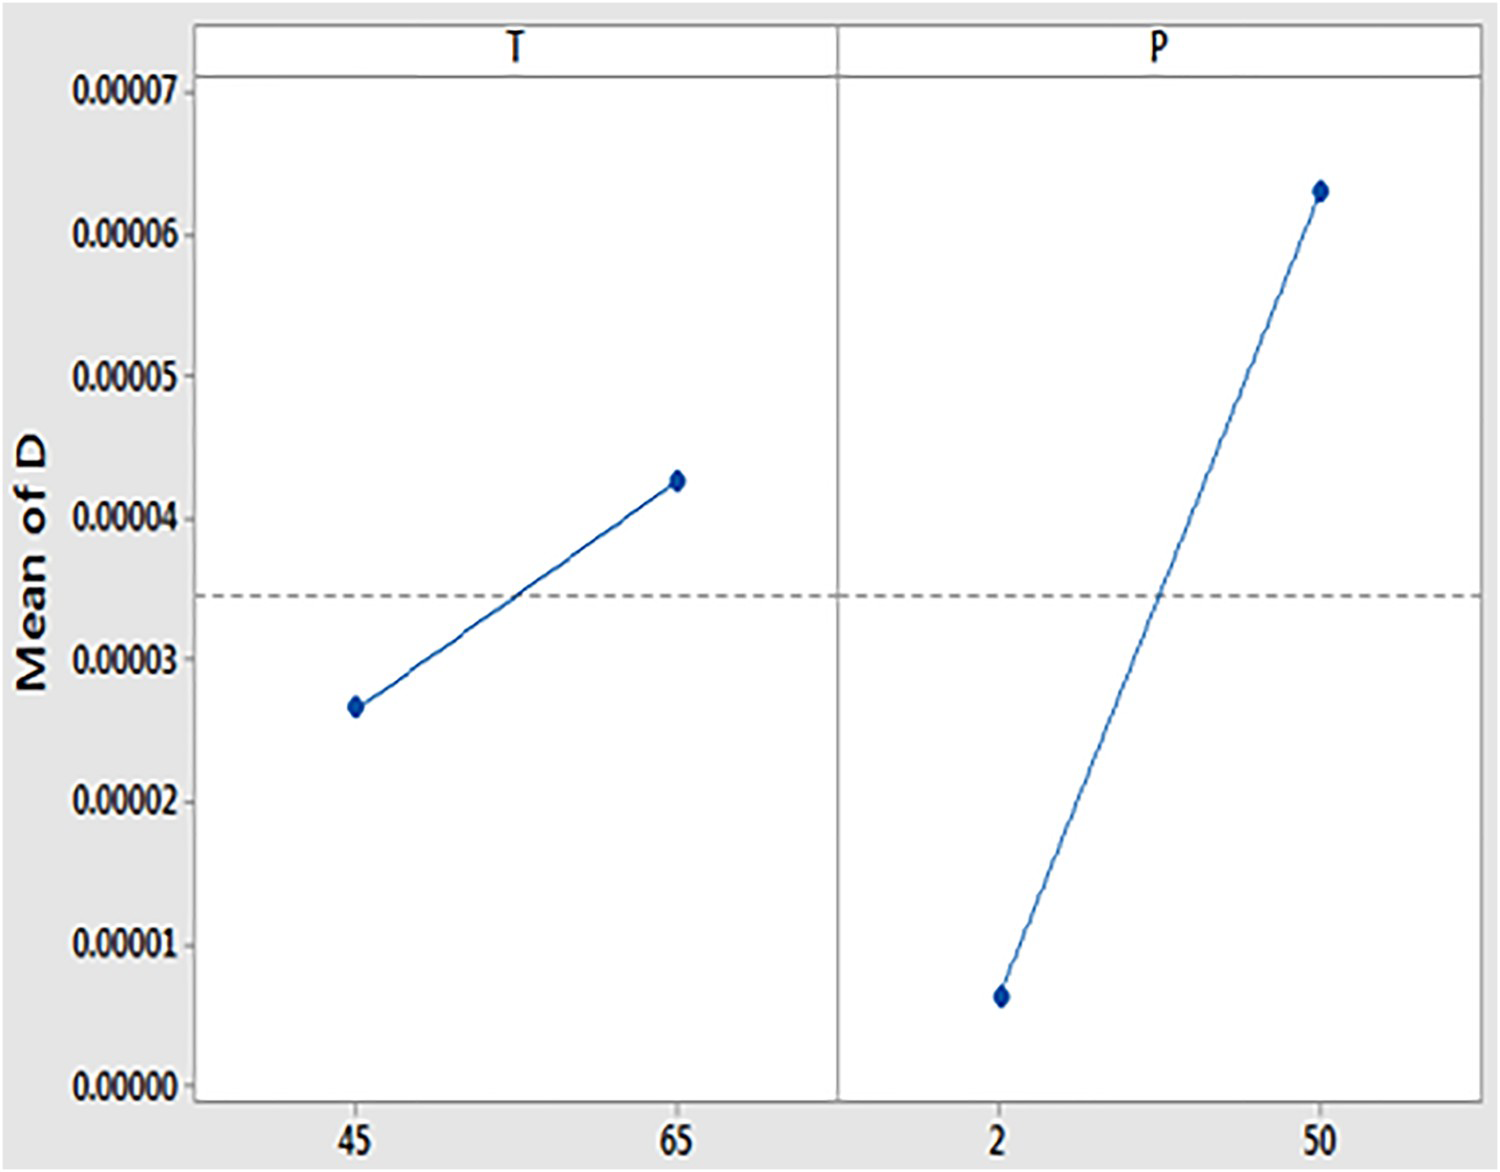
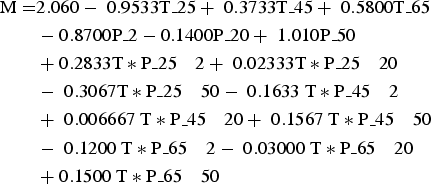
The regression equation allows us to predict the diffusion coefficient (D) and the amount of absorbed humidity (M) in function of the pressure and the temperature. It can be written as follows:
Material A:


Data analysis
In this section, we investigate the behaviour of the diffusion coefficient (D) and the amount of absorbed humidity (M) in function of the temperature and the pressure for material (A) and (B).
Material (A)
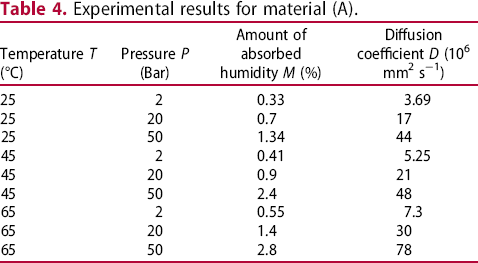
Experimental results for material (A).
Analyses of variance
Analysis of variance for the quantity of absorbed humidity (M).
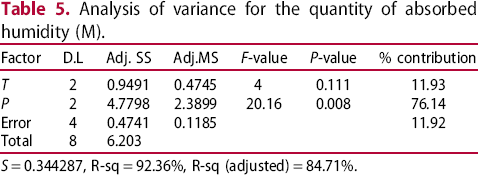
S = 0.344287, R-sq = 92.36%, R-sq (adjusted) = 84.71%.
Analyses of variance for the diffusion coefficient (D).
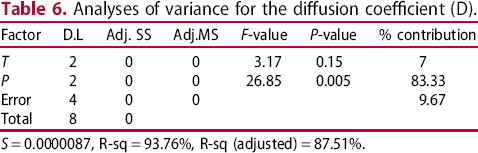
S = 0.0000087, R-sq = 93.76%, R-sq (adjusted) = 87.51%.
Main effects plots
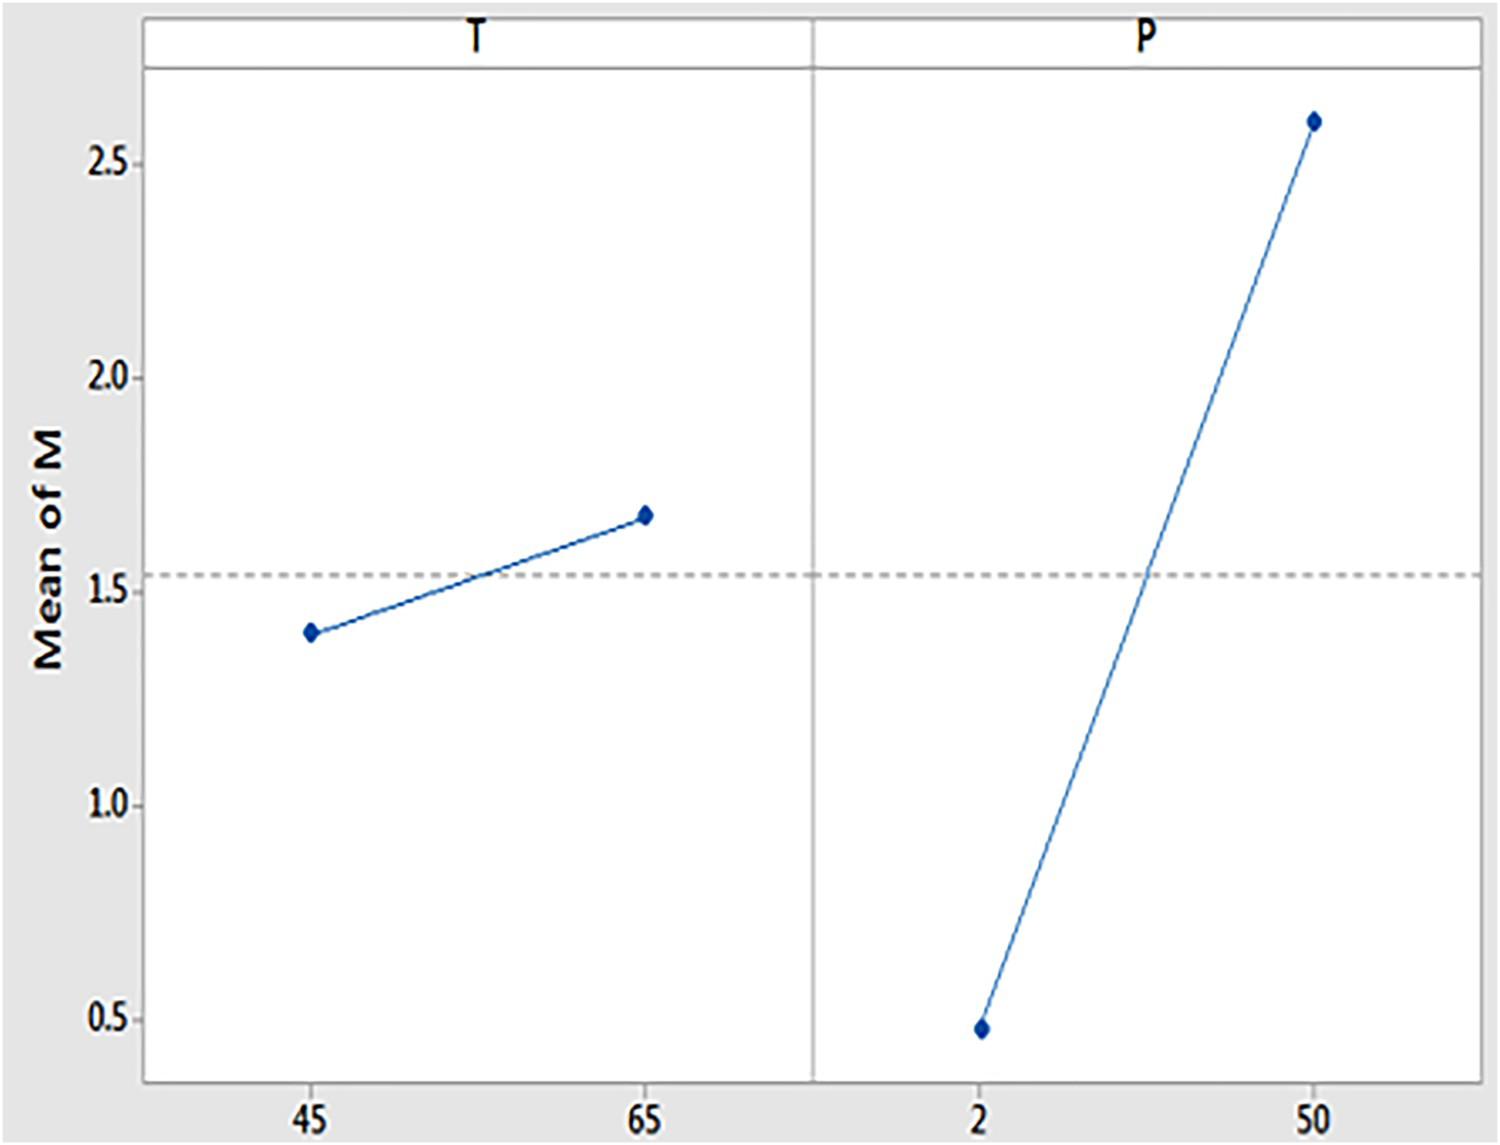
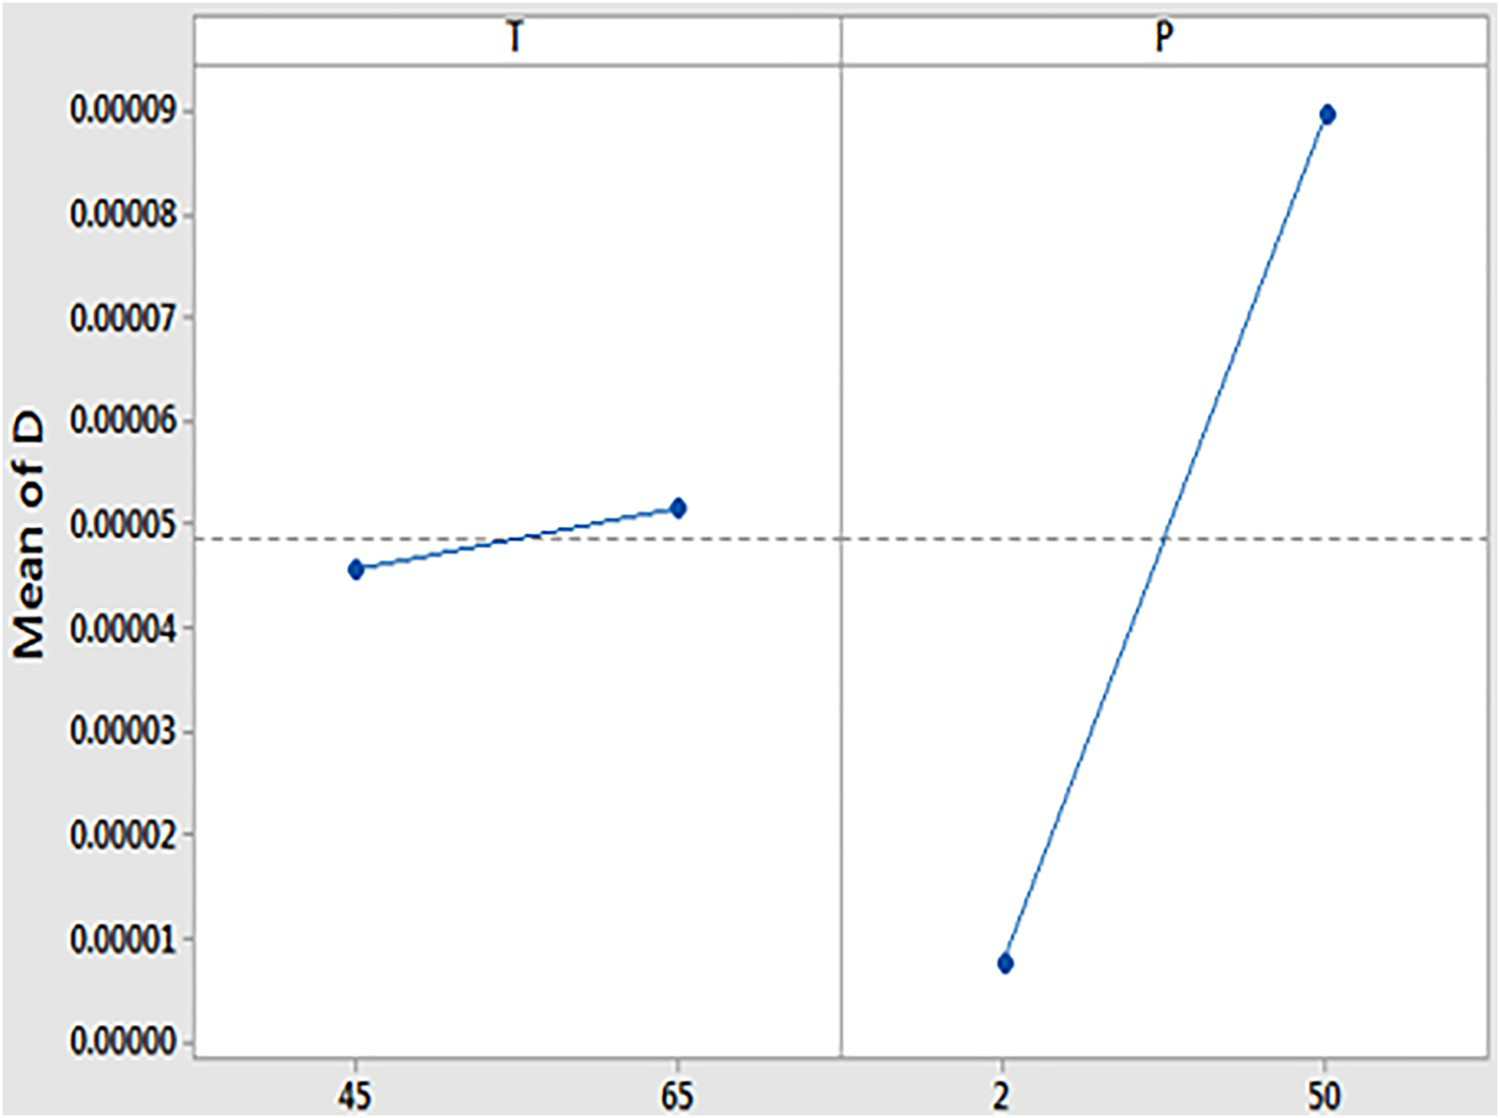
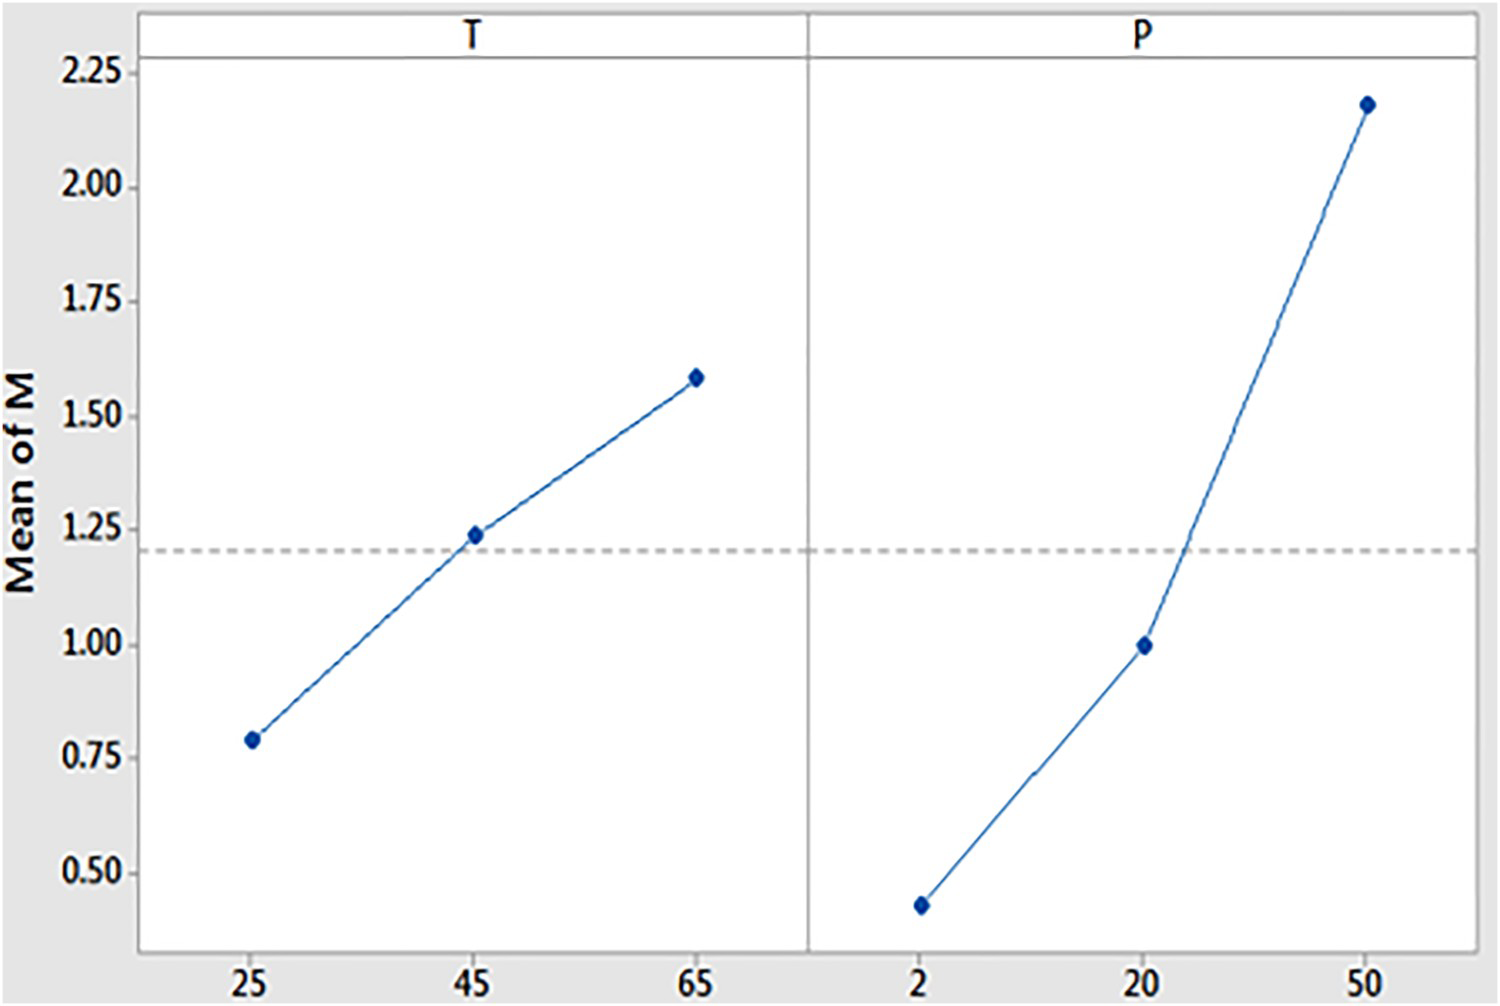
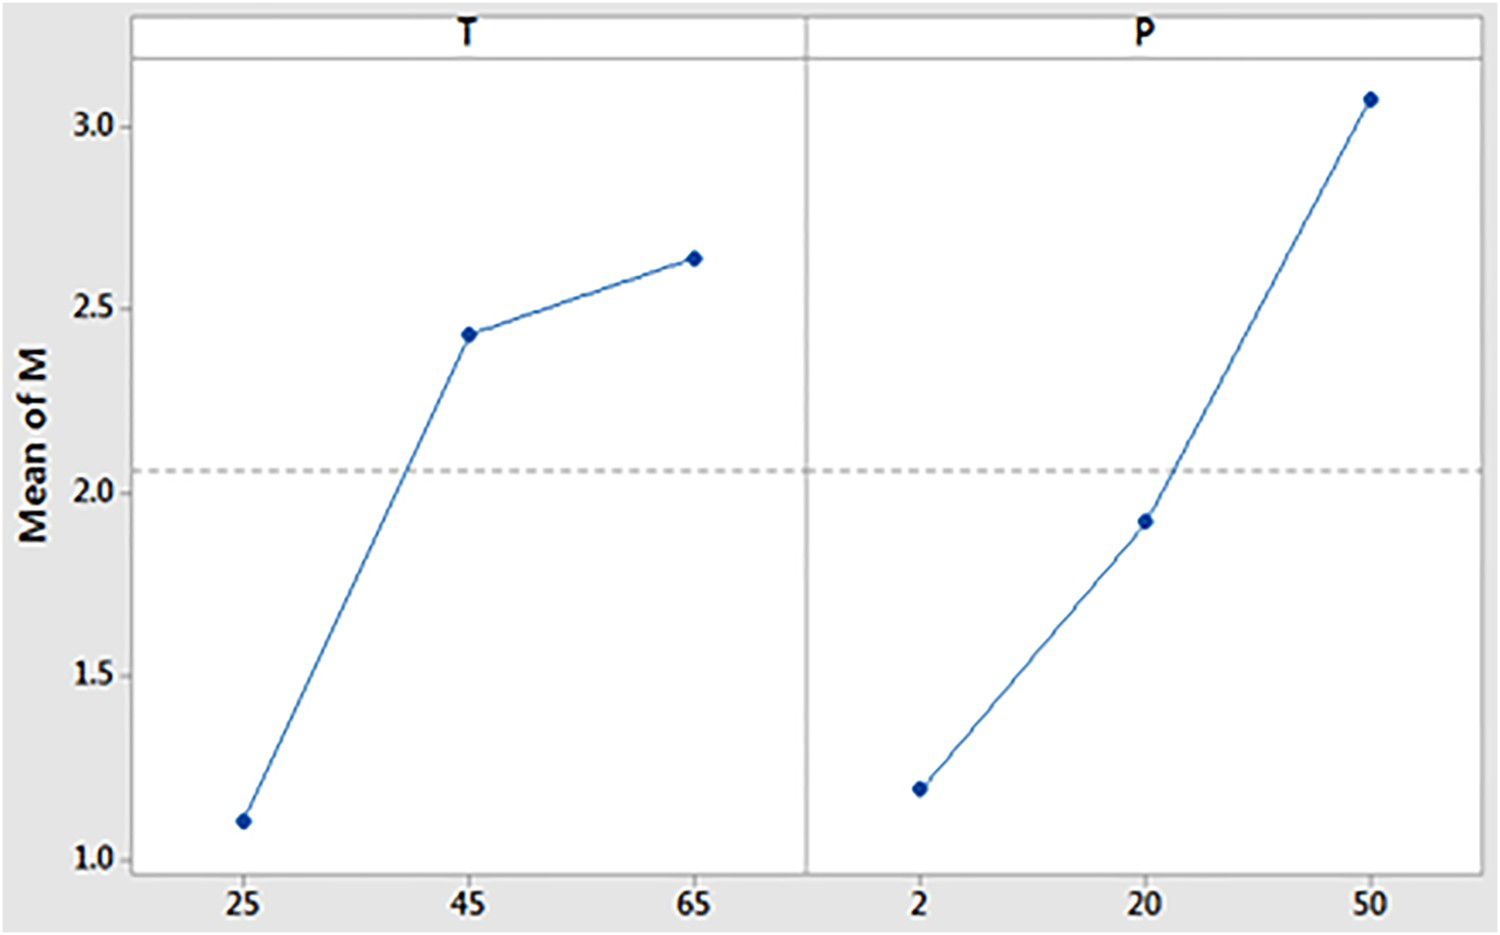
Figures 20 and 21 present the main effects plots of the temperature and the pressure on the diffusion coefficient (D) and the amount of absorbed humidity (M), respectively. For the two parameters, the curve of the average ascends with the increase in the temperature or the pressure. Thus, it represents the beneficial impact of the increase in temperature and the pressure on the quantity of absorbed humidity and the diffusion coefficient.
The main effects plot for the diffusion coefficient (D). The main effects plot for the amount of absorbed humidity (M).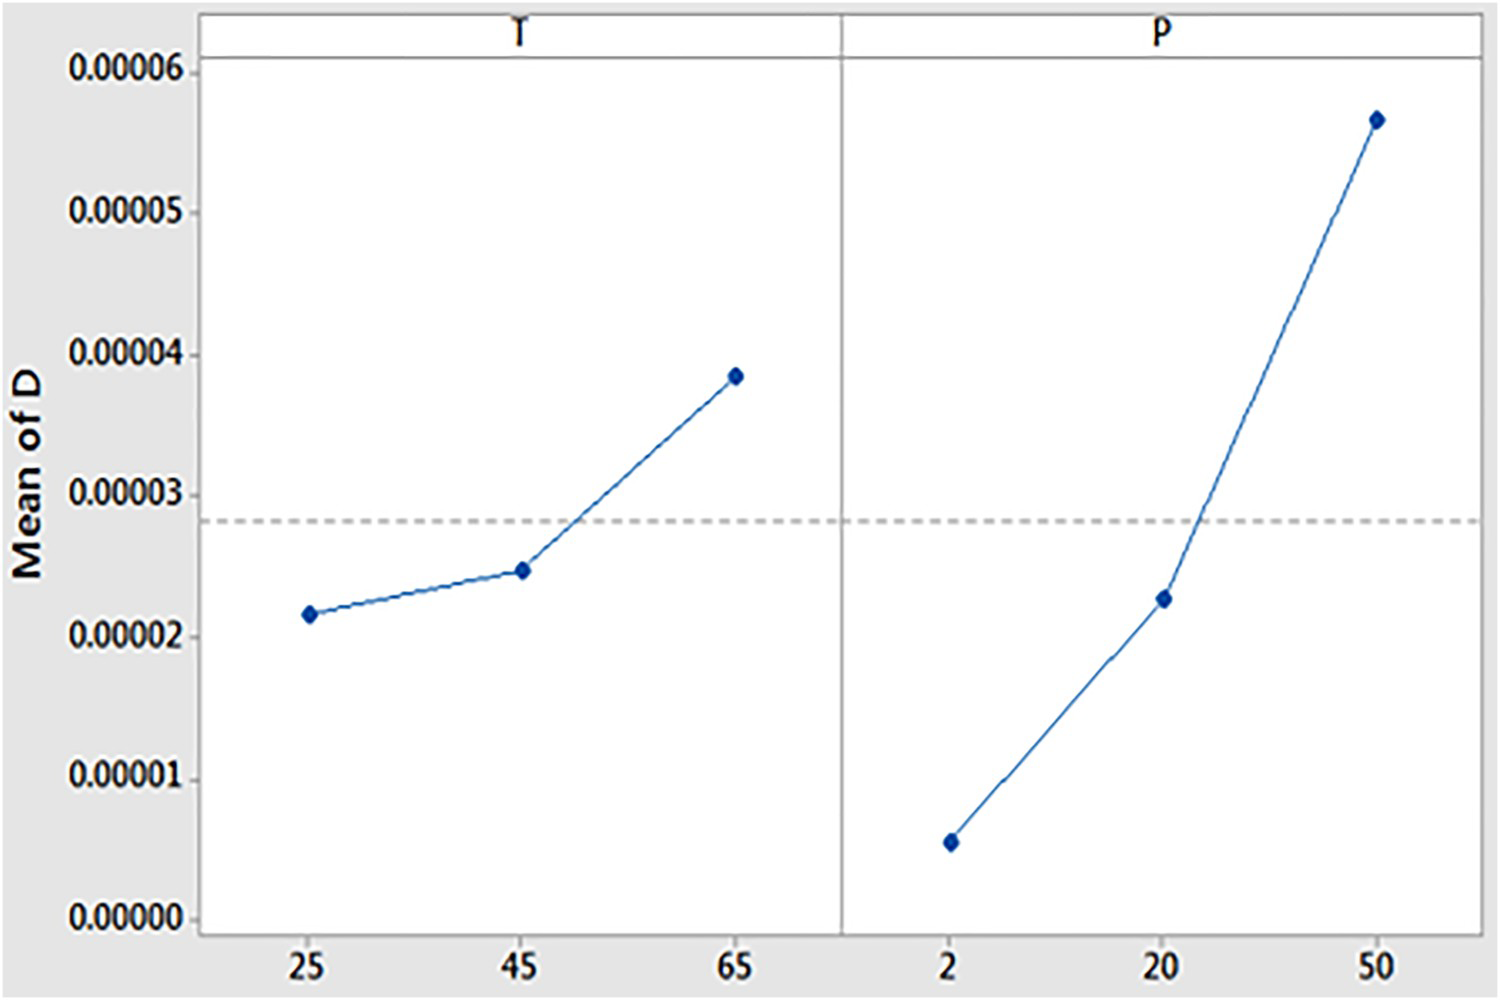
Residual plots
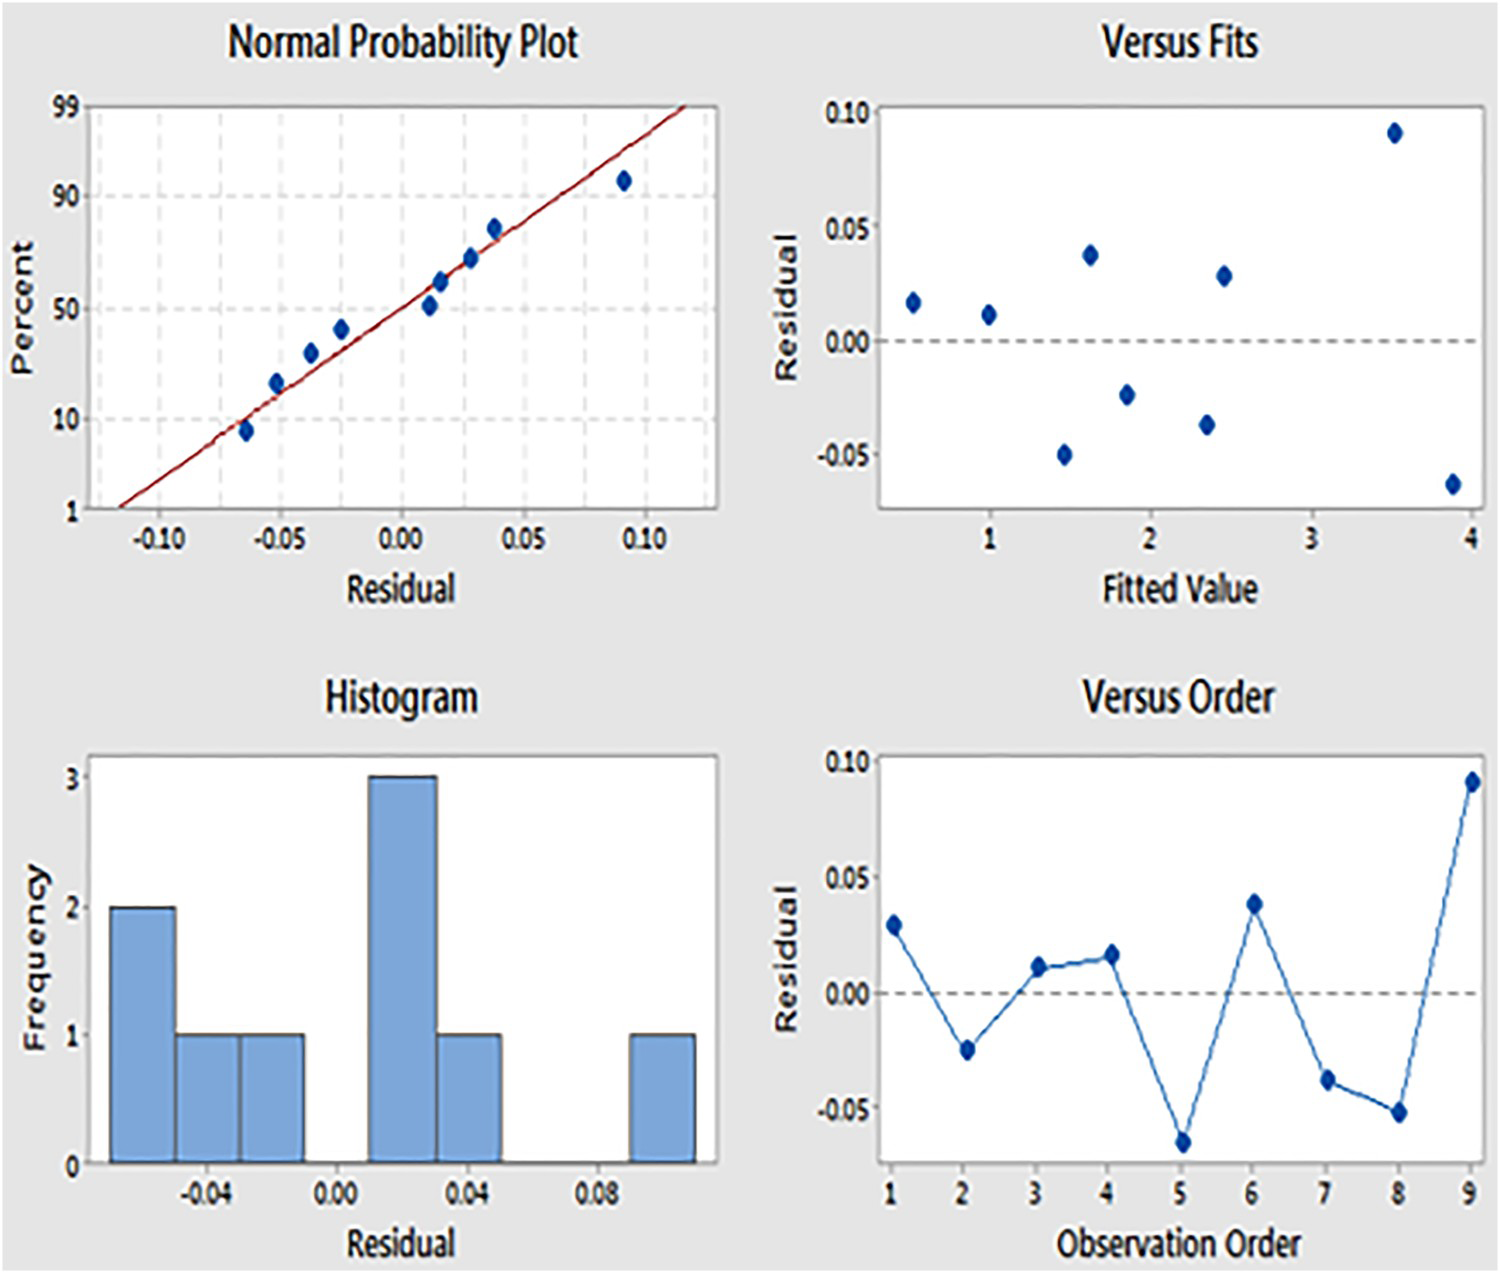
As shown in Figures 22 and 23, the residuals on the standard probability plot rest adjacent to the equipped line with minor variation from the regularly distributed graph. It determines that the residuals are dispersed regularly and validates the best linear relationship between factors and variables of response. The graphs of the residual vs the observation order and the effective vs the fitted value residual display little obvious agreement and the residuals show up with each other haphazardly, which is a critical arrangement for reasonable compatibility between fitted and experimental value.
Residual value diagram for the diffusion coefficient (D). Residual value diagram for the amount of absorbed humidity (M).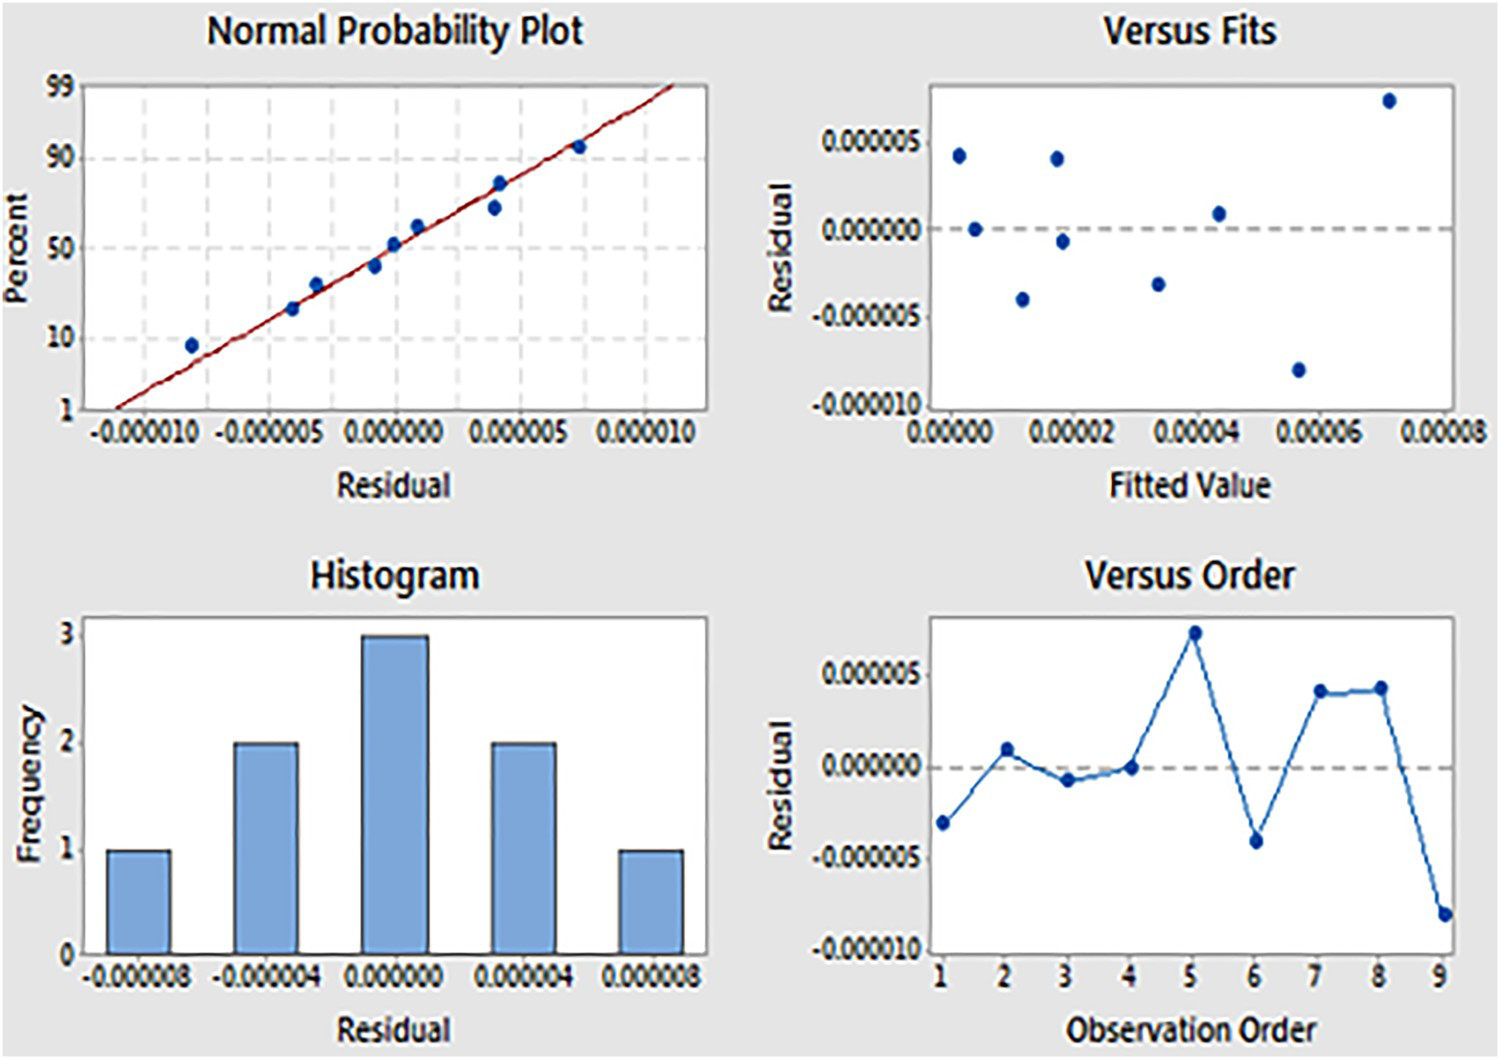
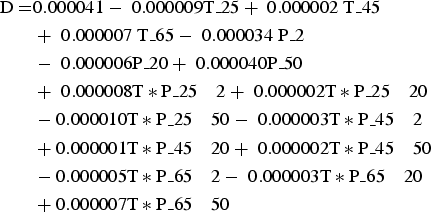
Regression equations
The regression equations for material (A), created by the general regression analysis, are obtained as follows:
Material B
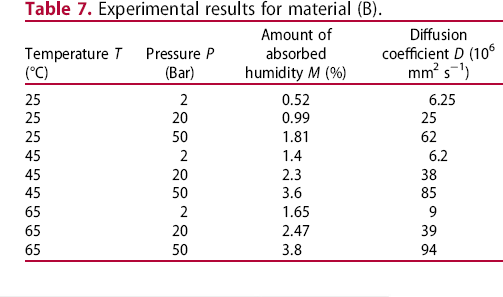
Experimental results for material (B).
Analyses of variance
Analyses of variance for the quantity of absorbed humidity (M).
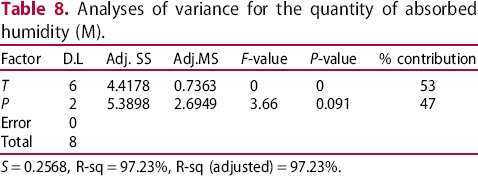
S = 0.2568, R-sq = 97.23%, R-sq (adjusted) = 97.23%.
Analyses of variance for the diffusion coefficient (D).
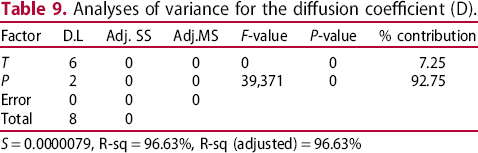
S = 0.0000079, R-sq = 96.63%, R-sq (adjusted) = 96.63%
Main effects plots
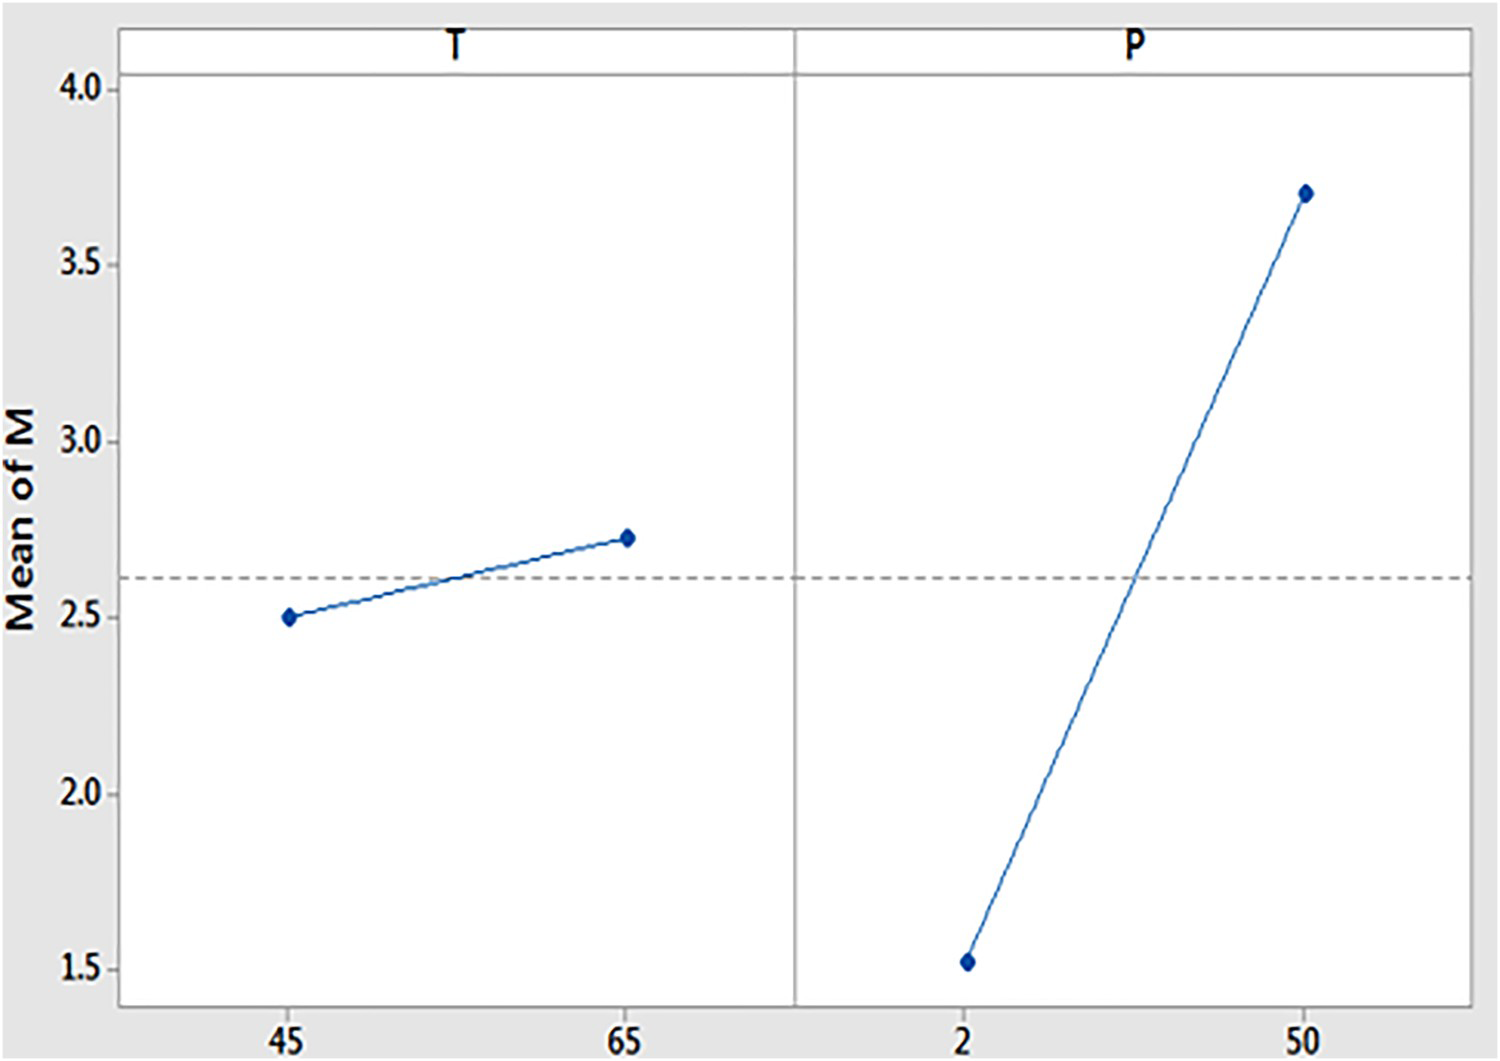
Figures 24 and 25 present the main effects plots of the temperature and the pressure on the diffusion coefficient and the amount of absorbed humidity, respectively. The curve of the average ascends with the increase in the temperature or the pressure. Thus, it represents the beneficial impact of the augmentation in the temperature and the pressure on the diffusion parameters (D, M).
The main effects plot for the diffusion coefficient (D). The main effects plot for the amount of absorbed humidity (M).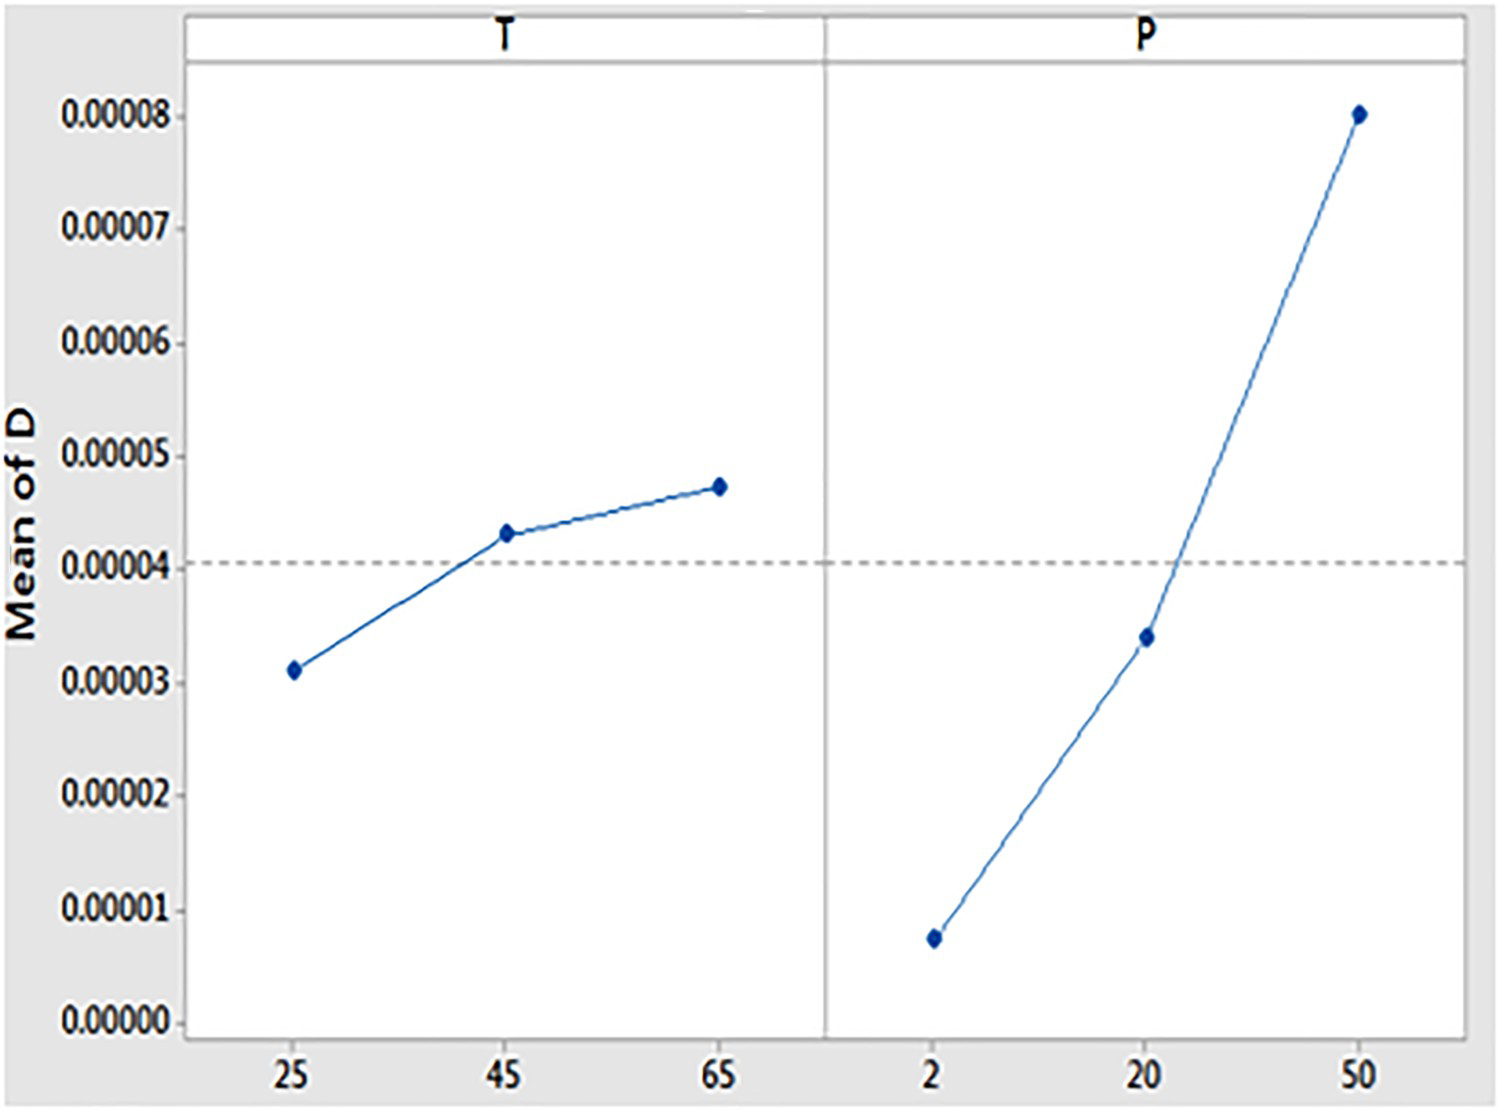
Residual plots
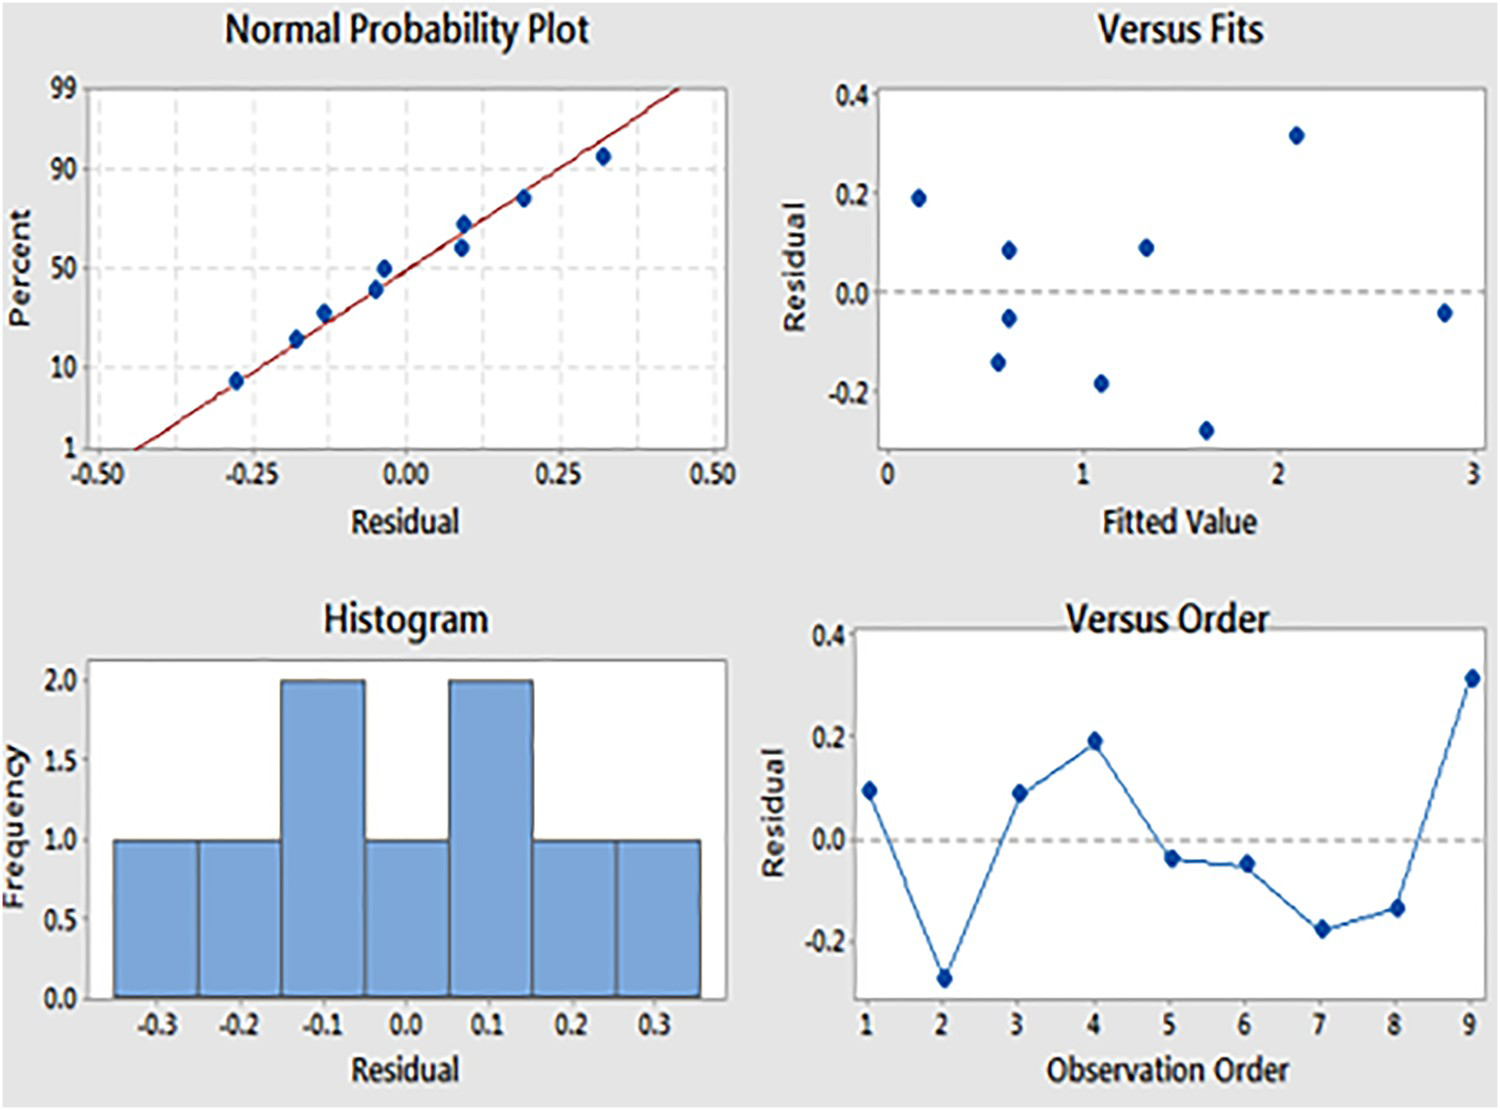
As shown in Figures 26 and 27, the residuals on the standard probability plot rest adjacent to the equipped line with minor variation from the regularly distributed graph. It determines that the residuals are dispersed regularly and validates the best linear relationship between factors and variables of response. The graphs of the residual vs the observation order and the effective vs the fitted value residual display little obvious agreement and the residuals show up with each other haphazardly, which is a critical arrangement for reasonable compatibility between fitted and experimental value.
Residual value diagram for the diffusion coefficient (D). Residual value diagram for the amount of absorbed humidity (M).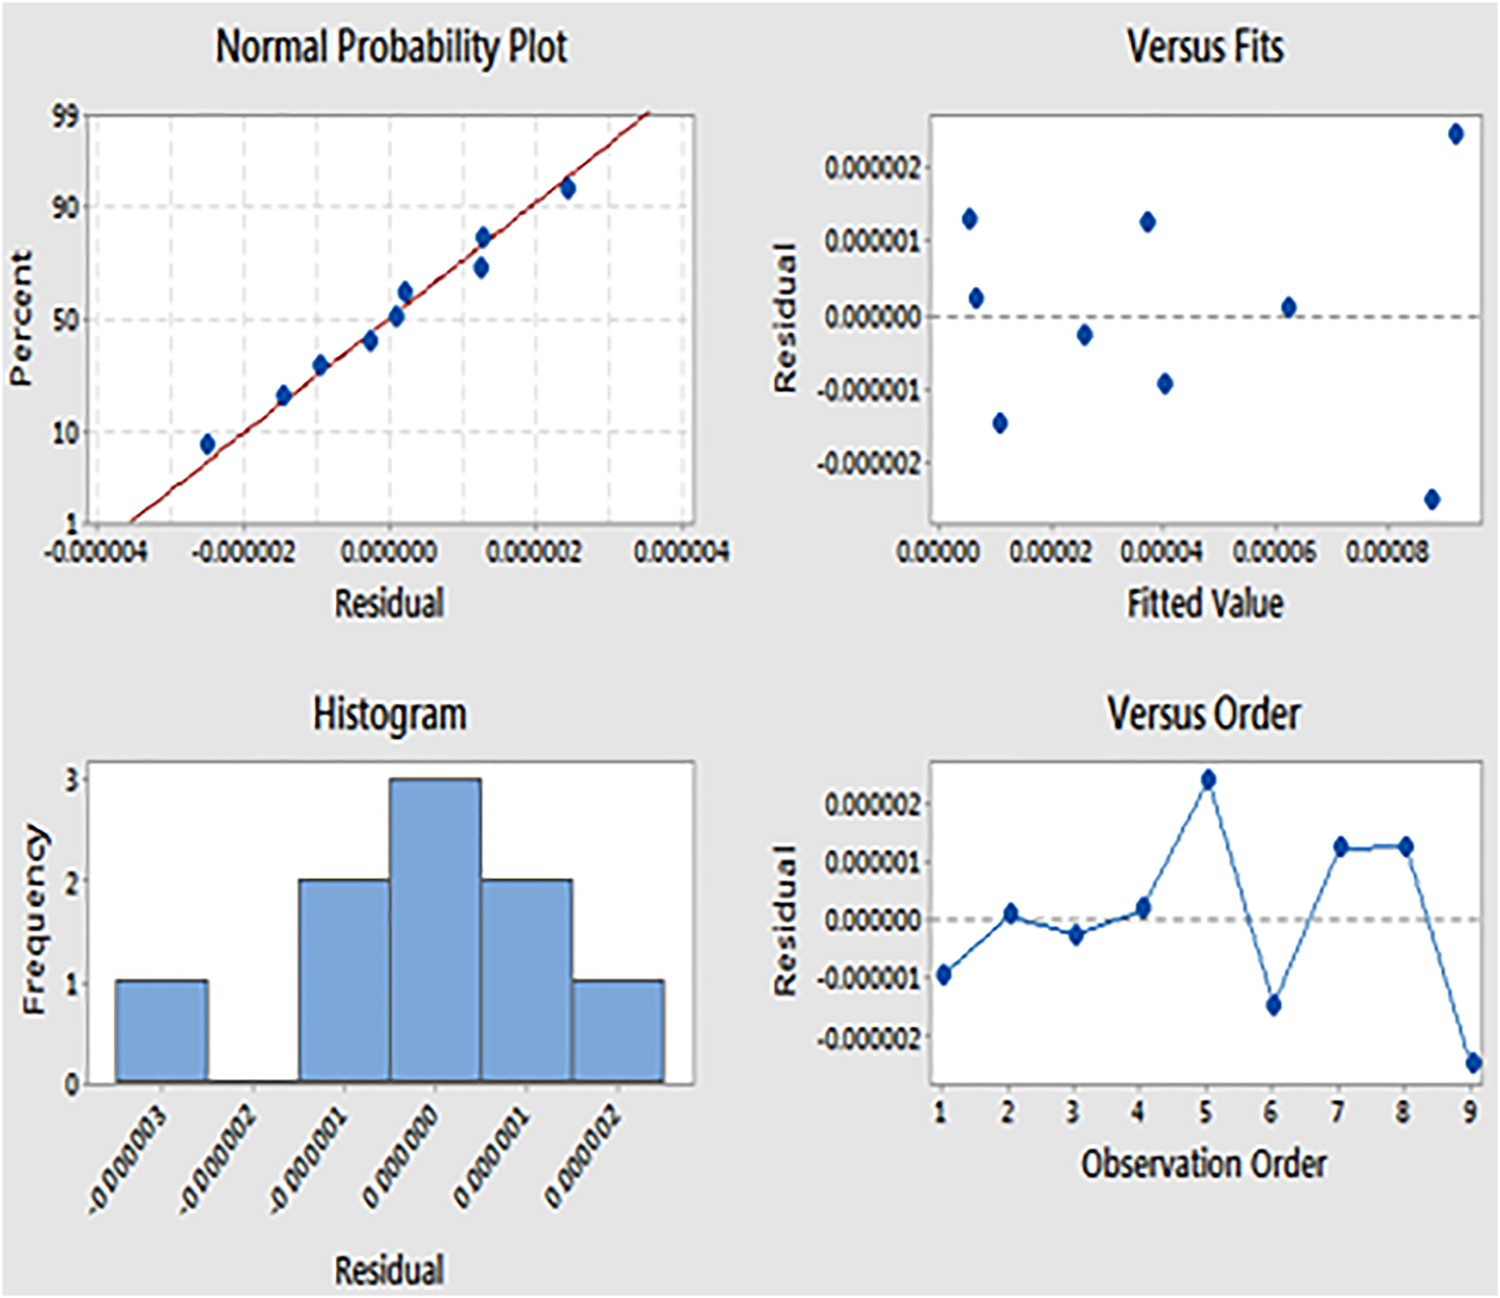
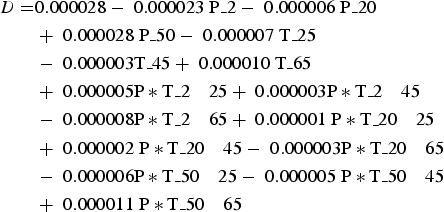
Regression equations
The regression equations, which predict the diffusion coefficient (D) and the amount of absorbed humidity (M), are obtained as follows:
Conclusion
This is a statistical study of the effect of three environmental parameters: the temperature, the pressure and the flow velocity on the humidity diffusion parameters: the diffusion coefficient (D) and the amount of absorbed humidity (M). The increment in the temperature, the pressure, the flow velocity and the percentage of fillers additives generates a rise in the diffusion coefficient (D) and the amount of absorbed humidity (M).
In the case of material (A), for the temperature/pressure and the temperature/flow velocity cases, the flow velocity and the pressure have a higher influence than the temperature on the diffusion coefficient (D) and the quantity of absorbed humidity (M). In addition, the pressure has a higher influence on the diffusion coefficient than the amount of absorbed humidity, contrarily to the temperature. While for material (B), in the case of the temperature/flow velocity, the velocity and the temperature present a similar effect on the amount of absorbed humidity. Although, the diffusion coefficient (D) is highly influenced by the flow velocity than the temperature. In the temperature/pressure case, we note a higher effect of the pressure than the temperature on the diffusion coefficient and the amount of absorbed humidity. Moreover, the pressure has a high impact on the diffusion coefficient than the temperature, contrarily to the amount of absorbed humidity, which is highly influenced by the temperature. The increase in the percentage of fillers additives favours the temperature effect over the pressure and the flow velocity impact on the humidity absorption process.
As a perspective, we investigate the effects of the three parameters on the humidity diffusion phenomena in sea water.
Footnotes
Disclosure statement
No potential conflict of interest was reported by the author(s).