
Abstract
In bedded sedimentary rocks with low strength relative to the stress conditions the maximum height of failure above roadways and tunnels can be predicted using the spalling limit concept and a parameter to address transverse isotropy. For siltstones and mudstones a spalling limit of 50° and Young's modulus/independent shear modulus ratio of 100 can be used for roof support design. Using this failure criterion, simple design charts can be produced to provide an appreciation of the roof support requirements in various mining situations. Bulking factors can be applied to the predicted failure heights to provide roof deformation triggers.
Introduction
Undisturbed sedimentary rock masses such as those encountered in longwall coal mining are characterised by laterally-continuous bedding discontinuities and two sets of orthogonal joints typically constrained by the bedding. The finer grained sedimentary rocks such as mudstones, siltstone and fine sandstone are typically described as laminated or thinly bedded implying bedding spacings of between 6 mm and 200 mm. Sedimentary rock masses are transversely isotropic and this anisotropy impacts not only on the way stresses are redistributed around excavations but also on the selection of rock mass strength values.
At the underground roadway scale where the openings are typically 5 m wide and 3 m high engineering analyses should either assume intact rock properties or examine the shear strength of joints (Hoek et al. 1998). Martin et al. (1998) advocated an alternative implementation of the Hoek Brown criterion for intact brittle rocks and one of their case studies involved sandstones from the Donkin-Morien tunnel. Subsequently, complete failure envelopes have been proposed such as the damage initiation spalling limit of Diederichs (2007) or the S-shaped failure criterion of Kaiser and Kim (2008). Seedsman (2014a) proposed a strength/modulus criterion for laminated low-strength rock assuming the rock is a homogeneous, transversely-isotropic continuum with strength given by a tri-linear criterion implemented with Mohr Coulomb parameters (referred to Transversely Isotropic Brittle or TIB criterion). In σ1–σ3 space damage initiation develops at one third of the uniaxial compressive strength (UCS) with the Hoek Brown m parameter equal to 0.0: in normal-shear stress space this is equivalent to a cohesion of UCS/6 and a friction angle of 0.0°. The spalling limit is conventionally expressed as the ratio of the major and minor stresses (σ1/σ3). In normal/shear space the spalling limit is an equivalent friction angle (SLϕ) determined by the standard relationship whereby:

Seedsman (2014a) demonstrated that the maximum height of failure in very low strength rocks (when compared to the insitu stress regime) was determined by the spalling limit parameter, the ratio of the horizontal to vertical stress, and the value of the ratio of Young's modulus (E) to the independent shear modulus (G). In earlier work values of 33° for SLϕ and 15 for the E/G ratio had been selected to provide a workable combination for the prediction of height of failure above 5 m wide roadways in coal mines (Seedsman 2011) and this was continued although it was recognised that a SLϕ value of 33° would mean that the failure envelope would not intersect any accepted shear strength criterion adopted for the far-field. This was not identified as a fundamental weakness as other workers had also recognised the need for such a disconnect given the current implementations of failure criterions in the common numerical codes (Kaiser & Kim 2015).
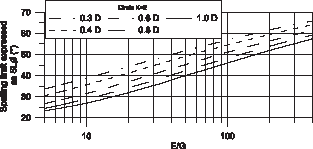
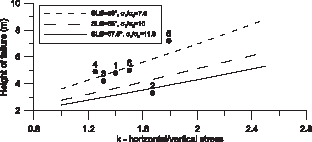
For a given failure height an infinite number of combinations of spalling limit and E/G ratio are possible when using the TIB approach (Figure 1). Recent observations of the performance of parallel-driven roadways have suggested that the E/G ratio of 15 is too low to explain the significantly better roof conditions in the second and subsequent roadways driven within about 30 m of each other. At the same time there continues to be a lack of information or an accepted testing method to determine the spalling limit. This paper seeks to interpret some mine-scale observations as well as reports from TBM tunnels to provide an alternative set of modulus ratio and friction angle values that can be used for both ground control and the separation of roadways. The TBM case studies are used in the absence of documented surveyed roof fall cavities in coal mines.
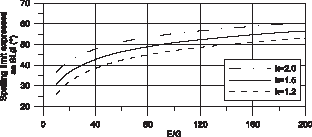
Combination of E/G ratios and SLϕ values to give a 5 m height of failure above a 5 m wide roadway for different values of the major horizontal/vertical stress ratio (k) assuming a homogeneous transversely isotropic continuum.
The shear modulus of an equivalent continuum and the spalling limit
According to Brady and Brown (1985), the independent shear modulus (G) of transversely isotropic material is given by:

where E and ν = Young's modulus and Poisson's ratio of isotropic rock between the discontinuities (bedding), K s = bedding shear stiffness, and S = mean bedding spacing. There is little published information on joint shear stiffness as it is applied to bedding planes without infill. Other workers in sedimentary sequences assume that the joint shear stiffness is numerically equal to one tenth of the joint normal stiffness (Bertuzi & Pells 2002). The normal stiffness of a tight/clean bedding discontinuity is difficult to conceptualise but an interpretation of the Bertuzzi and Pells data suggests it can be assumed to be half the value of Young's modulus. Assuming a Poisson's Ratio of 0.25, Figure 2 shows the resulting relationship between the mean spacing of bedding and the E/G modulus ratio. For a mean spacing of 200 mm, the E/G ratio is 100, increasing to 150 for a mean bedding spacing of 135 mm. Based on the data listed in Gerrard et al. (1972), the assumption of isotropy for the intact rock between the bedding introduces a less than 5% error in the estimate when the bedding spacing is less than 300 mm.
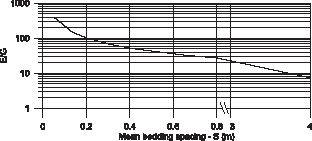
Relationship between the mean spacing of bedding and the E/G ratio for a transversely isotropic continuum.
Reports on the measurement of the spalling limit in the laboratory are limited. Diederichs (2007) inferred that standard laboratory testing could not be used due to the creation of hoop stresses that prevented the growth of additional fracturing (spalling) beyond damage initiation. Kaiser and Kim (2015) proposed a curve fitting method that can be applied to triaxial and uniaxial data and identified a spalling limit of 19.7 for sandstone, equivalent to a SLϕ of 65°. Manipulation of their data on shales would suggest a spalling limit of about 15 or a SLϕ of 61°. The confidence level that applies to their method, especially for low strength material, is not given but inspection of the sandstone data would suggest up to ±10° is possible.
E/G ratio in an underground coal mine
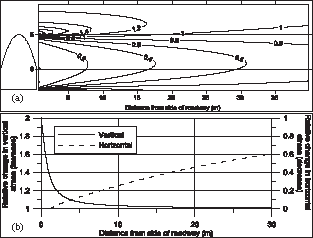
Gale and Matthews (1992) provided data on the relief of the horizontal stress induced by a roadway with a laminated siltstone and laminated shale roof at 500 m depth. In this case study the horizontal to vertical stress ratio was between 1.44 and 1.6, and a height of failure above the first-driven roadway was between 4.5 m and 5.0 m. The pattern of interpreted horizontal stress relief is shown in Figure 3 along with the modelled stress relief 1 assuming an equivalent opening that is 8 m high and a transversely isotropic continuum. An E/G value of 100 would appear to fit the stress data well and referring back to Figure 1, a SLϕ value of 50°–55° would be consistent with a 5 m failure height. An E/G value of 100 corresponds with a mean bedding spacing of 200 mm (Figure 2). Recent roof of these lithologies from the same coal field core using triple-tube barrels typically has about 1 or 2 bedding parting per metre (RQD = 100) with bedding textures spaced between 10 mm and 100 mm. Given the assumptions regarding bedding stiffness this mine data provides evidence that bedding spacing is a major control on transverse isotropy in coal measures sequences.
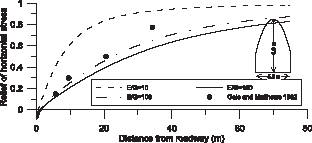
Reduction in horizontal stress along a line drawn at the initial roadway height for different E/G ratios together with the data from Gale and Matthews (1992). Inset shows shape of modelled excavation.
Circular excavations in bedded rock masses
Fall in the Donkin-Morien tunnel
Seedsman (2009) discussed the conditions in the Donkin-Morien tunnel after it was dewatered following intentional flooding in 1992. The lack of maintenance over a 15 year period together with the recognition that the initial ground support in some sectors was inadequate provides the opportunity to interpret the maximum height to which failure can extend (Figure 4). In this case study the collapse at the Emery Seam was at a depth of approximately 250 m, the horizontal to vertical stress ratio was 2.0, and the siltstones had a UCS of 16.6 MPa. The fall height and shape could not be modelled with the Hoek Brown brittle parameters proposed for the sandstones elsewhere in the tunnel (Martin et al. 1998) and required consideration of the spalling limit parameter.
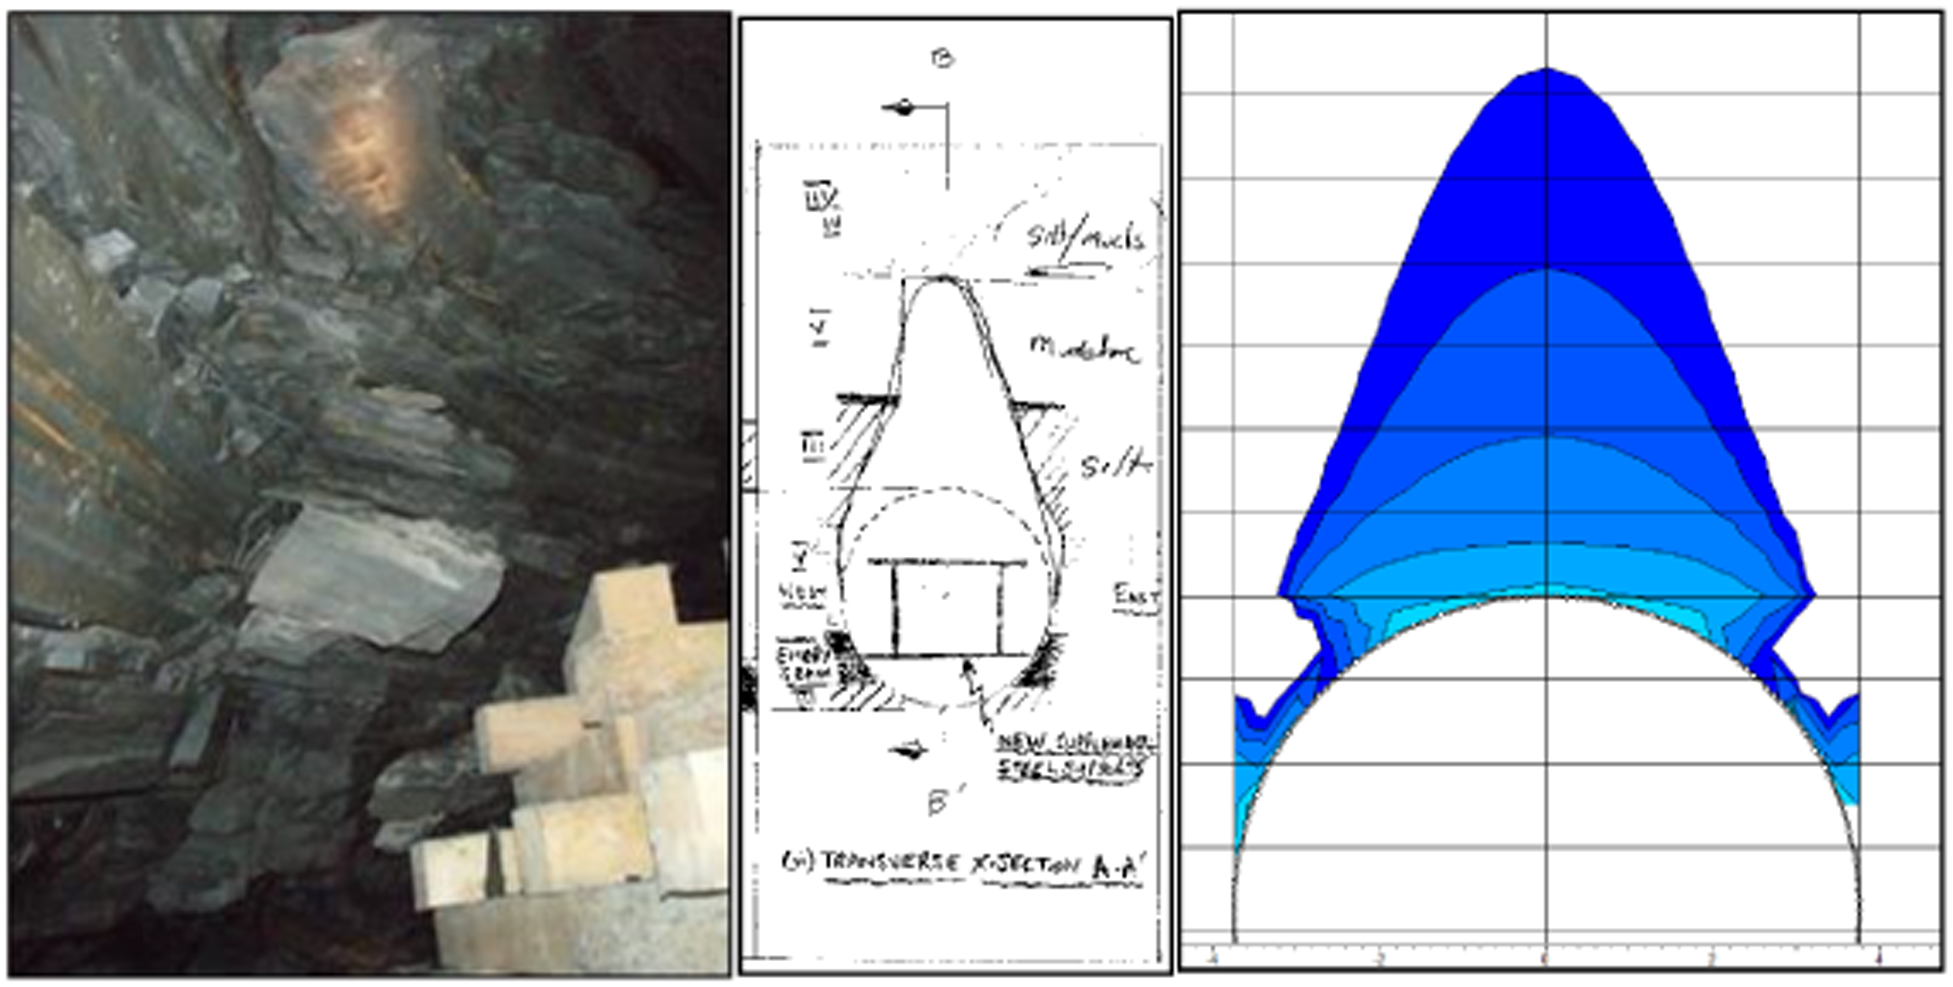
Photograph and sketch of the fall at the Emery Seam in the Donkin-Morien tunnel and the shape of failure zone based on E/G = 122 and SLϕ = 50°.
In Figure 5 the maximum height of failure above a circular opening in a transversely isotropic continuum is shown to be controlled by both the spalling limit and the E/G ratio. The fall at the Emery Seam extended to about 1 tunnel diameter above the crown. If it is assumed that the 50° SLϕ value obtained from the Tower Colliery is a typical spalling limit value for mudstones and siltstones, the Emery Seam fall implies an E/G ratio of 122. Alternatively for an E/G ratio of 100, the SLϕ value is 47°.
E/G ratios and SLϕ values to give heights of failure as a proportion of tunnel diameter.
Niagara tunnel project
Perras (2014) provides details of overbreak in the 14.4 m diameter Niagara Falls Tunnel. In this project the tunnelling contract required intense scaling so that all broken material was removed and on this basis it is assessed that the geometry reflects the maximum extent of failure. The deepest overbreak in the Queenston Formation was typically of the order of 3–4 m, or about 0.3 D, with some instances of up to 6 m or about 0.4 D. The shape of the overbreak can be reasonably reproduced with the TIB continuum model with the skewed geometry obtained if there is a 2° difference in the direction of the horizontal stress compared to the plane of anisotropy (Figure 6). Referring back to Figure 5 with a SLϕ value of 50°, an E/G ratio of between 40 and 50 is indicated. A lower E/G ratio is consistent with the description of the formation as being ‘massive’ and containing ‘a red and grey argillaceous mudstone with occasional siltstone and sandstone interbeds’. Comparing the images, the Queenston mudstones appear to be more massive than those at the Donkin-Morien tunnel.
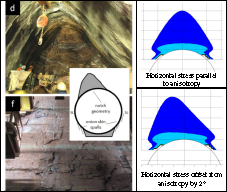
Overbreak in the Queenston Formation in the Niagara Falls tunnel and shape of TIB failure zone if horizontal stress is parallel to plane of anisotropy or offset by 2° (high resolution images supplied by M Perras).
Revised TIB parameters
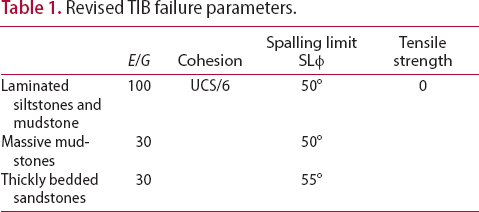
Based on these case studies revised TIB parameters are listed in Table 1. From the back-analyses of three case studies it appears that an E/G ratio of 100 is appropriate for the laminated rocks of the type associated with coal seams. More massive fine grained rock may have a lower value of this ratio and a value of 40 is recommended at this stage based on assuming bedding spacings of about 0.5 m; more work is required to advance this recommendation. The cohesion intercept for all rock types is set as one sixth of the UCS and the tensile strength is set to zero based on the presumption of the presence of joints.
Revised TIB failure parameters.
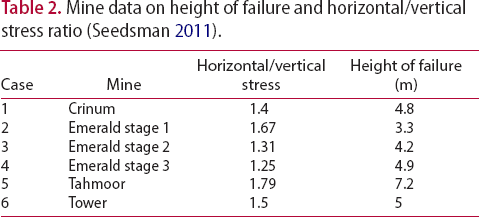
The selection of a spalling limit value from case study data (Table 2) also needs to recognise the role of the horizontal to vertical stress ratio. In Figure 7, a SLϕ value of 50°, equivalent to a σ1/σ3 ratio of 7.5, is indicated for fine grained units (mudstones and siltstones). Note that in the selection of this value, the Emerald Stage 1 data point is ignored as that failure height was later exceeded indicating that a maximum height had not been achieved. No mine or tunnel data has been found to allow an allocation of a spalling limit for sandstones. At this stage, a SLϕ of 55° is proposed for sandstones; this is based on a model that the spalling limit reflects the onset of frictional behaviour and that at these low confining stresses the roughness of the evolving failure surface shear surface is a major component.
Mine data on height of failure and horizontal/vertical stress ratio (Seedsman 2011).
Mine data that constrain the value of the spalling limit (assuming E/G = 100).
Applications
It is not possible to adequately characterise the large volumes of rock involved in high production longwalling and the implication is that the geotechnical models available for support design need to be based on comparatively less data than in civil projects. Coal measure rock masses have a high degree of lateral variation resulting from the diversity of deposition in fluviatile and deltaic sedimentary environments. For Australian longwall mines drill core is available on typically 1 km centres with down-hole geophysical logs in non-cored holes often much closer and in some cases in the order of 100–250 m centres. A design approach that can use geophysical logs will give better appreciation of local variability within the geotechnical model. Geophysical logs are typically presented at 1 cm increments, with the sonic velocity logs giving an acceptable estimate of UCS, the natural gamma log (which ultimately reflects the amount of K bearing illite present) discriminating between sandstones and siltstones/mudstones, and the density log resolving between coal and stone (Figure 8).
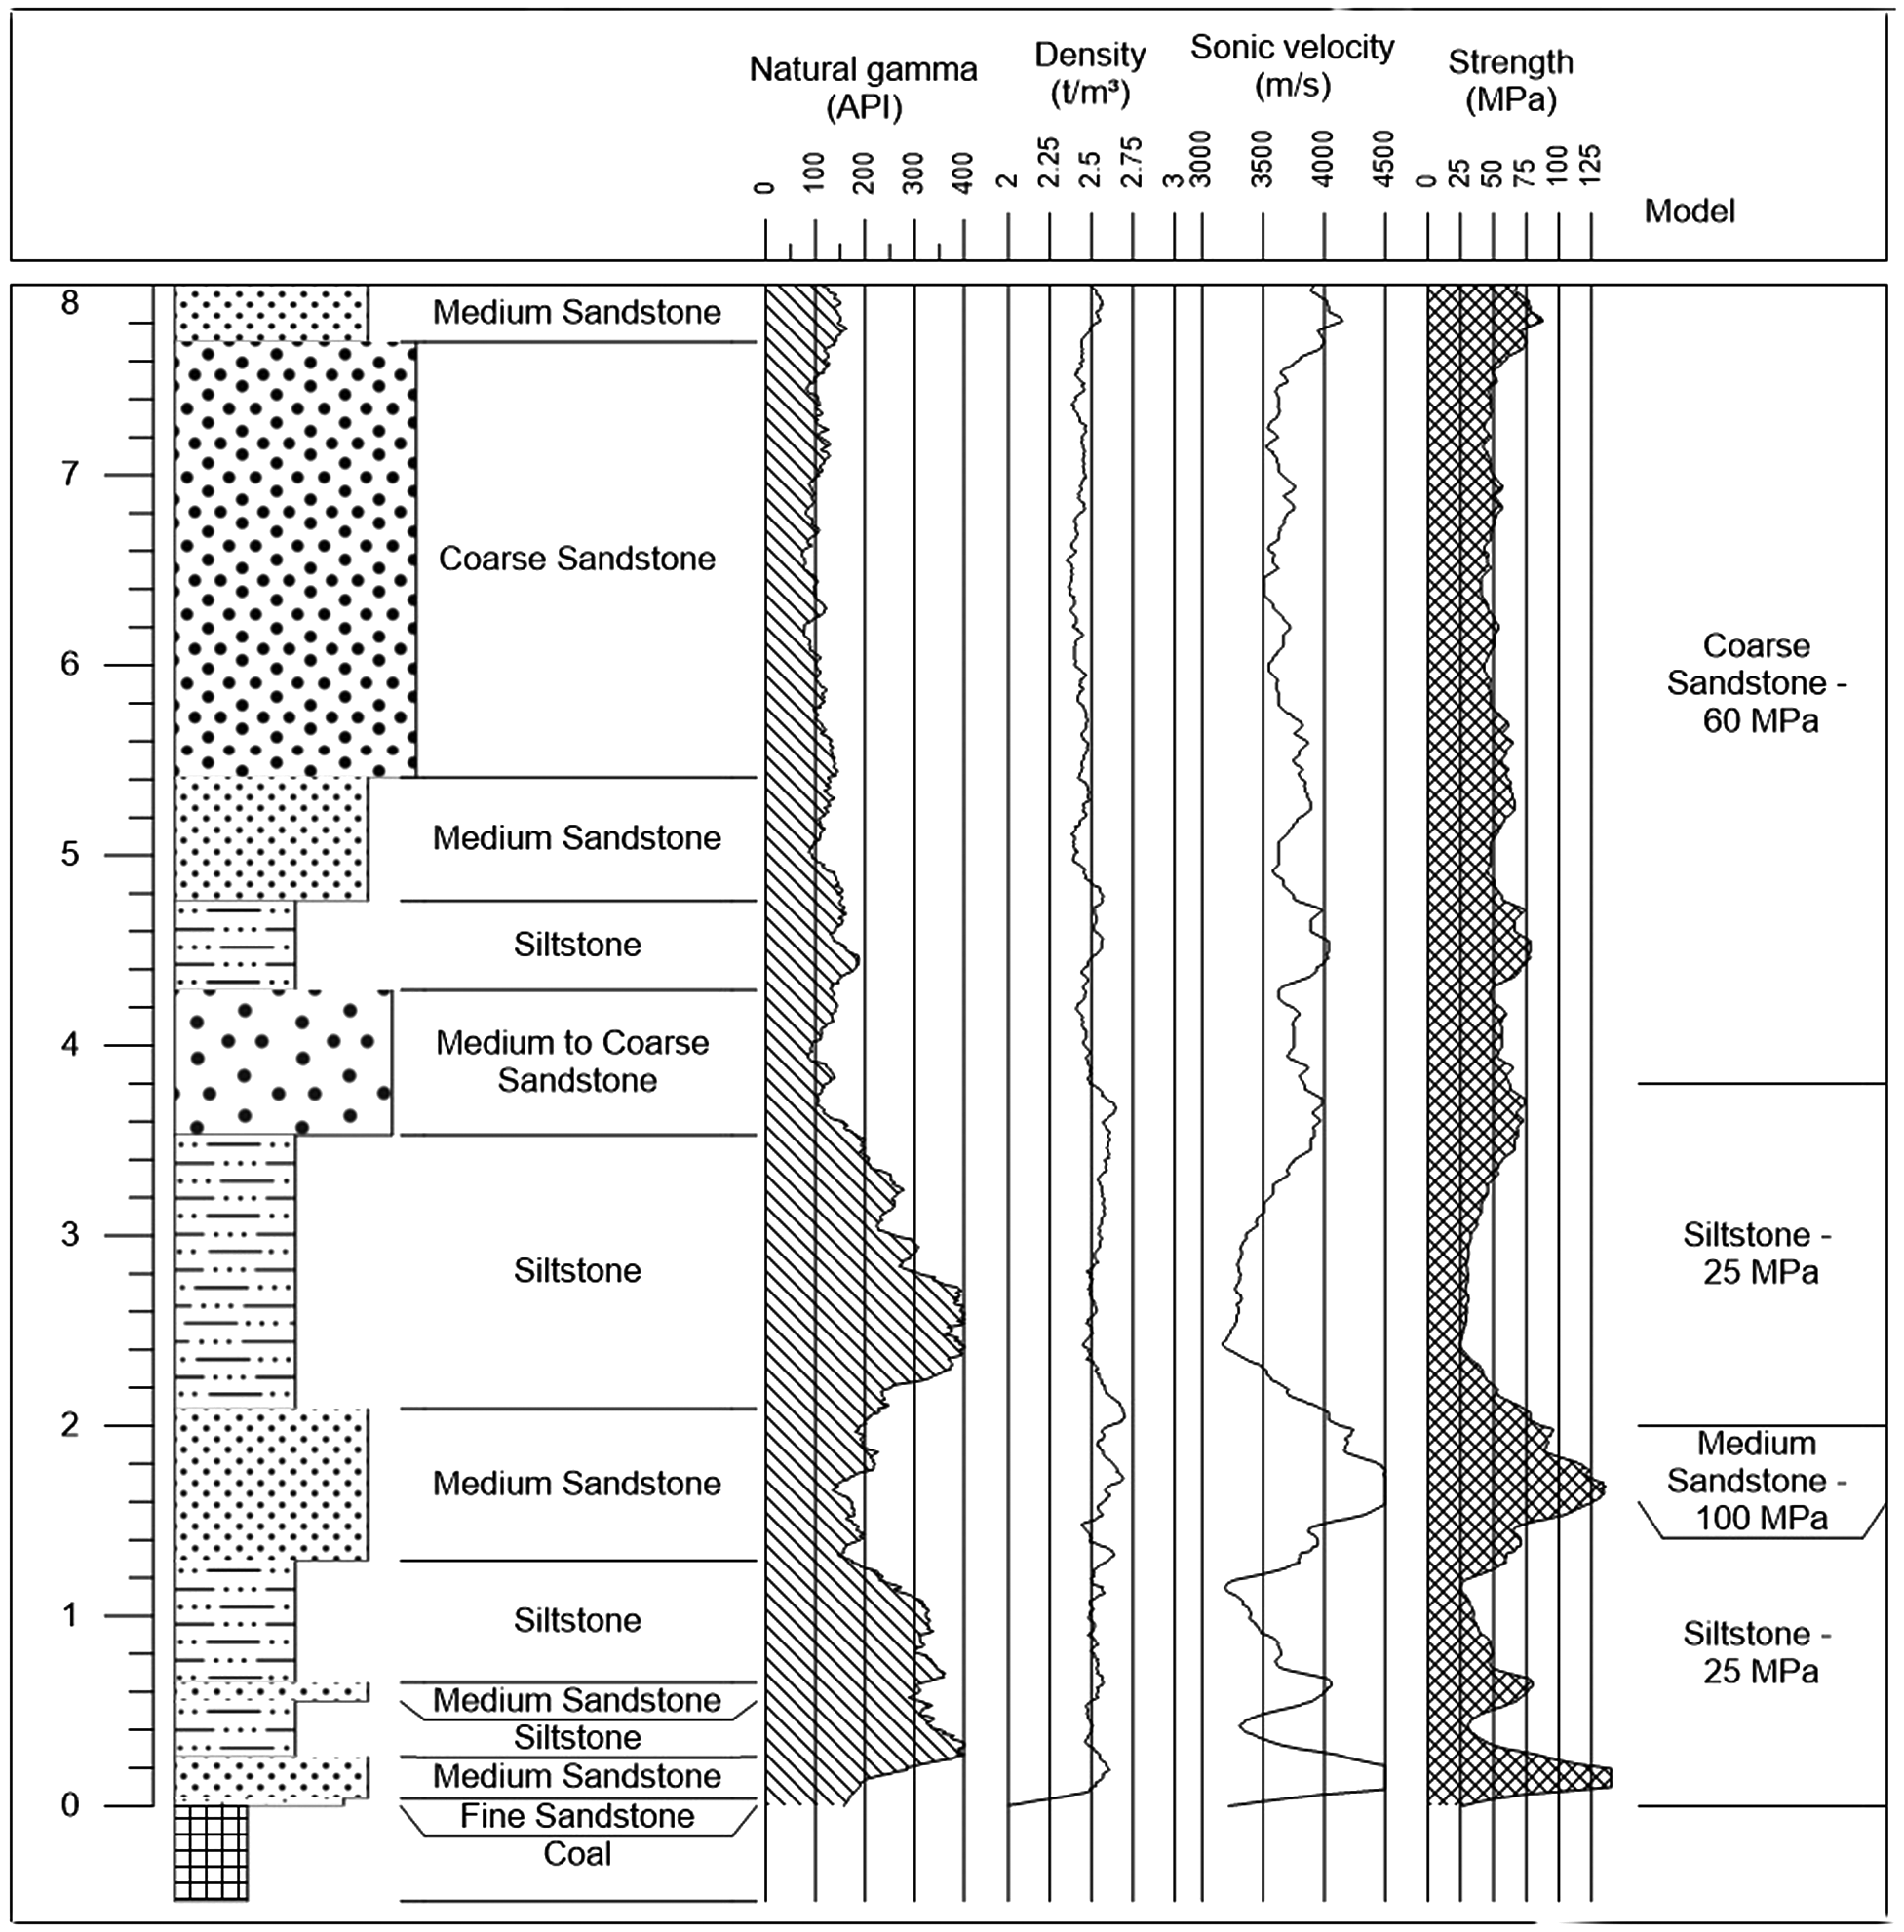
An example of natural gamma, density, sonic velocity and sonic-derived strength logs showing their ability to resolve sandstone from siltstones and to identify strength variability.
The TIB criterion can be implemented in standard stress models using material layers and not joint boundaries. The selection of the E/G ratio can be based on the gamma log response with the delineation between fine grained units and sandstones being at about 115–120 API units. In the absence of a unified failure criterion, analysis could proceed by firstly using the spalling limit parameter to identify maximum height of failure and then running the analysis with the cohesion parameter to determine if the failure is more tightly constrained. In layered models where the cohesion parameters indicate failure high in the roof but stability at the roof line, the design engineer will need to determine if the bulking in the upper zones could induce unacceptable deformations in the layers nearer the roof line.
Design charts for long-tendon support
Simple design charts for long tendon support can be readily produced using the TIB criterion assuming a homogeneous rock mass and stress-path independence (Figure 9). Such charts may be useful for a quick reasonableness check if using a layered model or in prefeasibility and feasibility studies when the ground has not yet been adequately characterised to justify a more detailed analysis. It is important to note that other stability analyses may be required if the potential roof collapse mode is shear on dipping joints or delamination along bedding. Design charts were presented in Seedsman (2011) and the following is an example of how they can be used, noting there have been minor changes in the charts with the revised TIB parameters:
Average UCS = 20 MPa. Depth = 200 m, vertical stress = 5 MPa assuming a density of 0.025 MN/m3. High gamma response, greater than 200 API units – laminated or thinly bedded mudstones. E/G = 100, SLϕ = 50°. Horizontal to vertical stress ratios (k) of 1.6 and 1.2, gateroad driven at 20° to major principal horizontal stress, longwall installation roadway at 70° to major principal horizontal stress. Stress ratios acting across roadways are 1.25 and 1.55 respectively. Gateroad development, 5 m wide, RSI = 4, stress ratio k = 1.25. TIB failure height = 2 m (Figure 9(a)). Longwall abutment: vertical stress doubles, horizontal stress increases by 50% to 9.4 MPa, RSI = 2, k = 0.9. Maingate TIB failure height = 3.4 m (Figure 9(a)). Longwall installation road, 10 m wide, RSI = 4, k = 1.55, TIB failure height = 10 m (Figure 9(b)). Stress relieving roadway for installation road, 5 m wide, RSI = 4, k = 1.55, TIB failure height = 5.3 m (Figure 9(a)).
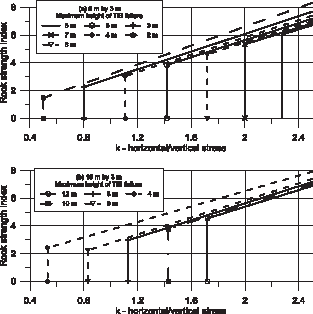
Design charts for single pass roadways in mudstones/siltstones (E/G = 100, SLϕ = 50°). (a) 5 m by 3 m maximum height of TIB failure. (b) 10 m by 3 m maximum height of TIB failure
The shape of the potential fall volume is parabolic and knowing the density a simple dead-weight suspension design can be adopted (Seedsman 2014b). In this example, the roof support requirements for the gate road developments could be met with a pattern of 1.8 m long bolts relying on the outer bolts to suspend the potential fall mass and then 4 m long tendons installed prior to longwall retreat (Figure 10). Note that between 1.5 and 2.8 m along their length the 4 m long tendons must have sufficient ductility to survive the deformations associated with the onset of subsequent rock failure.
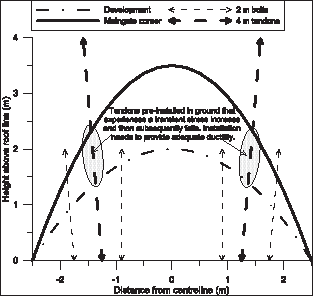
Shape of the TIB failure zones above a 5 m wide roadway and how the length and location of primary bolts and tendons can be considered.
Stress relieving roadway
In the previous example, failure heights above the 10 m wide installation roadway driven as a single pass would exceed the practical installation of long tendons. One often adopted option is to drive a what is called a stress-relieving roadway, support the roof with long tendons, and then develop a new wider roadway immediately adjacent in either one or two passes. Consistent with the assumption regarding dead-weight suspension the failed zone can be assumed to be unable to sustain any horizontal loading and hence the stress-relieving roadway can be modelled as an equivalent opening with a height determined by the extent of failure. Adjacent to a stress relieving roadway it is known that the horizontal stresses at the roof line can be reduced significantly and the behaviour of the sides suggest that the vertical stresses are only slightly increased.
Extending the case study a stress relief roadway would have a TIB failure height of 5.3 m. Figure 11 shows the stress conditions that are induced about this roadway assuming that the failed zone carries no stress and it can be seen that at 15 m offset the horizontal stress is decreased to 0.37 its initial value but there is no change in the vertical stress. The horizontal to vertical stress ratio at the 15 m offset position is therefore 0.37 × 1.55 = 0.57 and the RSI remains unchanged. Thus a roadway driven at this location would have a TIB failure height of less than 2 m according to Figure 9(a). During subsequent stripping to 10 m the immediate roof would be in a stress shadow, but there would be elevated stresses and possibly subsequent failure higher in the roof (Figure 11).
Redistribution of horizontal and vertical stresses around a first driven roadway with a 5 m height of brittle failure in a stress field with k = 1.55: (a) contours of reduction in horizontal stresses showing substantial reductions near the mined roof line (0 m elevation) and increases above 5 m, (b) increases in vertical stress and reduction in horizontal stress at the mined roof line.
Deformation TARPS
Trigger Action Response Plans (TARPS) are used by the workforce to respond to observations or measurements in a pre-determined way, with the triggers levels set by the design engineer. One common trigger relates the onset of a given amount of roof displacement to the requirement to install long tendon support. Fabjanczyk et al. (1992) includes typical plots of height of softening versus displacement at the roof line for bolted roof without long tendons. The height of softening can be considered to be the same of the height of TIB failure. While they and many subsequent workers interpret such plots in the context of using roof support to reduce roof displacement and hence the height of softening, there is an alternative presentation of the empirical data that leads to an interpretation that invokes bulking of the failed brittle rock (Figure 12). Bulking factors, defined as roof movement/height of failure, are shown in Figure 12 for 1, 2, 3 and 5%. The bulking factor in the immediate roof (bolt length of 2 m) is about 1% and beyond that a 5% bulking factor applies, giving an average bulking factor of about 2%. It is interesting to note that these bulking factors are very similar to those reported for hard rock mines (Kaiser et al. 1996).
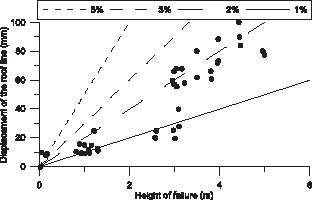
Roof displacement as the dependent variable plotted against measured height of softening and lines of constant bulking factor (data replotted from Fabjanczyk et al. 1992).
It is suggested that roof deformation can be used as a proxy for the height of softening, with a bulking factor of 2% used as a default value until actual mine experience is obtained. In this way, the design engineer can begin to identify from roof displacement data if the failure height is trending to levels beyond that assumed in the design. Yield strain of long tendons is in the order of 0.85% so it is important that any long-tendon design considers displacement as well as force compatibility.
Conclusions and further improvements
The revised parameters make the TIB failure criterion more useful as they allow better inclusion of the observed stress relief around excavations in underground coal mines into roof support design. It is possible to include the criterion in currently available stress analysis software although it involves running two analyses – firstly one based on the spalling limit as an equivalent friction angle to determine the worst case, and then a second one using the cohesion component to determine if failure is initiated. Given the practical difficulties in adequately characterising the immediate roof, there may be more value to use the criterion in a model that assumes homogeneity and this then allows the preparation of simple design charts.
More case study data that quantifies stress relief is needed but it is encouraging that the E/G ratio that has been adopted is consistent with simple models of joint spacing and joint stiffness. More work is required on the stiffness of bedding partings to provide theoretical support to mine site observations. In this paper, the spalling limit has been determined empirically by way of back analysis of a limited number of high roof falls or interpretation of roof extensometry. Research is required to determine if the spalling limit can be measured independently in the laboratory, ideally in the form of some sort of multi-stage test on a single sample.
Disclosure statement
No potential conflict of interest was reported by the author.
Footnotes
1.
All stress analyses conducted with Examine2D, version 8.0.
Acknowledgments
The ideas and concepts reported in this work were developed by Dr. Seedsman during consulting projects to the Australian coal industry.