
Abstract
In this paper, a ring form electronic resistance (ER) sensor system was developed for the study of under-deposit corrosion (UDC) caused by mineral deposit in pipeline conditions. The corrosion status of different locations along the pipeline circle direction and the galvanic current between the deposit-covered area and the bare steel area were monitored by the conjunction of the ER method and electrochemical noise technique. The performance of inhibitor ethylene diamine tetra methylene phosphonic acid sodium (EDTMPS) on UDC was studied by both the electrochemical method and the ring form ER sensor system. The measurement results demonstrated that the inhomogeneous distribution of the rust layer will cause heterogeneous corrosion patterns in the pipeline. Though EDTMPS showed an excellent inhibition effect for the corrosion of both deposit-covered steel and bare steel in electrochemical tests, it failed for the inhibition of UDC in the pipeline working conditions and serious localised corrosion beneath the sand particle was monitored by the sensor system.
Introduction
It has been stated that under-deposit corrosion (UDC) is a tough problem for pipeline industry. 1 Mineral deposits such as silica sand and carbonate deposits will accumulate at the bottom of the pipe when the fluid velocity is insufficient. 2 The concentration of aggressive ions and pH in the environment of the area with deposit covered is always different from the areas without deposit covered. 3 Therefore, galvanic corrosion cell will form between the region under deposit and the area without deposit.4,5 Studies have found that the under-deposit region will always act as the anodic area in traditional petrolic pipelines containing carbon dioxide with the temperature above 60°C.6,7 The introduction of oxygen into the pipeline will also intensify the galvanic effect caused by the mineral deposit.8,9 Seriously, pitting and mesa-type of attacks are frequently observed in the area with mineral deposit covered.10,11
Owing to the high cost of frequent pigging work, corrosion inhibitor treatment is widely applied for the inhibition of UDC in pipelines. 12 Inhibitors are thought to mitigate UDC when the concentration is relatively high. 6 However, in recent researches, some experiment results showed that different kinds of inhibitors may have different performances for UDC.1,13 Some kinds of inhibitors may have positive impact for the acceleration of the corrosion beneath the deposit. Tan et al. 14 even found that the most common inhibitor imidazoline would cause under-deposit area changing into the anodic area in CO2 saturated pure brine solution at indoor temperature. Various monitoring techniques, such as linear polarisation resistance (LPR), potentiodynamic polarisation (PDP) and electrochemical impedance spectroscopy, were introduced for the monitoring of UDC. However, these conventional methods only can provide general information of UDC rather than the initiation and propagation information of the localised corrosion on the deposit-covered area.15–17 Recently, wire beam electrode 18 (WBE) and electrochemical noise 19 (EN) techniques are developed for the studies of heterogeneous corrosion. WBE can simulate the corrosion processes on a one-piece electrode by continuously mapping the potential and galvanic current on the surface of WBE. 20 Though the WBE method and the EN technique have been successfully used for the studies of UDC and its inhibition in various laboratory tests,4,6,14,21 the inhibition effects of the inhibitors on UDC are still hard to be assessed in real pipelines because the long-term corrosion monitoring sensors based on these techniques are hard to be realised in practice pipeline industry. When the galvanic corrosion behaviour makes great contribution to the acceleration of UDC, it becomes nearly impossible to monitor the corrosion behaviour beneath the deposit in real pipeline working conditions.
In the previous study conducted by Huang et al.,
22
a new kind of electronic resistance (ER) sensor was provided for the corrosion monitoring in the simulated deposit-covered pipeline condition. The sensor was composed of a mild steel ring pair which was directly cut from the real pipeline and divided into six segments around the circumferential direction. Figure 1 shows a sensor spool containing two sets of ring pair ER sensor (RPERS). The RPERS consists of a corrosion ring for the sensing of corrosion and a reference ring for the temperature compensation. Its basic measurement principle is same with other ER sensors.
23
The corrosion depth of each segment on the ring pair can be calculated according to the equation
The sensor spool containing two sets of RPERS; outer surface of the sensor spool (left) and inner surface of the sensor spool (right)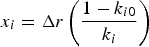
where xi is the corrosion depth of the segment i (i = 1, 2, 3 … 6), Δr is the initial wall thickness of the corrosion ring, ki 0 is the initial resistance ratio of segment i between the reference ring and the corrosion ring and ki is the instant measurement result of the resistance ratio during the monitoring period. Based on its special structure and measurement principle, the galvanic effect among the different locations of the pipeline can be detected as well. The UDC behaviour in oxygen-contained pipelines was studied and the inhibition effects of two different kinds of inhibitors were also tested. The study revealed that mineral deposit nearly had no influence for the galvanic cell in oxygen-contained saline solution. However, after inhibitor aminotris (methylenephosphonic acid) 24 (ATMP) was introduced into the pipe, the galvanic corrosion behaviour was enhanced and seriously localised corrosion occurred on the bottom section. Though the average corrosion rate of the whole ring decreased after the inhibitor was added, the corrosion rate of the under-deposit area was much higher than the desired value for pipeline industry. The galvanic corrosion process is hard to be monitored by other kinds of corrosion sensors, but it can be easily detected by this new designed ring form ER sensor.
Though the galvanic corrosion behaviour can be reflected more closely to practical situation using RPERS compared to traditional corrosion sensors, the measurement results still have some deviations from real UDC processes. Owing to the insulation layer on the side face of the rings, the new sensor can only simulate the galvanic corrosion behaviour on circle direction. However, the area of the deposit-covered region is always very small along the pipeline axial direction, the galvanic corrosion effect between the deposit-covered area and the non-deposit area along the axial direction cannot be neglected. Therefore, the measurement results may be conservative with regard to real UDC behaviour. Another defect of the new sensor is that in each divided segment, the corrosion patterns were thought to be homogeneous. Thus, the localised corrosion propagation on each segment is hard to be evaluated only based on ER signals.
To understand well UDC and its inhibition in oxygen-dissolved pipeline conditions, a real pipeline circulation system containing two sets of RPERS and a single corrosion ring is established. The galvanic current and voltage signals between the corrosion rings and the ER signals of each segment were on-line monitored by the sensor system. The performance of corrosion inhibitor ethylene diamine tetra methylene phosphonic acid sodium (EDTMPS) on UDC was first studied by electrochemical methods and its action effect was further studied by the application performance in the pipeline circulation system. The propagation of localised corrosion in the deposit-covered area and its inhibition was studied by both the ER method and the EN technique.
Experimental methods
Electrodes and solution used for electrochemical test
The material used in the electrochemical test was API X65 pipeline steel, with a chemical composition of (wt-%): C 0.10%, Si 0.15%, Mn 1.5%, P 0.02%, S 0.01%, Mo 0.02% and Fe being the balance. The specimens were machined in a dimension of 10 × 15 × 3 mm (a working surface area of 1.5 cm2). The specimens were sealed with epoxy resin with the end face exposed to the solution. A copper wire was welded at the back side of the specimen, which was sealed in the epoxy. Before the tests, the working face was ground consequentially up to 1200-grit-silicon-carbide paper, rinsed with deionised water and degreased in acetone.
The test solution was prepared as the 3.5 wt-% NaCl solution. During each test, the solution was placed in an air-conditioned room with its temperature kept at 19 ± 2°C. Air sparging of the solution was continued, and the dissolved oxygen (DO) concentration was kept higher than 6 mg L−1, which was monitored by a YSI ProComm DO monitor. The measurement accuracy of the DO monitor is ±0.1 mg L−1.
Preparation of mineral deposit and corrosion inhibitor
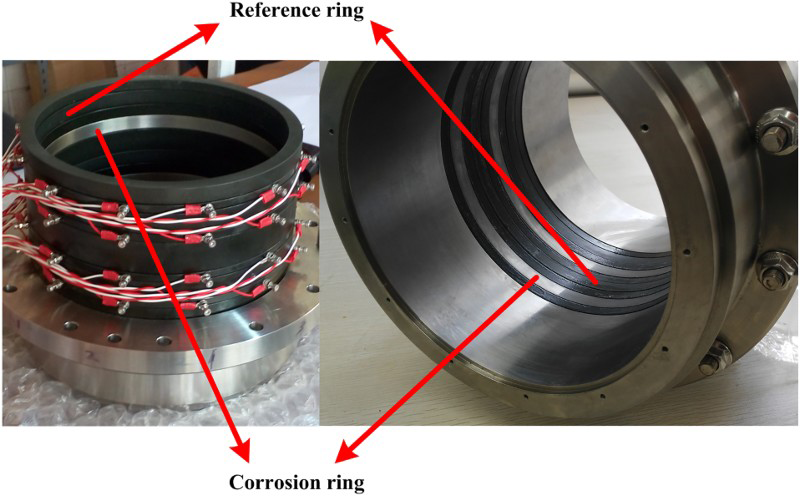
The deposit in this study was silica sand and the mean size of the sand particles was 330 μm, as shown in Fig. 2a. The silica sand particles were commercially purchased from Chemical Ltd, and the purity of the sand deposit is higher than 99.8%. The porosity of the deposit was 55%, and the uniformity was 90%. The sand particles were heated in boiling water and rinsed with deionised water to remove the inclusions. The deposit was placed on the electrode surface with a 4-mm thickness layer in each electrochemical test.
Silica sand and molecular structure of EDTMPS used for tests: a photo of silica sand, b molecular structure of EDTMPS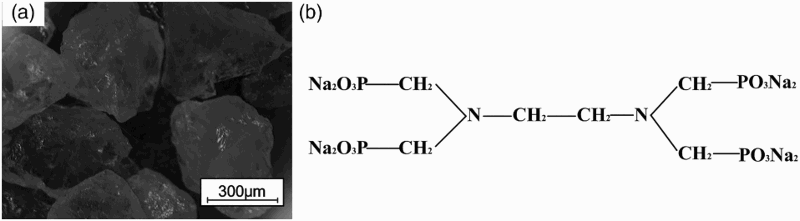
The organic phosphine inhibitor EDTMPS, which is widely applied in a cooling water system and oil pipelines, was used in this study. The inhibitor EDTMPS was provided by Tai-He Ltd (Shandong, China). The molecular structure of EDTMPS is shown in Fig. 2b. The working concentration of the inhibitor was 35 mg L−1 in the experiment.
Electrochemical measurements
Two sets of three-electrode electrochemical cells were used for LPR and PDP measurements. The three-electrode system was constructed with the X65 carbon steel electrode as a working electrode (WE), a platinum plate as a counter electrode and a saturated calomel electrode as a reference electrode. The LPR method was used for the monitoring of the corrosion rates for over 24 h. LPR measurements were performed by applying anodic voltage scans at the rate of 0.1 mV s−1 over a range of ±10 mV around the stabilised open-circuit potential (OCP). PDP curves were measured by scanning the potential from −300 to +300 mV (OCP) at a sweep rate of 1.5 mV s−1. Four WEs which were divided into two groups were placed in two test cells, as shown in Fig. 3. The four electrodes were alternately connected to the electrochemical station CS 350 (CorroTest, China) for LPR and PDP measurements through CS 16X (CorroTest, China) multi-channel auto switches. During the LPR and PDP tests, one of the electrodes in each group was covered with a 4-mm thick sand layer and the other one was keeping bare. The test solution in one of the cells was 3.5% NaCl solution from beginning to end without inhibitor added. While the solution in the other cell was kept as 3.5% NaCl solution at first and with 35 mg L−1 EDTMPS added after the specimens corroding for 4 h.
Schematic diagram of electrochemical test cells used for LPR and PDP measurements
After the four electrodes were kept immersing in both solutions for over 96 h, they were taken out and the corrosion morphology of each electrode was shot by a digital camera. The surfaces of the electrodes were also observed by an FEI Quanta 200 scanning electron microscope (SEM) after the tests.
Structure and measurement principle of ring form ER sensor system
Detailed information of a single RPERS has been described in the previous papers.
22
RPERS is composed of two rings, i.e. a corrosion ring and a temperature compensation ring. Each ring is divided into six segments along the circumference direction, as shown in Fig. 4a. It can be seen from Fig. 4a that segments 1, 5 and 6 were located on the upper half of the pipe and segments 2-4 were placed on the half bottom of the pipe. The dimensions of the rings used in the test are shown in Fig. 4b. The diameter of the ring was 8 in. and it can be calculated that the inner surface area of each ring was 61 cm2.
The location of each segment a on the ring circle direction and the dimension b of the ring pair sensor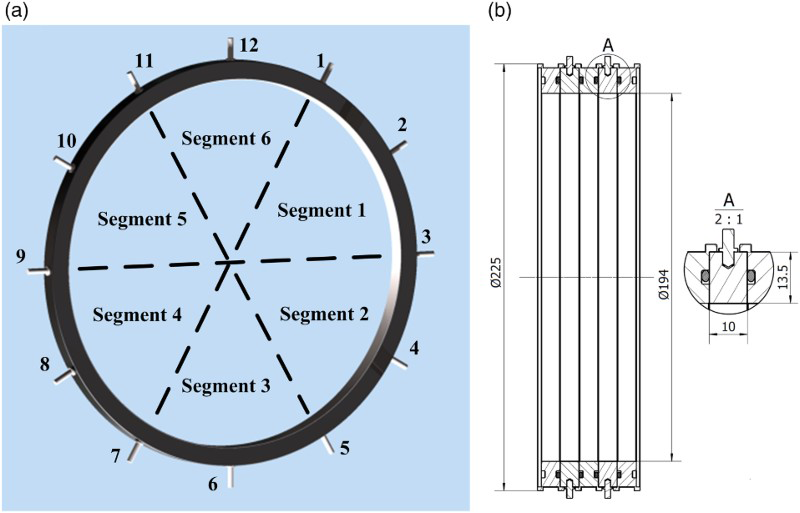
The corrosion rates of each segment can be monitored through the injection of three alternating excitation currents into the ring sensor from different angles. The measurement principle of RPERS for each segment is basically consistent with the other ER sensors. For the corrosion ring with constant wall thickness corroding uniformly, the extent of corrosion can be represented as a corrosion depth. However, when the corrosion occurs in a localised form on one segment, the corrosion depth measured from an ER signal of this segment is unreliability. Severe pits and narrow crevice corrosion patterns may occur without a significant resistance change due to the tiny change of the cross-section. The measurement error caused by localised corrosion is also a common problem for all ER sensors. Therefore, the introduction of EN measurements between the rings can make up for the drawback of RPERS to some extent.
In this research, two sets of RPERS and a single corrosion ring were used which are shown in Fig. 5a, and the principle test diagram of the sensor system is shown in Fig. 5b. It can be seen from Fig. 5 that five ring form ER sensors which were defined as Ring 1 to Ring 5 were mounted in the sensor system. Rings 1, 2 and 4 were used as corrosion elements with its surface exposed to the pipeline solution. Rings 3 and 5 were used as reference elements which provided temperature compensations. Ring 3 worked for both Rings 1 and 2 as a temperature compensation ring in corrosion depths measurement. An acrylic circle groove which was used for sand adding was fixed on the bottom section of Ring 2. The bottom section of Ring 2 was used for the simulation of the deposit-covered area and the groove could guarantee that sand deposits would not be carried away in the pipeline.
Photo and schematic diagram of the sensor system: a photo of the sensor system, b measurement principle diagram of the sensor system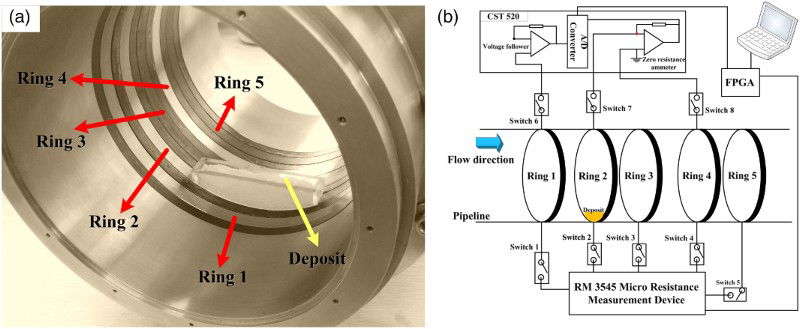
It can be seen from Fig. 5b that the ring form ER sensor system was composed of two monitoring parts, i.e. the corrosion depths monitoring of the segments on the rings by RM 3545 Micro Resistance measurement device (HIOKI, Japan) and the EN monitoring by zero resistance ammeter (ZRA) and high resistance voltage follower (CST 520, CorroTest, China). The resistance resolution of RM 3545 is 10 nΩ. In the voltage and galvanic current measurement, the resolution of the voltage is less than 3 μV and the resolution of the current is less than 10 pA. The monitoring functions were altered by Switches 1-8, as shown in Fig. 5b. All the switches could be controlled by the field-programmable gate array which contained an auto-switch control programme. During the EN measurement, Switches 1-5 were opened, whereas Switches 6-8 were closed. The galvanic current between Ring 2 and Ring 4 and the potential difference between Ring 1 and coupled Rings 2 and 4 could be monitored on-line. The monitoring frequency was 2 Hz in the test. For the corrosion depth measurements, Switches 6-8 were opened and the other five switches were closed. The five rings were connected to RM 3545 for ER measurement. The changes of ER signals could illustrate the corrosion depths of the segments and the corrosion rates could also be calculated through the slopes of the corrosion depth curves. 25 The cycle periods for corrosion depth measurements were 1 h and the measurement duration was 30 s. For the other time, galvanic current and potential difference signals were kept for continuous monitoring.
The influence of the galvanic current between the deposit-covered area and the bare region along the axial direction could be monitored through the sensor system. It led to the measurement results more close to real situation. Since the variation of the ER signal is only correlation with the change of the ring's cross-section, the corrosion rate of each segment could be actually reflected without considering other interference conditions such as the conductivity of the fluid medium or the reaction of the rust layer on the steel surface.16,26 In the long-term pipeline corrosion monitoring test, the corrosion rates and EN messages could be approximately thought to be measured synchronously by the sensor system. The propagation of UDC in pipeline conditions could be studied with the analysis of both ER and EN signals.
Pipeline circulation system
As shown in Fig. 6, the pipeline circulation system was composed of four parts: the ring form ER sensor system, variable-speed pump, water tank and 8 in. circulation pipe. It can be seen that the sensor system was built up with a main chamber and an electronic cabin. The main chamber which contained the ring probes was butt welded by two pieces of reducer pipes. The reducer pipe was made of F65 carbon steel which chemical composition is near to X65 pipeline steel. The electronic measurement devices were placed in the electronic cabin. A 1.5 m-long-subsea-umbilical cable was used for the connection of the ring form sensors and the electronic measurement devices. The sand deposit was previously added into the groove before the flanges butt jointed.
Composition parts of the pipeline circulation system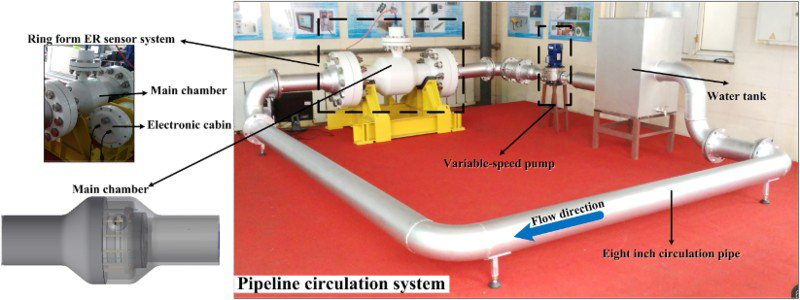
The whole system was also placed in an air-conditioned room with temperature fluctuation at 15 ± 3.5°C. Since the circulation pipe did not have any heat insulation measures, the temperature of the fluid in the pipe was nearly equal to the ambient temperature. At the beginning of the test, pure deionised water was injected into the system to wash the pipe. After the deionised water was drained away, sodium chloride solution was introduced into the circulation system with the concentration of 3.5% by weight and this working condition was kept for nearly 175 h. During this period, the flow rate of the system was kept at a quiet low value of 0.011 m s−1 (20 L min−1) leading to the fluid in the pipe was thought to quasi-static. The solution can only exchange oxygen through a small area at the top of the water tank during this period and the DO concentration monitored by a YSI DO monitor decreased from 7.5 mg L−1 at the beginning to 2.1 mg L−1 after the pipeline corroding for over 96 h. Because DO monitoring point was near the tank, the DO concentration at the ring sensor section might be lower than that near the tank. Following, air was pumped into the solution through two sets of oxygen pumps and the DO concentration rose to higher than 8.7 mg L−1 near the tank. When the monitoring data became stable after the DO concentration was increased for 75 h, the flow rate was regulated to 0.022 m s−1 (40 L min−1) and the status was kept monitoring for another 45 h. The galvanic corrosion behaviour in different working conditions was studied by the pipeline circulation system. Later, the inhibitor EDTMPS was added into the system with a concentration of 35 mg L−1, the inhibition effect for the galvanic corrosion behaviour between the deposit-covered area and bare steel area was also studied by the sensor system.
Results
The performance of inhibitor EDTMPS for under-deposit corrosion
Figure 7a and b shows the polarisation curves of the bare and deposit-covered electrodes in 3.5% NaCl solution without inhibitor and with EDTMPS added for 24 h. It can be seen in no inhibitor conditions that the corrosion current density (i corr) of the electrode with silica sand covered was lower than that of the bare electrode. It suggests that the coverage of the surface by the deposit layer minimised the dissolution of steel. The corrosion potential (E corr) of the deposit-covered electrode was 45 mV lower than the bare electrode. The corrosion potential, corrosion current density and Tafel constants (ba, bc) fitted from the Tafel extrapolation of the polarisation curves are shown in Fig. 7. The Stern constant (B = babc/2.303(ba + bc)) was also calculated. The electrochemical parameters obtained from the potentiodynamic tests are all listed in Table 1.
Measurement results of polarisation curves of the bare electrode and deposit-covered electrode a 3.5% NaCl solution with no inhibitor, b with 35 mg L−1 EDTMPS added for 24 h Fitted electrochemical parameters derived from the polarisation curves of bare and under-deposit electrodes in different inhibitor conditions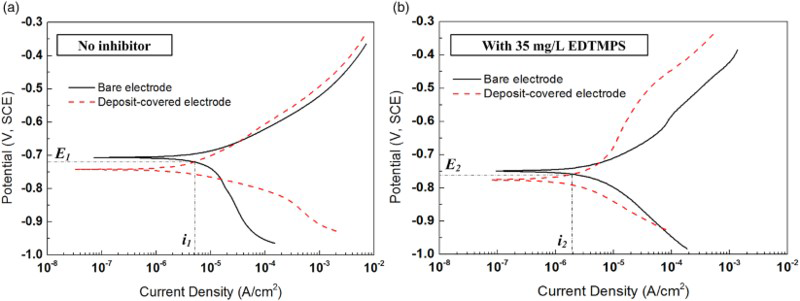
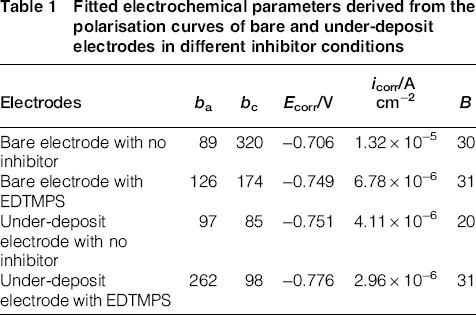
It can be seen from Table 1 that the corrosion potential of both the bare electrode and the deposit-covered electrode shifted negatively after 35 mg L−1 EDTMPS was added, indicating that the inhibitor EDTMPS is a kind of a cathodic inhibitor. As shown in Fig. 7b, an obvious pseudo-passivation behaviour is observed on the curve of the deposit-covered electrode which means that EDTMPS also has a retard effect for the anodic reaction of the steel with sand covered. The corrosion current density of the bare electrode significantly decreased from 1.32 × 10⁻⁵ to 4.11 × 10⁻⁶ A cm−2. For the deposit-covered electrode, the corrosion current density also had a dramatic reduction from 6.78 × 10⁻⁶ to 2.96 × 10⁻⁶ A cm−2, suggesting that EDTMPS has an excellent inhibition effect for both bare steel and deposit-covered steel in oxygen corrosion conditions.
Because the corrosion potential of the deposit-covered electrode was always lower than that of the bare electrode in the both solution with and without inhibitor. It can be deduced that the deposit-covered electrode will act as the anode and the bare electrode will be the cathode once they are coupled. When the two electrodes are coupled, the potentials of the both electrodes will be polarised to the same coupling potential. The action effect of EDTMPS for the galvanic current can be qualitative analysed through the intersection points of the curves (i 1, E 1) and (i 2, E 2), as shown in Fig. 7a and b. It can be clearly seen that the galvanic current density i 2 is much lower than i 1 as shown in the two figures. It seems that EDTMPS also has an inhibition effect for the oxygen concentration cell between the bare electrode and the deposit-covered electrode in the brine solution.
Figure 8 shows the changes of the corrosion rates of the four electrodes measured by the LPR method with EDTMPS injected into one cell after the electrodes corroding for 4 h. The corrosion rate was calculated through the Stern–Geary equation
Time dependence of the corrosion rates measured by the LPR method with 35 mg L−1 EDTMPS added

where i corr is the corrosion current density, B is the Stern constant which is chosen from Table 1 for different conditions and Rp is the LPR calculated from the slope of the linear polarisation curve. It can be seen from Fig. 8 that the corrosion rates of the two bare electrodes in 3.5% NaCl solution were both near to the value of 0.17 mm a−1. The corrosion rate of one of the bare electrode had a large decrease to the minimum value of 0.062 mm a−1 in 2 h and slightly came back to a stable value of 0.082 mm a−1 after EDTMPS was added. The final corrosion rate of the bare electrode was lower than 0.1 mm a−1, suggesting a desire corrosion rate in oil pipeline industry. The initial corrosion rate of the deposit-covered electrode was quite low and it gradually shifted from 0.051 mm a−1 to only 0.026 mm a−1 after EDTMPS was introduced into the solution for 6 h. The measurement results revealed that 35 mg L−1 EDTMPS could successfully inhibit UDC in oxygen-contained brine solution.
Surface characterisation
Figure 9 shows the photos and SEM views of the surface morphologies of the four electrodes after exposed to the test solution for over 96 h. It can be seen from Fig. 9a that a dark corrosion product layer was formed on the surface of the bare electrode in 3.5% NaCl solution without inhibitor. The surface of the bare steel became rough and it means a high uniform corrosion rate of the bare electrode. For the deposit-covered electrode, the corrosion pattern was inhomogeneous. There was nearly no corrosion products layer beneath the sand particle and it seems no corrosion happened on the deposit-covered area in macro photograph. However, crevices and small pits can be seen from the SEM image of the area with sand particle covered, as shown in Fig. 9b. It means that though the general corrosion rate of the steel under deposit decreased to a lower value in the brine solution, localised corrosion patterns such as crevice and pit corrosion would germinate in this area. It is seen from Fig. 9c and d that protective films formed on the steel surfaces of both the bare electrode and the deposit-covered electrode after EDTMPS was added. The protective film on the deposit-covered area was even more density than that of the bare electrode as shown in the SEM images. It suggests that EDTMPS is a quiet efficient inhibitor for UDC and its inhibition effect for the deposit-covered area is even better than the bare steel from the film formation results. It also explained the obvious pseudo-passivation behaviour of the deposit-covered steel as shown in Fig. 7b due to the dense protective film on the deposit-covered steel surface.
Photos and SEM images of the X65 steel surface corrosion morphologies a bare electrode with no inhibitor added, b deposit-covered electrode with no inhibitor added, c bare electrode with EDTMPS added and d deposit-covered electrode with EDTMPS added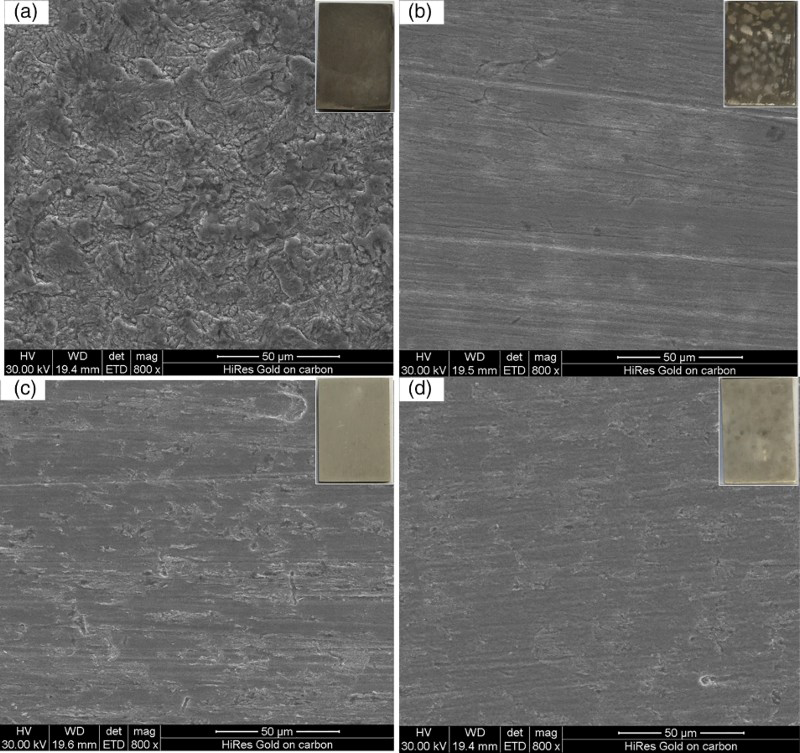
Monitoring results of the corrosion depths by the ring form ER sensor system
The corrosion depths of each segment on the Rings 1, 2 and 4 are plotted in Fig. 10a–c and the average corrosion depths of the three rings are shown in Fig. 10d. It also can be seen from Fig. 10 that the fluctuation noise of the corrosion depth measurement results generated from RPERS is nearly ±0.27 μm. It means that the resolution of the corrosion depth measured by RPERS is 0.54 μm. As shown in Fig. 10a, the corrosion depths of the six segments on Ring 1 started to increase rapidly after the introduction of the NaCl solution. It demonstrated the rapid response of the sensor system and indicated the high corrosion rates of the segments during the initial period of the circulation. It can be found that in the first 10 h, the bottom segment 3 of Ring 1 had the highest corrosion rate near 1.49 mm a−1 and the corrosion rates of the segments 2 and 4 beside segment 3 were 1.11 and 1.02 mm a−1. The corrosion rates of the segments 1, 5 and 6 on the upper half were 0.34, 0.4 and 0.9 mm a−1, respectively. With the consumption of the DO in the pipe and the forming of the rust layer on the pipeline inner surface, the corrosion rates of the six segments all decreased to quite low and stable values after the NaCl solution circulated for over 96 h. The bottom section still had the largest corrosion depth which was close to 4.2 μm before the rise of the DO concentration. It also can be observed that the corrosion depths of the segments on the bottom half were always larger than those of the upper segments. This phenomenon became more obviously after the DO concentration rose to higher than 8.7 mg L−1 in the pipe. Except the top segment 6, the slopes of the corrosion depth curves of segments 1-5 all had a sudden increase with the promotion of the DO concentration demonstrating significant increases of the corrosion rates on these segments. The corrosion rates of segments 1-6 calculated from the slopes were 0.35, 0.51, 0.69, 0.46, 0.32 and 0.093 mm a−1, respectively. It can be seen from Fig. 10a the increase of the flow rate from 20 to 40 L min−1 nearly had no influence to the corrosion rate of the segments on Ring 1 and same monitoring results were also found on Rings 2 and 4. When 35 mg L−1 EDTMPS was introduced into the pipeline, it can be obviously observed that the corrosion rates of segments 1-5 all decreased to the values close to 0.10 mm a−1 which meant EDTMPS had an excellent inhibition effect for the corrosion in pipeline working conditions. However, the corrosion rate of the top segment had a slight increase to 0.11 mm a−1 which was a little higher than no inhibitor conditions.
Measurement results of the corrosion depths a corrosion depth of each segment on Ring 1, b corrosion depth of each segment on Ring 2, c corrosion depth of each segment on Ring 4 and d the average corrosion depths of the corrosion rings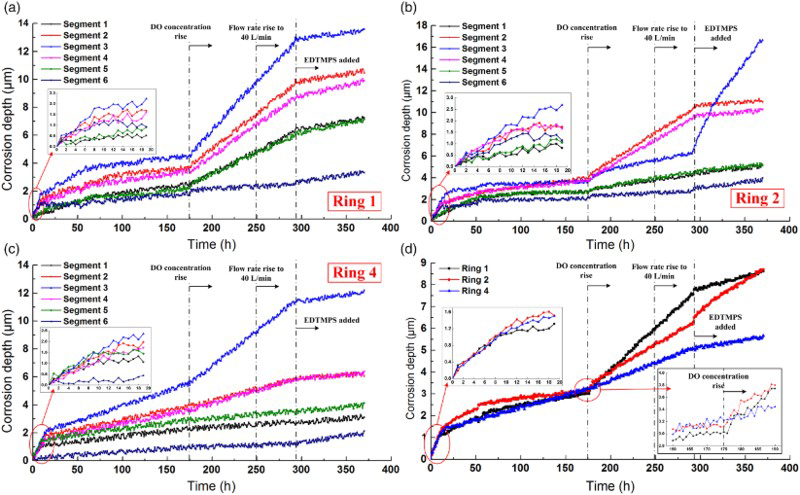
Figure 10b shows the corrosion depths of the segments on Ring 2. It can be seen that the bottom segment which was covered by the silica sand also had the highest corrosion rate near 1.34 mm a−1 at the beginning and its corrosion depths reached nearly 2.5 μm in 15 h. However, after the system became stable and with the reduction in the DO concentration, the corrosion rates of the segments 2 and 4 became the fastest and the corrosion depths of the two segments were higher than that of bottom segment after 160 h. After the oxygen pumps began to work, the corrosion rates of the segments 2 and 4 beside the deposit-covered area increased dramatically to 0.48 and 0.44 mm a−1. The corrosion rate of the deposit-covered segment 3 had an increase to 0.21 mm a−1 and the corrosion rates of segments 1, 5 and 6 also rose to 0.11, 0.13 and 0.053 mm a−1, respectively. It can be also found that the increase in the flow rate nearly had no impact for the corrosion rate of each segment. After EDTMPS was introduced into the pipeline, the corrosion rate of the deposit-covered segment immediately increased to a peak value of 1.50 mm a−1 and eventually decreased to 1.37 mm a−1. It indicated that the failure of the inhibitor and serious corrosion happened beneath the silica sand. However, the corrosion rates of other segments all kept below 0.1 mm a−1 after EDTMPS was added and a slight increase of the corrosion rate was also found on the top segment of Ring 2.
The corrosion processes of Ring 4 were nearly same with Ring 1 through the test which is shown in Fig. 10c. The bottom segment occupied the fastest corrosion rate before the corrosion inhibitor was added. However, in the first 175 h, the corrosion rates of the six segments did not have obvious mitigation with the reduction in the DO. The corrosion rate of the bottom segment even had a little uplift during this period. Except the bottom segment, the corrosion rates of the other five segments were quiet low and the rise of the DO concentration only had a slight promotion for the corrosion behaviours. With the introduction of EDTMPS, the corrosion rates of each segment all reached the value close to 0.1 mm a−1 and the corrosion rate of the top segment also had a small increase on Ring 4.
The average corrosion depth of each ring is calculated and plotted in Fig. 10d. It can be seen that Ring 2 had a higher corrosion rate than the other two rings in the first 50 h after NaCl solution was pumped into the pipe. However, after the oxygen pump began to work, the average corrosion rate of Ring 1 reached 0.54 mm a−1, which was much higher than the average corrosion rate of the other two rings. The average corrosion rates of Ring 2 and Ring 4 were 0.24 and 0.14 mm a−1, respectively, demonstrating that the silica sand had an inhibition effect for the average corrosion of the both coupled rings in high DO concentration conditions. With the adding of 35 mg L−1 EDTMPS, the average corrosion rate of Ring 1 and Ring 4 decreased to 0.095 and 0.083 mm a−1, respectively. However, the average corrosion rate of Ring 2 became 0.23 mm a−1 which seemed no changes comparing with no inhibitor conditions.
Through the corrosion depth measurement results, it can be clearly found that the corrosion patterns were not uniform in different pipeline sections around the circle direction. The corrosion rate of the pipeline half bottom was always higher than the upper half in both with and without deposit conditions. The mineral deposit retarded the average corrosion rate of both Rings 2 and 4 in high DO concentration condition. Based on the ring form ER sensor system, the failure of the inhibitor EDTMPS for UDC was clearly presented and relatively serious corrosion on the bottom section of Ring 2 was also recorded by the sensor system. These corrosion propagation processes are hard to be detected by traditional electrochemical or ER probes which can only reveal the general corrosion status.
Monitoring results of the galvanic corrosion behaviour between the rings
Figure 11 shows the potential difference between the coupled rings and Ring 1 and the galvanic current between Ring 2 and Ring 4. It is seen that the potential difference had a significant increase to the peak value of 16.4 mV in the initial 20 h. Following, the potential difference slowly decreased to a stable value of −2.7 mV with the decrease in the DO concentration and the forming of the rust layer. The galvanic current also had an increase in the initial 60 h and slightly decreased to the value of 4.8 × 10⁻² mA. It can be found that in the brine solution with low DO concentration, the deposit-covered ring had a lower potential and acted as the anode. However, the galvanic current was quiet low in this situation. After the rise of the DO concentration, the coupled rings had a more positive potential than the bare Ring 1 and the galvanic current had a sudden increase to the peak of 0.65 mA and soon decreased to the stable value of 0.42 mA. The large rise of the galvanic current meant the enhancement of the galvanic corrosion behaviour between the deposit-covered area and the bare steel area. The corrosion depth curves, shown in Fig. 10, also revealed that Ring 4 was the cathodic area with a quiet low average corrosion rate and the bottom segment on Ring 2 acted as the anode with a sudden increase in its corrosion rate. It is seen that the rise of the flow rate in the pipeline which nearly had no influence for the corrosion rate only had a small promotion for the galvanic current. A more serious galvanic corrosion behaviour can be seen from Fig. 11 after the introduction of EDTMPS. The dramatic falling of the potential difference illustrated the quick decrease in the potential beneath the silica sand and the large increase in the galvanic current also confirmed it. Although the potential difference recovered after the EDTMPS was added for 24 h, the galvanic current still kept a high value nearly 0.79 mA until the end of the test. Since the corrosion rates of the segments all decreased to a small value after EDTMPS was added except the bottom segment of Ring 2, it can be deduced that the galvanic current was mostly contributed by the deposit-covered area. The failure of the inhibitor for UDC was observed through the record of the galvanic current between the rings as well.
The measurement results of the galvanic current between Ring 2 and Ring 4 and the potential difference between the coupled rings and Ring 1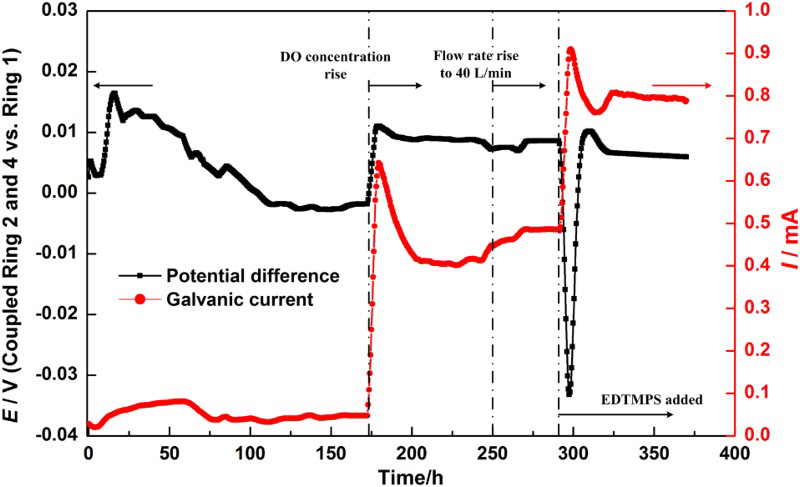
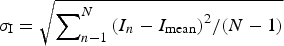
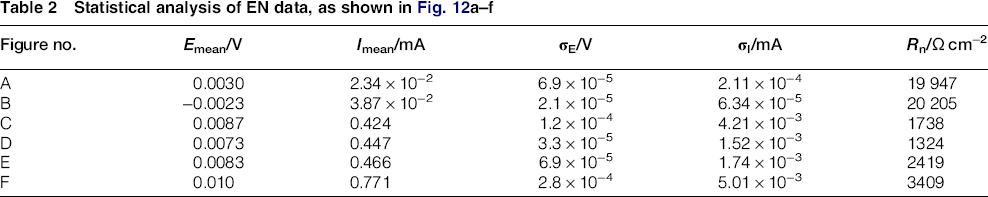
More information was recorded in Fig. 12 that presented the EN monitoring results of the potential difference and the galvanic current in different periods through the test. The statistical analysis results of EN data, which are shown in Fig. 12a–f, are listed in Table 2. The mean potential difference V mean and the mean current I mean are calculated by the 1024 s monitoring data contained 2048 points in each figure. The standard deviation of potential noise σ E and current noise σ I is calculated through the equations
EN measurement results during different periods a after NaCl solution circulated for 5 h, b after NaCl solution circulated for 96 h, c after the increase in the DO concentration, d after the flow rate rise to 40 L min−1, e initial period after EDTMPS was added and f after EDTMPS was added for 24 h Statistical analysis of EN data, as shown in Fig. 12a–f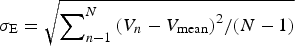

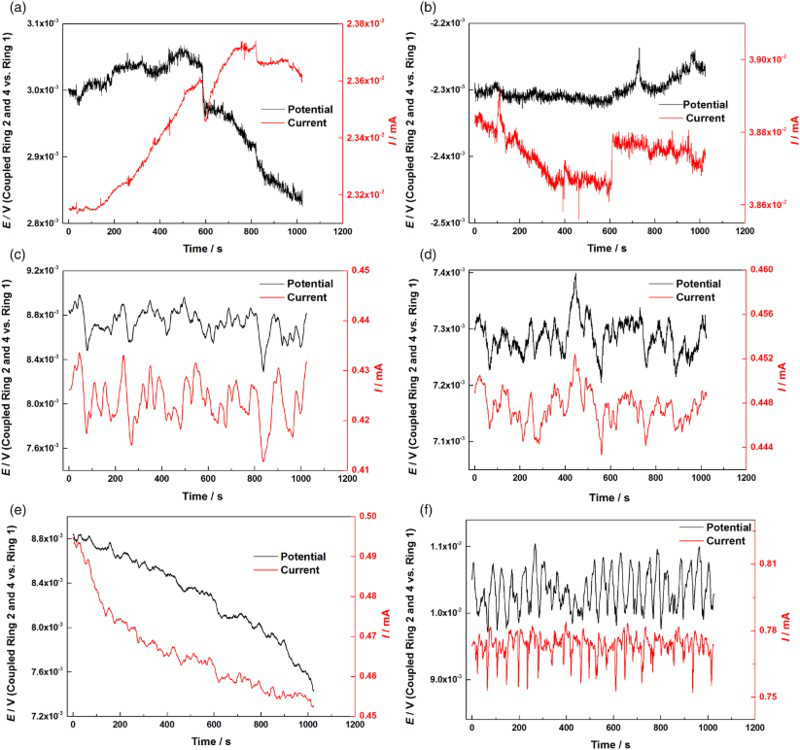
Compared to Fig. 12a and b, it can be seen that the fluctuations of the potential and current became intensive with the increasing immersion time in the NaCl solution. Some spikes and rapid increase in the current can be seen in Fig. 12b after NaCl solution circulated for 96 h. It might indicate the initial of the localised corrosion beneath the sand particle. 17 The noise resistance calculated from the data, shown in Fig. 12a, was quiet high which was not in accordance with the ER measurement results. It meant that in the initial period, the EN measurement results were inaccurate due to the unstable status of the pipeline condition and the metal surface states. After the rise of the DO concentration in the pipeline, the fluctuation of both current and potential difference increased to 0.02 mA and 0.5 mV, respectively. The noise resistance decreased to 1738 Ω cm2 which was 12 times smaller than that calculated from the data, as shown in Fig. 12b. It indicated a large increase in the corrosion rate which had the same trend with the ER measurement results. With the increase in the flow rate from 20 to 40 L min−1, the noise resistance only had a small decrease to 1324 Ω cm2, demonstrating a little rise of the corrosion rate. The noise resistance calculated from the data, shown in Fig. 12e, had an immediate increase to 2419 Ω cm2 after EDTMPS was added. The fluctuations of both potential difference and galvanic current decreased at the initial period with the introduction of EDTMPS. With EDTMPS added over 24 h, the noise resistance became into 3409 Ω cm2 which was larger than that in the initial period. The fluctuation amplitudes of both potential difference and galvanic current increased to 1.0 mV and 0.03 mA, respectively, which can be seen from Fig. 12f. Galvanic current and potential transients are observed in the graph indicating localised corrosion processes beneath the mineral deposit.
Discussions
The analysis of the initiation of inhomogeneous corrosion behaviour in the pipeline
It can be clearly found that the corrosion was not uniform on the bare Ring 1 which had no deposit on its inner surface. High corrosion rate was also monitored on the half bottom of the Ring 4 which indicates that it is not an accidental phenomenon for the bare ring sensors. This question is discussed in the previous studies
22
that due to the gravity of the corrosion product, thick corrosion product layer first forms on the bottom of the pipe, as shown in Fig. 13. The corrosion potential of the area with the thick rust layer will become lower than the areas with thin corrosion product film. Therefore, the half bottom will change into the anodic area and provide electrons to the upper half segments. It can be also found that in the low flow rate and high DO concentration pipeline conditions, galvanic corrosion cell among different segments of the pipeline will be more obvious and stable due to the continuous accumulation of the corrosion product.
Schematic initiation of inhomogeneous corrosion behaviours of the three rings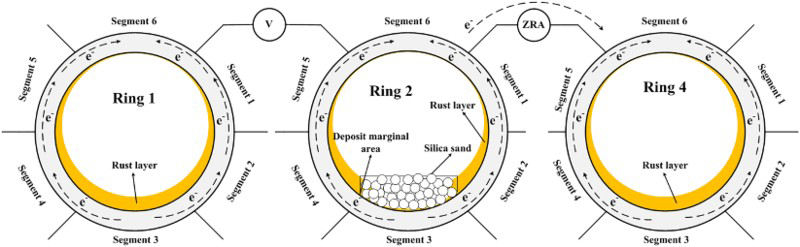
Same as the thick rust layer-covered area, the silica sand-covered area on Ring 2 also had a much lower potential and it always acted as the anodic area in the oxygen-contained pipeline. Thus, the other segments on Ring 2 and Ring 4 should be protected as the cathodic area. However, something interesting can be seen from Fig. 10, the corrosion rates of the segments 2 and 4 on Ring 2 border upon the deposit-covered area were relatively high compared to the same segments on Ring 4 in high DO concentration conditions. The other segments on Rings 2 and 4 were also well protected which can be seen from the low corrosion rates, as shown in Fig. 10. It seems that mineral deposit cannot provide same protection effects for the adjacent segments as the other regions on the rings. In Tan's studies, 14 when the WBE with its central area covered by sand deposit was immersed into the solution exposed to the air, the major anodic areas were composed of the marginal electrodes placing inside and outside the deposit-covered area. It means that the galvanic corrosion begins at the junction region of the deposit covered and without deposit-covered areas. This phenomenon was also observed by Huang 27 in her studies that the margin area suffers more serious localised corrosion beneath a single-large-silica sand particle. It can be supposed that the deposit-covered margin area has a higher corrosion rate at the beginning and the corrosion product will soon form and expand. As shown in Fig. 13, the thick rust layer will first form on the segments 2 and 4 bordering the bottom segment on Ring 2 due to the expansion of the corrosion product. Thus, the areas close to the deposit will also become the anodic areas and show high corrosion rates in the pipeline.
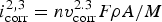
The hypothesis of the corrosion processes can be verified through the galvanic current measurement results, as shown in Fig. 11. The galvanic current ig between Ring 2 and Ring 4 can be expressed as28,29
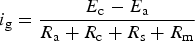
It is known that the reduction in the DO concentration will lead to the decrease in the potential difference between the cathode and the anode and the forming of the rust layer will lead to the increase in R m. Owing to the decrease in the potential difference and the increase in the metal resistance, the galvanic current will decrease in the pipeline. However, it can be seen that the current kept increasing in the initial 60 h which means the potential difference should have an increase due to the expansion of the rust layer on the areas border upon the deposit area. The corrosion current of the segment 3 on Ring 2 ( ) can be calculated through its corrosion rate (
 )
)
In the previous studies, Huang and Ji 29 has found that galvanic current monitored by a novel designed Cu–Zn galvanic corrosion sensor had a strong sensibility to DO concentration and the flow rate in the oxygen-contained sea-water pipeline. In this test, it also can be found that the increase in the DO concentration had an intense promotion for the galvanic current between the rings indicating the large increase in the potential difference shown in equation (6). With the further thickening of the rust layer, the galvanic current gradually decreased to a stable value due to the increase in R m. However, the galvanic corrosion behaviour caused by the mineral deposit showed a low response to the double increase in the flow rate. It demonstrates that in low flow rate conditions, the rise of the flow rate from 20 to 40 L min−1 nearly had no influence to the corrosion behaviour in the 8 in. pipeline circulation system.
The analysis of UDC and the action effect of EDTMPS
The corrosion rate of the deposit-covered area always keeps at a quite low value before the introduction of inhibitor EDTMPS. The mineral deposit works as a barrier for the diffusion of oxygen to the steel surface. Through the change trend of the corrosion rate, it can be found that the main cause for the enhancement of the corrosion beneath the sand particle is the rise of the galvanic current which is almost dominated by DO concentration. Owing to the galvanic current between the deposit-covered segment and other bare segments, the average corrosion rate of both Ring 2 and Ring 4 was lower than the bare Ring 1. It seems mineral deposit has an inhibition effect for the corrosion of the pipeline steel in oxygen-contained conditions. However, it can be seen from Fig. 8b that crevice and pit corrosion behaviour generated beneath the sand particle. A nearly 1 h monitored EN signal is also recorded in Fig. 14 after NaCl solution circulated for over 96 h. Owing to the low DO concentration in this period, the corrosion nearly stopped beneath the sand layer and the galvanic current was also quite low which can be seemingly neglected. However, some positive rapid current changes can be seen from the long-term EN signal and several potential and current spikes can also be found. The rapid current transients to positive direction show that the corrosion processes are not stable. In some extent, it suggests the occurrence of the localised corrosion such as crevice and pitting corrosion patterns beneath the mineral deposit.
One-hour-monitored EN signals after NaCl solution circulated for 96 h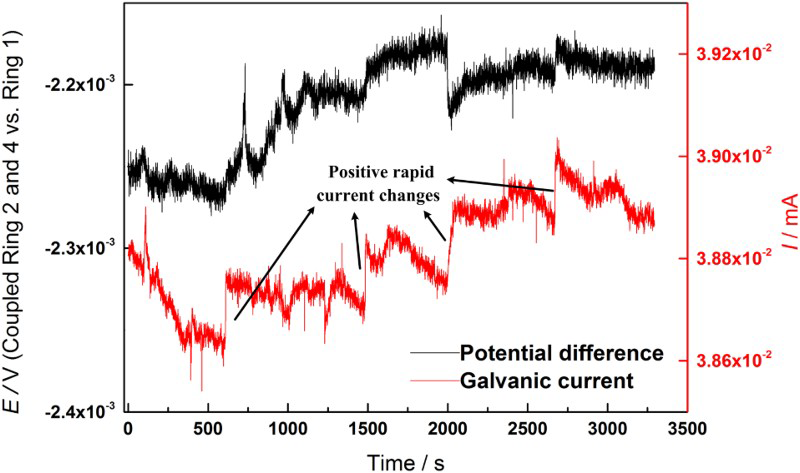
Through the electrochemical tests, it can be found that 35 mg L−1 EDTMPS has excellent inhibition effects for both deposit-covered steel and bare steel. The PDP measurement results also suggest that EDTMPS has an inhibition effect for the galvanic corrosion behaviour between the deposit-covered steel and bare steel. In the pipeline circulation system, the corrosion rate of each segment on Ring 1 all reached the values close to 0.1 mm a−1 and the average corrosion rate decreased to 0.095 mm a−1. It means that EDTMPS indeed has an inhibition effect for the corrosion process on bare steel in pipeline conditions. The rise of the corrosion rate of the top segment may be caused by the decrease in the galvanic corrosion current among each segment of Ring 1. It indicates that EDTMPS can also restrain the galvanic corrosion caused by the inhomogenous distribution of the rust layer.
However, the inhibitor EDTMPS was failed for the inhibition of galvanic corrosion between the deposit-covered area and the bare steel area in the pipeline. It even had an acceleration effect for the corrosion beneath the sand layer which is opposite for the electrochemical measurement result. It can be seen from Fig. 11 that galvanic current had a large increase to near 0.8 mA, demonstrating the promotion of the galvanic corrosion behaviour. The corrosion current of segment 3 on Ring 2 ( ) calculated through equation (7) after EDTMPS was added is 1.18 mA (v corr = 1.37 mm a−1) which was higher than the 0.8 mA monitored by ZRA. It indicates that galvanic current also existed in Ring 2 between the bottom segment and the other segments. As shown in Fig. 12f, regular current transients can be found which is like the current spikes in the initiation period of pitting corrosion processes.
30
Nevertheless, the current transients were towards the negative positions which were opposite to the positive current transients during pitting initiation period. The current transients may suggest that the inhibitor chelates with the positive ions on the steel surface beneath the sand layer and form a small protective film on the steel surface leading to the decrease in the current. It can be speculated that the high galvanic current may cause the breakdown of the protective film and the current will immediately recover with the dissolve of the protective film. However, the EN measurement results cannot directly illustrate the transients of the galvanic current and further experiments should be carried out in future studies.
) calculated through equation (7) after EDTMPS was added is 1.18 mA (v corr = 1.37 mm a−1) which was higher than the 0.8 mA monitored by ZRA. It indicates that galvanic current also existed in Ring 2 between the bottom segment and the other segments. As shown in Fig. 12f, regular current transients can be found which is like the current spikes in the initiation period of pitting corrosion processes.
30
Nevertheless, the current transients were towards the negative positions which were opposite to the positive current transients during pitting initiation period. The current transients may suggest that the inhibitor chelates with the positive ions on the steel surface beneath the sand layer and form a small protective film on the steel surface leading to the decrease in the current. It can be speculated that the high galvanic current may cause the breakdown of the protective film and the current will immediately recover with the dissolve of the protective film. However, the EN measurement results cannot directly illustrate the transients of the galvanic current and further experiments should be carried out in future studies.
From the pipeline circulation test, it can be found that the inhibitors which perform excellent inhibition effect in laboratory test may show completely different action effect in real industry conditions. The pipeline working condition is complex and changeable compared to laboratory environment. The real pipeline corrosion processes beneath the deposit may quite different from the pipeline circulation system described in the paper which only oxygen contained in the fluid and the deposit is just composed of silica sand particles. The test results may be not same when carbon dioxide corrosion occurs in the pipeline or the deposit changes into carbonate or biofilm. In the pipeline working conditions, the noise interference for the ER and EN monitoring caused by the fluid or other electronic equipment may cause experimental errors on the corrosion depth and galvanic current measurements. However, due to the existence of the steel main chamber, the electronic noise can be shielded to a large extent. The excellent accordance of the ER and EN measurement results also indicates a low experimental error.
The application prospects of the ring form ER sensor system in long distance transition pipelines
RPERS is mainly developed for the corrosion monitoring of long distance pipelines.
22
Since its corrosion depths measurement principle is only correlation to the geometrical shape of the cross-section, it can be used to simulate the most factual corrosion processes of different segments in the pipe. The sensor can be used in the pipeline section where may confront the accumulation of the mineral deposit and it can be electrical connected to the long distance pipeline through the low resistance galvanometer, as shown in Fig. 15a. The ring sensor can be treated as a part of the pipeline section due to the special design and the corrosion processes can be monitored by both ER signal and galvanic current signal.
Application prospects of the ring form ER sensors in long distance pipeline a monitoring of UDC and b monitoring of galvanic corrosion behaviour between stainless steel and carbon steel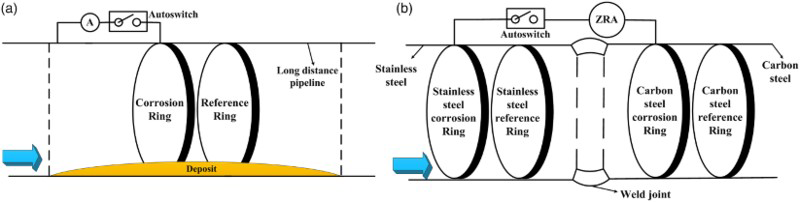
In some oil and gas transition pipelines, stainless steel cladding pipelines are used at the start of long distance pipelines due to the high corrosion rate caused by the high temperature of the fluids. 31 After the temperature of the fluid decreases to the ambient temperature, carbon steel pipelines are used due to their cheap price. Therefore, galvanic corrosion behaviour between the stainless steel and carbon steel may occur at the joint place of the pipeline. 32 Galvanic corrosion risk also can be studied by the ring form ER sensor system using two sets of RPERS made from stainless steel and carbon steel, respectively. The galvanic current can be measured by ZRA which is shown in Fig. 15b and the corrosion depths of both steels can be monitored by ER signals.
Conclusions
A new sensor system based on the ring form ER sensors is developed for the study of galvanic corrosion behaviour in the pipeline circulation system. The corrosion depth of each segment along the circle direction can be monitored by the ER signal. The galvanic current between the rings can be measured by ZRA and the corrosion processes also can be analysed by the EN technique.
The galvanic corrosion caused by the heterogeneous distribution of the rust layer will lead to the non-uniform corrosion patterns among the different pipeline segments. The half bottom of the pipeline always suffers higher corrosion rate than that of the upper half. The expansion of the corrosion product at the margin area covered by the deposit will lead the adjacent segments changing into the anodic area comparing to the other segments.
Though the corrosion rate of the deposit-covered area is low, crevice corrosion and pitting corrosion patterns are found beneath the sand particle through SEM image. The positive rapid increases of the galvanic current in pipeline working condition also means the initiation of the localised corrosion.
The inhibitor EDTMPS shows excellent inhibition effects for both bare steel and deposit-covered steel in PDP and LPR tests. It also works well for the bare ring in the pipeline circulation system. However, it fails for the inhibition of galvanic corrosion between the bare steel and deposit-covered steel in the pipeline working condition. It even has a large promotion effect for the galvanic current between the deposit-covered area and bare steel area which leads to serious localised corrosion beneath the sand particle.
The ring form ER sensor system can be used in long distance transition pipelines for the simulating of real under deposit surroundings. It also can be used for the study of galvanic corrosion behaviour between different kinds of metals in pipeline working conditions using both the ER method and the EN technique.