
Abstract
This work aims at obtaining comprehensive information on the corrosion behaviour of AA2024-T3 in oxalic acid solutions under different concentrations (0.007-0.2 M) and pH (2-6). Various tests to characterise the corrosion behaviour are performed, including weight loss and electrochemical tests. Coupon surfaces are examined using infinite-focus microscopy, scanning electron microscopy coupled with energy-dispersive X-ray spectroscopy, Raman spectroscopy and diffuse reflectance infrared Fourier transform spectroscopy. Corrosion rates, anodic and cathodic reaction kinetics are detailed to provide a fundamental understanding of the electrochemical behaviour of AA2024-T3 as a function of pH and oxalate concentration. The synergistic effect of pH and oxalate concentration on corrosion of AA2024-T3 is evaluated for both AA2024-T3 matrix and main intermetallics (i.e. Al–Cu–Mg and Al–Cu–Fe–Mn) and the electrochemical behaviour of each constituent element in AA2024-T3 is systematically studied.
Introduction
Aluminium alloys have been widely utilised as the primary structural material for aircraft parts because of their excellent strength to weight ratio and fatigue resistance. Their thin native oxide film serves as a barrier, providing good corrosion resistance in neutral solutions (pH: 4.0-8.5) at room temperature. Heavy corrosion of aluminium alloys has been observed in more acidic or alkaline media [1]. Their susceptibility to corrosion is affected by the growth or dissolution of oxide layer when exposed to aqueous environment. Extensive research has been conducted on the corrosion behaviour of aluminium alloys, including alloy AA2024-T3, in various aggressive electrolytes such as salts [2–4], alkalis [5] and acids [6,7].
Oxalic acid is a simple organic acid and is relatively strong among carboxylic acids. It is a metabolic product of microorganisms, most notably the common fungus Aspergillus niger [8]. Aluminium and its alloys frequently come into contact with oxalic acid in industry, where it has been utilised to dissolve aluminium hydroxide from high-level waste tanks at U.S. Department of Energy sites [9], and to serve as a purifying agent in the pharmaceutical industry and as a pickling agent in metallurgy [10]. The anodic oxidation of aluminium in a bath of oxalic acid to form an oxide film with a porous structure has been well established in industrial applications [11–13]. In addition, studies have been carried out on the inhibition of chloride-induced pitting corrosion of aluminium alloys by the presence of sodium oxalate, which may promote the formation of stable surface complexes through the adsorption of oxalate ions [14].
Organic acids containing carboxylic groups (such as oxalic or citric acids) can interact with aluminium alloys and/or the oxidised surface, promoting the passivation or de-passivation of that surface by forming insoluble or soluble complexes [6,7,15–21]. It seems that the inhibition or acceleration of corrosion by organic acids is highly dependent on acid concentration, pH, temperature and exposure time [16]. The effect of oxalate anion on the corrosion behaviour of magnesium alloys [22,23], titanium alloys [24] and carbon steel [25] has been studied under different conditions, but scarce information is available for aluminium alloys. Additionally, limited systematic studies on the corrosion of aluminium alloys with separated control of pH and oxalate concentration have been performed. Considering oxalic acid is produced naturally in the environment, it is ultimately important to investigate the corrosion behaviour and mechanism of aluminium alloys in the presence of this potentially aggressive organic acid.
Experimental
Materials, sample and solution preparation
Six materials, AA2024-T3, AA1100 (99% Al), C101 Cu (99.99%), Mn (99.9%), Fe (99.995%) and Mg (>99.95%), were used in this study. Pre-polished AA2024-T3 sheets were purchased from a commercial vendor (McMaster-Carr) and met the specifications of ASTM B209 [26]. The surface roughness was measured to be 90 ± 3 nm using an infinite-focus microscope (IFM, Alicona G5). Weight loss experiments of AA2024-T3 were performed using coupons with dimensions of 10 mm × 25 mm × 0.5 mm. Coupons were sequentially cleaned in a sonicating bath with hexane, acetone and an alkaline cleaning solution for 10 min each and then thoroughly rinsed with deionised (DI) water and dried under a stream of dry air. As for electrochemical tests, the working electrodes were abraded with a 600-grit SiC abrasive paper using ethanol as a lubricant, followed by an ethanol rinse. An exposure area of ∼1 cm2 was tested. DI water (18.2 MΩ∙cm resistivity) and reagents of sodium oxalate and oxalic acid dihydrate (Sigma-Aldrich) were used to prepare the solutions. The test oxalate solutions with different concentrations (0.007-0.2 M) and initial pH values (2-6) were prepared. A 5 M solution of NaOH was used to tune pH values to exact specifications without affecting the overall concentrations of oxalate.
Weight loss measurements
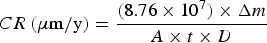
For weight loss measurements, AA2024-T3 coupons were immersed in 100 mL oxalate solutions for 5 days. Coupons removed from the solutions were first cleaned with a nylon brush in DI water, and then immersed in a 69.2 wt-% nitric acid solution for 3 min to completely remove corrosion products following the ASTM-G1 protocol [27]. Coupons were then rinsed with DI water to remove the acid and dried under a stream of flowing dry air. The coupons before and after experiments were weighed using an analytical balance (E1RR80, Ohaus) with an accuracy of 0.1 mg. Corrosion rates (CR) for uniform corrosion were calculated using Equation (1) [27].
Electrochemical tests
The electrochemical measurements were performed using a Gamry Reference 600® potentiostat with a three-electrode electrochemical cell. A platinum gauze electrode was used as the counter electrode and a saturated calomel electrode (SCE) as the reference electrode. All the potentials reported are with respect to SCE. A Luggin capillary was used to minimise the Ohmic potential drop. Potentiodynamic polarisations were conducted after 2-h delay at open circuit potential (OCP). The anodic polarisation started from −50 mVOCP to +1.0 VSCE and the cathodic polarisation started from +50 mVOCP to −2.0 VSCE. The cyclic potentiodynamic polarisation (CPP) curves were recorded from an initial potential of −50 mVOCP up to +1.0 VSCE or an apex current density of 0.01 A cm−2, followed by reverse scanning to the initial potential. All potentiodynamic polarisation experiments were performed at a scan rate of 0.167 mV s−1. The electrochemical measurements were performed in naturally aerated solutions or deaerated solutions purged with Argon (99.998%).
Surface characterisations
Before cleaning, the corrosion products and morphology were examined by field emission scanning electron microscopy (FE-SEM) coupled with energy dispersive X-ray spectroscopy (EDX) at an accelerating voltage of 20 kV (TESCAN Lyra 3). Corrosion products were also analysed by Raman spectroscopy (Thermo Scientific DXR confocal Raman microscope with a 532-nm laser) and diffuse reflectance infrared Fourier transform (DRIFT) spectroscopy (Nicolet 6700 FTIR, Thermo-Nicolet). After removing the corrosion products, the damage was assessed with IFM and SEM-EDX.
Statistical analysis
Checks for statistical significance within and between data points included both one-factor and two-factor ANOVA tests. From those tests, p-values (with a 95% confidence level as the benchmark) were examined to determine if there was a significant difference between groups (i.e. a significant effect on the oxalate concentration or pH) as well as an interaction between the two factors.
Results and discussion
Material characterisation
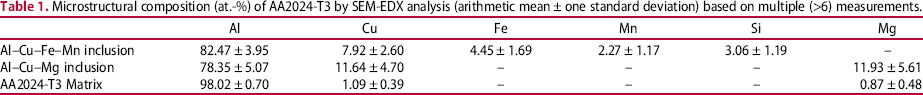
The pristine AA2024-T3 surface was first examined by SEM-EDX. Figure 1 presents an SEM image of two main inclusions found in this material, small round Al–Cu–Mg inclusions vs. large irregular-shaped Al–Cu–Fe–Mn inclusions. The Al–Cu–Mg inclusions are typically several micrometres in diameter while some of the Al–Cu–Fe–Mn inclusions are much larger, on the order of 10 µm. The average compositions of these two types of inclusions and the matrix are listed in Table 1. The Al–Cu–Mg inclusion is assumed to be S-phase (Al2CuMg) and the Al–Cu–Fe–Mn inclusion may be Al20Cu2Mn3 or Al7Cu2Fe [28–30].
An SEM image of pristine AA2024-T3 surface showing representative inclusions of Al–Cu–Mg and Al–Cu–Fe–Mn. The scale bar is 10 µm. Microstructural composition (at.-%) of AA2024-T3 by SEM-EDX analysis (arithmetic mean ± one standard deviation) based on multiple (>6) measurements.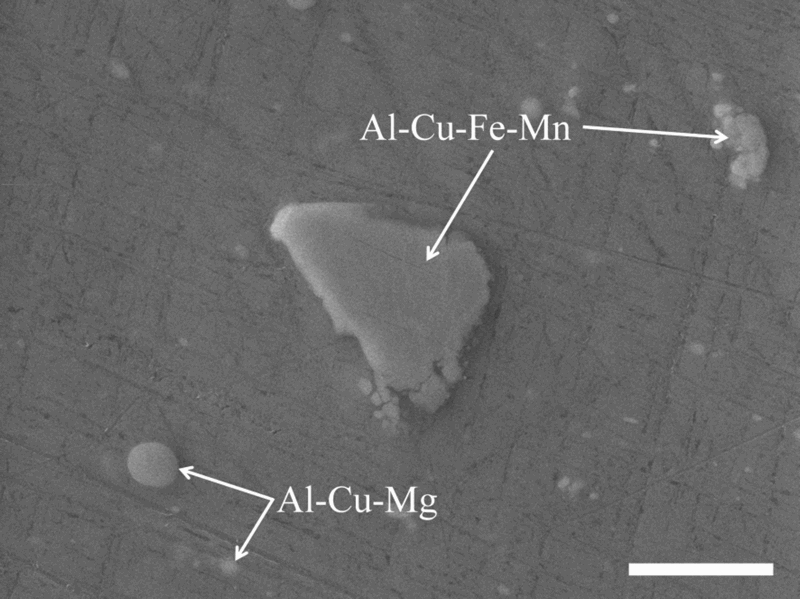
Weight loss results
Uniform CR of AA2024-T3 from weight loss experiments are presented in Figure 2. The effect of pH on AA2024-T3 corrosion at constant oxalate concentration was observed first. In the less concentrated solutions (≤0.068 M), uniform CR were higher at a more acidic condition (pH < 5), especially in the most dilute case (0.007 M). As the oxalate concentration increased, the effect of pH became less apparent. At 0.2 M, a high acidity (pH 2) still contributed to a greater corrosion, but a more neutral pH of 6 yielded the highest CR. CR were comparable at pH 3 and 5, but much lower than those at pH 2 and 6. The difference between pH 5 and 6 was found to be significant (p-value of 0.012). The effect of oxalate concentration on AA2024-T3 corrosion at constant pH level was also identified. At pH ≤ 3, uniform CR decreased with increasing oxalate concentration; at pH 5, CR increased with oxalate concentration initially but plateaued at ≥0.068 M; and at pH 6, CR continuously increased with oxalate concentration. A two-factor ANOVA test suggested that the interaction between pH (5-6) and oxalate concentration (0.068 and 0.2 M) was highly likely to have an effect on the corrosion of AA2024-T3 (p-value of 0.0006), which warranted further investigation.
Uniform corrosion rate of AA2024-T3 by weight loss after 5-day immersion in different oxalate concentration (0.007– 0.2 M) and pH (2-6) combinations. Error bar indicates standard error.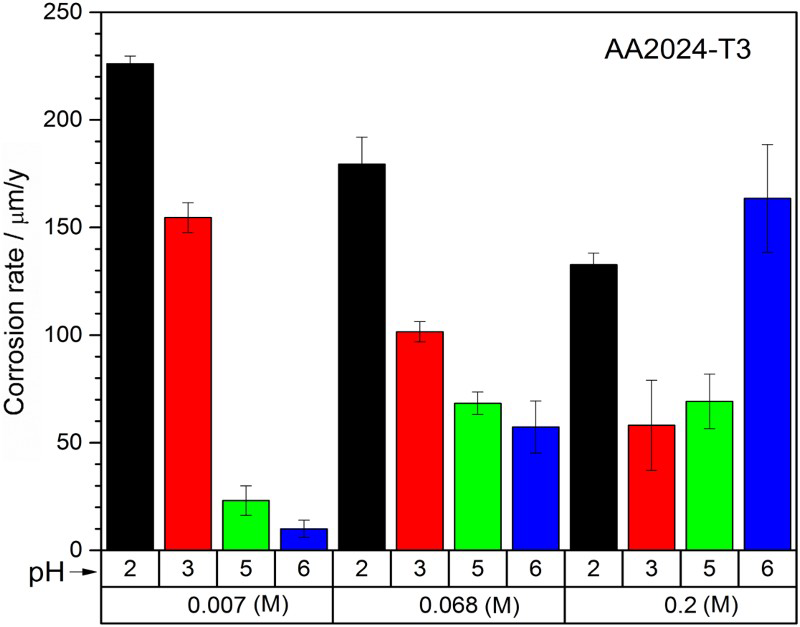
Electrochemical results
Figure 3 shows the 2-h OCP profiles of AA2024-T3 in different quiescent oxalate solutions. At pH 5, OCP curves exhibited similar patterns with negligible dependence on oxalate concentration, as they gradually increased and stabilised at −0.6 to −0.8 VSCE. The positive OCP shift is often related to the formation of passive layers [3]. In contrast, the OCP evolution exhibited significant dependence on the oxalate concentration at pH 6. At 0.007 M, OCP rose dramatically from −1.1 to −0.5 VSCE within several minutes and stabilised at −0.3 VSCE. At ≥0.068 M, the OCP curves exhibited an initial potential drop of 100-200 mV to a minimum in <15 min. Possible explanations include breakdown of the native oxide [31] and/or adsorption of the oxalate anions [32]. After the initial drop, OCP slowly increased to a plateau value of ∼−1.1 VSCE, which was likely due to the buildup of a protective layer [32]. It has been previously reported that the steady-state OCP became more negative with increasing oxalate concentration [5,32].
OCP profile of AA2024-T3 after 2-h immersion in different oxalate concentration (0.007– 0.2 M) and pH (5-6) combinations.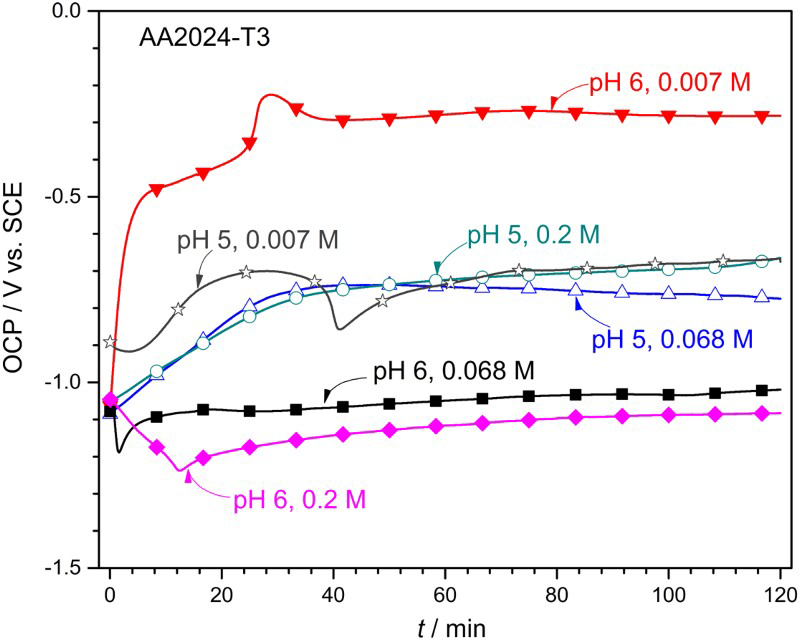
Figure 4(a) presents the cathodic polarisation curves at pH 5, and they showed less dependence on the oxalate concentration. At pH 6, two types of polarisation curves were observed (Figure 4(b)), one for high (≥0.068 M) and the other for low (0.007 M) oxalate concentrations. At high oxalate concentrations, OCPs were ≤−1.0 VSCE and hydrogen evolution reaction (HER) was the dominant cathodic reaction under charge transfer control. In comparison, OCP was around −0.3 VSCE at 0.007 M and a well-defined diffusion controlled region for oxygen reduction reaction (ORR) was observed from −0.4 to −1.1 VSCE. The limiting current density was ∼2 µA cm−2, suggesting low oxygen solubility and/or large diffusion boundary layer thickness. It appears that a threshold oxalate concentration exists at pH 6 for the cathodic reaction to switch from ORR to HER. To verify this, more cathodic polarisation experiments were performed with intermediate oxalate concentrations (Figure 4(c)). The dominant cathodic reaction was ORR at 0.02 M and changed to HER when oxygen was removed. In comparison, HER was the dominant cathodic reaction at 0.044 M. Therefore, this threshold oxalate concentration should exist between 0.02 and 0.044 M at pH 6, below which, ORR is the dominant cathodic reaction with high OCPs; and above which, HER is the dominant cathodic reaction with low OCPs.
Cathodic polarisation of AA2024-T3 in different oxalate concentration and pH combinations: (a) pH 5 with oxalate concentration of 0.007, 0.068 and 0.2 M; (b) pH 6 with oxalate concentration of 0.007, 0.068 and 0.2 M; and (c) pH 6 with oxalate concentration of 0.02 and 0.044 M. An experiment in deaerated (Ar) 0.02 M oxalate is also shown for comparison.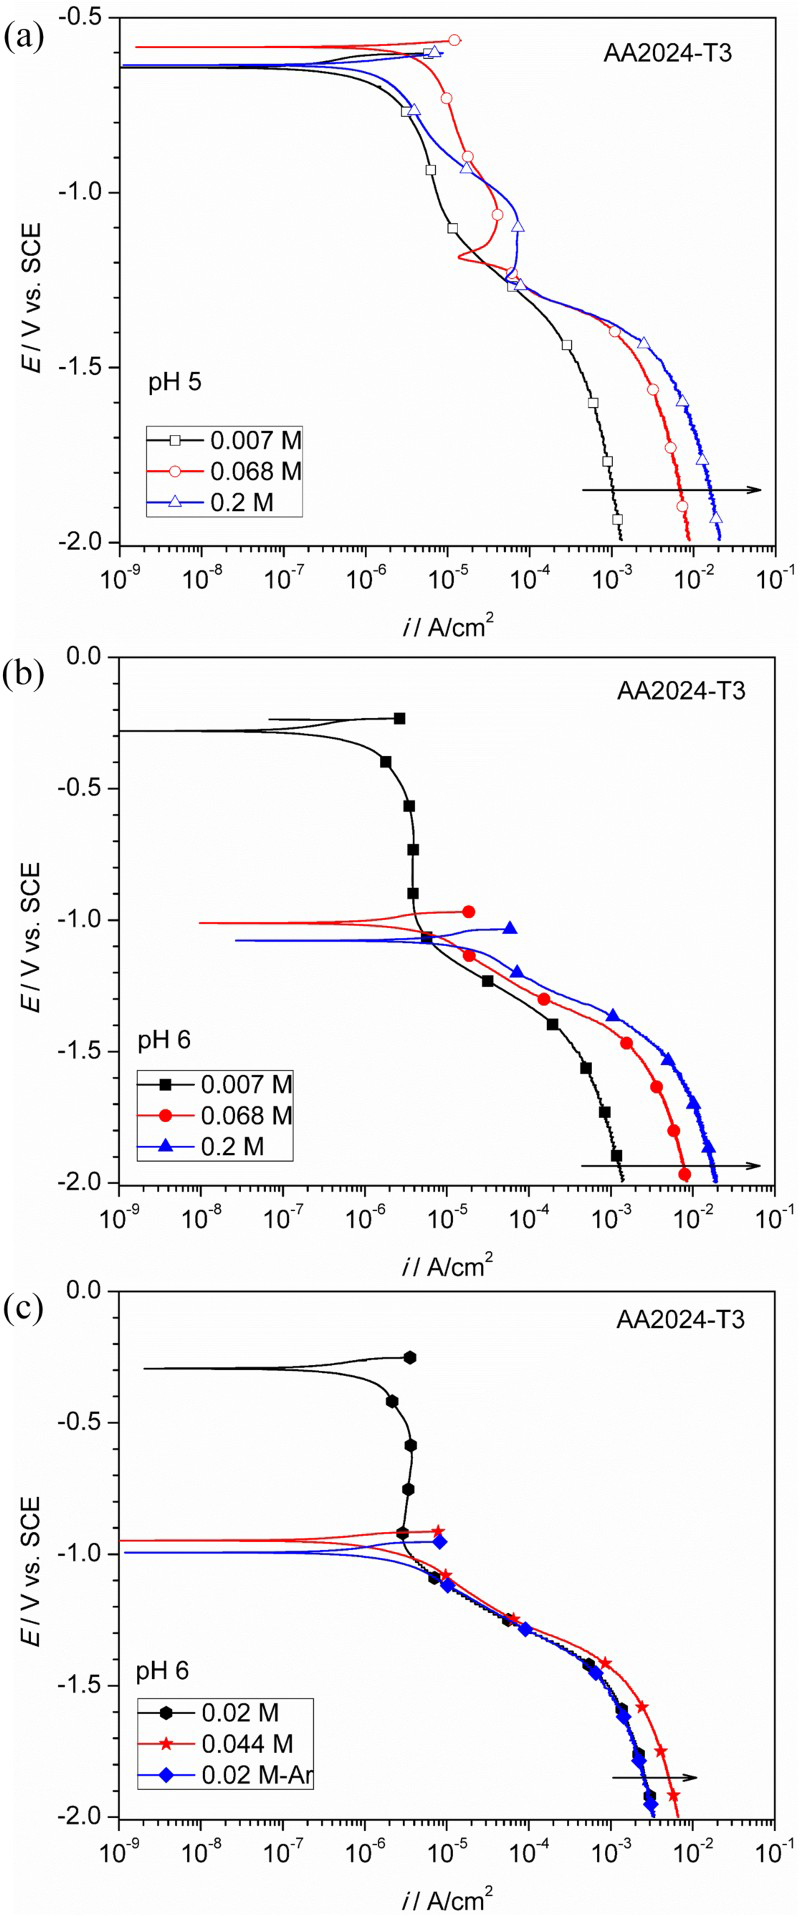
Potentiodynamic polarisation was performed to study the anodic behaviour of AA2024-T3. At pH 5 (Figure 5(a)), the anodic current density increased gradually with applied potential at low concentration (i.e. 0.007 M). At higher concentrations (≥0.068 M), the anodic curves overlapped with each other, and a large passivation region was observed with a current density of ∼20 µA cm−2. This is in agreement with an early study [11]. Figure 5(b) shows the anodic behaviour at pH 6 with two noticeable differences compared to pH 5. First, a small oxidation peak appeared at −0.2 VSCE for higher oxalate concentrations (≥0.068 M). Second, a broad active-passive transition from −1.1 to −0.5 VSCE was observed at 0.2 M with a critical current density (icrit) of ∼40 µA cm−2.
Anodic polarisation of AA2024-T3 in various oxalate concentrations (0.007, 0.068 and 0.2 M) at two different pH levels: (a) pH 5 and (b) pH 6.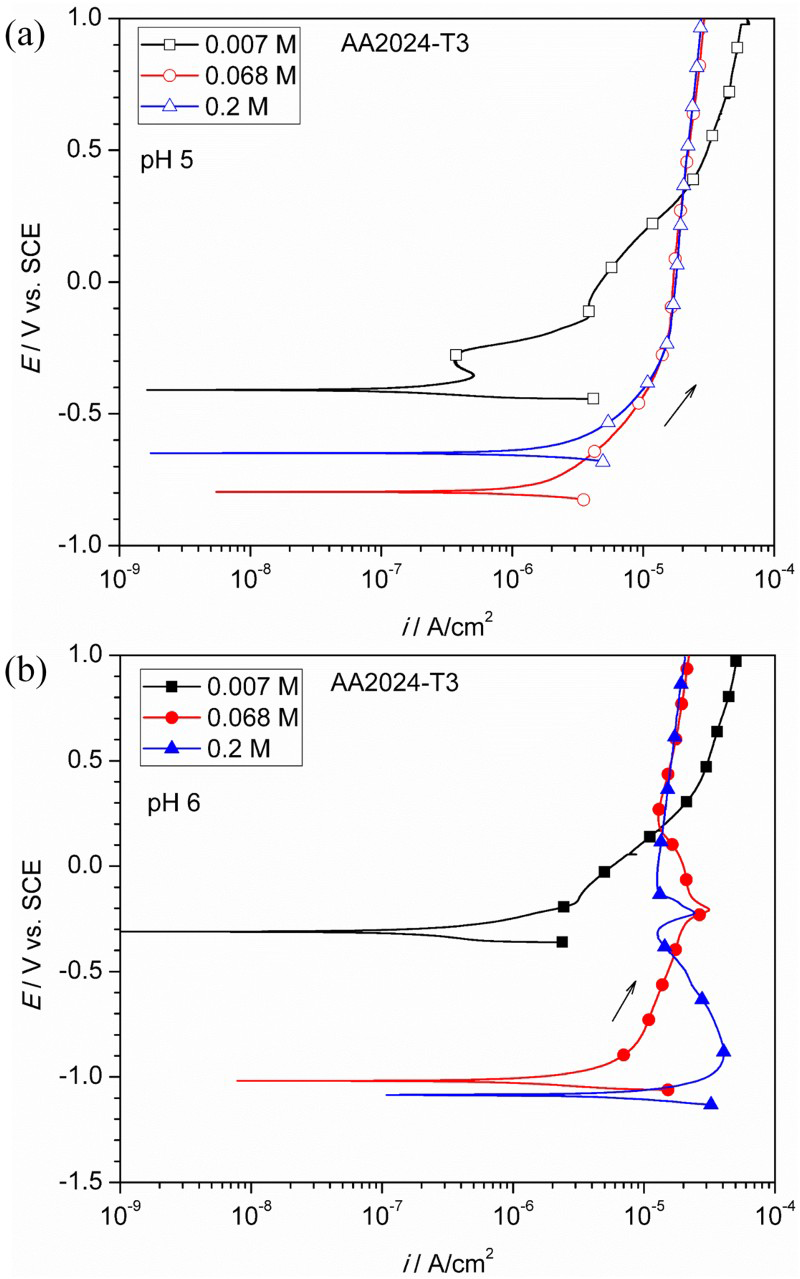
Characterisation of corrosion products and morphology
The corrosion products and morphology of AA2024-T3 after 5-day immersion were characterised by SEM/EDX, DRIFT spectroscopy, Raman spectroscopy and IFM for the following four conditions: 0.068 M-pH 5; 0.2 M-pH 5; 0.068 M-pH 6; and 0.2 M-pH 6.
Figure 6 presents the SEM/EDX results of the corroded surfaces before cleaning. The coupon surfaces appeared relatively clean at pH 5 and negligible oxalate concentration effect was found (Figure 6(a and c)). The abrasion lines were visible and some particles and pits were noticed. At pH 6, thicker corrosion product layers and larger pits were observed. The corrosion morphology for the 0.2 M-pH 6 condition (Figure 6(d)) appeared noticeably different. The abrasion lines were no longer visible and the corrosion product layer cracked after drying. The EDX results showed that the average composition (at.-%) of the corrosion product layer for the 0.2 M-pH 6 condition was ∼66% Al, ∼12% Cu and ∼22% O. In comparison, the composition was similar for the other three conditions: ∼95% Al, ∼3% Cu and ∼2% Mg. The EDX analysis on the remaining large Al–Cu–Fe–Mn inclusion particles (insets in Figure 6) suggested that as pH increased from 5 to 6, the Al content decreased from ∼68 to ∼38%, and O content increased from ∼1 to ∼30%.
SEM images of AA2024-T3 after 5-day immersion in oxalate solutions at (a) 0.068 M-pH 5, (b) 0.2 M-pH 5, (c) 0.068 M-pH 6 and (d) 0.2 M-pH 6 before cleaning off the corrosion products. A large Al–Cu–Fe–Mn particle remained on the surface is shown as an inset in the upper right corner with average composition by EDX. The scale bars of the image and of the inset are 50 and 2 µm, respectively.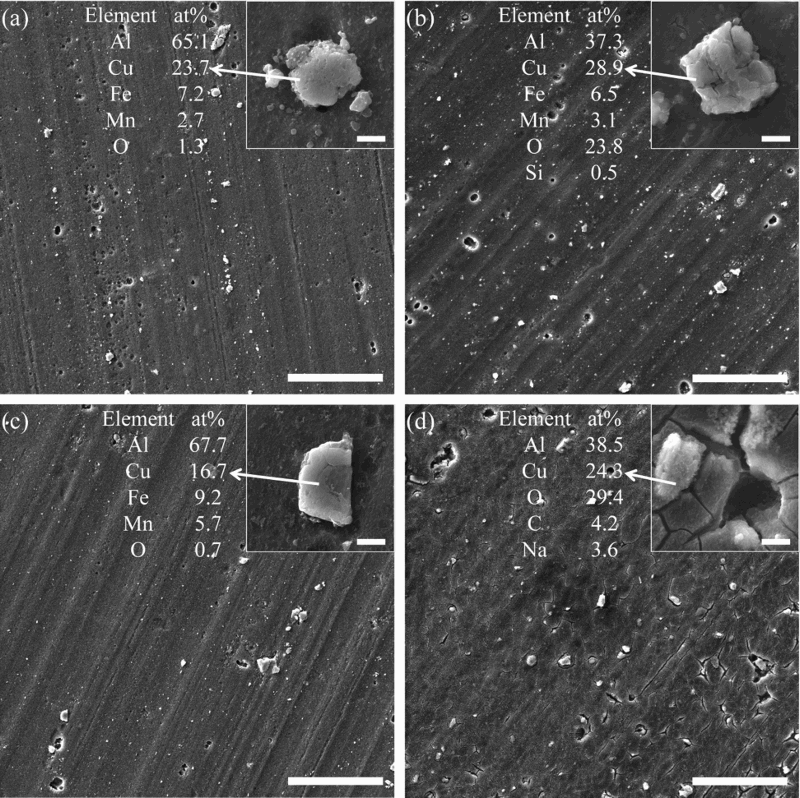
DRIFT and Raman spectroscopies were then performed to determine the chemical nature of the corrosion products. The DRIFT spectra (Figure 7(a)) indicated that the least amount of corrosion products formed in the case of 0.2 M-pH 5, and the amount was significantly higher for the pH 6 cases. The most obvious peaks detected by DRIFT were coordinated carboxyl (C=O) groups in oxalate ions at 1690-1720 cm−1, corresponding to asymmetric C=O stretching. A doublet of peaks at ∼1430 and ∼1300 cm−1, corresponding to symmetric C–O stretches from oxalate ions were also observed [33–35]. The O-H groups were seen at 3400-3500 cm−1, suggesting the potential presence of metal oxide/hydroxide. Aluminium hydroxide peaks (1023 and 827 cm−1) and copper oxide peaks (∼1030 and 675 cm−1) were also noticed. The peak positions shifted slightly from one spectrum to another, and the peak intensity differed on various locations within the same sample, indicating non-uniform distribution of corrosion products, potentially due to factors such as material heterogeneity, surface roughness, irregular chemical adsorption and differential aeration conditions [4,36,37]. The peak shifts associated with C=O stretch and O–C–O, C–C–O deformations were reported by Fujita et al. [33] when oxalate ion was complexed with different metals due to the strength of M–O bonds. Weaker M–O bonds in copper oxalate, as compared to aluminium oxalate, caused the asymmetric stretching of C=O and asymmetric deformation of O–C–O and C–C–O to shift to lower frequencies. The presence of aluminium oxalate and copper oxalate was indicated in Figure 7(a) in the wavenumber region of 1200-1750 cm−1. These observations further confirmed the corrosion products from all four conditions consisted of a mixture of oxalate complexes with aluminium and copper as well as aluminium and copper oxide/hydroxide. The remaining quantity of the corrosion products on the sample surfaces followed the order of 0.2 M-pH 5 < 0.068 M-pH 5 < 0.068 M-pH 6 < 0.2 M-pH 6.
Representative (a) DRIFT and (b) Raman scans of the corrosion products remained on the AA2024-T3 surface after 5-day immersion in the following solutions: (1): 0.068 M-pH 5; (2): 0.2 M-pH 5; (3): 0.068 M-pH 6; and (4): 0.2 M-pH 6. The following symbol and letters are used for peak identifications: A: aluminium oxalate; C: copper oxalate; a: aluminium oxide/hydroxide; c: cupric oxide/hydroxide; *: cuprous oxide (523 and 218 cm−1).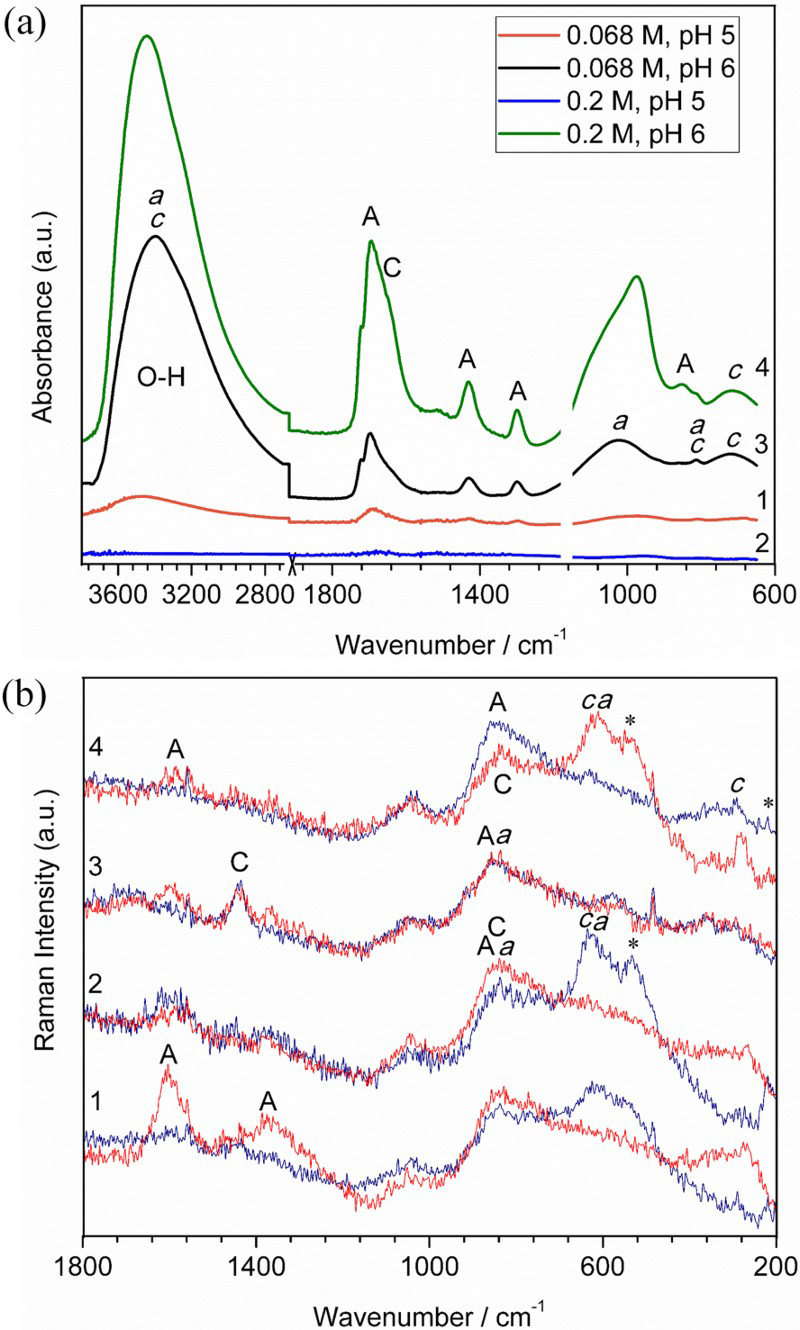
Because the relatively thin corrosion layers at pH 5 were difficult to be detected by DRIFT, Raman spectroscopy was then utilised (Figure 7b). Two representative scans from each case were presented to illustrate again the non-uniform distribution of the corrosion products. For all four cases, aluminium oxalate (1600, 1385 and 835 cm−1) [38], copper oxalate (1474, 1433 and 833 cm−1) [39,40], aluminium oxide (828, 600, 421 and 383 cm−1) [41] and copper oxides (623, 584, 560, 523, 490, 347, 298, 290 and 209 cm−1) [40,42] were detected.
After cleaning, these samples were examined using SEM and IFM. Small pits (<5 µm in diameter) were observed at pH 5 and the pit density increased with oxalate concentration (Figure 8(a–d)). Larger Al–Cu–Fe–Mn intermetallics remained on the cleaned surface and pitting (trenching) occurred at the periphery (Figure 8(d)) [30], while most smaller Al–Cu–Mg intermetallics dissolved, resulting in many small pits. In comparison, the size and density of pits increased significantly at pH 6 (Figure 8(e–h)), and the most severe corrosion occurred under the 0.2 M-pH 6 condition (Figure 8(g–h)). Figure 8(f) shows a pit of ∼10 µm in diameter formed at 0.068 M-pH 6 while Figure 8(h) shows a pit of >20 µm in diameter formed at 0.2 M-pH 6. Both Al–Cu–Mg and Al–Cu–Fe–Mn intermetallics disappeared completely under the 0.2 M-pH 6 condition, and few Al–Cu–Fe–Mn intermetallics still remained with severe corrosion at 0.068 M-pH 6. The IFM measurements indicated that at pH 6, the maximum pit depth was ∼3 µm at 0.068 M and ∼9 µm at 0.2 M. In comparison, the maximum pit depth was ∼1 µm at pH 5, independent of oxalate concentration.
IFM (a, c, e, g) and SEM (b, d, f, h) images of AA2024-T3 after 5-day immersion in oxalate solutions at pH 5 (a–d) and 6 (e–h) and oxalate concentration of 0.068 M (a, b, e, f) and 0.2 M (c, d, g, h) after cleaning off the corrosion products. The size of each IFM image is 160 µm × 160 µm, and the scale bar on each SEM image is 10 µm.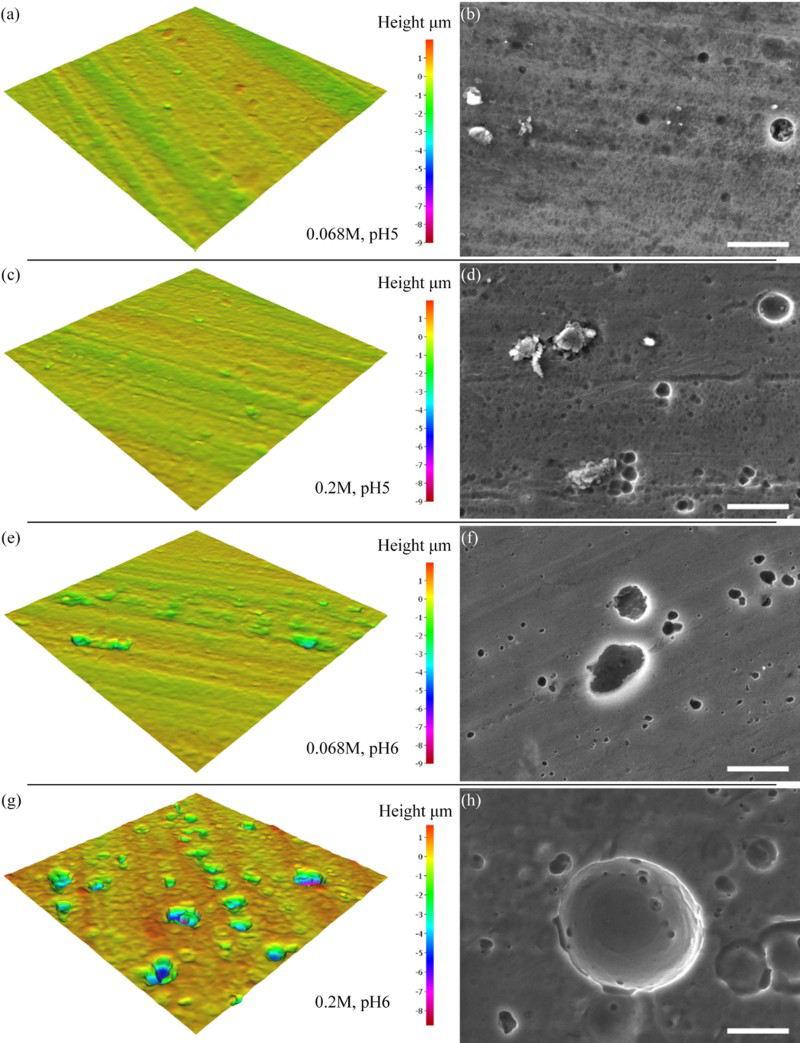
Potential causes of corrosion for AA2024-T3 in oxalate solution
Oxalic acid is a diprotic acid and thus has three possible forms in aqueous solution depending on pH, H2C2O4, HC2O4 − and C2O4 2-. At pH > 4.3, the C2O4 2- ion is predominant in the solution [43]. For AA2024-T3 exposed to solutions with low concentrations of oxalate, aluminium and copper oxide/hydroxide can be expected, while at higher concentrations, oxalate complexes will form, e.g. Al(C2O4)3 3- and Cu(C2O4)2 2- [43,44].
To better understand the different corrosion behaviour of AA2024-T3 in 0.2 M oxalate solution at two neighbouring pH values (i.e. 5 and 6), CPPs were performed on various constituent elements (i.e. Al, Mg, Cu, Fe and Mn). Figure 9(a) showed that Al exhibited typical passivation behaviour at pH 5, but a large active-passive transition (−1.1 to −0.6 VSCE) at pH 6 with i crit of ∼36 µA cm−2 and a primary passivation potential (E pp) of −0.85 VSCE. Mg suffered active corrosion under charge transfer control at pH 5, but showed a large active-passive transition at pH 6 (Figure 9(b)). Fe and Mn showed active–passive transition at both pH levels (Figure 9(d and e)). Figure 9(c) indicated the crossover potential for Cu was much higher (−0.2 VSCE), suggesting that the small anodic peaks observed in Figure 5(b) can be correlated to copper oxidation.
CPP of various pure metals in deaerated 0.2 M oxalate solutions at pH 5 and 6: (a) AA1100 (99% Al), (b) Mg (> 99.95%), (c) C101 Cu (99.99%), (d) Fe (99.995%) and (e) Mn (99.9%).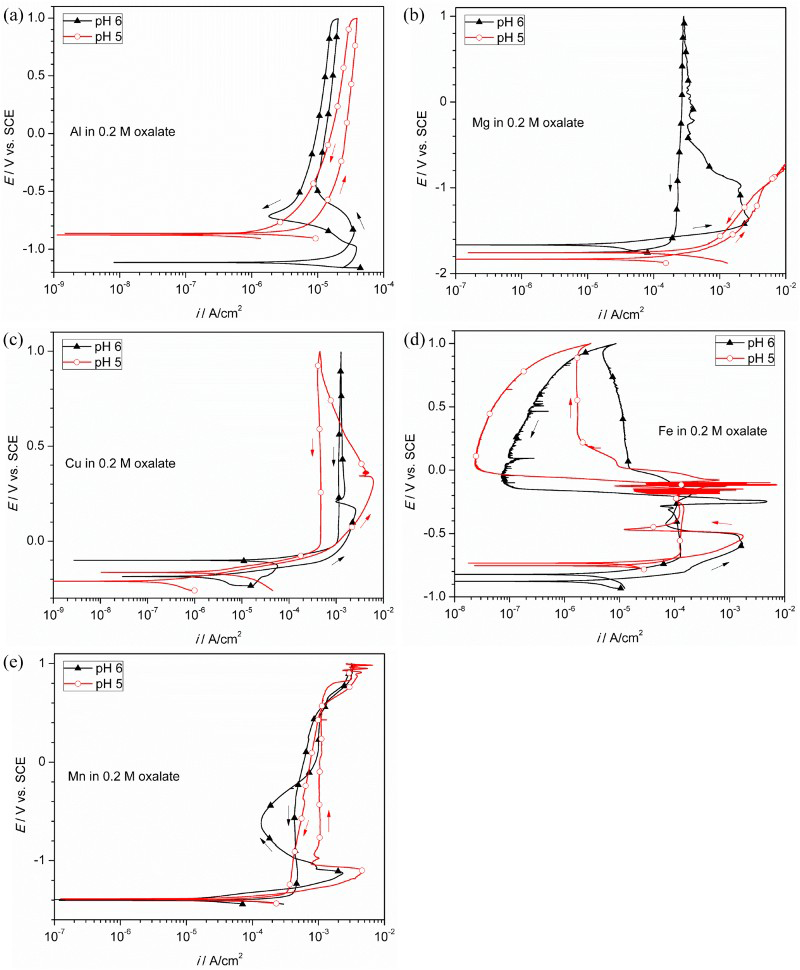
Based on the characterisation of corrosion products and morphology, coupled with electrochemical investigations, the higher CR observed at 0.2 M-pH 6 can be explained as follows. At pH 6, the cathodic reaction switches from diffusion-controlled ORR to charge-transfer-controlled HER at OCP when the oxalate concentration increases over a threshold (between 0.02 and 0.044 M). At 0.2 M, the anodic kinetics for AA2024-T3 changes from passive to active dissolution at OCP when pH increases from 5 to 6. The combined effect leads to significantly higher CR for the 0.2 M-pH 6 condition and as a result, thick corrosion products form uniformly on the metal surface, which consist mainly of aluminium and copper oxalates, with possible oxides/hydroxides.
The Al–Cu–Fe–Mn intermetallics exhibited different corrosion behaviour between pH 5 and 6 at 0.2 M after 5-day immersion. Some large particles (∼10 µm in diameter) remained on the surface with trenching morphology at pH 5; however, all particles dissolved completely at pH 6. The baseline OCP at pH 6 was ∼−1.1 VSCE and both Al and Mn were in the active region (Figure 9(a and e)) and thus would dissolve. It is postulated that the active dissolution of Al (82.47 at.-% in Table 1) is the main cause for the disappearance of Al–Cu–Fe–Mn intermetallics at pH 6. In contrast, Al is in the passive region at pH 5 and thus active dissolution is prevented. The galvanic coupling effect between the Al–Cu–Fe–Mn intermetallics and the matrix is probably responsible for the trenching behaviour observed at pH 5 [30]. In comparison, the smaller Al–Cu–Mg intermetallics showed negligible pH effect as they dissolved completely at both conditions, which may be attributed to the rapid dissolution of Mg and possible redox reaction of Cu [45,46].
Conclusions
The corrosion behaviour of AA2024-T3 were studied as a function of pH and oxalate concentration with immersion tests, electrochemical measurements and followed by various surface characterisations. The following conclusions can be drawn:
At a low to medium oxalate concentration (≤0.068 M), the uniform corrosion rate of AA2024-T3 decreased greatly with increasing pH. At an oxalate concentration of 0.2 M, the highest corrosion rate occurred at pH 6. At pH 6, the uniform corrosion rate of AA2024-T3 increased with increasing oxalate concentration; at pH 5, corrosion rate initially increased but became similar at concentrations of 0.068 and 0.2 M. In an acidic environment (pH 2 and 3), corrosion rate decreased with increasing oxalate concentration. At pH 6, the cathodic reaction switched from diffusion-controlled ORR to charge-transfer-controlled HER at OCP when the oxalate concentration increased over a threshold. At 0.2 M, the anodic kinetics for AA2024-T3 changed from passive to active dissolution at OCP when pH increased from 5 to 6. After 5-day immersion of AA2024-T3 in 0.2 M oxalate, all Al–Cu–Mg intermetallics dissolved completely at pH 6 while few severely corroded particles remained at pH 5. For Al–Cu–Fe–Mn intermetallics, some large particles (∼10 µm in diameter) remained on the surface with trenching morphology at pH 5, while all particles dissolved completely at pH 6. The different polarisation behaviour of Al at pH 5 vs. 6 was considered to be the predominant factor for the different corrosion rates and morphology of AA2024-T3 found at these pH levels.
Footnotes
Acknowledgements
The authors would like to thank Dr Steven Cheung and Ms Sihan Wang from the Department of Polymer Science at the University of Akron for their help in running DRIFT/Raman characterisations and Dr Lingyan Li for helping with SEM-EDX scans. They also would like to thank Dr Lu-Kwang Ju for valuable suggestions. This work is in participation with the DoD Technical Corrosion Collaboration supported by the U.S. Department of Defense Office of Corrosion Policy and Oversight.