
Abstract
This study aims to evaluate the influence of heat input and dilution on the corrosion behaviour of a weld overlay coating of Inconel 625 deposited using a plasma transferred arc process. Cyclic potentiodynamic polarisation, double-loop electrochemical potentiometric reactivation and critical pitting temperature (CPT) experiments were performed to determine sensitisation and pitting corrosion resistance of the coating, besides microstructural characterisation and microhardness testing. The overlay showed to be resistant to sensitisation in all cases. Within the scope of this study, only the CPT test was able to cause pitting in the alloy, which showed that increments of the specimen's chemical dilution and heat input induced a lower CPT. This is mainly due to different chemical compositions among the distinct phases present in the coating.
Introduction
The corrosion in equipment under high temperature and pressure operating conditions is a problem for several industries like petrochemical, power generation, aeronautic and naval. In the case of the oil and gas sector, the petroleum found in reservoirs normally has a high contamination level of corrosive compounds, organic acids, H2S, CO2, among others. In this context, the use of noble metal coatings over low-cost substrates is important to reduce production costs, while achieving the required level of specifications for the material.
Testing of coatings for oil extraction and refining is necessary to ensure that the materials quality can withstand harsh operating conditions such as those faced in pre-salt regions in Brazil, where high levels of carbon dioxide, hydrogen sulphide and chlorides are present. The combination of these agents can increase corrosion rates drastically and, in the case of ineffective control and prediction could cause great environmental damage.
Among the materials commonly utilised as coatings, UNS N06625 is commercially known as Inconel 625, a Ni–Cr–Mo alloy with has high mechanical, corrosion, and wear resistance. Several processes are used to a produce weld overlay in nickel-based alloys, such as GMAW [1], GTAW [2], and explosion welding [3], as well as PTA [4]. The main advantage of the latter is its higher deposition rate linked to a lower heat input [5], achieving chemical composition and properties more similar to the filler metal than the substrate with only a single pass performed, reducing material and operation costs. As the chemical dilution is reduced, the iron from the substrate that migrates into the overlay is minimised and consequently the reinforcement pitting corrosion resistance is increased.
In the literature [1,2,6,7], different welding processes were evaluated in nickel-based overlays for petrochemical applications. However, potentiodynamic polarisation methods were not enough to evaluate the coating behaviour for pitting corrosion leading to no significant difference reported in the results reported. This occurs due to the specimen high chromium and molybdenum content. The corrosion resistance was only able to be evaluated through immersion tests using ASTM G48 Method C [8] to determine its critical pitting temperatures (CPTs).
In this study, the influence of heat input and chemical dilution of weld overlays of Inconel 625 performed by PTA-P (plasma transferred arc fed with powder) on its microstructure and on its pitting corrosion resistance will be evaluated.
Materials and methods
Sample preparation
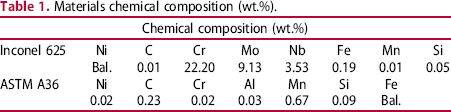
Materials chemical composition (wt.%).
All depositions were made with a single pass, with a 110 mm min−1 welding speed. The welding position was flat, and the torch was positioned perpendicular to the steel plate. A weaving technique was utilised using a 15 mm width, 1420 mm min−1 weaving speed, 0.6 Hz weaving frequency, 0.2 s dwell time, and an argon purge gas with 99.9% purity.
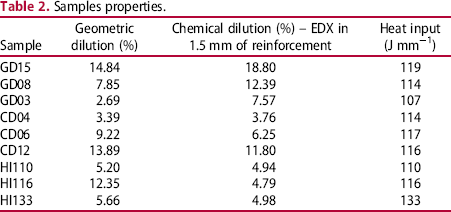
Variations in the welding current, powder feed rate, nozzle to workpiece distance (NWD), and electrode recess (Rc) were performed to create 31 coatings. All others parameters remained the same. Evaluations of each samples geometric and chemical dilution compared to heat input can be seen in [9,10].

Samples properties.
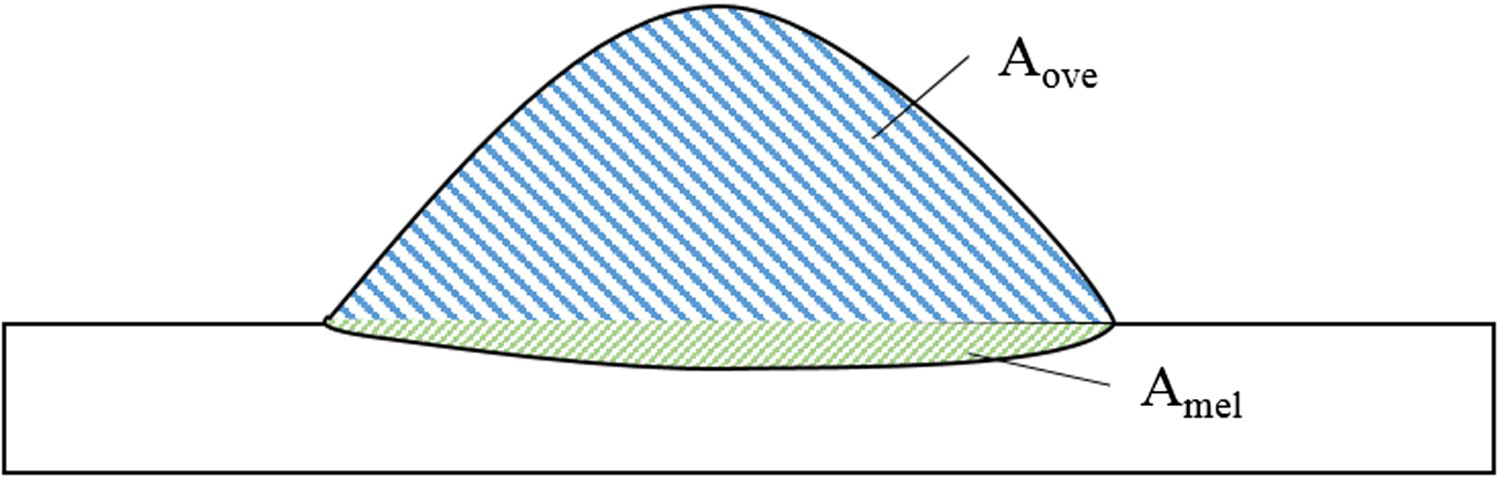
The geometric dilution (GD) can be obtained by an evaluation of the overlay cross-section, where the penetration depth into the substrate is measured. Geometric characteristics of the samples were obtained with the support of an image analysis software and SEM. A final GD value can be obtained by the ratio described in Equation (2), where Aove represents the area of the overlay and Amel represents the area of the substrate that melted in the process. These results were obtained in a previous work [10]. A representation of this evaluation can be seen in Figure 1.
Representation of a generic welding, showing the cross-section area added by the filler metal (Aove) and the area melted in the substrate (Amel).
Chemical composition
As the measurements in Table 2 were performed at a distance of 1.5 mm from the interface and the sample surfaces in this work are going to be evaluated with 2 mm of reinforcement, the correct chemical composition needs to be obtained for specimens ‘CDyy’ and ‘HIzzz’.
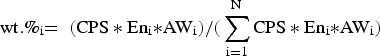
The overlay's surfaces were scanned in three different regions using a SEM with Energy Dispersive X-ray Spectroscopy (EDX) to determine its chemical composition. EDX was also used to determine the elemental composition of the secondary phases within each overlay. Consequently, the values obtained were used with Equation (1) to obtain its chemical dilution.
Microstructural analysis
Cross-sections of each clad were grounded, polished, and then etched with a 92 mL HCl + 5 mL H2SO4 + 3 mL HNO3 solution for 4 minutes. A Nikon Eclipse MD600 optical microscope was used for initial analysis. Samples were then brought to a ZEISS EVO 40 Scanning Electron Microscope (SEM) for further microstructural evaluation. The same procedure was performed to study the coating top surface, which is the overlay longitudinal section 2 mm away from the interface weld-substrate. This analysis was performed in all samples: ‘GDxx’, ‘CDyy’ and, ‘HIzzz’.
Microhardness testing
Three microhardness Vickers profiles were made on the cross-section of each clad using a Pantec HDX – 1000 TM microhardness tester with a load of 0.1 kg for 15 s [11]. For each sample, three microhardness profiles were created perpendicular to the weld interface with 3 mm spacing. The first measurement was taken exactly on the interface clad-substrate and further measures were taken at 0.2 mm intervals for 1.6 mm along the substrate and, in the other direction, 1.4 mm along the overlay. The testing was performed in all specimens: ‘GDxx’, ‘CDyy’ and, ‘HIzzz’.
Electrochemical tests
DL-EPR
As an initial assessment, double-loop electrochemical potentiokinetic reactivation tests (DL-EPR) were performed with the specimen group with different geometric dilutions (GDxx) in order to evaluate the coating susceptibility for intergranular corrosion, in accordance with ISO 12732 [12]. The tests were performed in a 0.1 mol L−1 H2SO4 + 0.001 mol L−1 KSCN solution, deaerated with 99.999% purity argon in ambient temperature (25°C). A three-electrode cell was used with a saturated calomel electrode (SCE) as the reference electrode, a platinum plate as the counter electrode, and the coating top surface as the working electrode. Each test scenario was performed in triplicate. The solution was deaerated for 45 minutes prior to, and during each test. The sample was immersed in the solution for 30 minutes to reach the open circuit potential (OCP). Thereafter, the sample was polarised 700 mV to the passivation range and then reversed at a rate of 1.67 mV s−1. The degree of sensitisation is defined by the ratio between the maximum reactivation current (Ir) in the reverse sweep and the maximum current (Ia) in the anodic sweep [13].
Cyclic potentiodynamic polarisation
Cyclic potentiodynamic polarisation tests were performed in the specimen group with different geometric dilution (GDxx) as another method to evaluate the coating corrosion resistance. The samples were mounted in epoxy resin with an insulated electric connection and mechanically polished with a 0.3 µm alumina paste. To prevent crevice corrosion, the edges of the samples were covered with enamel. Utilising the same electrode cell from the previous procedure, the solution was deaerated with 99.999% purity argon for 40 minutes prior to, and during the testing. Then, cathodic polarisation was induced at −1 V (SCE) for 10 minutes was performed to eliminate oxides in the sample surface. The samples were immersed in the solution for 30 minutes prior to the test for stabilisation of the OCP. The sweep began at −200 mV from OCP, increasing the potential at a rate of 1 mV s−1 until the current density reached the value of 5 mA cm−2, then the sweep was reversed until the initial value was reached.
In order to reduce the pitting potential of the coating and in accordance with Tsai and Wu [14], preliminary tests were made with different concentrations of sodium thiosulphate (0.1, 0.01 and 0.001 mol L−1) in a 3.5% NaCl solution, aiming to find the most aggressive solution for this particular sample. The chosen solution was used for the further evaluations.
Critical pitting temperature (CPT)
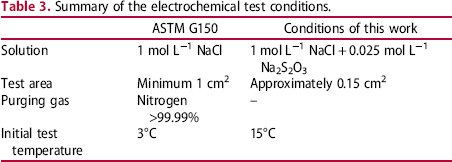
The subsequent tests were performed to the sample groups with significant variations in the chemical dilution (CDyy) and in the heat inputs (HIzzz). The potentiostatic tests (CPT) consisted of an adaptation of ASTM G150 [15].
A three-electrode cell was used: Ag/AgCl as the reference electrode, a platinum plate as the counter electrode and the working electrode (coating longitudinal top surface). The potential applied during the test was + 0.74 V vs. Ag/AgCl. To prevent crevice corrosion, a fast drying paint for wood and steel was applied to the sample to delimitate the contact area. The surface was examined carefully with an optical microscope after each test to ensure that no crevice corrosion was present at the specimen edges, which could invalidate the procedure.
Summary of the electrochemical test conditions.
Results and discussion
Chemical composition
Chemical composition of the coatings by EDX.
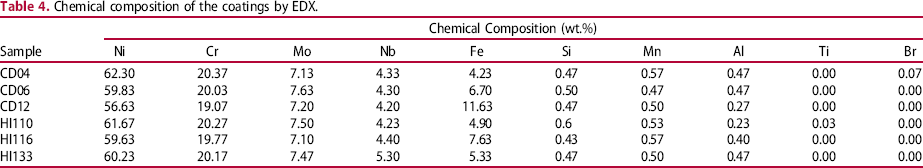
For the ‘CDyy’ samples, the higher the chemical dilution, the higher the iron content in the reinforcement, which is a result of more substrate absorbed by the Inconel deposited, agreeing with the geometrical dilution behaviour from previous works [9,10]. HI110 and CD04 presented the smallest values of chemical dilution and heat input, meaning that the welding parameters selected were not always able to penetrate far into the substrate. The specimens with different heat inputs (HIzzz) were generally selected based on having similar chemical dilution (5.00 ± 0.25%), however HI116 presented a chemical dilution (7.54%) much higher than what was specified in a previous work [10]. Even though this discrepancy was found, the sample was used for further analysis and evaluations were only taken into account where its effect did not compromise the results.
Microstructure
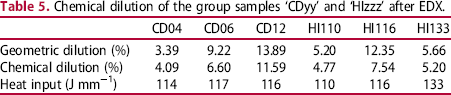
The cross-section microstructures for all coatings were very similar. This consisted mostly of columnar dendrites growing perpendicularly to the coating-substrate interface, which in some cases exhibited the presence of equiaxial dendrites. The microstructures for CD12 (higher chemical dilution) and HI110 (lower heat input) can be seen in Figure 2, where for HI110, the interface presented a high density of secondary phases and, dendritic growth began after this region. As the two samples were the extreme conditions for the dilution, it can be seen that the microstructure did not change significantly with the parameters analysed in this work.
Optical micrograph of the coating/substrate interface of sample CD12 (A) and sample HI110 (B) (100x magnification).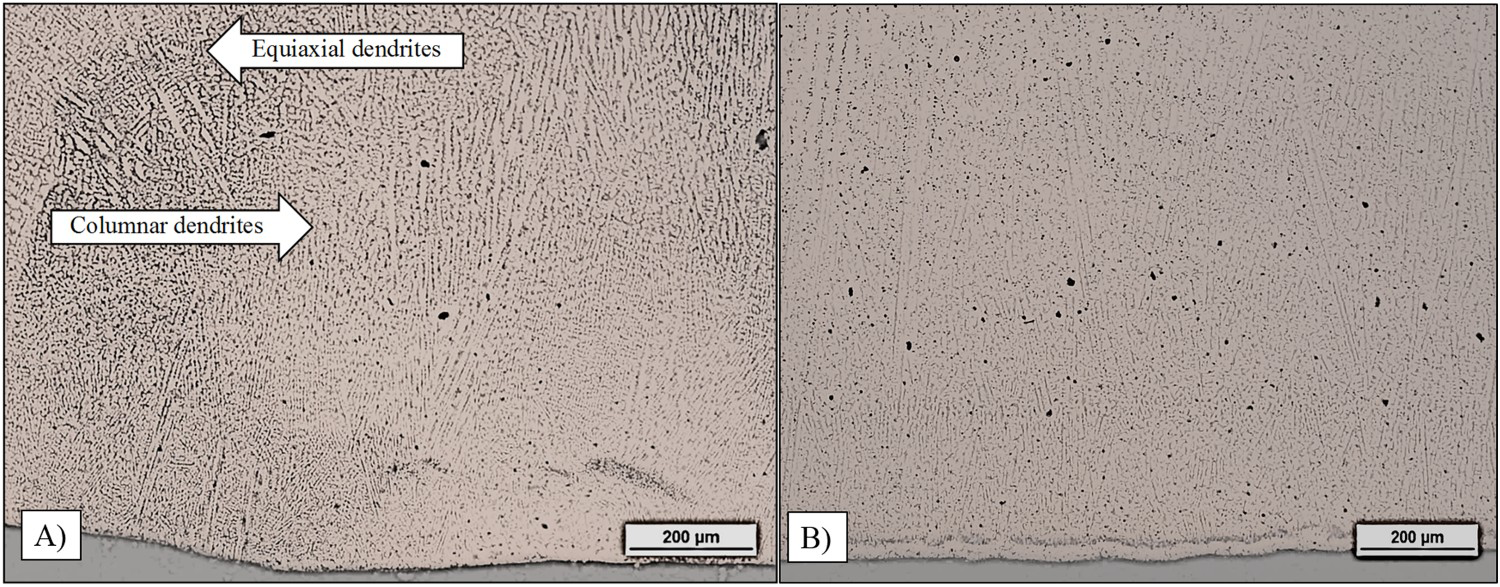
Abioye et al. [17] showed that the columnar dendrites grow perpendicularly to the interface in Inconel 625 alloys because, during the solidification process, heat is removed from the melted metal mostly by the substrate. The authors also reported a change of the dendrite orientation next to the coating surface due to the high heat transfer with the solidified region, however, this behaviour was not observed in this work, as the upper part of the overlay was removed beforehand.
Microhardness
Figure 3 shows the average microhardness values for the three profiles measured. The data from the specimens with significant geometric dilution variation (GD15, GD08 and GD03) are not described due to their similarity with samples CD12, CD06 and CD04, respectively, which have chemical dilution variation. Low dilution samples presented coatings with slightly higher hardness values. According to Aguiar [1], this occurs due to the presence of lower iron content. Consequently, the concentration of the elements responsible for hardening the Inconel 625, such as molybdenum, niobium and tungsten, are higher when compared to the samples with a higher iron content.
Coatings microhardness profiles.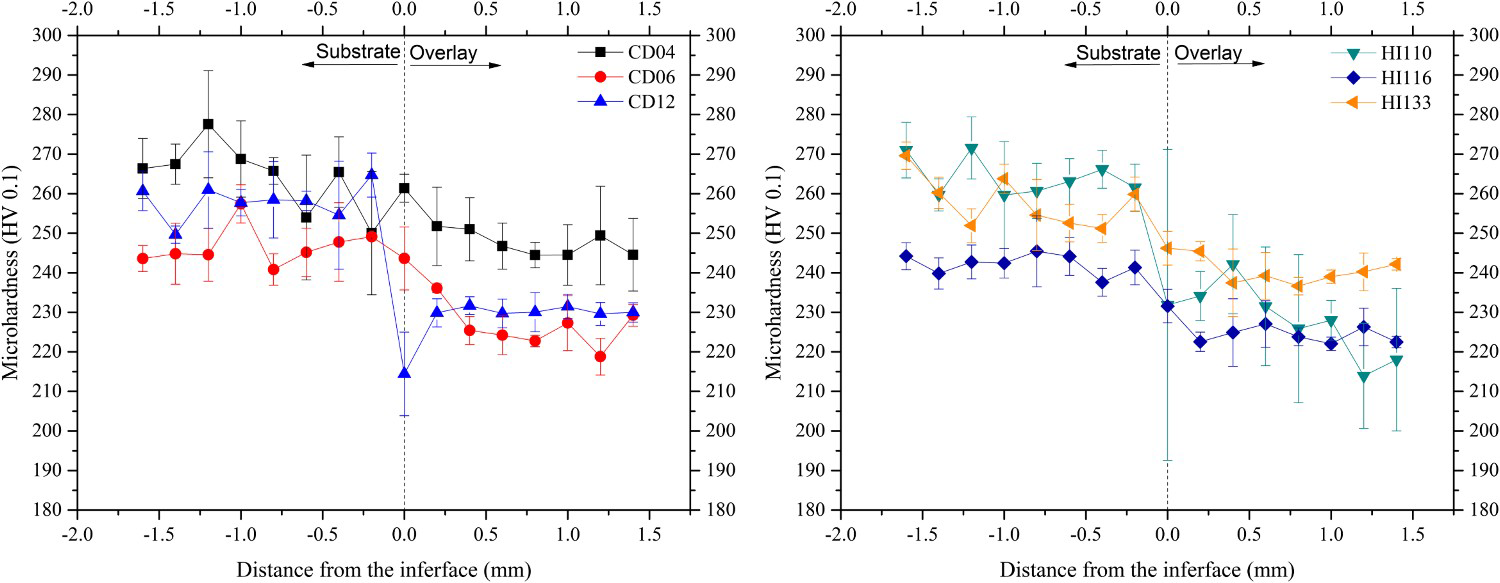
The samples with smaller heat inputs, CD04 and HI110, presented the highest substrate hardness values. This can be explained by the lower temperature profiles achieved, increasing the cooling timing and consequently, promoting the formation of bainite and martensite. The specimen HI110 presented a high standard error due to the higher density of precipitates near the interface, as shown in Figure 2, interfering with the accuracy of the results. For higher dilutions (CD12) where grains presented a cellular growth [18] near the interface before turning into dendritic form. This causes a slightly lower microhardness due to the lack of precipitates in the grain boundary as in the next stages. This solidification mode is caused by a higher cooling rate because of the contact with the substrate, which increased the heat transfer rate. The cross-section micrograph for specimen CD12 can be seen in Figure 4 in a higher magnification obtained through SEM.
Cross-section of sample CD12 highlighting the cellular grain growth near the interface with the substrate.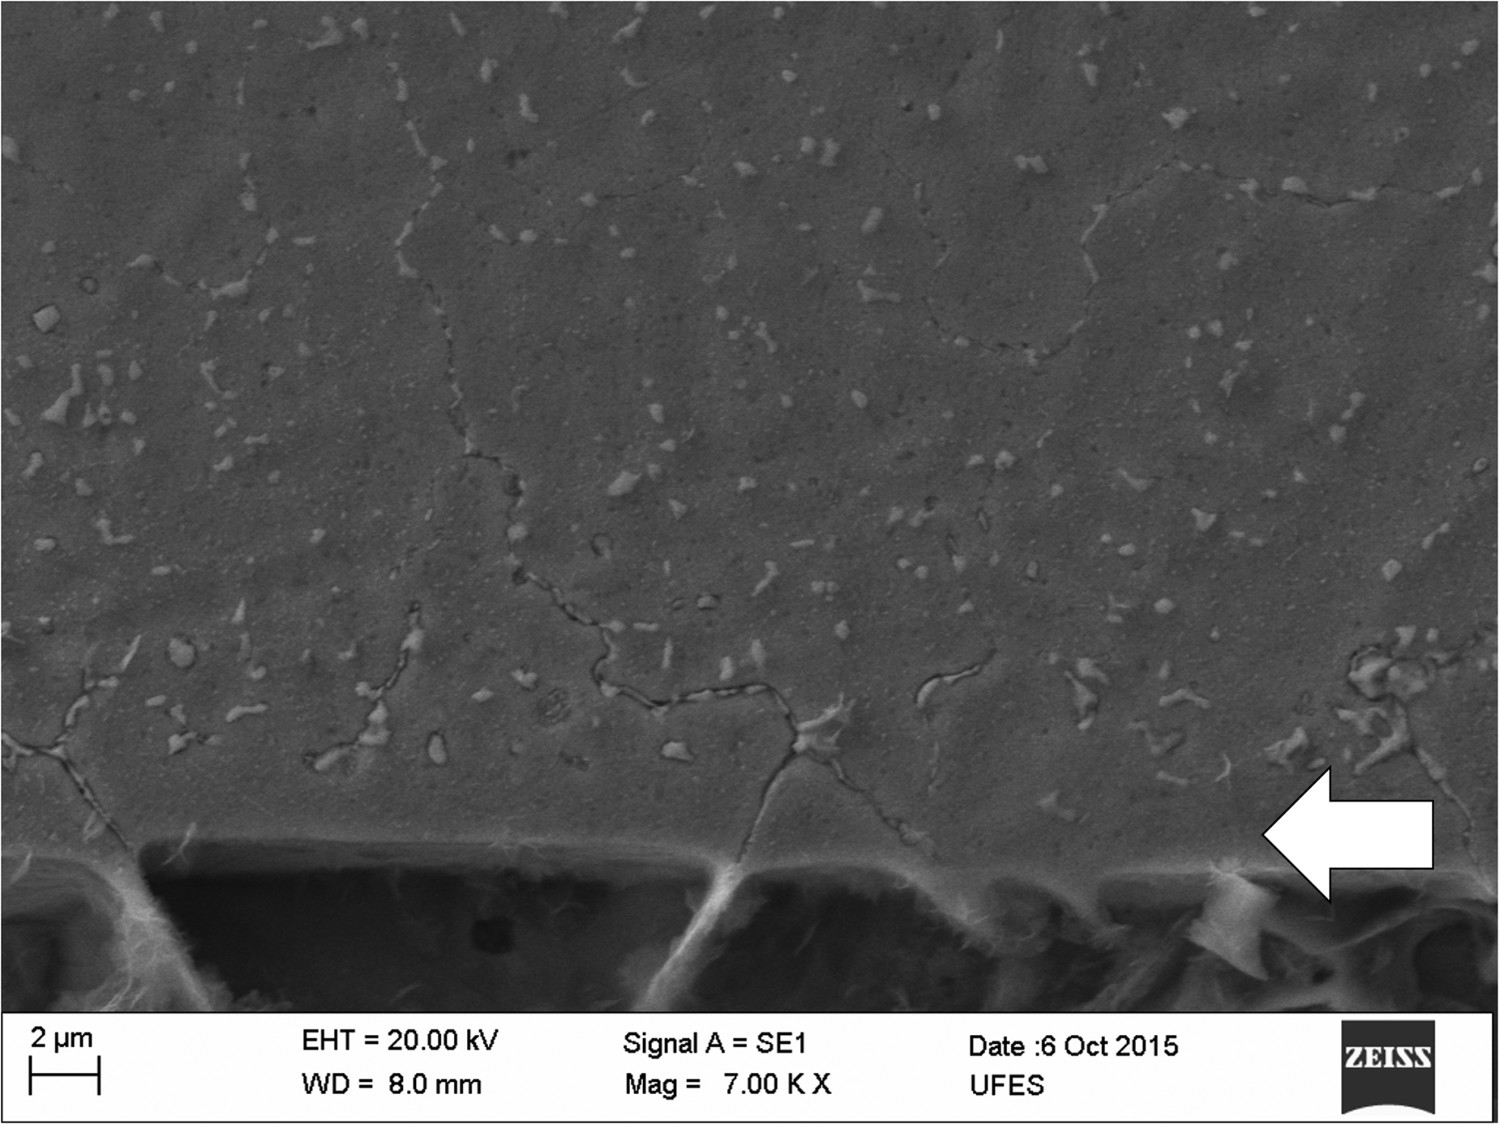
Top surface SEM/EDX
The analysis revealed a precipitate-free dendritic region, while secondary phases were present in the interdendritic zones. EDX analysis was performed to determine the elemental composition of the precipitates, as shown in Figure 5 for specimen CD04. It is worth to highlight that due to the small size of the secondary phases, the measurements can suffer interference from the matrix, around and under, the evaluated spot.
SEM micrograph of CD04 sample. (A), (B), (C) and (D) are secondary phases that had their elemental composition measured by EDX analysis.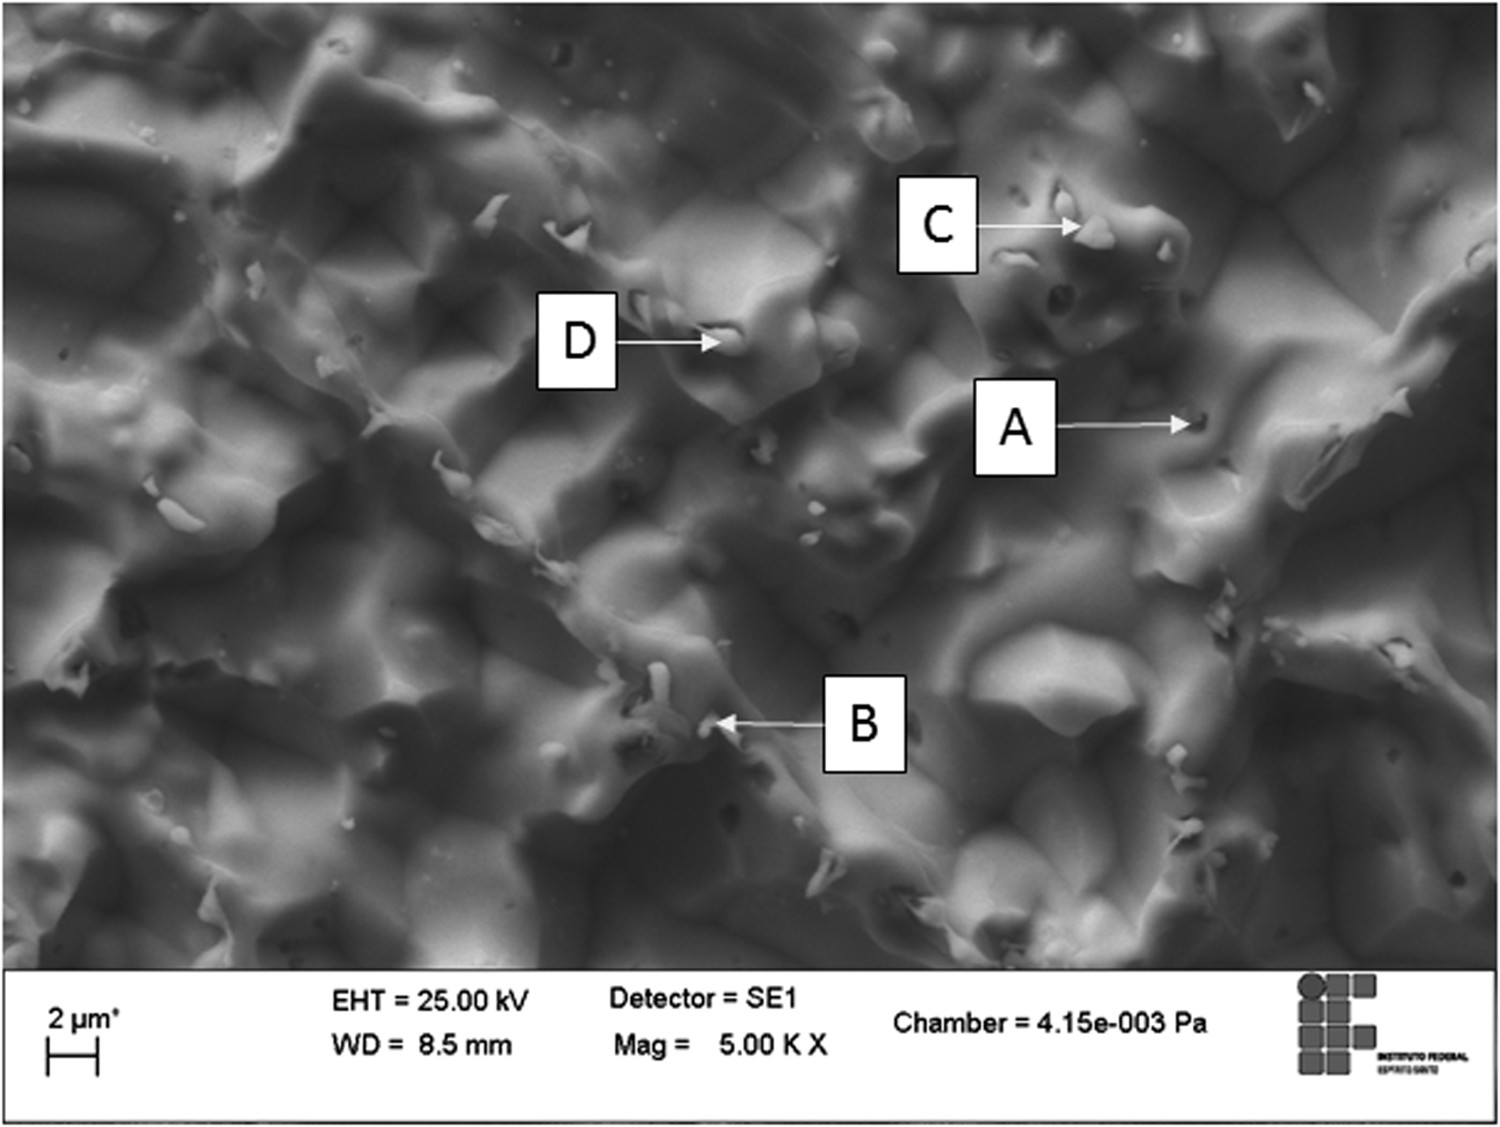
Phases (B) and (C) were believed to be niobium carbides (NbC) due to their high content of niobium and carbon, while precipitate (A) was identified as a Laves phase. A high content of boron (60%) was found in phase (D), indicating a boride. All other samples presented only NbC and Laves phases and no other phases were observed. Banovic et al. [19] imply that with an increase in dilution, the iron content in the coated metal rises and, thereby, reducing the solubility of other elements, like niobium and molybdenum, in turn increasing their segregation in the interdendritic phases as precipitates. The same behaviour is observed in the EDX analysis with a line scan, where elemental composition profiles were obtained from the sample top surface, as seen in Figure 6.
Elemental composition profile of CD12 sample. The micrograph on the left shows the reading direction.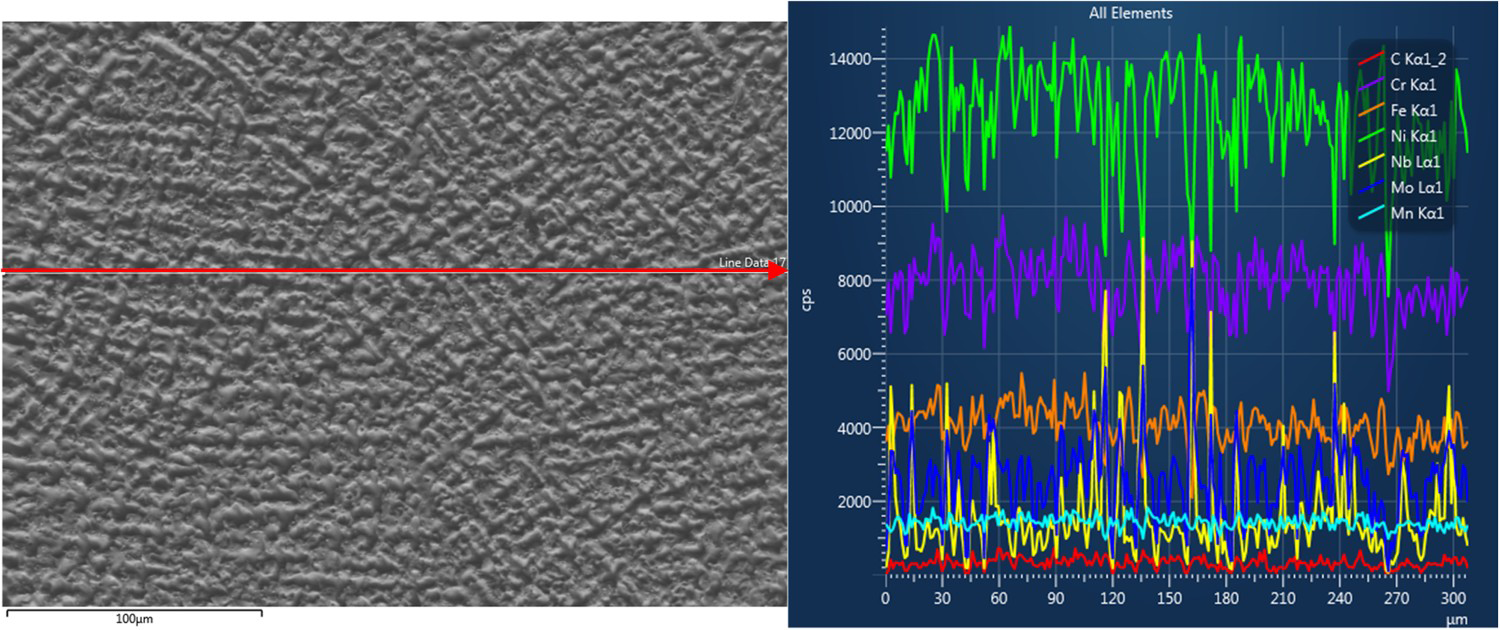
Approximate elemental compositions for dendritic and interdendritic regions.
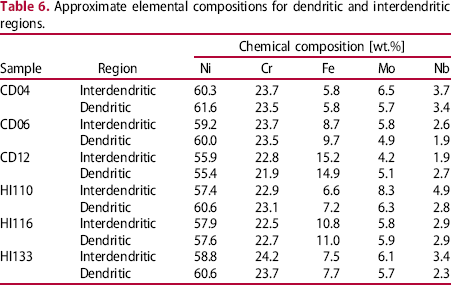
The data can be correlated to a study by Dupont [20], where he analyses the Equilibrium Distribution Coefficients (k) of Alloy 625 weld overlay deposits, concluding that Fe, Ni and Cr have a slight tendency to segregate at the dendritic regions, while Mo and especially Nb have a high tendency to segregate at the interdendritic regions.
Potentiodynamic tests and effect of overlay's geometric dilution
DL-EPR for intergranular corrosion evaluation
The coatings with geometric dilution variation (GDxx) presented similar values of maximum activation current and have not shown reactivation current during the reverse loop (Figure 7), even though an activation peak was present on the first sweep. These results suggest that a rupture of the passive film has not occurred in spite of different sample dilution and iron content in the overlay. Prohaska et al. [21] studied the intergranular corrosion resistance of Inconel 625 forged and heat-treated through DL-EPR method. They found differences in the sensitisation degree depending on the heat treatment temperature. Similar results were found by Gonzalez-Rodriguez and Fionova [22] studying a heat-treated Inconel 601 with DL-EPR tests.
DL-EPR curves for coatings GD15, GD08 and GD03 in a 0.1 mol L−1 H2SO4 + 0.001 mol L−1 KSCN solution.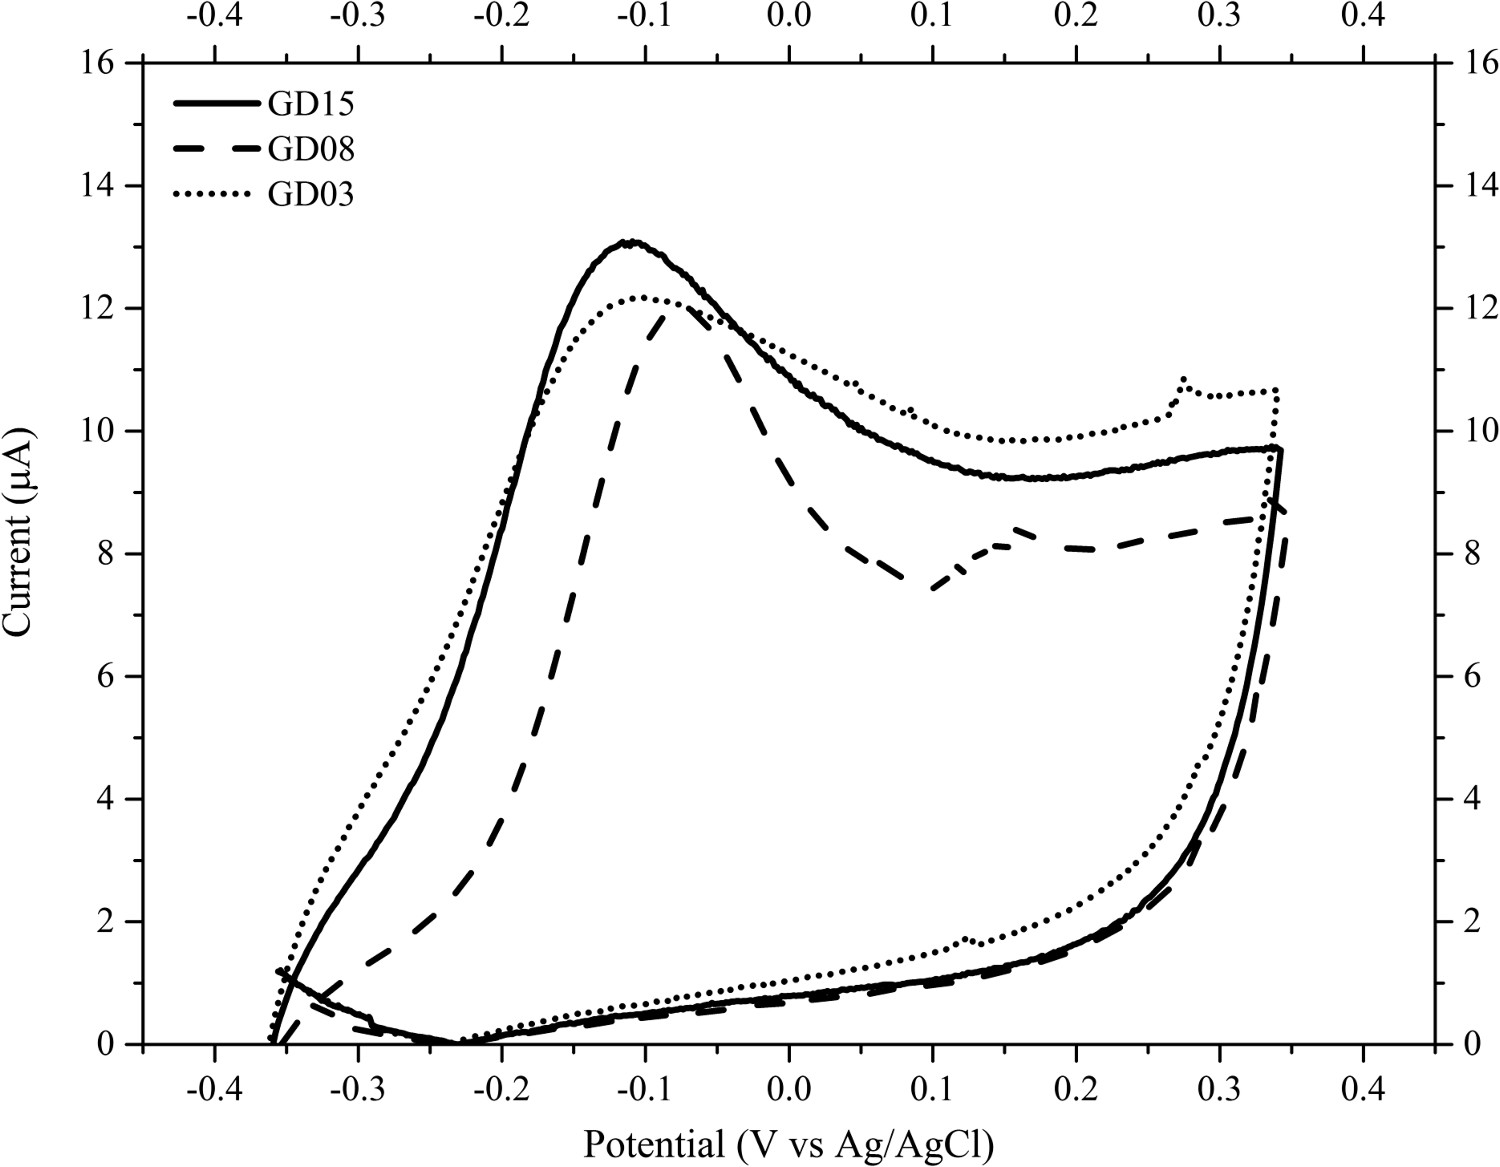
After each test, the sample surfaces were analysed by SEM, which can be seen in Figure 8. The results proved that the alloy did not present intergranular corrosion in the test conditions for all samples. In the micrograph, the black dots are pores formed during the solidification process. It can be concluded that the overlay is resistant to intergranular corrosion caused by sensitisation during welding.
Surface of overlays GD15, GD08 and GD03 after DL-EPR tests showing no intergranular corrosion.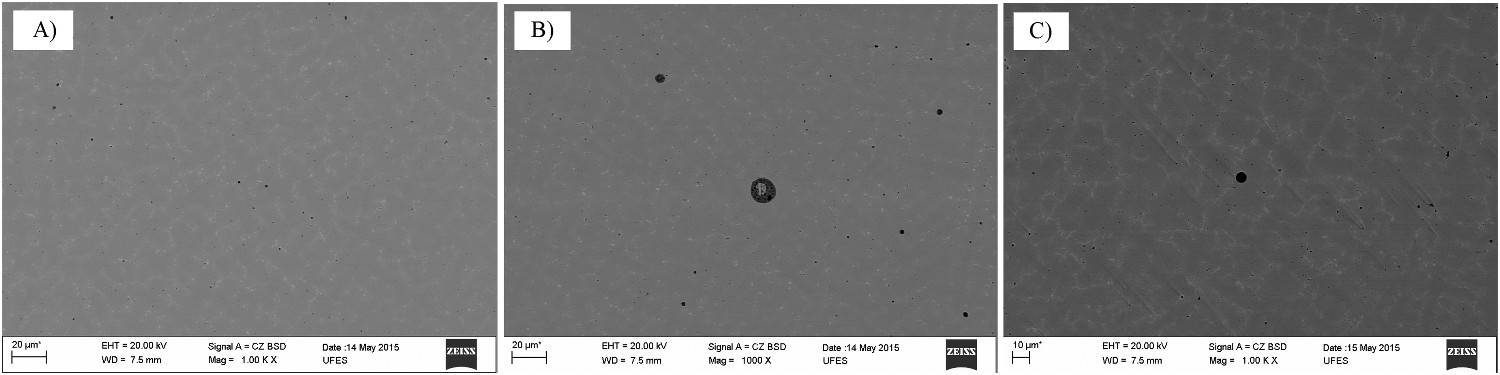
Cyclic potentiodynamic polarisation for pitting corrosion susceptibility
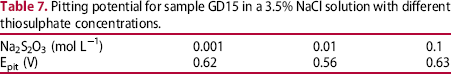
As a preliminary test, in order to determine the most aggressive solution for the subsequent tests, the sample with higher geometric dilution (GD15) and, consequently, higher iron content and pitting susceptibility, was used to evaluate the effect of the sodium thiosulphate concentration on the pitting corrosion potential. The polarisation curves in different concentrations of sodium thiosulphate are presented in Figure 9 and its respective pitting potentials are in Table 7. The lowest value (0.56 V) was observed using a 0.01 mol L−1 Na2S2O3 concentration, the behaviour of which is similar to that achieved by Tsai and Wu [14], who evaluated the susceptibility of Inconel 690 for localised corrosion in different concentrations of sodium thiosulphate. As it has presented the lowest pitting potential, the 3.5% NaCl + 0.01 mol L−1 Na2S2O3 solution was chosen for the potentiodynamic tests.
Polarisation curves for sample GD15 in a 3.5% NaCl solution with addition of 0.001 mol L−1 (A), 0.01 mol L−1 (B) and 0.1 mol L−1 (C) of Na2S2O3. Pitting potential for sample GD15 in a 3.5% NaCl solution with different thiosulphate concentrations.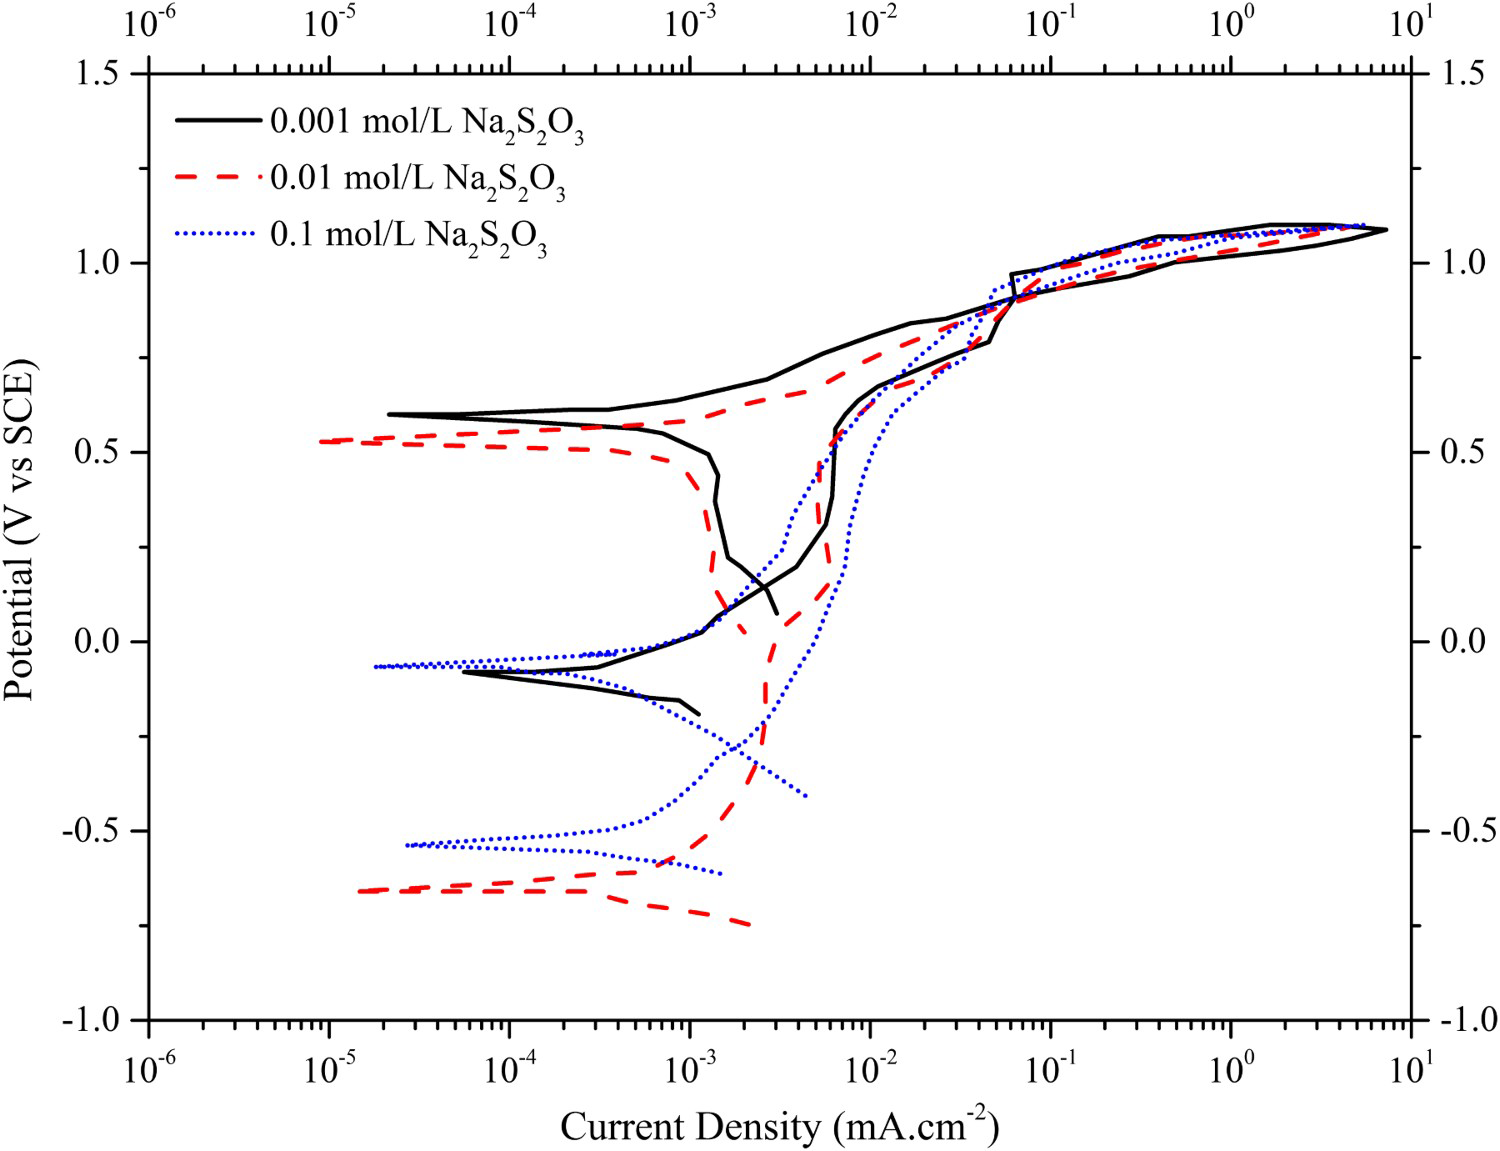
First, tests in all ‘GDxx’ samples with a solution of 3.5% NaCl were performed, and its results can be seen in Figure 10. There is no relevant difference among the curves for either the pitting potential (Epit) or passivation current (Ipass). Moreover, the lowest corrosion potential (Ecorr) and protection potential (Eprot) were observed in specimen GD03, which has the lowest geometric dilution and, hence, less influence of substrate's iron content.
Polarisation curves for samples GD15, GD08 and GD03 in a 3.5% NaCl solution.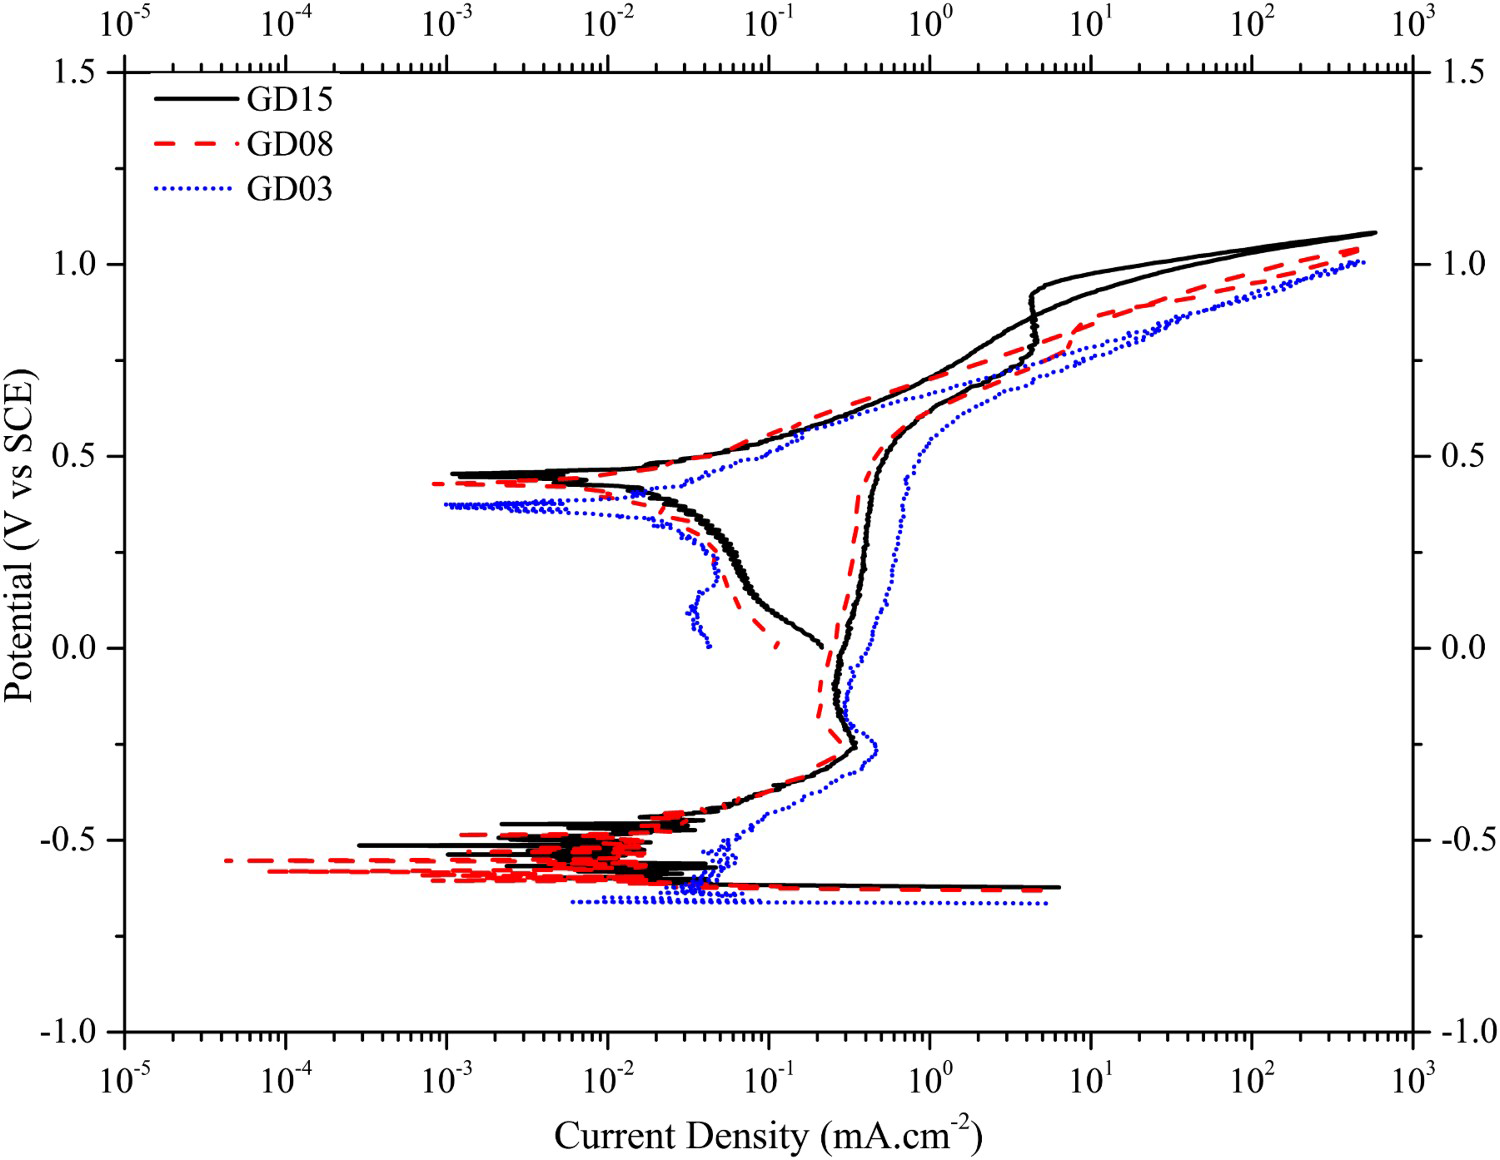
The only significant difference among the curves is on the hysteresis phenomenon. At higher dilutions (GD15) there is a positive hysteresis that occurs when the damaged passivation layer is not recovered during the reverse cycle and pitting is formed. For dilution values lower than 8%, a negative hysteresis is observed. This is typical for the passive state, occurring when a damaged passive layer recovers after breakage, preventing pitting propagation.
Aguiar [1] when evaluating the susceptibility of pitting corrosion on Inconel 625 coatings made by SMAW, has found pitting potentials around 0.6 V and no hysteresis. The increase in the layer thickness decreases the hysteresis effect, indicating a quicker repassivation and, hence, increasing its pitting corrosion resistance. As a result, the so considered noble alloys do not present susceptibility to pitting, and by consequence, nor hysteresis. From the results presented in Figure 10, it can be seen that higher geometric dilution and iron content makes the overlay slightly more susceptible to pitting, but not enough to allow its propagation.
The polarisation results with the addition of 0.01 mol L−1 Na2S2O3 to the 3.5% NaCl solution are presented in Figure 11. In this condition, there is no significant difference among the samples regarding pitting potential (Epit). Furthermore, lower corrosion potential (Ecorr), and protection potential (Eprot) were again observed for lower geometric dilution (GD03) and, therefore, lowest iron content from the tested samples.
Polarisation curves for specimens GD15, GD08 and GD03 in a 3.5% NaCl + 0.01 mol L−1 Na2S2O3 solution.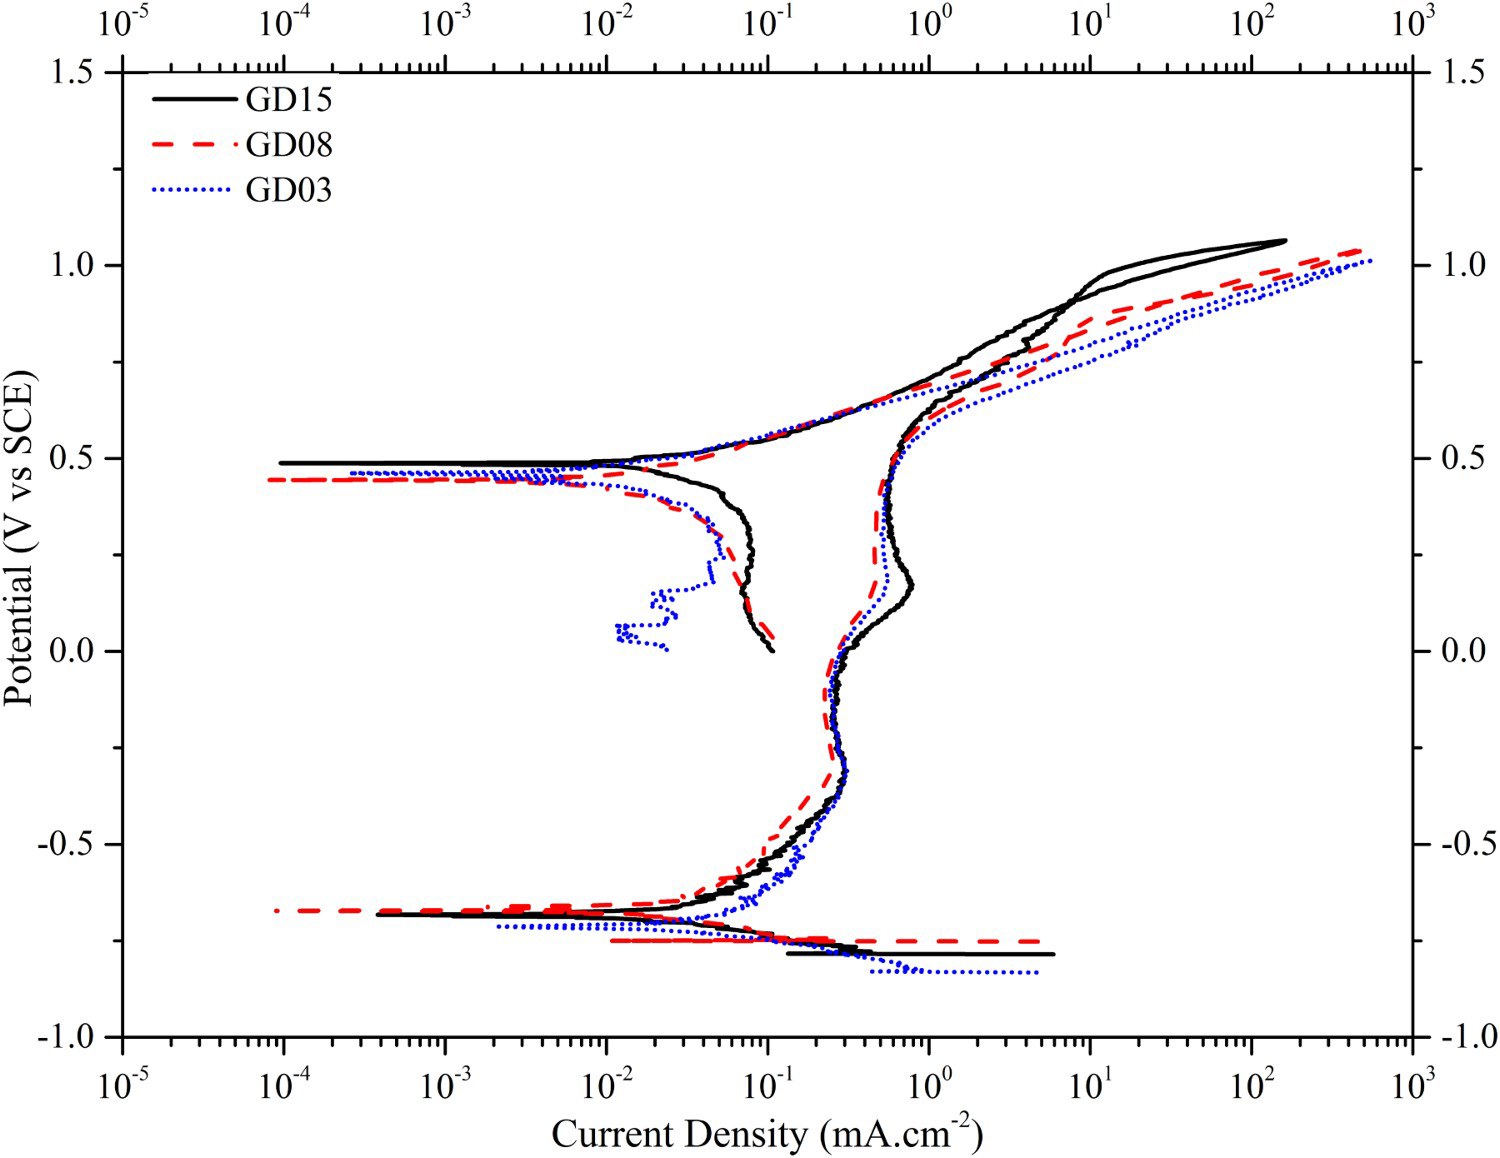
Abioye et al. [17] evaluated the corrosion behaviour of Inconel 625 coating made by laser cladding through potentiodynamic polarisation. They found different pitting potentials for coatings with different dilutions, which value for the lowest dilution was similar to the value found here.
Differences in the hysteresis were again observed, of which the effect decreased with the geometric dilution: at 15% a positive hysteresis can be seen, a negative one at 8% and no hysteresis at all at 3%, presenting a similar behaviour to the solution with no sodium thiosulphate addition. It can be concluded, that there is no significant difference in pitting resistance with the presence of sodium thiosulphate in the sodium chloride solution for the conditions tested. This proves that the overlay alloy did not present a decrease of its corrosion resistance with the increase in iron content.
After each test, the sample surfaces were analysed by SEM. As can be seen in Figure 12, corrosion occurred preferentially in the precipitate-matrix interface, which could be justified by the depletion of molybdenum in this zone as it migrates to the secondary phase during the solidification, increasing the surrounding pitting susceptibility. In summary, the effect of dilution in the test conditions was not enough to obtain different values of pitting potential. Chubb and Billinghan [23], through electrochemical polarisation techniques in 3.5% NaCl solutions, showed that the corrosion behaviour of Inconel 625 welded coatings does not present significant change for dilution levels lower than 20%. Their results were in accord with the ones found in this work.
Surface of sample GD15 after the polarisation test in a 3.5% NaCl solution, showing corrosion on the interface between precipitate and matrix.
Solution tests for CPT evaluation
As no pitting was observed in the previous potentiodynamic tests with the previous sample group (GDxx), a more aggressive test was performed in order to evaluate the overlay corrosion behaviour. For these tests, the two last sample groups were utilised: ‘CDyy’ and ‘HIzzz’.
During preliminary tests, the 1.0 mol L−1 NaCl solution (defined by the ASTM G150), was not sufficient to cause pitting before the maximum bath temperature (98°C) was achieved. Tsai and Wu [14] studied the effect of thiosulphate ions and pH in pitting corrosion on an alloy 690 in chloride solutions, where a reduction in pitting potential was observed with the increase of thiosulphate concentration to a certain level and a posterior decrease for higher concentrations. Ezuber et al. [16] analysed a heat-treated Ni-18Cr-6Fe alloy and have found a 0.025 critical ratio between thiosulphate and chloride ion concentrations that generates the maximum reduction of pitting potential.
CPT results for the exploratory tests in a 1.0 mol L−1 NaCl solution with different sodium thiosulphate concentrations.
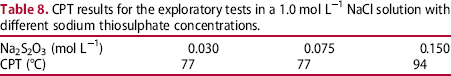
The solutions of 0.030 and 0.075 mol L−1 of Na2S2O3 presented the same CPT (77°C), whereas in the 0.0150 mol L−1 solution a CPT of 94°C was observed. The latter presented a CPT too close to the limit temperature of the equipment, which would inhibit tests with lower dilution samples. Thus, this solution was discarded for further evaluations. In order to differentiate the two first results, the sample surfaces were analysed on SEM (Figure 13) to investigate the pitting propagation.
SEM images of the sample surfaces after the tests with the base solution and 0.030 mol L−1 (left) and 0.075 mol L−1 (right) of Na2S2O3.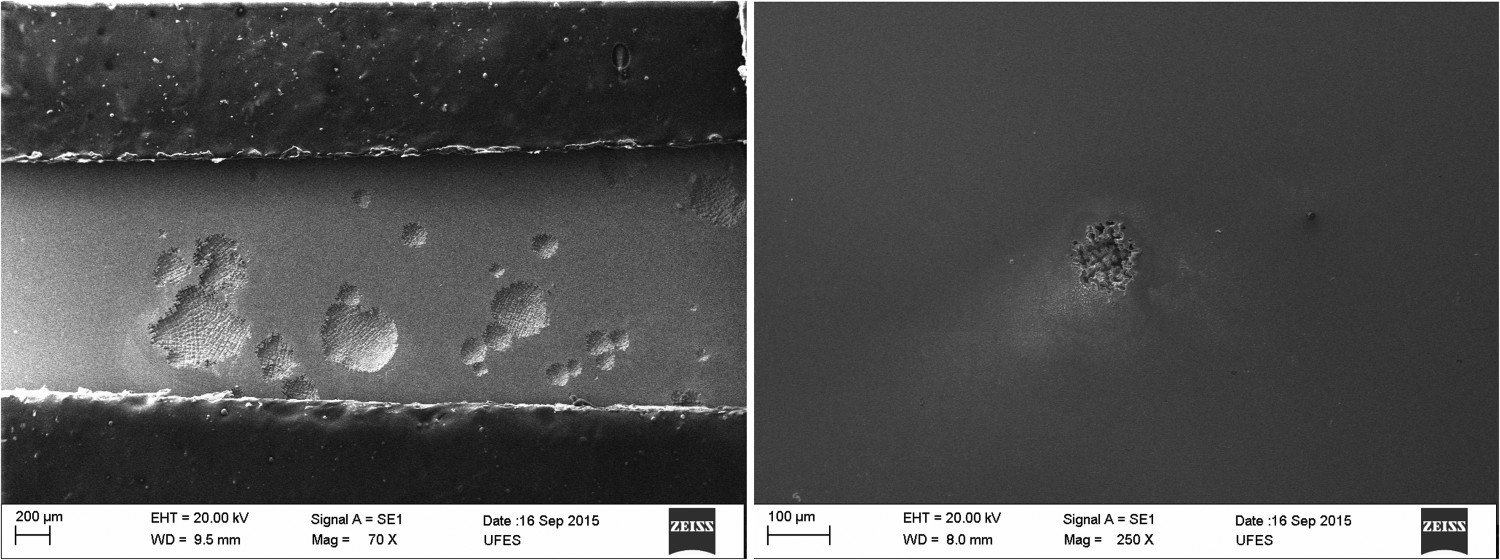
It is possible to observe that the 0.030 mol L−1 thiosulphate concentration resulted in the formation of a higher quantity of pits, and their dimensions were greater than that of the sample surface tested in the 0.075 mol L−1 concentration, which presented a single pit as can be seen in Figure 13. The addition of 0.030 mol L−1 Na2S2O3 into the 1.0 mol L−1 NaCl solution created the most aggressive environment and it will be used for the further evaluations in this work. Moreover, the Inconel 625 presented similar results to those reported by Ezuber et al. [16].
CPT and effects of chemical dilution and heat input on the overlay
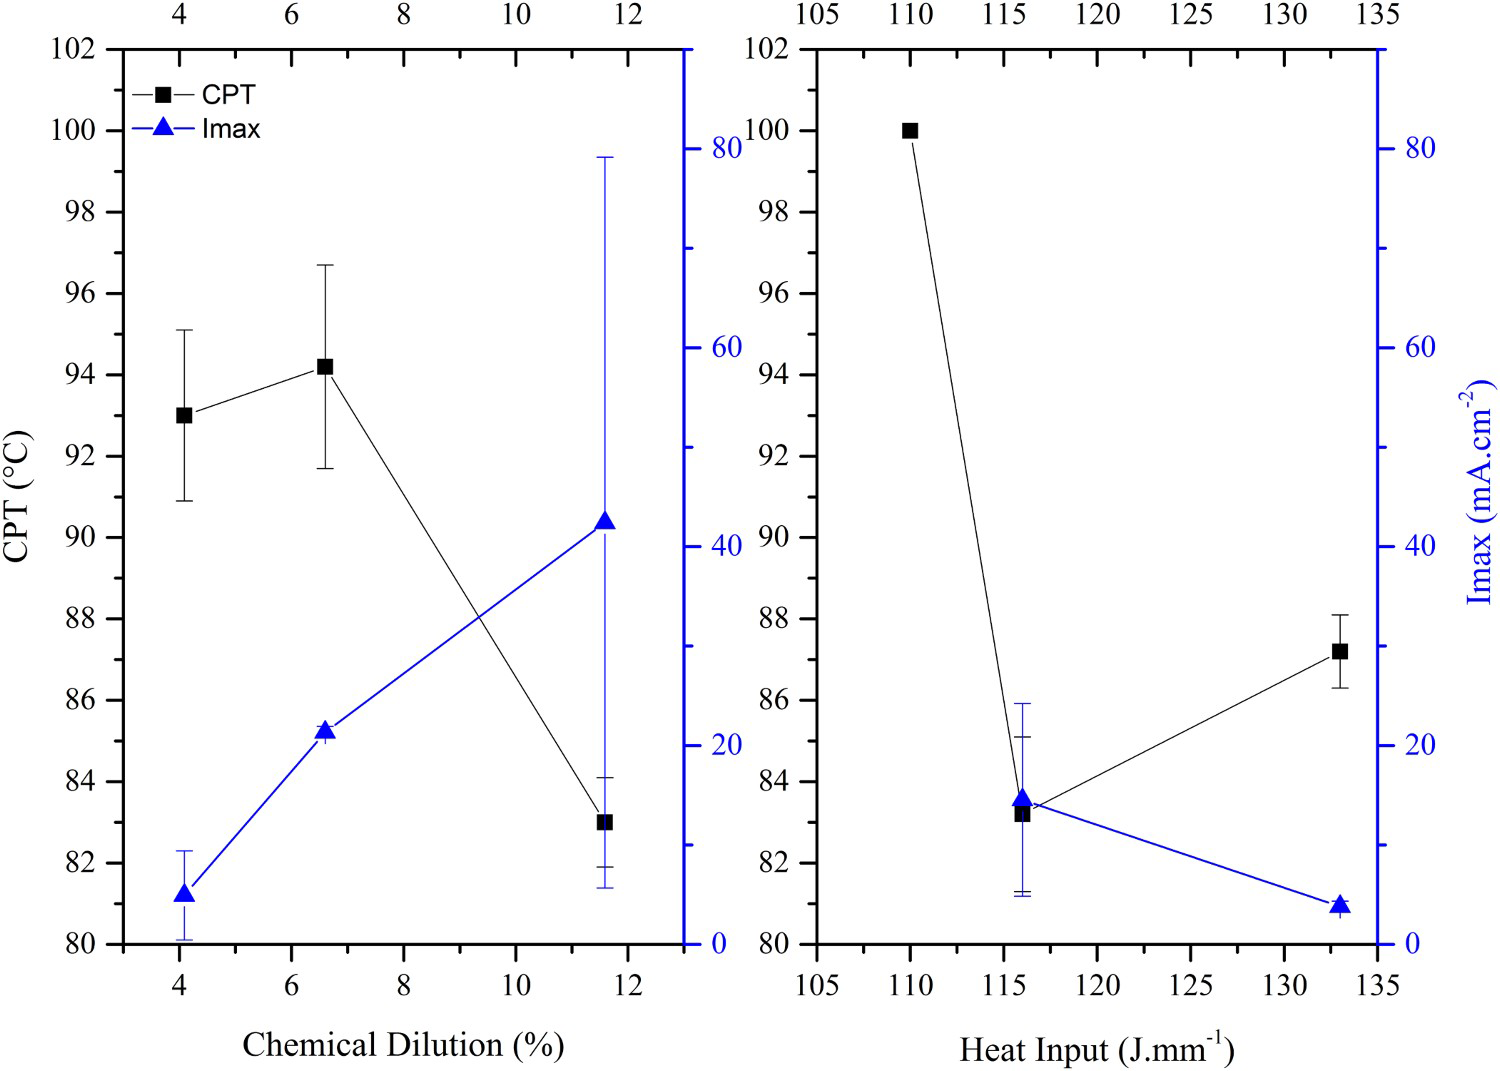
The CPT tests results can be seen in Figure 14 and a summary of the data collected in can be seen in Figure 15. The maximum current density (Imax) was defined as the value measured 60 seconds after it surpasses the limit of 0.1 mA cm−2, which is defined as the threshold to secure the formation of pitting [15]. The error bars in Figure 15 represent an interval containing the values observed in the tests and not the traditional standard deviation, which was chosen due to the stochastic nature of pitting propagation.
Graphic representation of CPT results for the coatings. Results summary of the potentiostatic tests.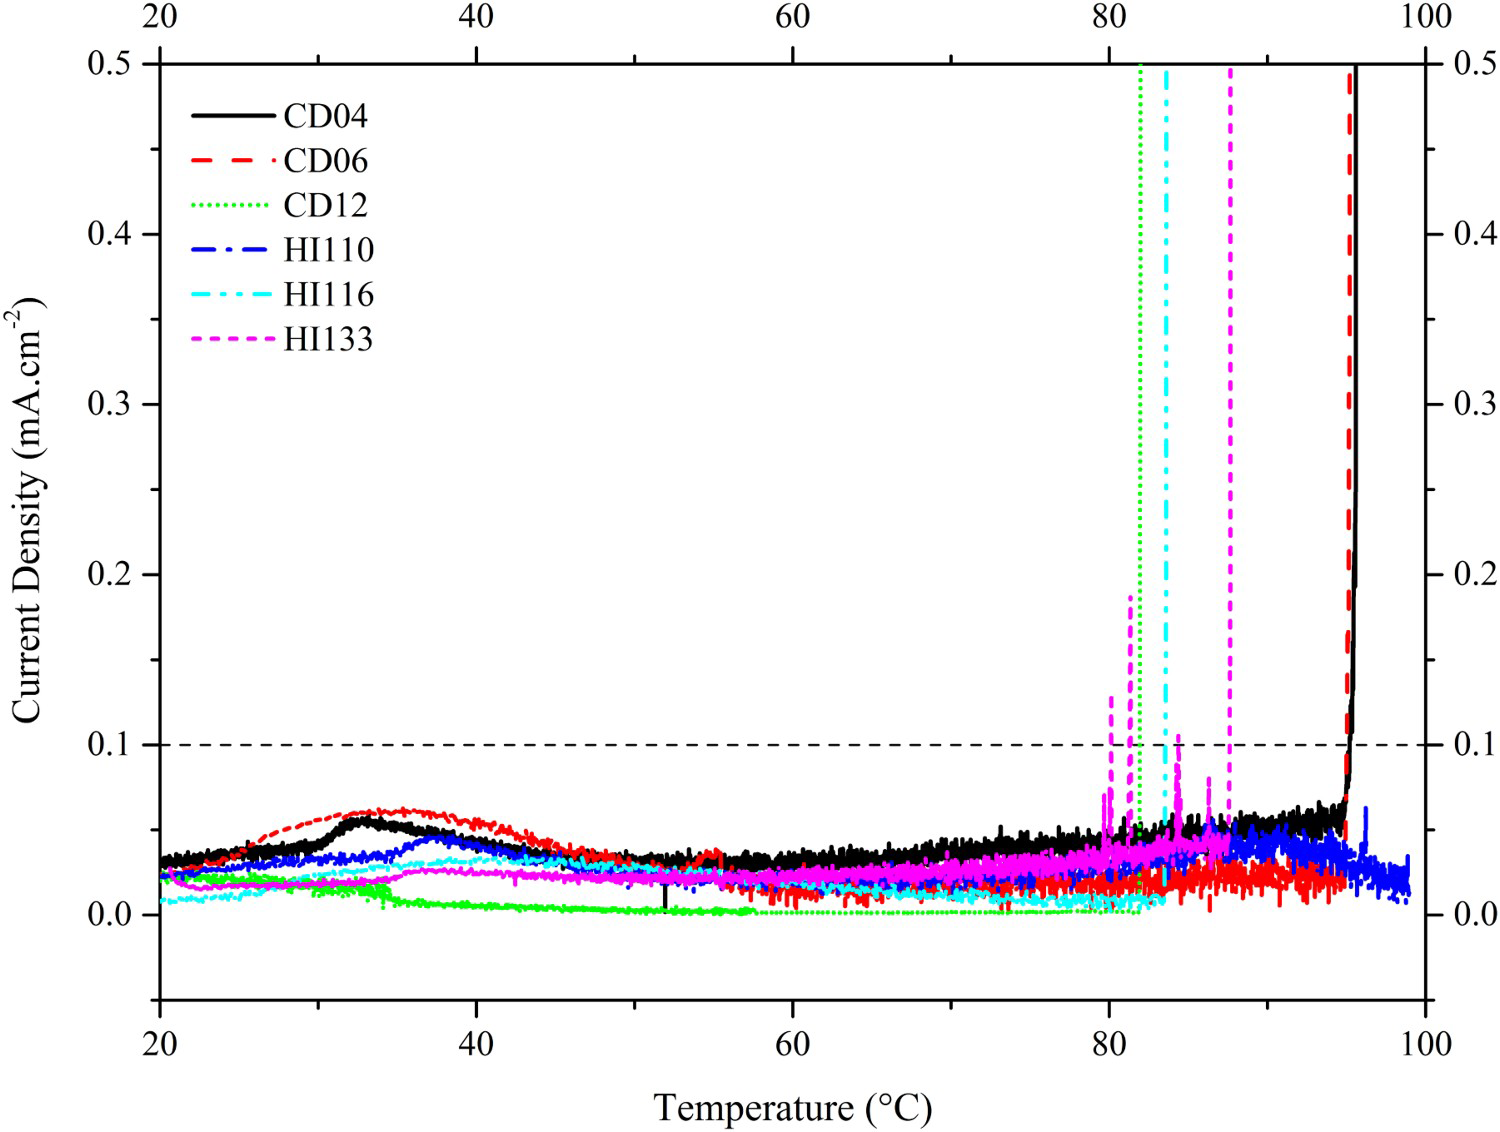
At lower heat inputs (HI110), no pitting corrosion was observed until the bath temperature limit of 98°C was reached for all tests. It can be observed that a significant variation in the CPT correlating to heat input (HI110 and HI133). Its higher value has led the coating to achieve higher temperature peaks during welding and, subsequently, reducing the cooling ratio following the weld, which would enable the formation of precipitates containing elements in their chemical compositions that improve the chloride corrosion resistance, like molybdenum and chromium, and therefore reducing the coating corrosion resistance of its surrounding area.
At lower chemical dilutions, a 2% variation decreased the CPT only 1.6°C, as can be seen in specimens CD04 and CD06, meaning that the variation in its iron content was not enough to cause great changes in its corrosion resistance. However, for higher chemical dilutions, the CPT decreased greatly to the value of 82.7°C with 12% dilution (CD12), which is significantly lower than the other values of this work. This behaviour could be caused by its lower content of nickel and chromium. It is possible to assume that the chemical dilution and its iron content, has a weaker influence than the heat input on pitting corrosion resistance when the latter is less than 6%. For higher iron contents, this effect becomes more significant.
In agreement with Chen and Szklarska-Smialowska [24] the presence of borides (found on CD04) facilitates pitting initiation and growing since these regions become active anodic points in the presence of chloride ions. Siva and Murugan [5] evaluated the effects of PTA welding parameters on pitting corrosion resistance of an AISI 316L stainless steel and concluded that the increase in current and, consequently, in heat input, reduces the pitting potential. These conclusions are very similar to that observed for samples HI110 and HI133, which represents the lower and higher heat inputs from this work. The authors also concluded that the increase in dilution reduces the alloy corrosion resistance, but have not inferred to which ratio or which minimum dilution value to observe the changes.
The highest Imax was observed for the highest chemical dilution, CD12, indicating a faster pitting propagation after its initiation, and as a result, a greater corrosion rate. Despite having similar chemical dilution and CPT, CD06 presented a higher Imax than CD04. This could have occurred due to its higher iron content, after the passivation barrier breakage and pitting initiation. A faster dissolution of the material is enabled and caused by its associated weak localised corrosion resistance. A similar relationship was observed for the heat input, where Imax increases with the referred parameter, due to its higher chemical dilution and iron content, as explained in a previous section. The sample with the lowest heat input, HI110, does not have an Imax since it has not presented a CPT.
Aiming to evaluate the pitting corrosion susceptibility, the pitting resistance equivalency number (PREN) is conventionally used in literature as an empiric index that correlates the alloy pitting corrosion resistance with its chemical composition through Equation (4), where higher PREN values represent higher pitting corrosion resistance in chlorides.

With the previous chemical composition of the coatings measured by EDS, the PREN values in Table 9 were obtained. For information, the PREN of the powder utilised as filler metal is 53.2, being the maximum possible value to be achieved by the coating in case of no dilution. According to Table 9, the global chemical analysis of the coatings satisfies the results found in this work for both families, except for sample CD06, which presented a PREN higher than HI110, which has not presented pitting. In order to find a better correlation, the sample surfaces were analysed using optical microscopy. The surfaces of samples HI110 and HI116 can be seen in Figure 16 as an example.
Surfaces of HI110 (left) and HI116 (right) samples after the potentiostatic tests by optical microscopy (100x magnification). PREN estimated by the coatings global chemical composition (EDX).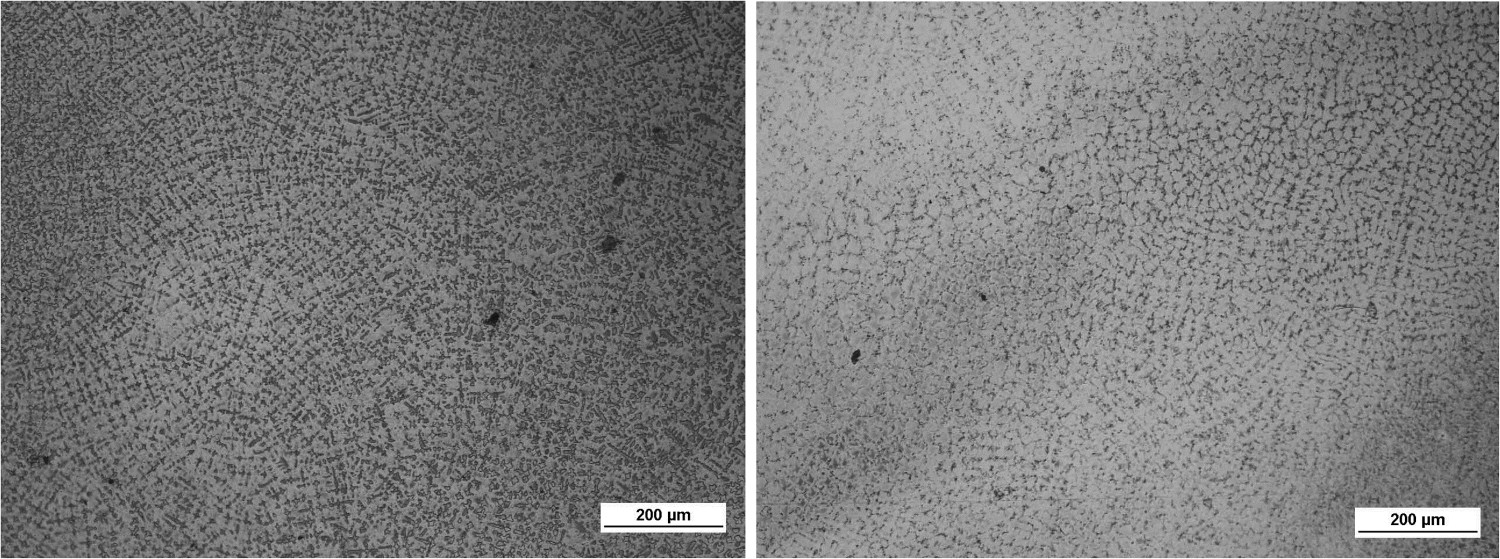
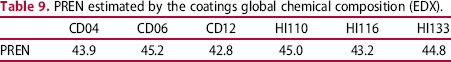
Higher values of chemical dilution (CD12 and HI116) presented a preferential attack in interdendritic regions, while its lowest values (HI110, HI133 and CD04) are in the dendritic regions. Moreover, CD06 presented attack in both zones simultaneously, dendritic and interdendritic. It is possible to use the data from Table 6 to evaluate the PREN of these regions separately, of which the conclusions are represented in Figure 17, where the sample PREN, represented by the line, corresponds to the smallest value between the two regions – where the pitting would initiate.
Modified PREN for the specific regions of the coatings.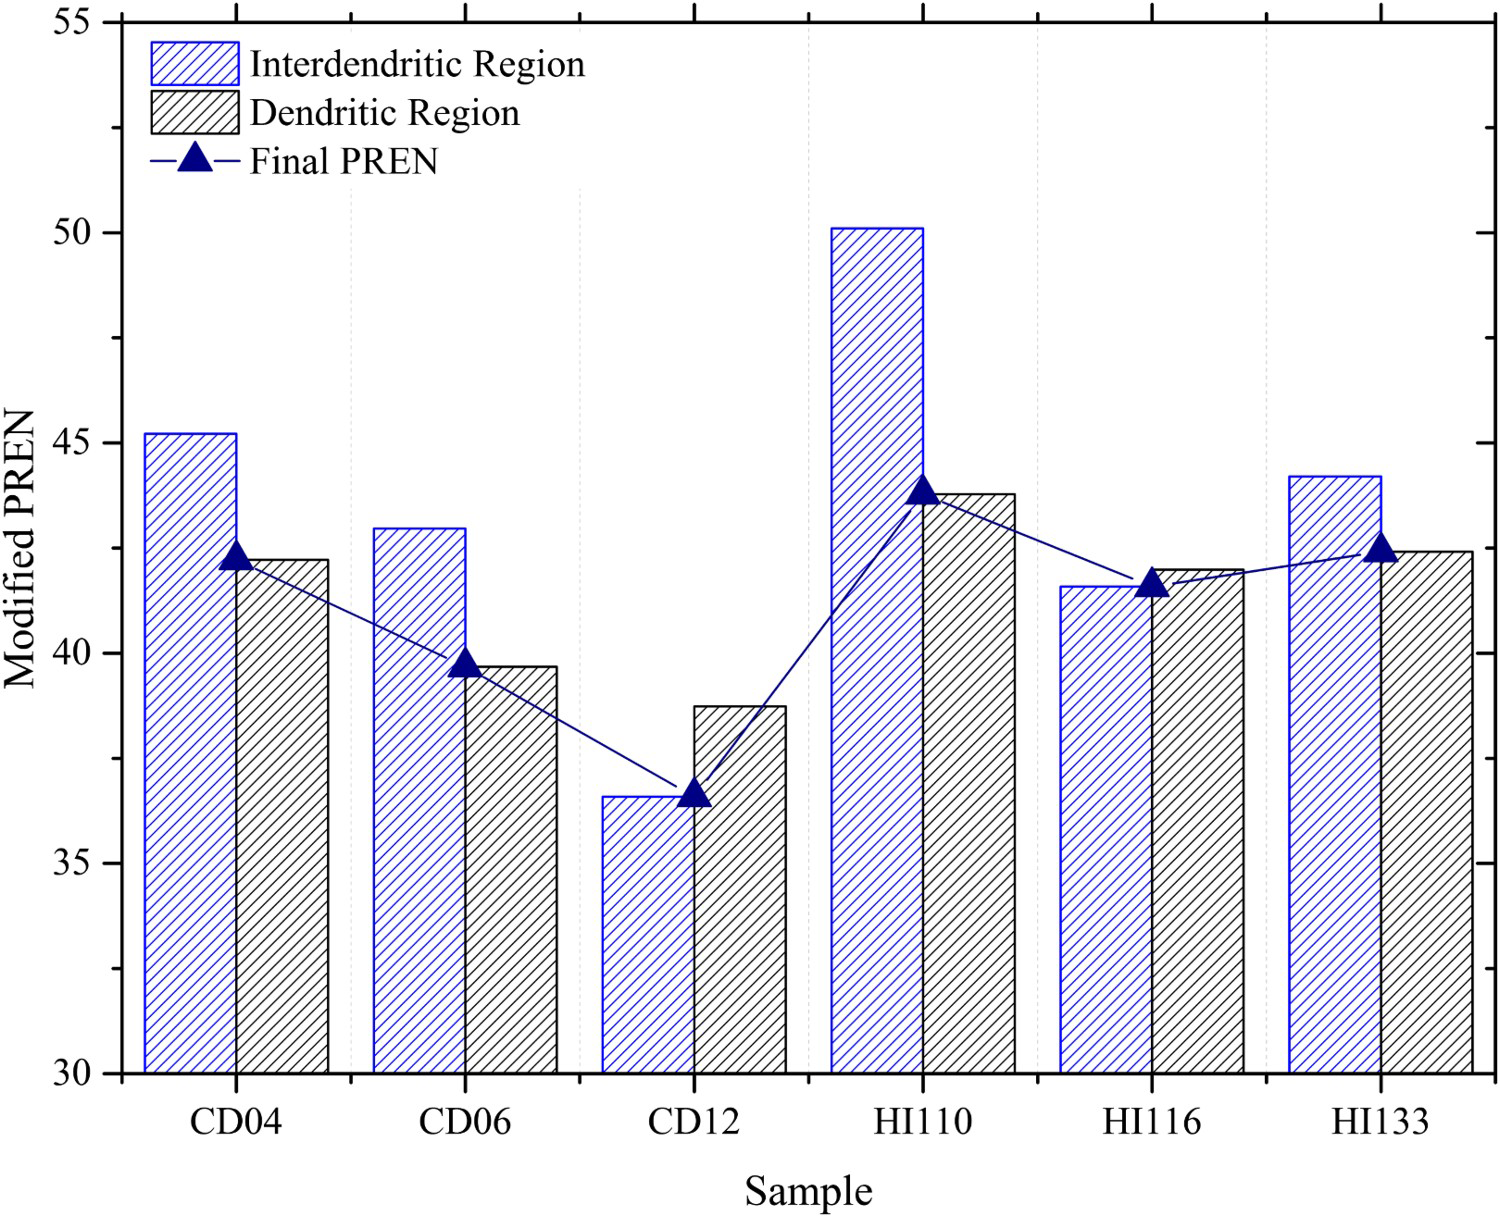
At lower chemical dilutions (HI110, HI133, CD06 and CD04), the modified PREN of the interdendritic regions were higher than for the dendritic regions, whereas higher dilutions (HI116 and CD12) presented the inverse behaviour, which corroborates with the results in the previous post-test analysis on the specimen surfaces.
Furthermore, sample CD06 presented well-distinguished regions of interdendritic and dendritic corrosion. This occurrence could be assigned to the different temperature profiles developed during the welding and the different cooling rates, allowing some regions to benefit the formation of precipitates containing elements that increase the corrosion resistance of the matrix, especially the molybdenum, as stated previously. The precipitation reduces the content of this element on the interdendritic region and favours the local pit nucleation.
The use of the PREN for each sample region showed to be more coherent with the results found in the potentiostatic tests than the PREN with the overlay global chemical composition. Higher dilution values (HI116 e CD12) presented the smaller modified PRENs, while lower heat input (HI110) presented the highest PRENs. Pessoa [6], when investigating the CPT of Inconel 625 and Hastelloy C-276 alloys through immersion tests in acidified iron chloride solutions, concluded that smaller heat input values increased the CPT due to higher iron content in the coating, corroborating with the results in this work.
Thereafter, the samples were also analysed in SEM. From Figure 18, specimen CD06 presented larger pits in a circular format, in agreement with the higher values of Imax from the potentiostatic tests, which leads to a higher corrosion intensity. The same pitting format was also found in HI116, which presented a slightly higher chemical dilution. In the revision made by Frankel [25], it was mentioned that molybdenum was not found in the protective layers of stainless steels, although was present on the surface of active sites, blocking the dissolution in these zones. This statement would explain the behaviour of HI116 and CD06 samples, as they presented molybdenum contents slightly lower than the others specimens.
Pits on the surface of samples CD06 (left) and CD12 (right) after the electrochemical tests by SEM.
For higher chemical dilution values, it is possible to observe that the pit propagation occurred preferentially at the dendritic regions with no corrosion at interdendritic regions, as can be seen in Figure 18. The coating presented pits with smaller dimensions, nevertheless, in a greater quantity, explaining its higher values of Imax. CD04 presented similar behaviour to CD12, having pits with larger dimensions in some tests and smaller dimensions in others, justifying the great variation in Imax observed in this work results. For the highest heat input, pitting was present on a single dendrite indicating a low propagation speed, where the corrosion site remained in a compact region.
Higher magnifications of the pits are shown in Figure 19. For specimen CD04 (A), the pitting formed inside a dendritic region, where it is possible to observe in the surroundings the preferential attack these regions, even though pitting was not yet formed. It is possible to observe by the pits in specimen CD06 (B), that the dendritic region was attacked due to its regular shape and the presence of precipitates in its surroundings, which are typical of interdendritic areas. For specimen HI116 (C), it can be seen that both regions were attacked, interdendritic and dendritic, which corroborates the higher values of Imax in the potentiostatic tests. The same pit format was found in CD12, which presented the lowest corrosion resistance and, as HI116, higher interdendritic susceptibility to pitting through the modified PREN presented in this work.
Higher magnifications of pits formed in specimens CD04 (A), CD06 (B) and HI116 (C) after the electrochemical tests by SEM.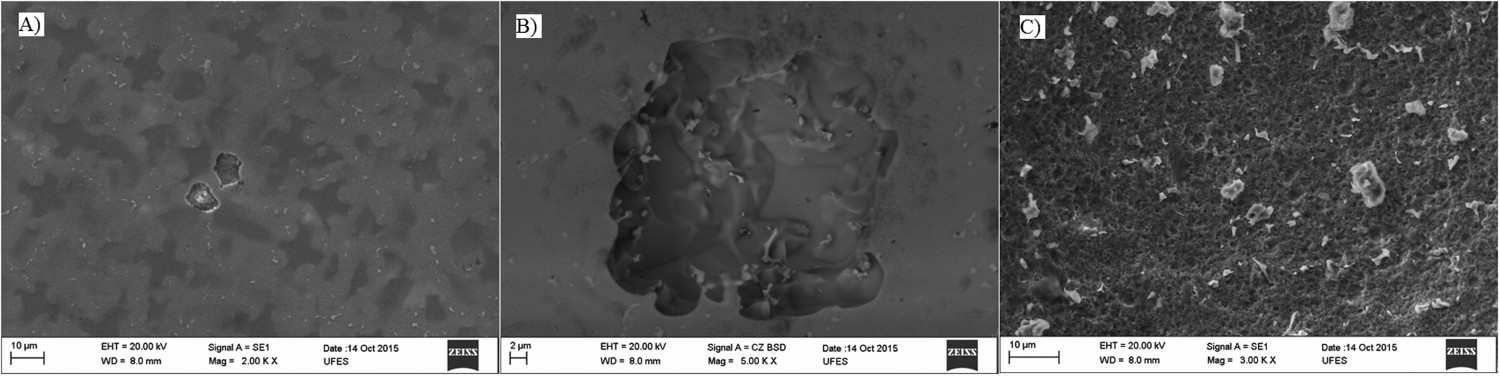
Based on the results above, it is possible to conclude that the adaptation of ASTM G150 [15] standard with the addition of 0.025 mol L−1 Na2S2O3 was effective for the evaluation of pitting corrosion resistance of Inconel 625 coatings made by a single pass with PTA-P welding, extending the results found by Ezuber et al. [16]. The sodium thiosulphate reduced the CPT for the Inconel 625, which was not possible to evaluate with a sodium chloride solution only. The increase in chemical dilution and heat inputs decreases the pitting corrosion resistance, preferably in the regions that have a smaller content of molybdenum which is caused by the segregation during the solidification process.
Conclusions
The coating microstructures are composed of a γ matrix and secondary phases in interdendritic regions, mainly, Laves and NbC. The coatings are resistant to intergranular corrosion and a positive hysteresis is observed only in the samples with higher dilution, indicating a slightly lower pitting corrosion resistance due to its greater iron content. Even the addition of sodium thiosulphate was not enough to see differences in its pitting corrosion behaviour.
During the CPT testing, it is observed that higher CPTs benefits from lower heat inputs and the increase in chemical dilution lowers the CPT significantly only if the iron content is greater than 6%. Due to its lower oxidation resistance compared to nickel, the iron also raises the pitting propagation after its initiation, accelerating the sample degradation. Pitting occurs preferentially in the regions with smaller PREN, due to its lack of molybdenum and chromium. The modified PREN developed in this work was adequate to evaluate the pitting corrosion resistance of the overlays, as it considers the separate evaluation of the interdendritic and dendritic regions.