
Abstract
Electrochemical properties and microstructure examinations have been performed on three Friction Stir Welded (FSW) shipbuilding steels (DH36, S690QL, 80HLES). Galvanic coupling has been assessed using Scanning ElectroChemical Microscopy (SECM) and an electrochemical mini-cell in order to subsequently identify possible FSW-related damages of these steels. The galvanic macro-coupling between the base material and the welded zone is measured by the SECM tip. The 80HLES steel has greater differences in surface hardness and electrochemical reactivity which lead to a galvanic coupling inducing an initiation to corrosion.
Introduction
Corrosion of structure is one of the main interests in shipbuilding. Weldings are well-known to be one of the weakest parts in terms of corrosion initiation due to a microstructural modification of steel and to a loss of the corrosion resistance. Friction Stir Welding (FSW) is a solid state welding process in which the rotary motion of a cylindrical tool along the welding line is the prime factor for the weld formation.
Since its creation in the 1990s by TWI (The Welding Institute), a comparative study of published research work on FSW of different materials demonstrates that most of the research work focus on aluminium (76%) [1]. Therefore, the corrosion phenomena have been mainly investigated on aluminium alloys [2 -10], a large part of the literature being published in the last five years. Only 15% of the publications deal with steels and those related to corrosion are unusual: works on stainless steels [11], duplex stainless steels [12], low carbon steels [13] and high strength low alloy steels [14] can be cited as examples. Indeed, the FSW technique was developed for low melting point alloys such as aluminium alloys. Owing to the low melting point of aluminium and its alloys, the temperatures which are necessary to soften the metal during the FSW process are relatively low and do not necessitate elevated load. Nowadays, the real challenge is to extend this process to metallic alloys with higher melting point (above 1000°C) such as steels, titanium, or nickel alloys and to study the associated corrosion processes. If we have a look on corrosion studies, we can see that the corrosion of friction – stir processed cast NiAl bronze was tested by using the static immersion corrosion method [15]. The corrosion of the friction stir welded magnesium alloy AM50 has been investigated by virtue of neutral salt spray tests and potentiodynamic polarisation measurements in conventional cells and in a mini cell [16].
Amongst the cited results on aluminium alloys, it has been observed that localised corrosion (mainly pitting in salt environment) is significantly minimised within the weld in comparison to the base metal and heat affected regions on both 5XXX [4] and 7XXX [9] alloys. On 6XXX alloys, it has been demonstrated a greater corrosion resistance of the welded metal than the base alloy using electrochemical polarisation curves in 3.5% NaCl solution [5]. In addition, electrochemical impedance spectroscopy (EIS) measurements on 7xxx alloy showed a decrease of the polarisation resistance in the base metal [2]. All these results could be correlated to gradients in metallurgy as the precipitation state [6,9], crystallographic texture and grain boundary structure [9]. It has been shown that the corrosion behaviour of welds strongly depends on the size of the intermetallic phases in the stir zone and the presence of the copper-rich phases (in AA6005-T6) [17].
The FSW techniques applied to low carbon steel have shown that the stir zone has the highest resistance to hydrogen damage [18]. The relationship between the nobility of phases and the corrosion of the friction-stir Ni-Al has been examined by using the Kelvin probe [19]. The anodic and cathodic reactivity in a dissimilar friction stir welded joint stainless steel orthopaedic implant (AISI 304 and 316L) was investigated by the microelectrodes [20]. The study showed that the HAZ was the most critical zone for pitting corrosion. Intergranular corrosion of welded joints of austenitic stainless steels was studied by using an electrochemical minicell [21]. The relationship between microstructure, microhardness and corrosion sensitivity of an AA 2024-T3 friction stir welded joint has been studied by using local electrochemical open circuit potential measurements [22]: HAZ (Heat Affected Zone) close to the TMAZ (Thermo-Mechanically Affected Zone) was determined as the most sensitive zone to intergranular corrosion.
Concerning shipbuilding steels, studies are limited and focused on a current grade; examinations of FSW of HSLA-65 steel (considered by the U.S. Navy for ship structural applications, YS0.2% = 450 MPa and UTS = 540 MPa) revealed no difference in corrosion rates between the weld and the surrounding zones (HAZ and BM) when submitted to a salt spray test according to ASTM B117 [14].
These works highlight that the enhanced corrosion behaviour is due to the changes of microstructure and probably to the galvanic coupling between the different zones formed during the FSW process. That is the reason why the electrochemical activity of stir welded alloys should be characterised using a local electrochemical technique. In the following section, we used two local electrochemical techniques: Scanning ElectroChemical Microscopy (SECM) and mini-cell technique on three FSW high yield strength (HYS) steel samples (DH36, S690QL and 80HLES). These materials are used for marine applications. The mini-cell technique provides the corrosion potential and Tafel plots of different zones on the steel sample while SECM measures the electrochemical relativities which could be used to correlate the microstructural characteristics. The purpose of this study is to evaluate the possible galvanic coupling between the different zones and to correlate the electrochemical activity with the metallurgical properties after welding.
Materials and methods
Sample and process properties
Three grades of steel (two HYS steels and one construction steel) used for current French naval applications have been assessed. The details about the three materials and the welding process are presented in the reference [23] but are briefly recalled. The butt welding tests (with full penetration) have been performed with a Gantry machine on 1500 × 150 × 8 mm plates on the three grades, joined together in the lengthwise (rolling direction). Friction stir-tool in PCBN (PolyCrystalline Boron Nitrides, developed and patented by MegaStir) based material comprises a threaded shoulder (25 mm in diameter) prolonged by an 8 mm long threaded conical pin. Process parameters were optimised such as the rotation speed of the tool but have to be considered for this paper as confidential for industrial reasons. Moreover, temperature of the rotating tool was measured during the second campaign and showed that the maximum temperature which is reached is lower than 700°C. As the other welding parameters have been developed especially for the French naval applications, they are confidential.
Chemical composition for DH36, S690QL and 80HLES steels.
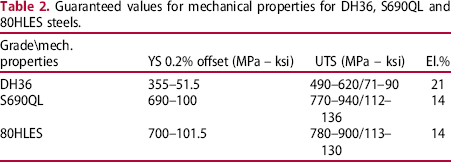
Guaranteed values for mechanical properties for DH36, S690QL and 80HLES steels.
The microstructure of the bare material and the nugget parts of DH36, S690QL and 80HLES. Visual examinations
Visual examinations were performed on cross sections of the welded steels identified by white patches in Figure 1(a) for the three samples. Samples were mechanically polished until a 3 µm diamond paste. Samples were then etched with a 2% Nital solution or a Béchet-Beaujard solution (for grain size determination mainly). The average grain size is determined by the comparison method according to the NF EN ISO 643 [24] and ASTM E112 [25].
Macrograph of the friction stirred welds (advancing side on left side). BM: Base Metal, TMAZ: Thermo-mechanical Affected Zone, HAZ: Heat-Affected Zone, NZ: Nugget Zone.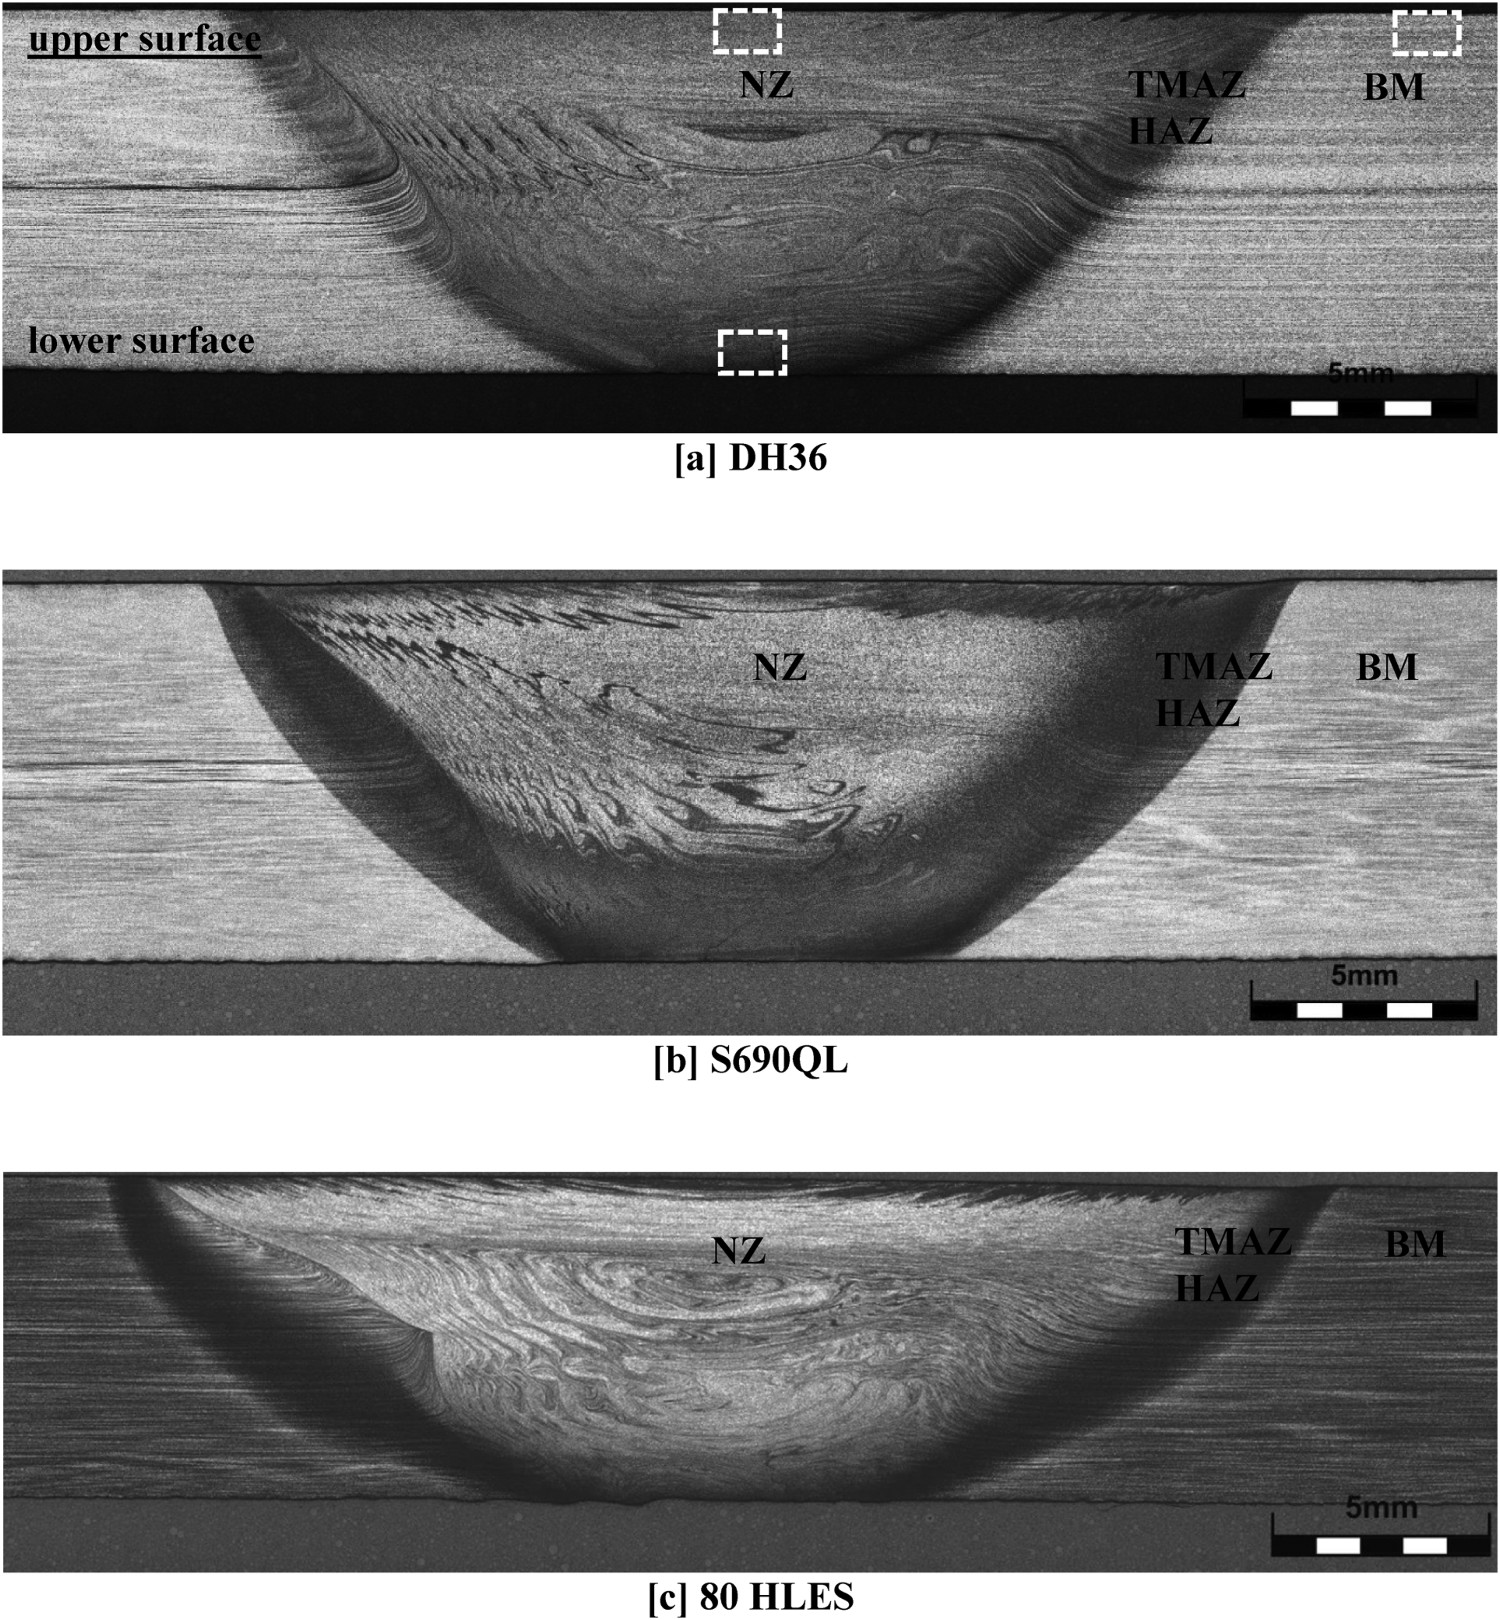
Hardness tests
Vickers hardness measurements (HV5) were carried out according to NF EN ISO 9015-1 [26] and associated standards cited by this standard. Hardness profiles were performed on cross sections at the upper and the lower surfaces, where electrochemical measurements were done. Two profiles are performed on two different samples of each steel welds to assess the reproducibility and the homogeneity of the weld.
SECM experiments
The original steel samples have 5 × 5 cm2 dimension. The samples were cut into a smaller dimension 1 × 5 cm2 and then were mechanically polished until a 4000 SiC grade. On the base of Figure 2, the dimension of each zones are estimated to be located from −1.0 to 1.0 cm for the Nugget Zone (NZ), near the bounder of the NZ around 1.0 and 1.2 position for the TMAZ, from 1.2 to 2.0 cm for the HAZ, beyond 2.0 cm for the BM.
(a) Schematic representation of the original sample of 5 × 5 cm2 which is cut into a smaller dimension of 1 × 5 cm2 and (b) the sample with the dot positions where the approach curves (SECM) are recorded.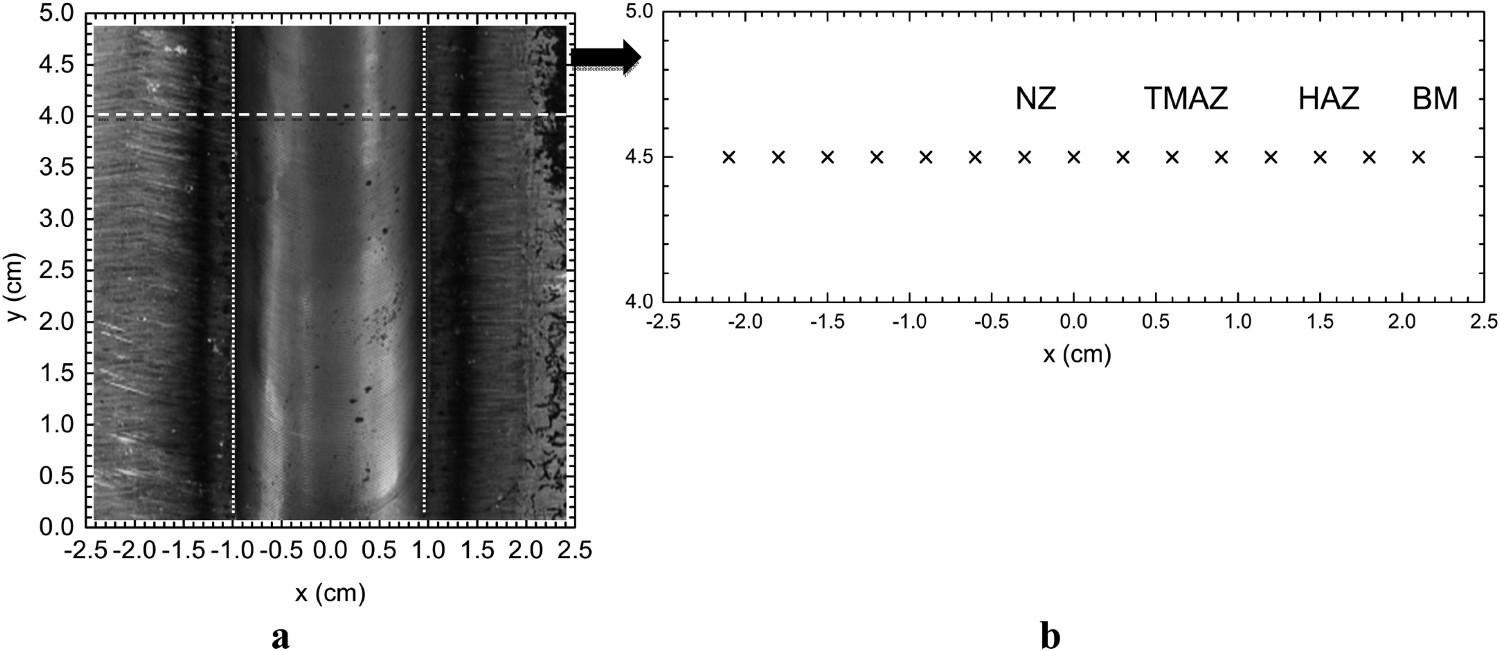
The scanned sample is 1 × 5 cm² and the approach curves are recorded along the interface of the NZ at the dot positions as depicted by Figure 2(b). The counter electrode is a platinum grid and the reference electrode is a saturated silver chloride Ag/AgCl/Sat.KCl electrode.
The SECM Biologic M470 is used to map the electrochemical activities over different zones of the FSW steel samples. A 10 µm platinum microelectrode was used as a local sensor that was brought in the vicinity of the sample surface to probe the surface reactivity as shown in Figure 3(a). A redox species is added in the solution. When the tip is positioned very close to the sample, a ‘positive feedback’ behaviour occurs. The tip consumes the reductant to generate the oxidant while the substrate captures these oxidant species and regenerates the reductant into the solution. Hence, by measuring the tip current, the local electrochemical reactivity of different zones on the substrate can be mapped.
(a) SECM setup to perform reactivity mapping at different positions along the x-axis of the FSW steel samples. The current of the microelectrode depends on the distance tip-substrate (z-axis) and the local reactivity of the sample (three different zones BM, NZ, BM). The positive feedback behaviour is observed; (b) cyclic voltammetry of the 10 µm tip when the tip is placed far away from the steel surface. The limiting current at 0.6 V/AgCl is 23.5 nA.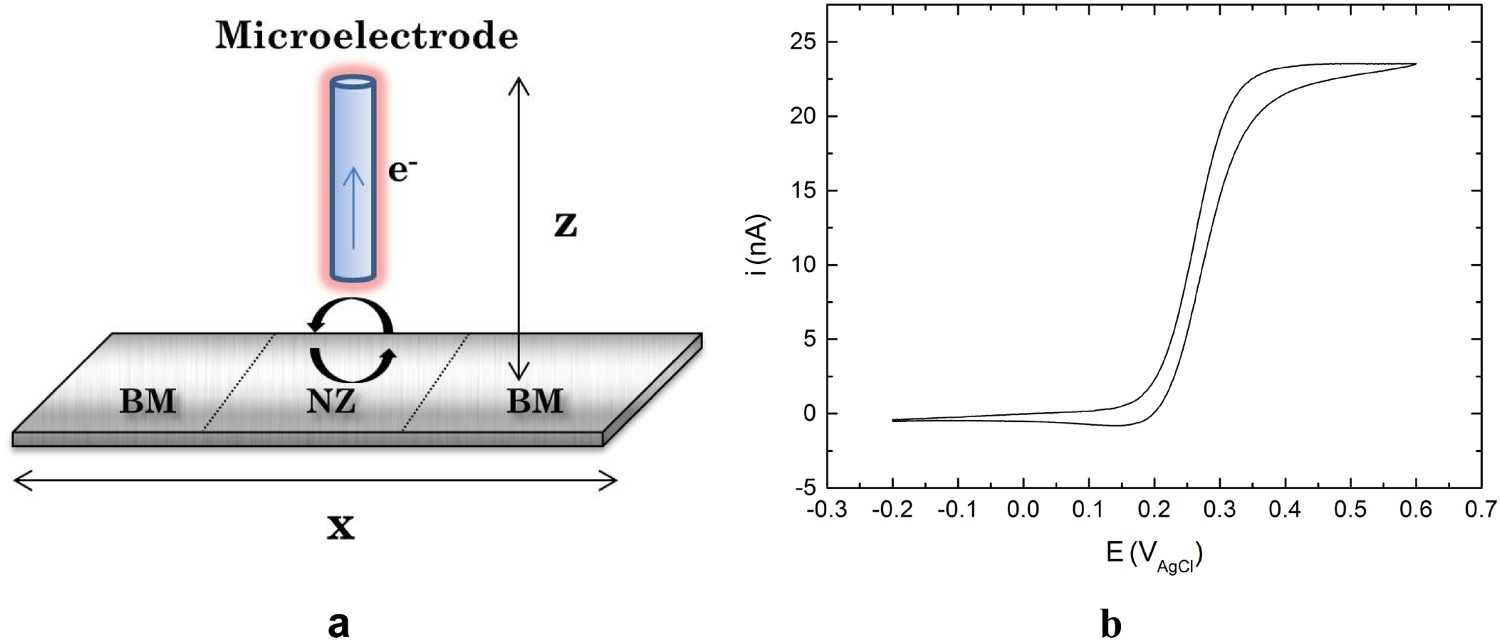
The microelectrode was placed above the sample about 200 µm in the z-direction and the approach curves were performed at several positions along the sample. The cartography mapping of the electrochemical activities with a microscopic scale by a horizontal scanning pattern of the surface can also be done. The FSW steel samples were immersed in a solution containing 10 mM ferrocyanide ion  (K4Fe(CN)6 from Sigma-Aldrich) as a redox couple and 0.1 M sulphate sodium (Na2SO4 from Sigma-Aldrich) in deionised water (ρ = 18.2 MΩ cm).
Mini-cell polarisation experiments
During the FSW process, the microstructures and the composition of the steel sampled have been modified. The NZ suffers a strong plastic deformation and complex mixing across the joint. The BM is less affected by the rotational tool. This variation in microstructures can lead to the possible galvanic coupling between different zones. In order to measure the corrosion potential of each zone, electrochemical polarisation curves were recorded using a mini-cell (3 mm diameter). A small surface of the steel sample is then exposed to the electrolyte solution, using a silicon joint between the mini-cell and the sample to ensure a waterproof contact. The electrolyte solution is NaCl 0.01M at room temperature (20 ± 3°C). The polarisation curves are obtained at several positions using the three electrodes classical electrochemical setup (Figure 4). The working electrode is connected to the steel sample, a Saturated Calomel Electrode (SCE) is used as a reference and a platinum grid is used as the counter electrode.
Electrochemical mini-cell setup to perform the polarisation curves at different positions along the x-axis of the FSW steel samples. The working electrode is the small surface of the steel sample exposed to the electrolyte solution (NaCl). Reference electrode is a SCE. Counter electrode is a platinum grid.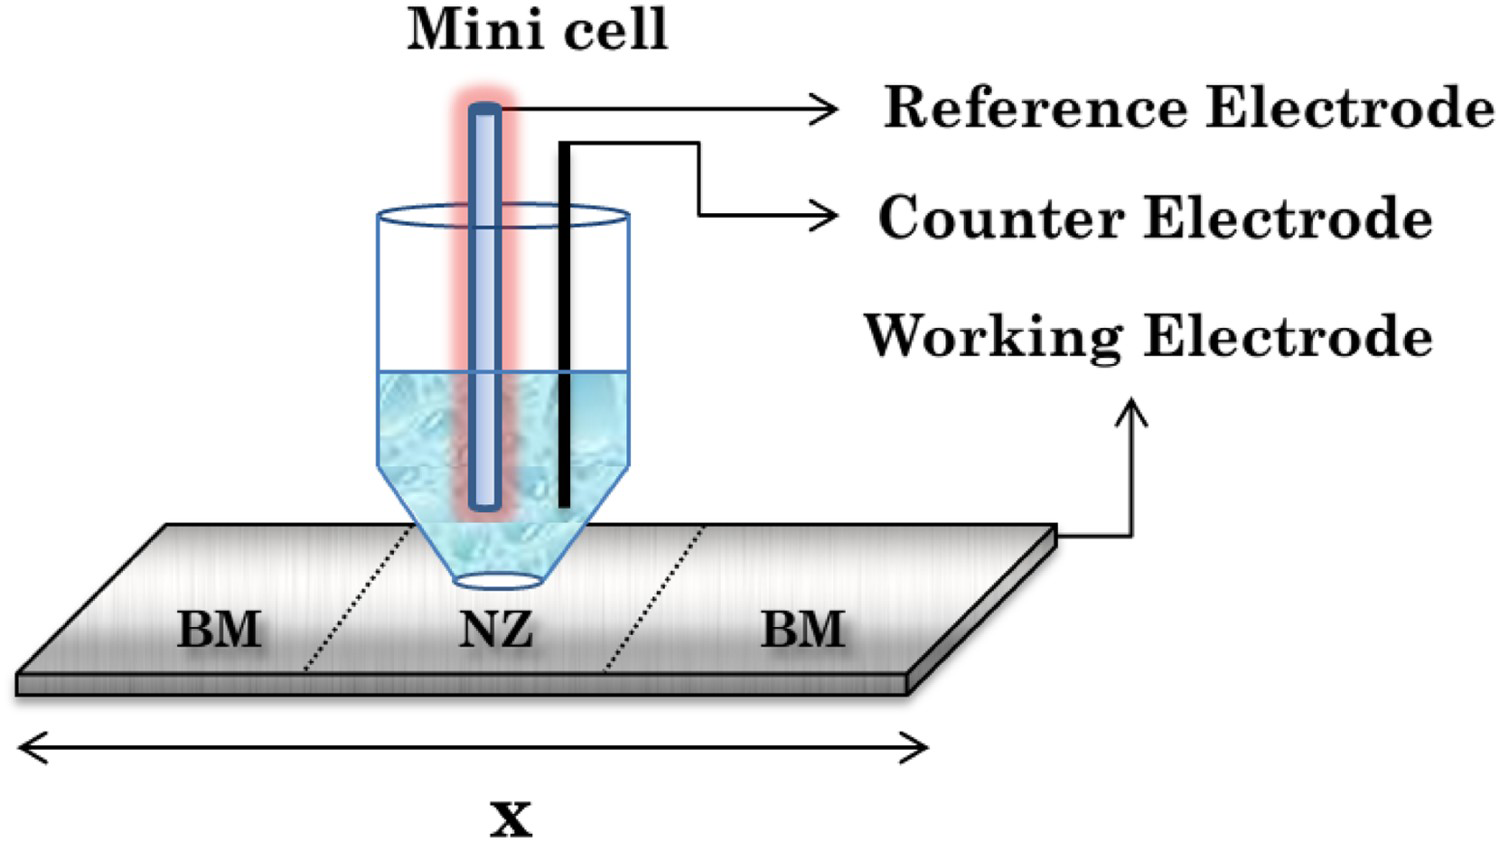
Results
Visual examinations
Macroscopic cross section examinations are depicted in Figure 1. These observations on the three welded steels conclude to a defect-free nugget as no internal or geometric defects were noted in the observed areas. NZ, TMAZ/HAZ and BM can be distinguished although it is difficult to clearly separate the locations of the TMAZ and HAZ as they overlapped. The upper/lower surface weld width are, respectively, 23/6, 25/9 and 27/10 mm for DH36, S690QL and 80HLES. It is also demonstrated that the lower surface of the weld is more disturbed than the upper surface most probably owing to the competition between the metal viscosity and thermal gradients within the weld. The thermomechanical processes have real consequences on the microstructure as shown in Figure 5. DH36 presents a pearlite-ferrite microstructure in the BM, a ferritic microstructure with carbides in the upper weld and a recrystallised pearlite-ferrite microstructure in the lower weld. S690QL presents a bainito-martensitic microstructure in the BM and in the upper weld and a recrystallised pearlite-ferrite microstructure in the lower weld. 80HLES has a bainito-martensitic microstructure whereas the weld is entirely composed of martensite with several bainitic areas. The grain size of the base metal is about 9-10 according to the NF EN ISO 643 standard [24]. Generally, a grain refinement is obtained in the weld for DH36 and S690QL (grain size = 13) which is not visible for the 80HLES. Indeed, it appears that there is a coarser grain in the upper weld (grain size = 8) and a finer grain in the lower weld (grain size = 11). These observations confirm that the welding parameters and thermal conditions have an effect on the microstructure and the dynamic recrystallisation process and can affect the hardness properties as detailed subsequently.
The microstructure of the base material and the nugget parts of DH36, S690QL and 80HLES (G = grain size, ND = not determined).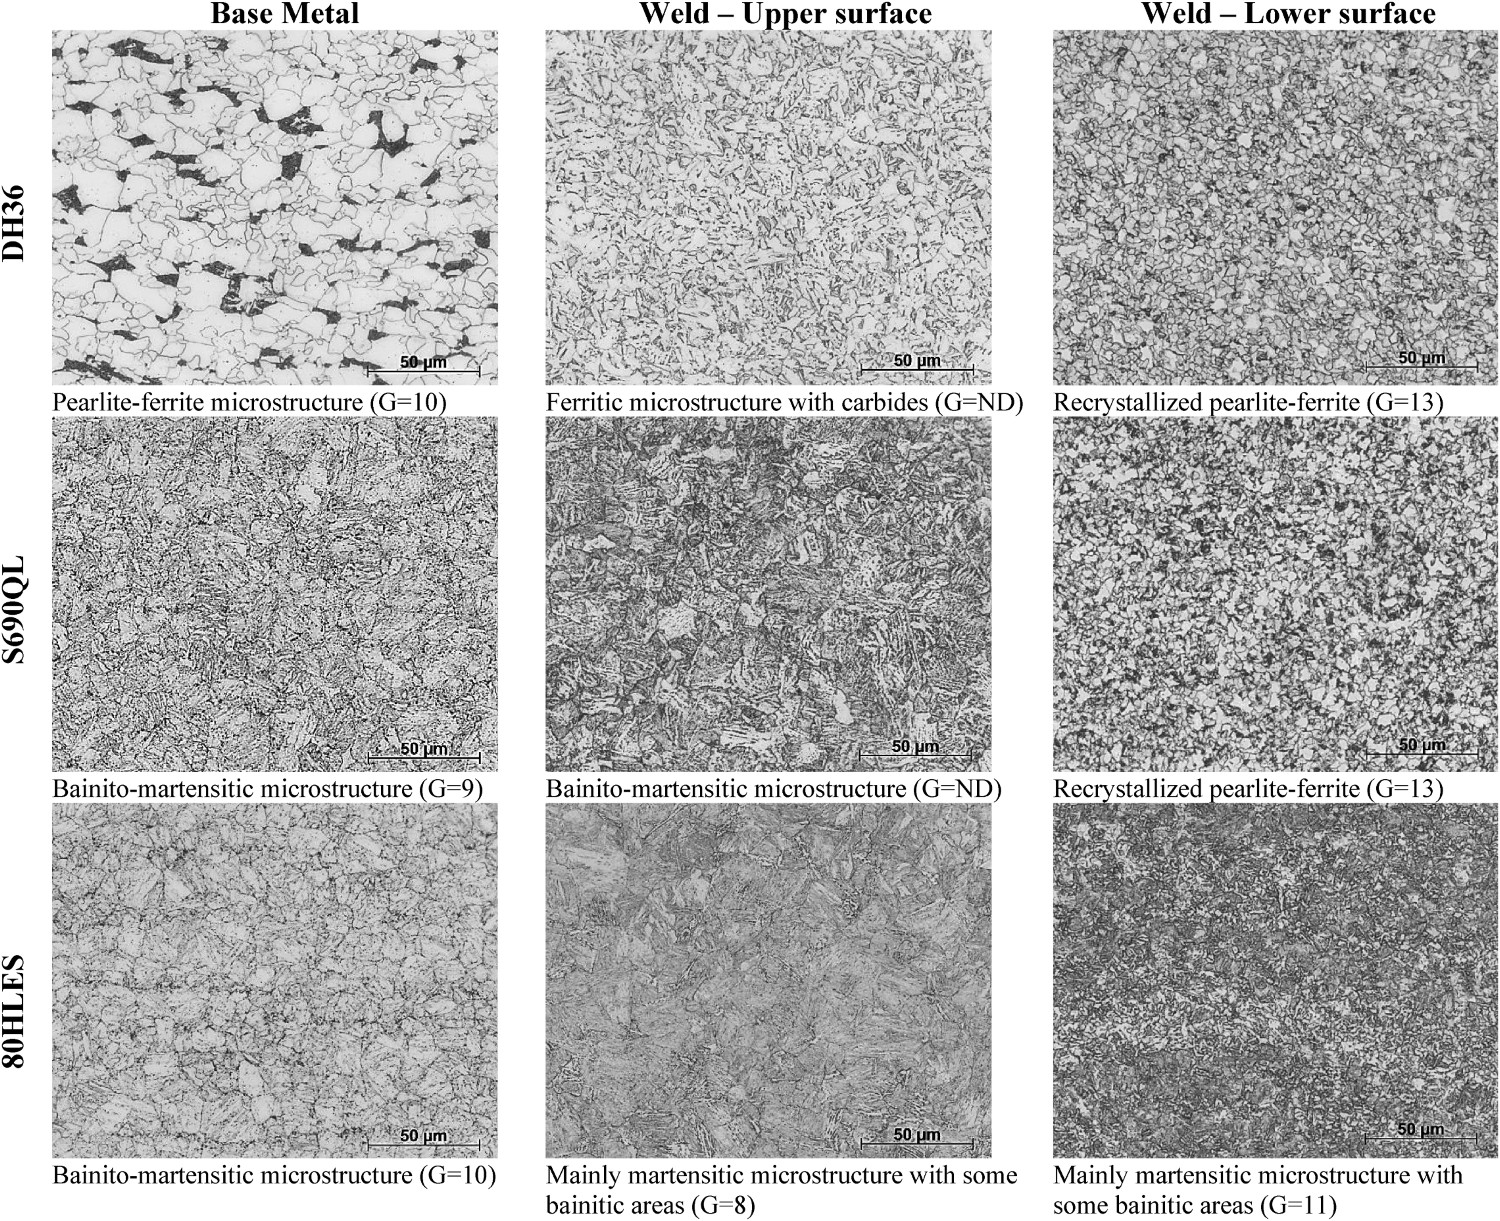
Hardness measurements
Hardness measurement profiles are presented in Figure 6 and highlight that the hardness in the upper surface is quite reproducible across a weld whatever the alloy. However, in the lower surface, the profiles do not overlapped excepted for the 80HLES. This is probably due to microstructural heterogeneities. The NZ and BM zones are depicted according to the measurements on micrographs (§ 3.1).
HV5 Hardness profiles and reproducibility in friction stirred welds for DH36, S690QL and 80HLES steels (DH36 and S690QL are at the same scale).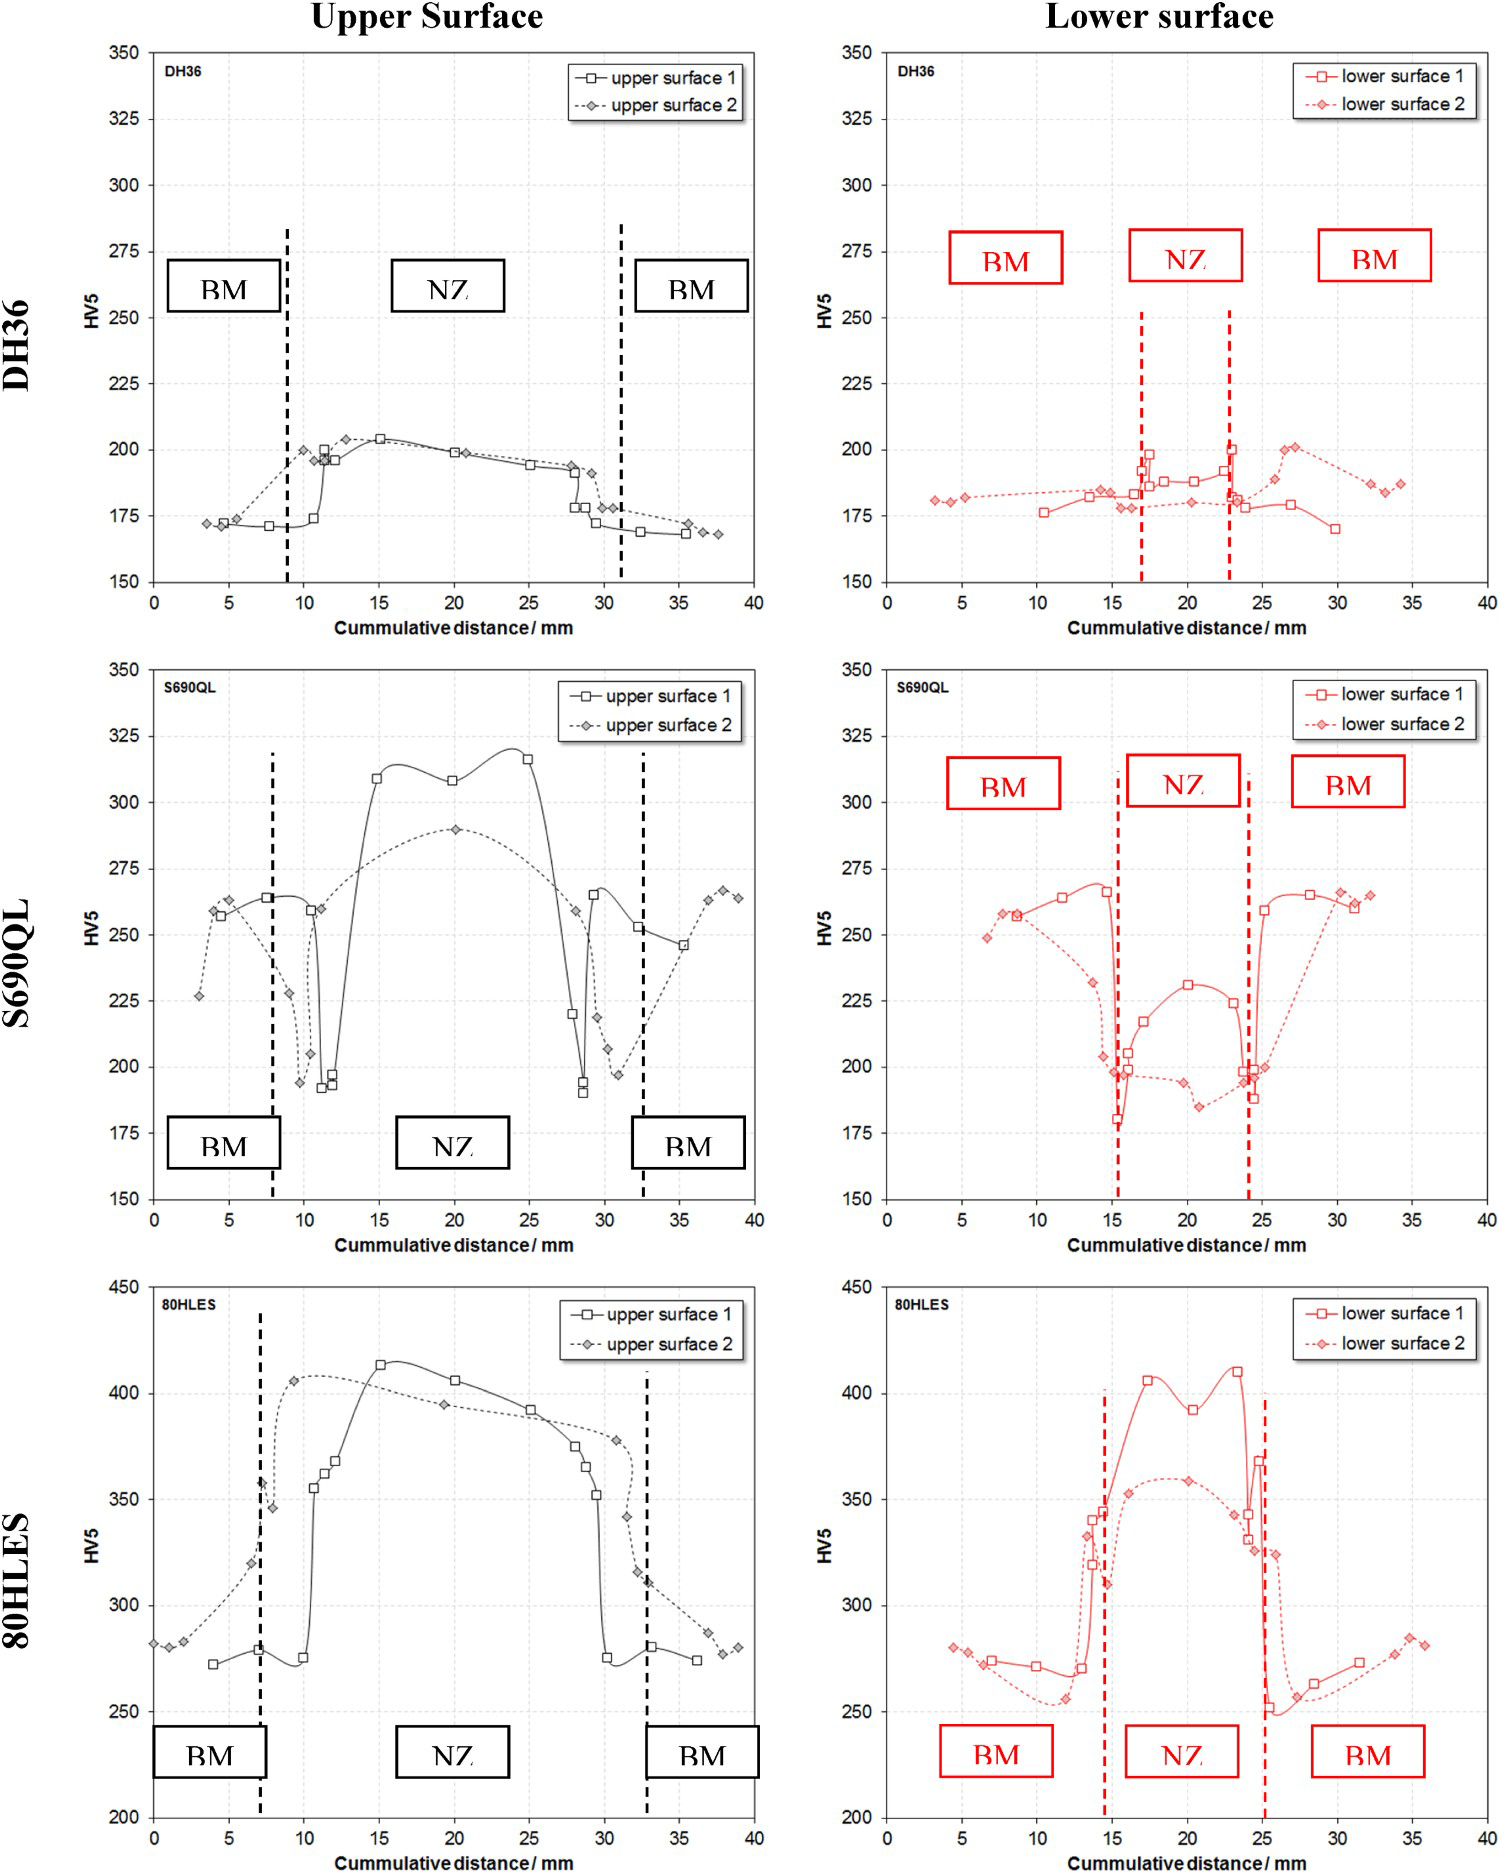
The upper surface of the welded zone is harder than base metal for the three samples (DH36, S690QL, and 80HLES). These hardening process is obtained in the NZ and HAZ/TMAZ related to the thermomechanical conditions imposed during FSW, even more pronounced when the steel is susceptible to quenching (as for 80HLES). Indeed, the microstructure modifications and, to a lesser extent, the grain size have a clear influence on hardness properties. The hardness values seem to be in accordance with the microstructural observations (Figure 5) where: pearlite – ferrite (175-200 HV) < bainite (250-275 HV) < bainite-martensite (∼300 HV) < martensite (350-400 HV). DH36 appears to be less affected than the two other steels as the NZ hardness is not different of the BM hardness (175-200 HV5). For S690QL, the hardness is slightly higher in the nugget core due to the presence of martensite within the bainitic microstructure. Compared to DH36 and 80HLES, a drop of hardness is observed in the TMAZ/HAZ. This decreasing of hardness compared to BM has been attributed to over-aging [27]. 80HLES has the higher increase of hardness (400 HV5) because it is susceptible to quenching and has a martensitic microstructure with some traces of bainite.
The properties of the lower weld are different since DH36 do not show hardness differences with the BM and S690QL has a drop of hardness in the weld. The latter has a recrystallised pearlite-ferrite microstructure in the welded zone (Figure 5) leading to a hardness value about 200 HV5. Once again, we observed a pure martensitic microstructure for 80HLES leading to hardness above 350 HV5. Nevertheless, these measurements give fairly scattered hardness values in the NZ, especially for S690QL and 80HLES. This is undoubtedly due to the presence of a complex and heterogeneous microstructure on the lower surface of the weld.
Mini-cell tests
The mini-cell technique is used only to prove the evidence of the galvanic coupling on the FSW steel. Figure 7 shows the polarisation curves when positioning the mini-cell on 2 areas (BM and NZ) of the 80HLES sample only (we will see in the following section that this alloy is the most reactive). Firstly, it can be seen that the polarisation curves are reproducible which allows the comparison between both tested zones. Secondly, the corrosion potential (Ecorr) of the BM is −0.64 V/SCE while the NZ has a more positive Ecorr around −0.61 V/SCE. A reproducible potential difference of 30 mV between the base material and the welded zone is then recorded. Even though the potential difference is small, a galvanic coupling could occur at the expense of the base metal as the weld zone presents the less cathodic potential than the base metal zone. This finding has already been reported in the literature for aluminium alloys and steels as described in the introduction. Jariyaboon et al. [28] used the capillary microcell technique along the FSW 2024-T3/ 2024-T3 in a 0.1 M NaCl medium and made polarisation curves. They showed that the most negative zone is the most sensitive to intergranular corrosion. Bousquet et al. [22] measured the potential for free corrosion on different areas of the weld and analysed the amplitude of the fluctuations during the stabilisation of the average potential, along the joint of the weld 2024-T3/2024-T3. They related potential fluctuations to unstable pitting on large intermetallic. Consequently, this possible galvanic coupling can be related to the differences of microstructures, grain sizes and the correlated hardness values.
Polarisation curves obtained when positioning the micro-cell on two zones of 80HLES sample: Base Metal (dotted line) and Nugget zone (solid line).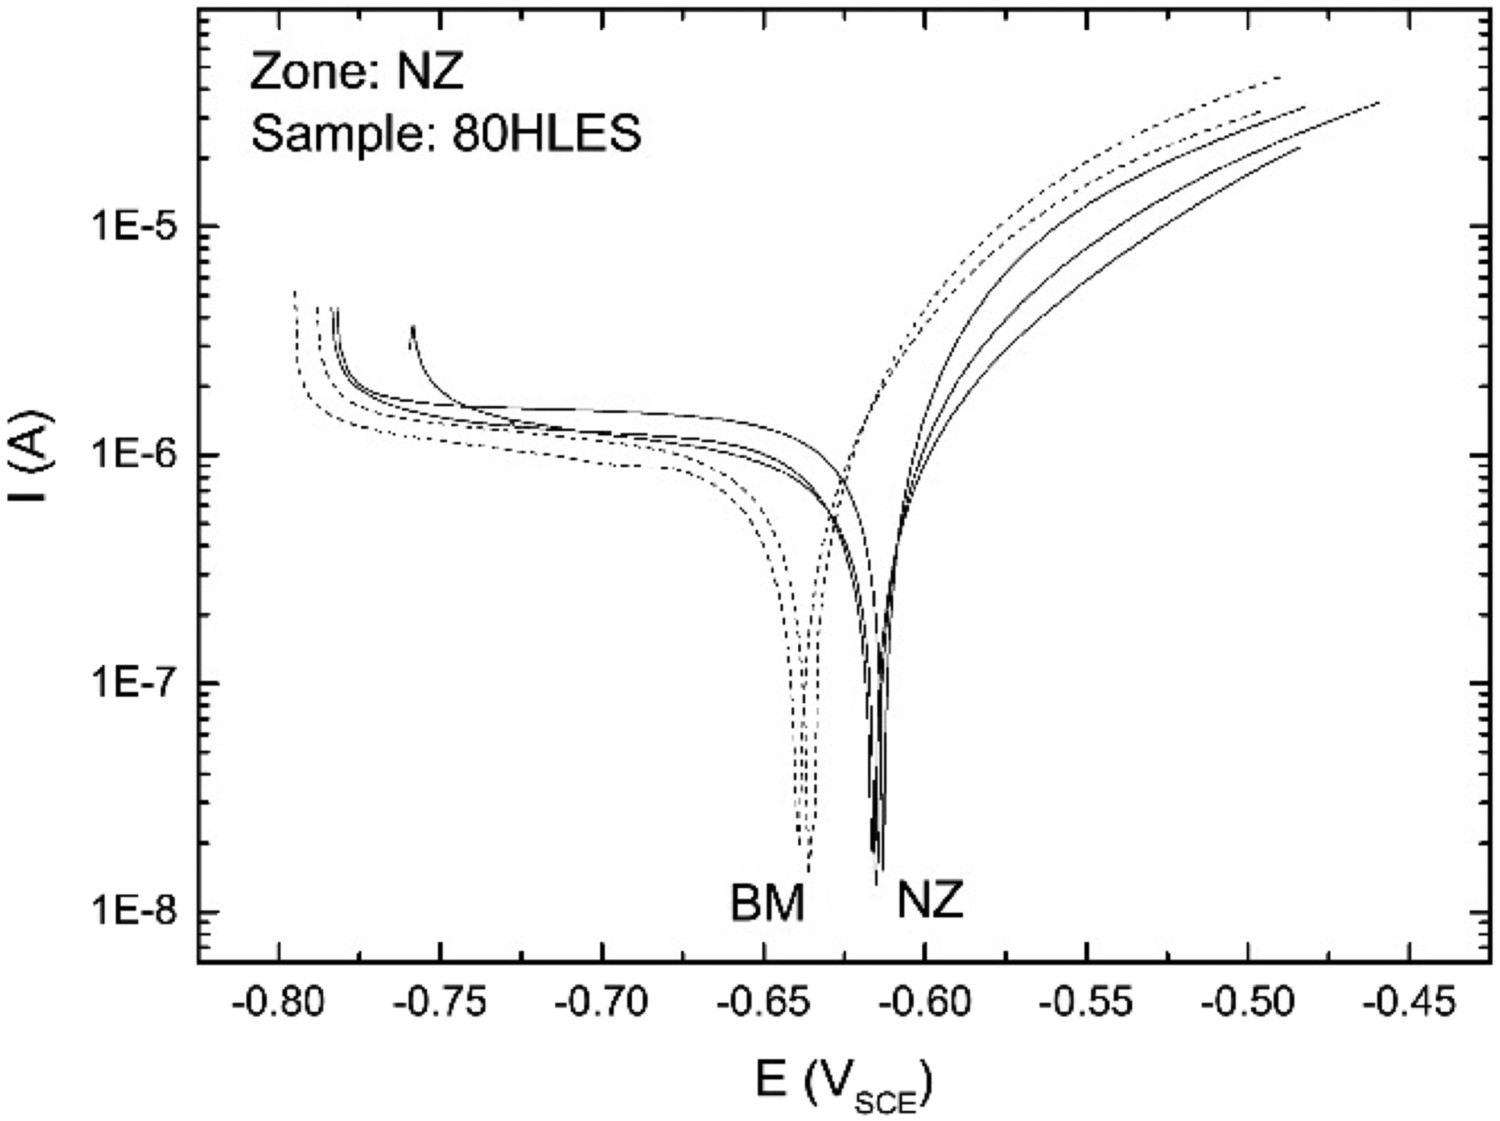
Nevertheless, due to its resolution limits (the dimension of the mini-cell is not small enough), we cannot get the exact potential profile to compare with the hardness profile. Therefore, the SECM test can appear better to highlight the electrochemical behavior of the different zones.
SECM tests
Figure 3(b) shows the cyclic voltammogram obtained on the platinum probe between −0.2 and 0.6 V/Ag/AgCl/Sat.KCl at 50 mV s−1. It exhibits the presence of  only. A stabilisation of the oxidation current is obtained above 0.5 V/Ag/AgCl/Sat.KCl. To be sure to produce
  on the microelectrode according to Equation (1), the probe is polarised at 0.6 V/Ag/AgCl/Sat.KCl in each experiments corresponding to the limiting current (23.5 nA).
 species are used to analyse the local reactivity of the welded surface. Indeed, the existence of a galvanic coupling generates an electrochemical cell imposing a potential for reducing
  on the sample surface according to Equation (2):
 is locally evaluated by the approach curves where the current is measured when the probe is getting closer to the substrate.
The experimental approach curves for 80HLES are presented in Figure 8. The current is normalised with respect to the current measured when the probe is far enough from the sample. The approach curves are performed at several positions of the samples. As the welding is symmetric, position 0 means the centre of the NZ, position +22 mm is in the BM on the right, and the position −22 mm is in the BM on the left.
Normalised approach curves along the interface of the nugget of 80HLES sample. The position is from −22 mm (left) to +22 mm (right).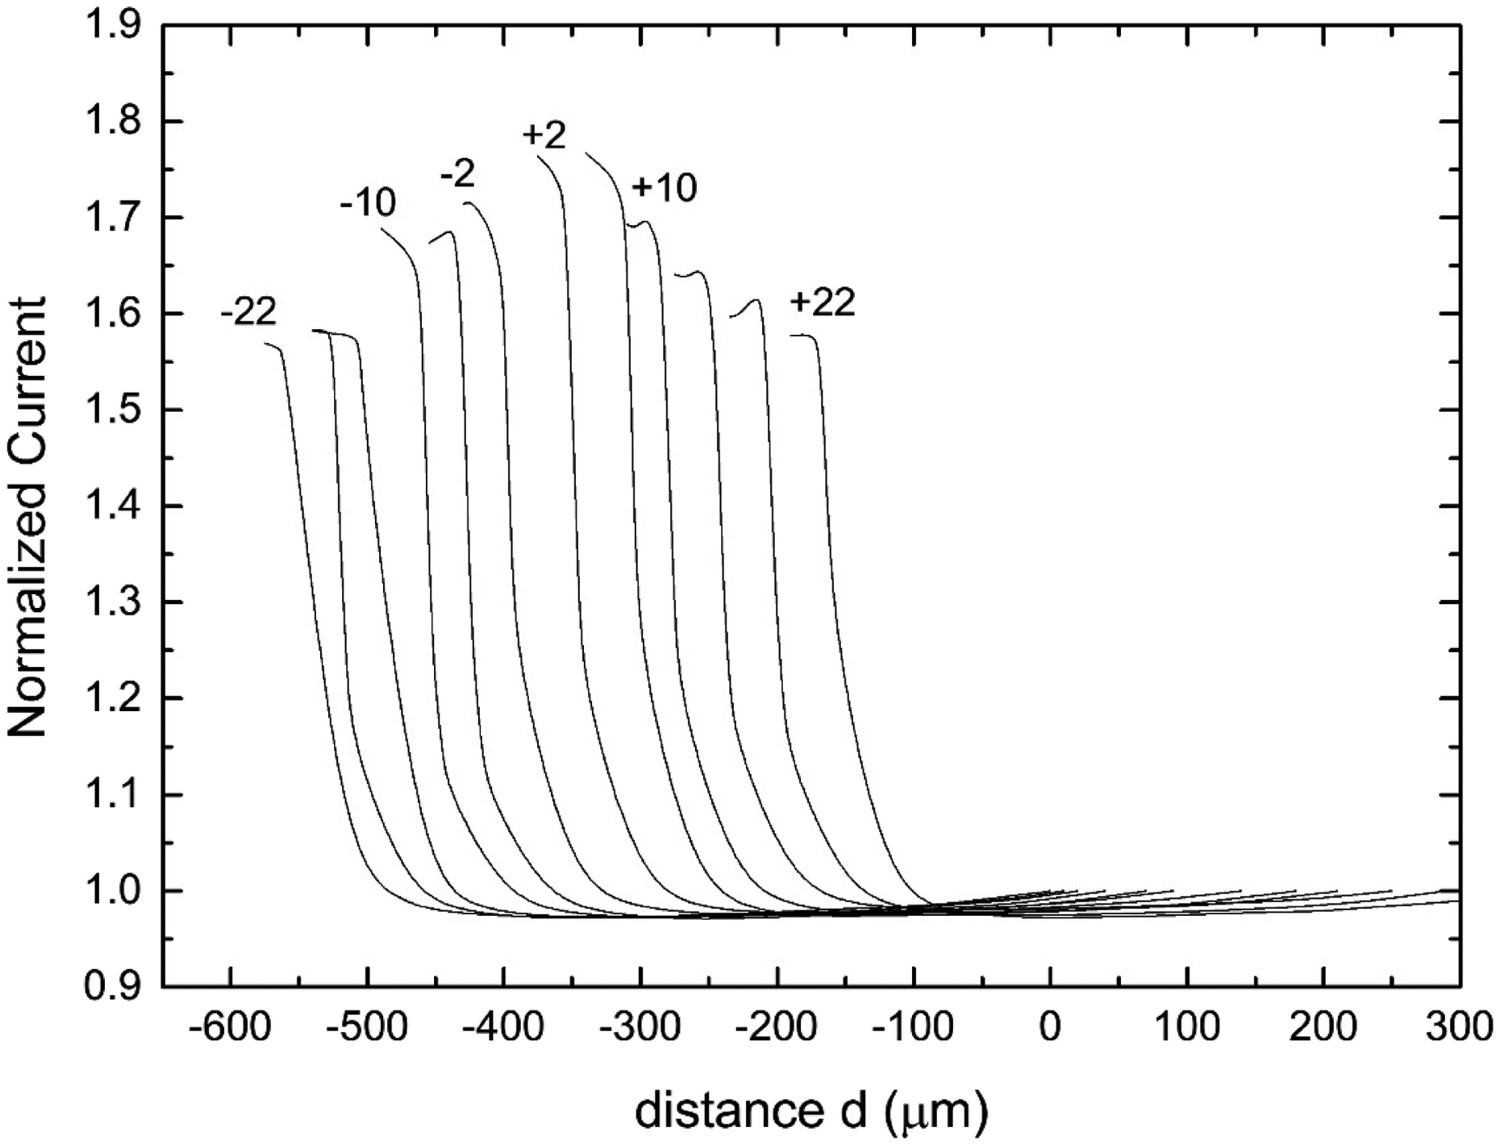
All curves are in positive-feedback which indicates an electrochemical activity of the substrate. Currents increase when the microelectrode is coming closer to the sample, which confirms the reduction of  onto the metallic substrate (Equation (2)). The greater the reduction kinetic is on the substrate, the greater is the normalised current, corresponding to a higher cathodic potential of this region. The cathodic current decreases as the microelectrode gets away from the NZ. In the BM (at 22 mm), the cathodic currents are lower than the currents in the NZ.
The electrochemistry profile relates to the highest normalised current when the tip approaches close to the sample surface, and the reduction kinetic k which depends also on the approach curves. The maximum normalised current (the current when the tip nearly touches the sample surface) can be plotted versus the distance from the centre of the nugget (x = 0 cm) which gives the evolution of the current in function of the distance on both sides of the weld, as presented in Figure 9(a) and Figure 10 for the upper and lower surfaces, respectively. For the upper surface (Figure 9(a)), two current profiles (solid line and dotted line) are presented to verify the reproducibility. In accordance with the hardness profile, the reproducibility of electrochemical profiles is acceptable.
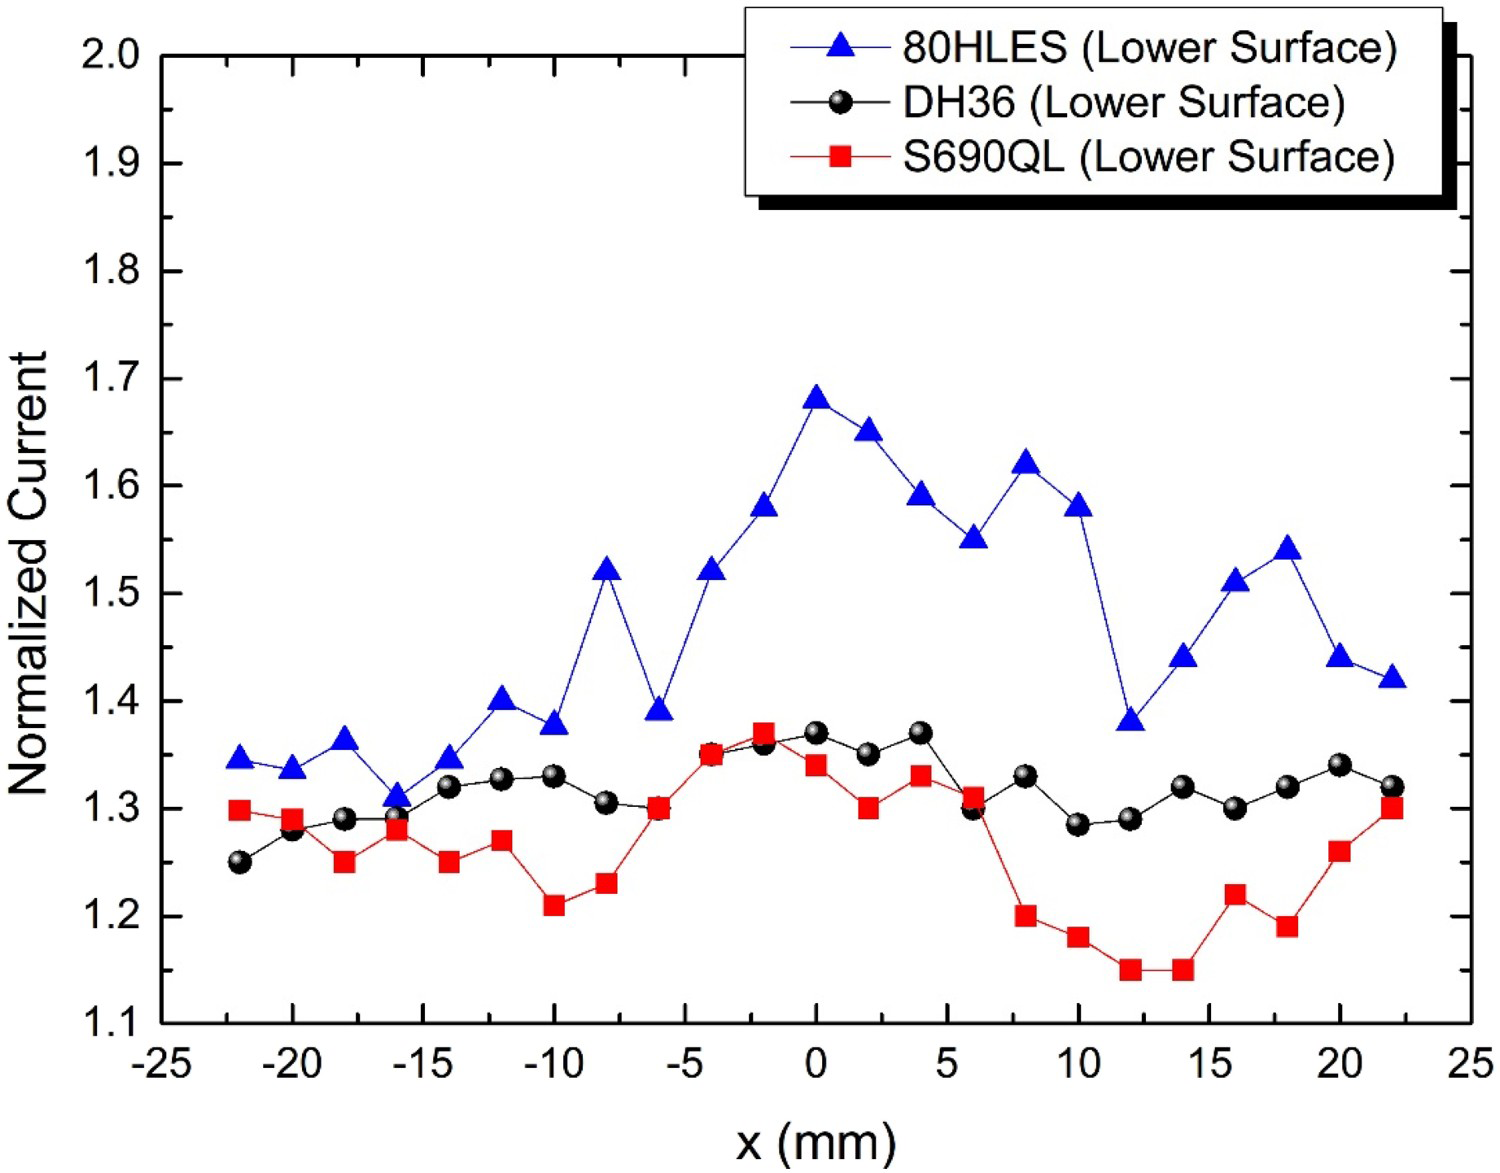
(a) Current profiles obtained from Figure 8 for three steel samples on upper surfaces and (b) macrograph of an as-received sample before polishing. Current profiles for the three steel samples on lower surfaces.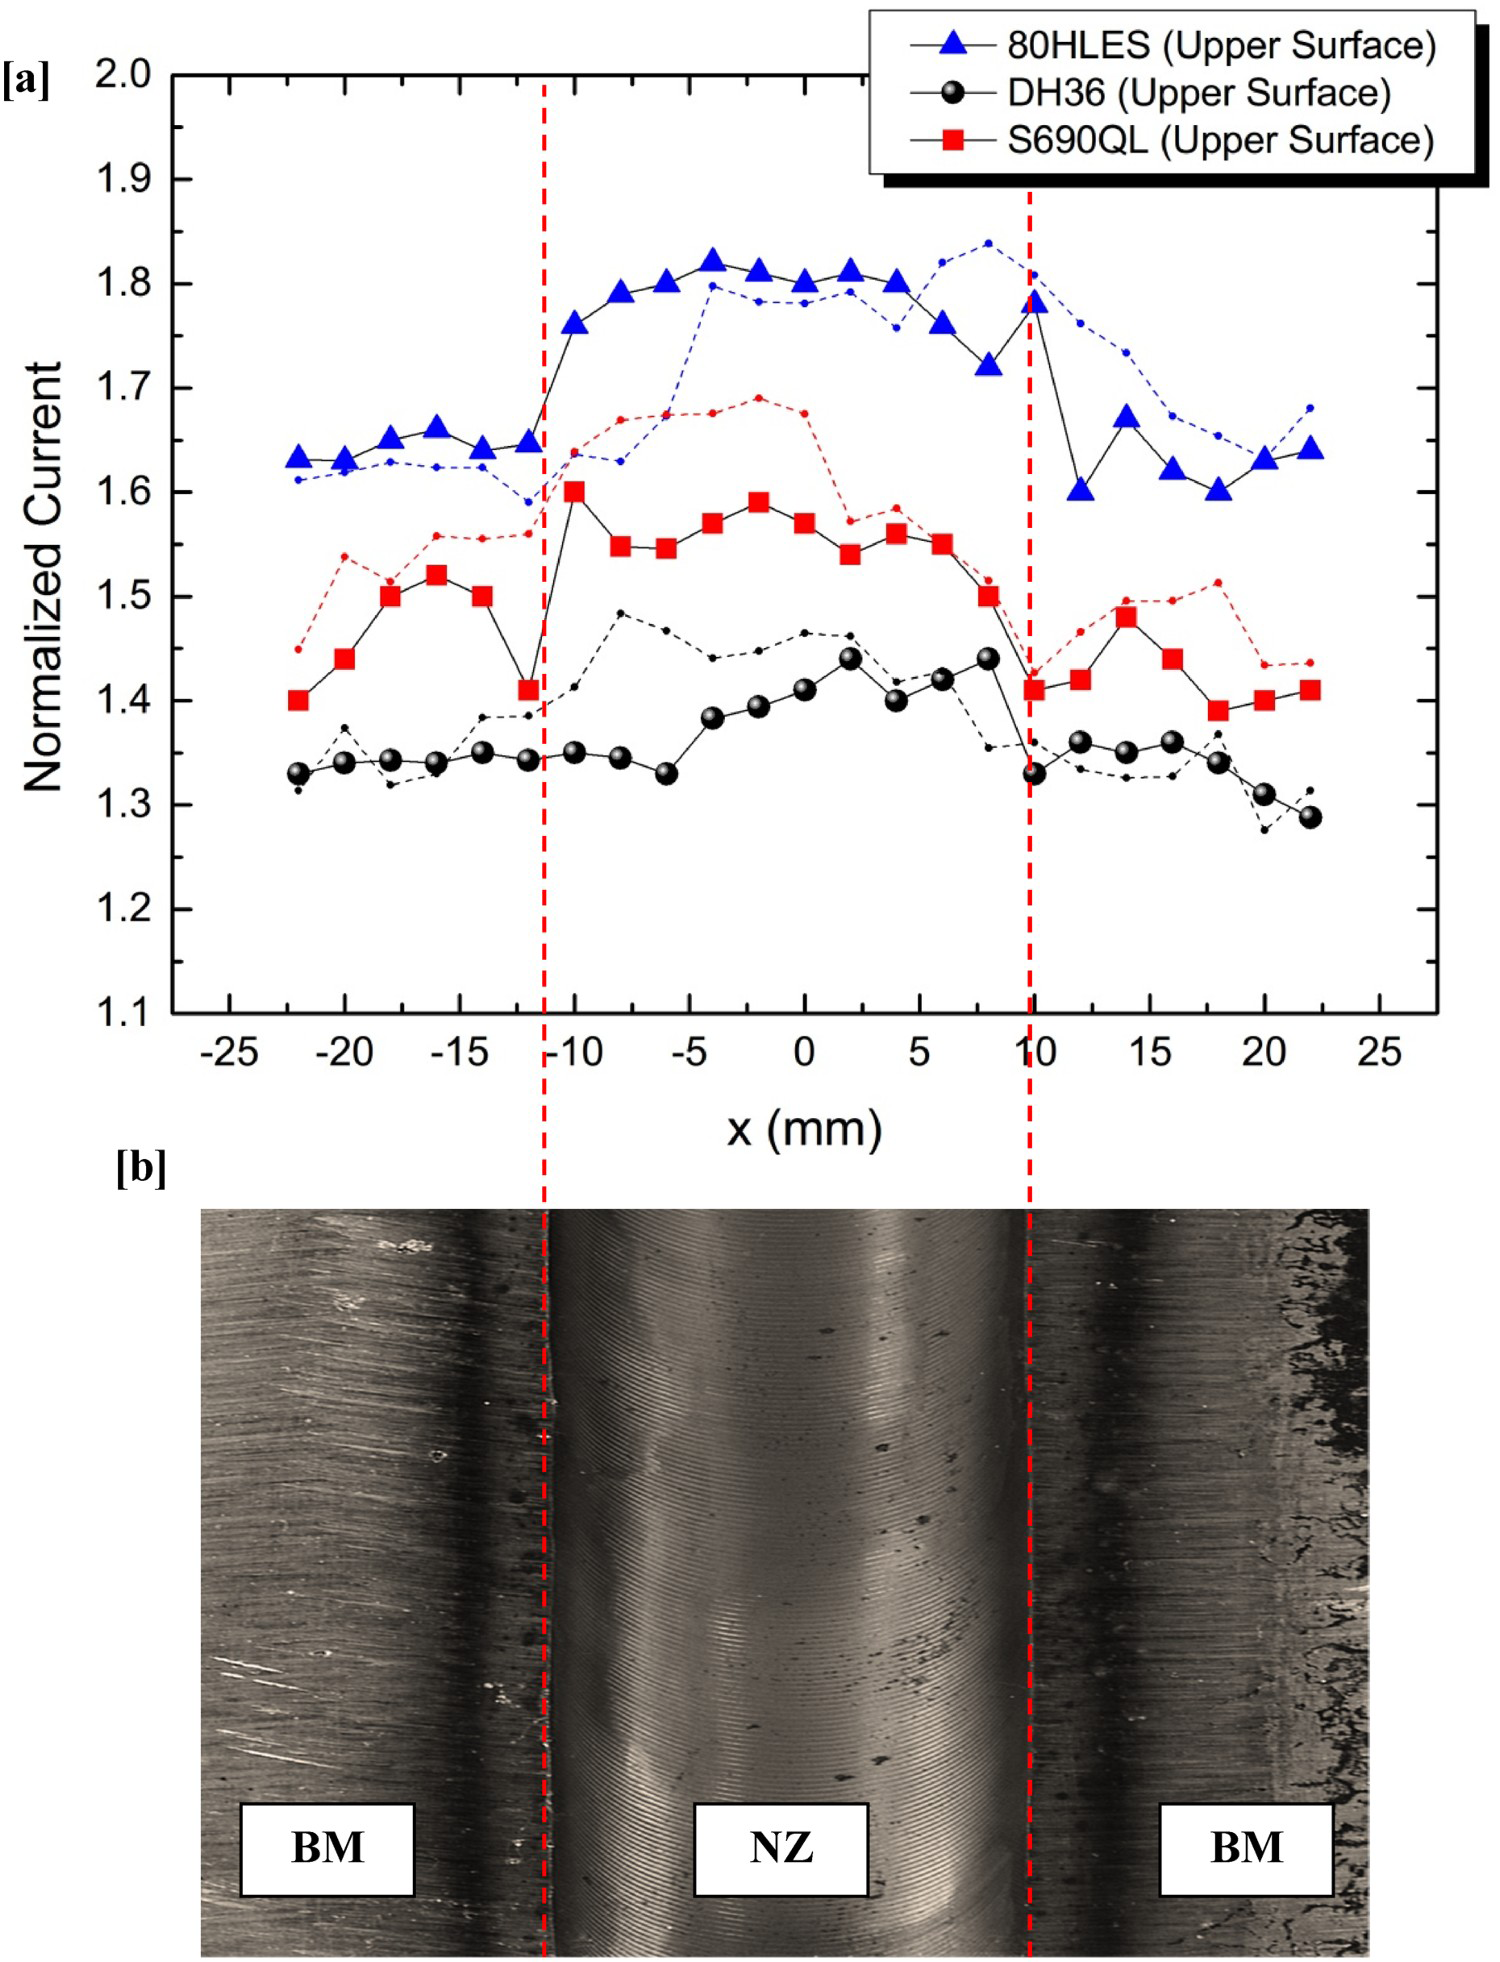
In each case, the BM presents a less cathodic potential than the NZ, which means that the reduction kinetic is higher on the NZ than BM in accordance with the mini-cell test. Consequently, a galvanic coupling is possible and could be detrimental for regions alongside the weld, especially for the 80HLES sample where the current variations are the most noticeable. The two others substrates (DH36 and S690QL) have a more homogeneous current profile (DH36 sample having the lowest current). In those cases, it is unlikely that galvanic coupling occurs. Based on the current profiles, it can be also distinguish three zones with different electrochemical activities on each sample: the highest cathodic current on NZ (from −0.9 to 0.9 cm), high current on TMAZ and HAZ (between 1 to 1.5 cm), and lowest current on BM (from 1.5 to 2.1 cm). These local electrochemical activities of different zones are in good agreement with the hardness profiles presented in Figure 6.
Figure 10 presents the current profiles of three samples on the lower surface. The current profiles observed are in good agreement with the microstructure variation of the lower surface. The width of the NZ of lower surface is smaller (from −5 to 5 mm) than the NZ's dimension of upper surface (from −10 to 10 mm). In addition, the overall electrochemical reactivity on the lower surface is more homogenous and lower than the upper surface for DH36 and S690QL, which seems in accordance with the hardness profiles (Figure 6). The most affected sample remains the 80HLES where there is a clear difference in current between the NZ and the BM. Consequently, this sample should be susceptible to galvanic coupling.
Moreover, Figure 11 illustrates the three steel samples at three times of immersion in the SECM tested solution. An oxidation initiation is shown on 80HLES at about 0.5 mm from the nugget interface (black arrow on Figure 11(b,c) in accordance with the mini-cell and SECM tests. The two other steels are less susceptible to corrosion initiation even if some corrosion traces are observed on the DH36 sample after 120 min of immersion simultaneously on BM and HAZ (white arrows in Figure 11(c)).
Illustration of the corrosion initiation near the welded zone for the S690QL, DH36 and 80HLES samples.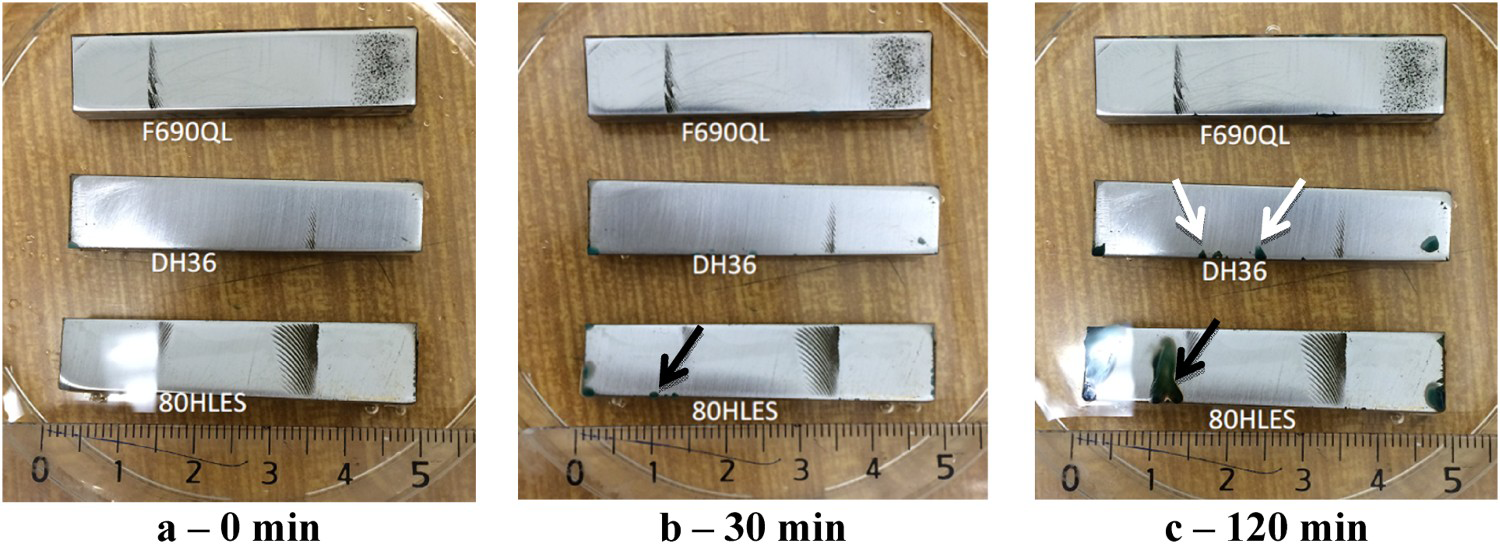
Discussion
The presented results indicate that the NZ has the higher Ecorr than the BM zone. This is in accordance with the results from the literature that point out a better resistance of the NZ in comparison to the BM, whatever the material welded (aluminium or steel). This behavior is correlated to the different metallurgical states [6]. In our work, the polarisation curves and SECM profiles are likely to be related to the microstructure evolutions and hardness properties of the samples after the welding process [23] as the effect of the grain size is not clearly obvious in our study. Indeed, the corrosion resistance of the assembly seems to be linked to the homogeneity between BM and NZ. The correlation between the metallurgical state and the corrosion sensitivity are in good agreements with the previous study of Bousquet et al. [22]. As predicted, the SECM profiles are consistent with the visual aspect of the samples: the oxidation initiation at the NZ/HAZ interface on the 80HLES sample (Figure 11) proves that there is a galvanic coupling between the NZ and the other zones (mainly BM). Galvanic corrosion does not seem to affect DH36 and S690QL as no major corrosion initiation was noticed.
Finally, the results show that the HAZ and BM could be susceptible to localised corrosion. Yet in industrial application, two large sheets of metal are welded together. By extrapolation of our results to a bigger scale, the sheet and the weld are the anodic and the cathodic surfaces respectively. Considering the ratio between cathodic and anodic surfaces Sc/Sa, Sa is larger than Sc (up to 1/20). As a consequence of this, the assembly could not suffer from galvanic corrosion.
Conclusions
Local electrochemical investigations on three Friction Stir Welded (FSW) steels were performed in order to assess the galvanic coupling between the NZ, the HAZ or the BM. Electrochemical behaviours are discussed in relation with microstructural and hardness properties. The main results of this study are the following:
the weld is the cathodic zone whatever the steel; SECM profiles are related to the hardness homogeneity after the welding process. The 80HLES steel exhibits the more significant differences in hardness and surface reactivity between the NZ and the other surfaces. These lead to a galvanic coupling inducing corrosion initiation. By comparison, DH36 and S690QL are more homogeneous in hardness and the absence of corrosion initiation was observed.
To conclude, FSW process is of high interest to limit the corrosion of the weld for three steels used in shipbuilding.
Footnotes
Acknowledgements
Authors would like to thank IRT Jules Verne (French Institute in Research & Technology for Materials and Processes at Nantes) for providing the welds realised in the framework of the SIPSAN project. Welding tests have been carried out by MegaStir (Provo, UT), the metallurgical department of Naval Research for the microstructural investigations and hardness measurements.
Disclosure statement
No potential conflict of interest was reported by the authors.