
Abstract
The main objective of this study is to assess the long-term performance of Pt nanoparticle coated anodised Ti coupons which are used for electrochemical dissolution of spent mixed-oxide nuclear fuels during reprocessing. In this work, electrodes were exposed to a simulated dissolver solution containing a representative fraction of low-activity actinides and fission products in 11.5 N nitric acid in a mock-up of the service dissolver vessel. Platinum nanoparticles were coated onto anodised titanium coupons through a seed-mediated hydrothermal method. The coated coupons were then exposed in the simulated dissolver solution for about 1185 h at 110°C. Morphological and compositional analyses confirmed the presence of metallic Pt nanoparticles on the electrode surface with some localised cracking. The electrochemically active surface area of the Pt-nanoparticle coated anodised titanium coupon after exposure was found to be twice that of polycrystalline platinum thus establishing the durability and efficiency of the coating on the electrode.
Introduction
Electro-oxidative dissolution technique is considered as one of the highly efficient electrochemical processes for dissolving plutonium-rich mixed oxide spent fuel in concentrated boiling nitric acid. Noble metal-based electrodes are the natural choice for this application but highly limited due to the cost involved. The alternate approach is to coat a thin layer of noble metal nanoparticles on titanium substrates which is both cost-effective and corrosion-resistant in nitric acid medium. Dimensionally stable anodes (DSA) undergo slow degradation processes and specifically DSA Ti anodes are basically a titanium skeleton covered with electro catalytically active mixtures of noble metal oxides such as ruthenium, titanium, platinum, palladium, rhodium and iridium. These types of electrodes are mainly used in chlor-alkali industry and for the production of chlorates [1]. Ti substrates were coated with a mixture of RuO2 + TiO2 and an overlay of PtO2 and these electrodes were termed as mixed oxide coated titanium anodes (MOCTA) employed as electrodes in the electrochemical processes involved in the dissolution and the purification of the spent (U, Pu)C fuel of fast breeder test reactor (FBTR) in India [2]. MOCTA electrodes were prepared by initially applying the salt solutions of Ru and Ti over a pretreated titanium surface followed by thermal oxidation. This resulted in an adherent coating which was both conductive and electro catalytically active. The typical cracked-mud morphology of MOCTA samples was modified to smooth and fine-grained surface with the application of PtO2 layer. To further improve the service life of the MOCTA electrodes, thermo chemical glazing process was used in which metallic coatings of Pt and Pt–Ir are coated over MOCTA electrodes and heat treated in vacuum at different temperatures [3]. These electrodes named as MOCTAG showed a smooth and compact coating and superior performance in boiling nitric acid conditions compared to MOCTA electrodes [4].
Baraka et al. [5] reported on the Pt electrodeposited titanium substrates that showed high current efficiency whereas Lu and Zangari [6] developed Pt electrodeposited on highly oriented pyrolytic graphite. The electrocatalytic activity of platinum nanoparticles was discussed in a number of works reported in the literature for various applications such as fuel cells, dye sensitised solar cells to name a few [7 -15].
In order to overcome some of the challenges encountered in the above-mentioned MOCTA and MOCTAG electrodes namely, uniform and adherent coating, high noble metal content, cost effectiveness and improved performance, a seed-mediated electrodeposition-assisted hydrothermal method was developed [16]. In this method, Pt nanoparticles were deposited on titanium using electrodeposition and Pt nanoparticles performed the role of seed nuclei and ensured the uniform coating of Pt nanoparticles over Ti in the subsequent hydrothermal reduction method. The key feature that guarantees the success of these electrodes is their ability to withstand extreme radio-toxic environments. Therefore, the performance of the as-developed electrode was demonstrated by using it as an anode in cerium oxidation under an applied current of 9 mA cm–2 for 1000 h in 11.5 N HNO3 [17,18].
To further improve the Pt loading on Ti substrate, self-aligned TiO2 nanotubes (TiNT) are formed on Ti by electrochemical anodisation process in an organic electrolyte which resulted in enhanced Pt nanoparticle–Ti substrate interaction thereby improving the overall electrocatalytic activity of the electrode [19]. The PTNT surface characterised using SEM showed two distinct features on the surface: (i) vertically aligned TiO2 nanotubes with approximately 1 µm diameter and an inner diameter of approximately 85 nm [19] and (ii) Pt nanoparticles of average size 150 nm were loaded on the TiO2 surface and inside the TiO2 nanotubes. The amount of Pt loading in titania nanotubes was found to be 0.51 mg cm–2 from the Atomic Absorption Spectroscopic (AAS) technique [19]. The electrochemically active surface area of the Pt nanoparticle loaded TiNT was calculated to be 212.923 cm2 mg–1 by carrying out hydrogen adsorption–desorption studies [19]. The performance of the Pt nanoparticle loaded TiNT array electrode was better than that of the Pt nanoparticle coated Ti electrode even after 1000 h of exposure to corrosive nitric acid conditions, with minimal coating degradation [20]. Therefore, the objective of the present work is to evaluate the long-term performance and durability of the Pt nanoparticle coated TiO2 nanotube electrode in simulated reprocessing dissolver solution in a mock-up dissolver vessel.
Materials and methods
Pt nanoparticle loaded TiNT electrode was synthesised in three steps: (i) anodisation and annealing of Ti foil (ii) electrodeposition of Pt nanoparticle seed on TiNT arrays and (iii) hydrothermal reduction of Pt nanoparticle seeded TiNT arrays. The detailed experimental procedure for electro deposition and hydrothermal reduction is described elsewhere [19].
Briefly, Ti, CP-Grade 2, with dimension 3 × 3 × 0.05 cm was polished using 1000 grit SiC paper. The polished Ti coupons were cleaned in ethanol followed by acetone in an ultrasonicator and then finally washed in de-mineralised water. Ti coupon was anodised in 0.5 wt-% NH4F and aqueous ethylene glycol in the ratio 1:3 at 30 V for 1 h. The anodised titanium was annealed in a muffle type box furnace in ambient conditions. The annealing temperature and time duration were 450°C and 3 h, respectively which resulted in the formation of self-aligned titania nanotubes on the titanium base material.
The anodised and annealed Ti with titania nanotubes on titanium was then used as the substrate for electrodeposition in which Pt seed were deposited at a potential of −0.12 V for 20 s using 1 mM chloroplatinic acid in 0.5 M sulphuric acid. Then this substrate was subjected to hydrothermal reduction in a Teflon-lined stainless steel autoclave at 100°C for 10 h in a solution of chloroplatinic acid, formaldehyde and Millipore water.
Pt coated TiNT sample (hereafter referred as PTNT) was then exposed in the Zircaloy-4 (Zr-4) mock-up dissolver vessel containing the simulated dissolver solution (SDS). The composition of the corrosion and fission products in 11.5 N nitric acid in the SDS solution is mentioned elsewhere [21]. Briefly, the composition of the simulated dissolver solution is based on the theoretical calculation for the mixed carbide fuel (PuC: 70%, UC: 30%) that would have undergone a burnup of 150 GWd tonne–1 in the fast breeder test reactor (FBTR) at IGCAR and after a cooling period of 1 y. To simulate the concentration of these fission and corrosion products, calculated quantities of metal oxides or nitrates were dissolved in 11.5 M nitric acid, and the resultant solution is called SDS which contains the following metal oxides or nitrates in g l–1: Pu (55.2631); U (23.6842); Ag (0.0971); Ba (0.4846); Cd (0.0460); Cd (0.0460); Ce (0.7694); Cr (0.1812); Cs (1.4054); Eu (0.0514); Fe (2.4401); Gd (0.0319); La (0.4176); Mn (0.0266); Mo (1.1151); Nd (1.1859); Ni (0.1383); Pd (1.0704); Pr (0.4098); Rb (0.0701); Rh (0.3497); Ru (1.0858); Sb (0.0171); Se (0.0144); Sm (0.3419); Sn (0.0463); Sr (0.1460); Tb (0.0030); Te (0.1600); Ti (0.0200); Y (0.0844); Zr (0.9002); Np (0.0174); Am (0.0696); Cm (0.0002) respectively. It should be mentioned that actinides such as neptunium, americium, curium, plutonium, and uranium were not included in the simulated solution.
The photograph of the experimental setup and the arrangement of samples exposed are shown in Figure 1. Zr-4 mock-up dissolver vessel [22–24] is being used as the testing facility to evaluate the corrosion behavior of zirconium and titanium-based candidate materials in the dissolver solution of FBTR spent fuel, which is reprocessed at the CORAL (COmpact Reprocessing of Advanced fuels in Lead shielded cell) pilot plant [25]. The temperature of the dissolver vessel was maintained at 110°C, which is the boiling temperature of SDS.
(a) PTFE sample holder to accommodate the corrosion coupons exposed to both the vapour phase (85°C) and the boiling liquid phase (110°C) of SDS. (b) Schematic of the sample holder assembly placed inside the left vertical limb of mockup Zr-4 dissolver [10].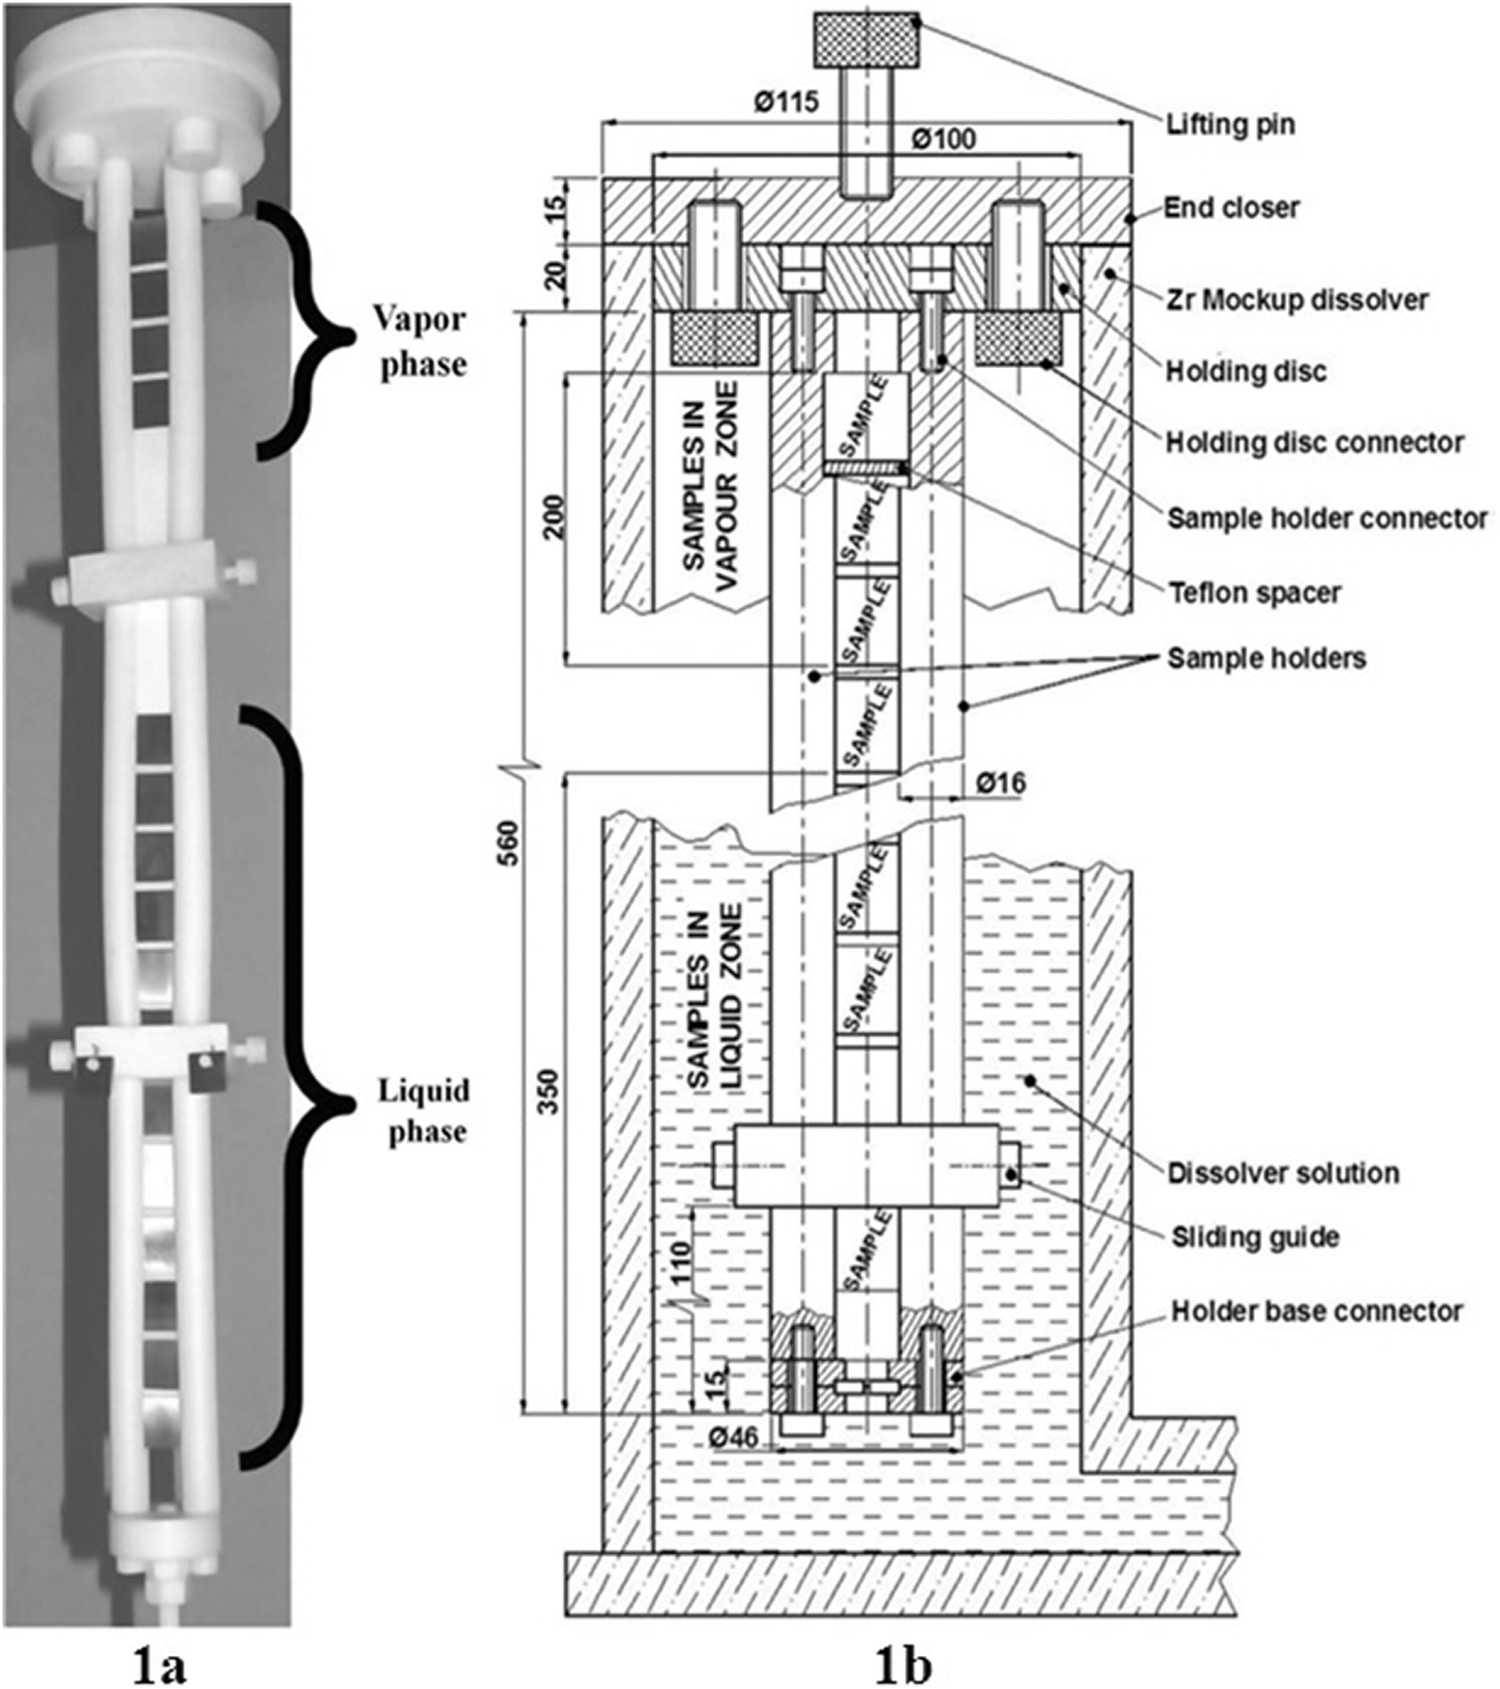
The PTNT coupons were kept in a polytetrafluoroethylene (PTFE) sample holder assembly shown in Figure 1(a). Then the PTFE sample holder was placed inside the left vertical limb of the dissolver vessel in such a way that the coupons will be exposed to both the vapour phase (85°C) and the boiling liquid phase (110°C) of SDS as shown in Figure 1(b). The as-prepared Pt coated TiNT sample was exposed in the mock-up dissolver vessel in the boiling nitric acid (11.5 N) condition at 110°C for 1185 h. The surface characterisation of the samples was carried out after 100, 500 and 1185 h exposure in SDS at 110°C. Morphology of the modified sample surface was elucidated using scanning electron microscopy (SEM, Desktop Mini-SEM, SNE 3000M, Korea and SUPRA 55 FESEM, M/s Carl Zeiss, Germany). The phase and crystal structure of the sample surface was characterised using X-ray diffraction (Equinox 2000, M/s Inel, France) with Cu-Kα radiation. The chemical composition of the coatings was studied using X-ray photoelectron spectroscopy (XPS, SPECS surface analysis with Al Kα excitation, GmbH, Germany). The acquired data was processed and analysed by the Specs Lab 2 and Casa XPS softwares, respectively. The Shirley approximation algorithm was used for the background correction and the peaks were de-convoluted using a product of Gaussian (70%) and Lorentz (30%) functions. In addition, the weight of the sample after exposure was recorded and the photographs were taken for comparative study. The corrosion rate after each campaign (100, 500, 1000 and 1185 h) was calculated as per ASTM G 1 [26] and the formula is shown in Equation (1),

In order to evaluate the electrochemical activity of the PTNT electrode after exposure in SDS, cyclic voltammograms (CV) of PTNT sample were recorded in 1 M H2SO4 under inert Argon (99.99%) atmosphere using an electrochemical workstation Autolab (PGSTAT-30, Eco-Chemie, The Netherlands) equipped with general-purpose electrochemical software. The electrochemical experiments were carried out in a standard three electrode cell at room temperature using PTNT/polycrystalline Pt as working electrode with an exposed area of 1 cm2, Ag/AgCl electrode as reference electrode and platinum foil as counter electrode. Scan rate was maintained as 100 mV s–1 and the total number of scans was five in all the CV experiments carried out in the present study.
Results and discussion
Figure 2 shows the schematic diagram representing the various steps involved in the synthesis of Pt coated Ti substrate. Anodisation of the titanium substrate shown in Figure 2(a) results in the formation of titania nanotubes on titanium substrate shown in Figure 2(b). Anodisation is followed by electrodeposition of Pt nanoparticles on titania nanotubes shown in Figure 2(c) and finally, hydrothermal reduction results in complete coverage of titania nanotubes formed on titanium substrate with Pt nanoparticles shown in Figure 2(d).
Schematic diagram representing the various steps involved in the synthesis of Pt coated Ti substrate: (a) Titanium substrate, (b) Step 1: Anodisation resulting in the formation of titania nanotubes on titanium substrate (c) Step 2: Electrodeposition of Pt nanoparticles on titania nanotubes and (d) Step 3: Hydrothermal reduction aid in complete coverage of titania nanotubes formed on titanium substrate with Pt nanoparticles.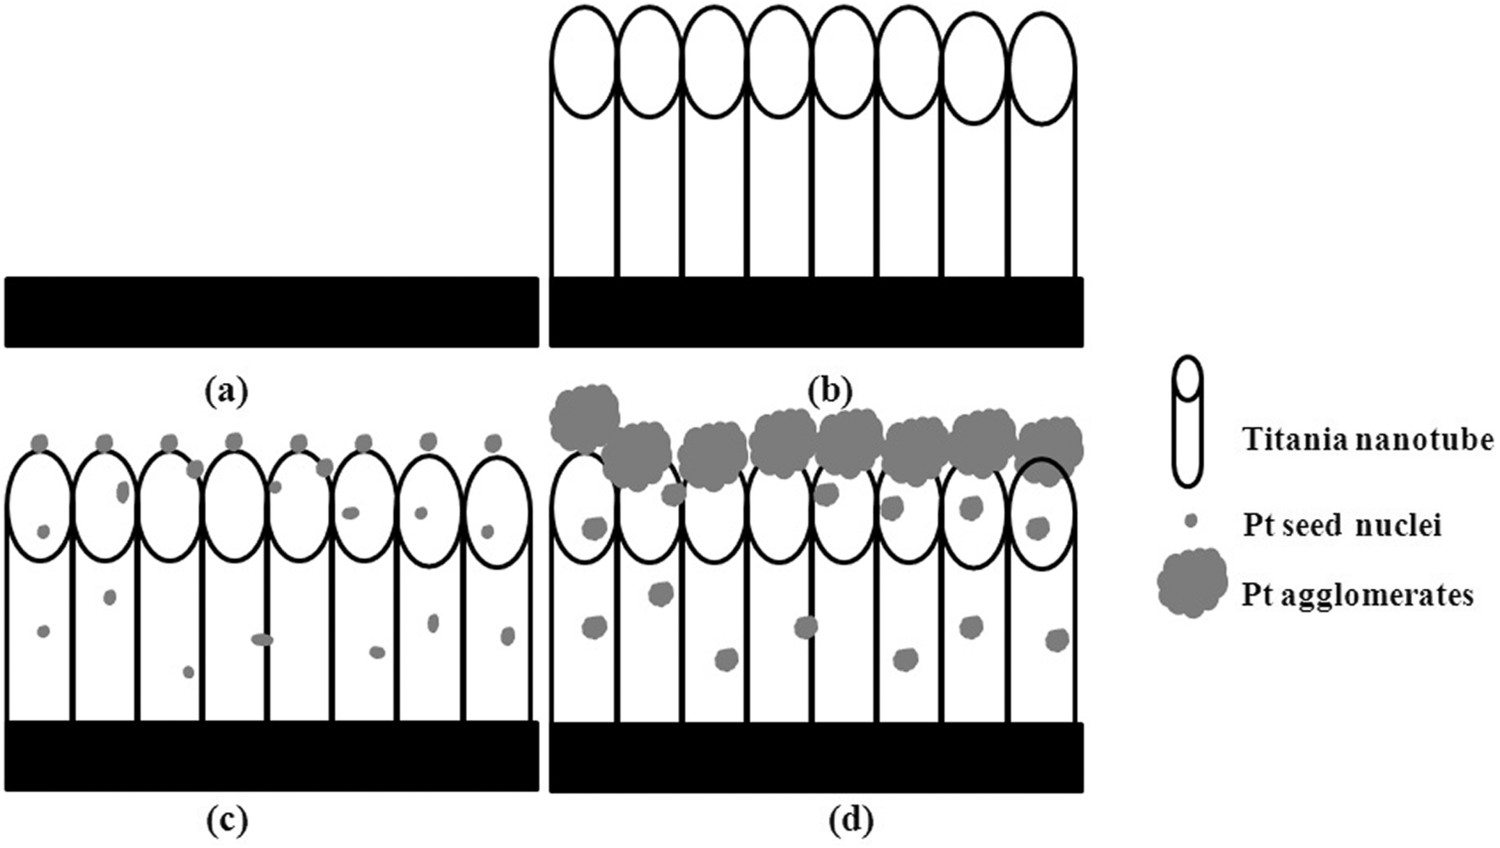
The surface morphology and chemical composition analysis of the PTNT electrode before and after exposure in the pilot scale plant gave valuable information on the morphological and compositional changes in the electrode if any. Further, photographs of the electrodes were taken after regular intervals of exposure in the dissolver vessel. The weight loss data was used to calculate the corrosion rate of the sample in nitric acid medium. The results and discussion from the above-mentioned techniques are described below.
The corrosion rate of PTNT sample vs exposure time in the SDS is shown in Figure 3. The corrosion rate of the PTNT sample exposed in the SDS for 1185 h at 110°C was calculated to be 1.149 mpy as per ASTM G-1 [26]. Therefore, the damage was minimal at 110 °C in plant conditions. It should also be noted that these studies were carried out on experimental basis in a pilot scale mock-up dissolver vessel. Depending on the performance of the PTNT electrode it would be improved further and manufactured in a large scale for real-time applications in reprocessing plants.
Corrosion rate of PTNT with respect to exposure time in simulated dissolver solution.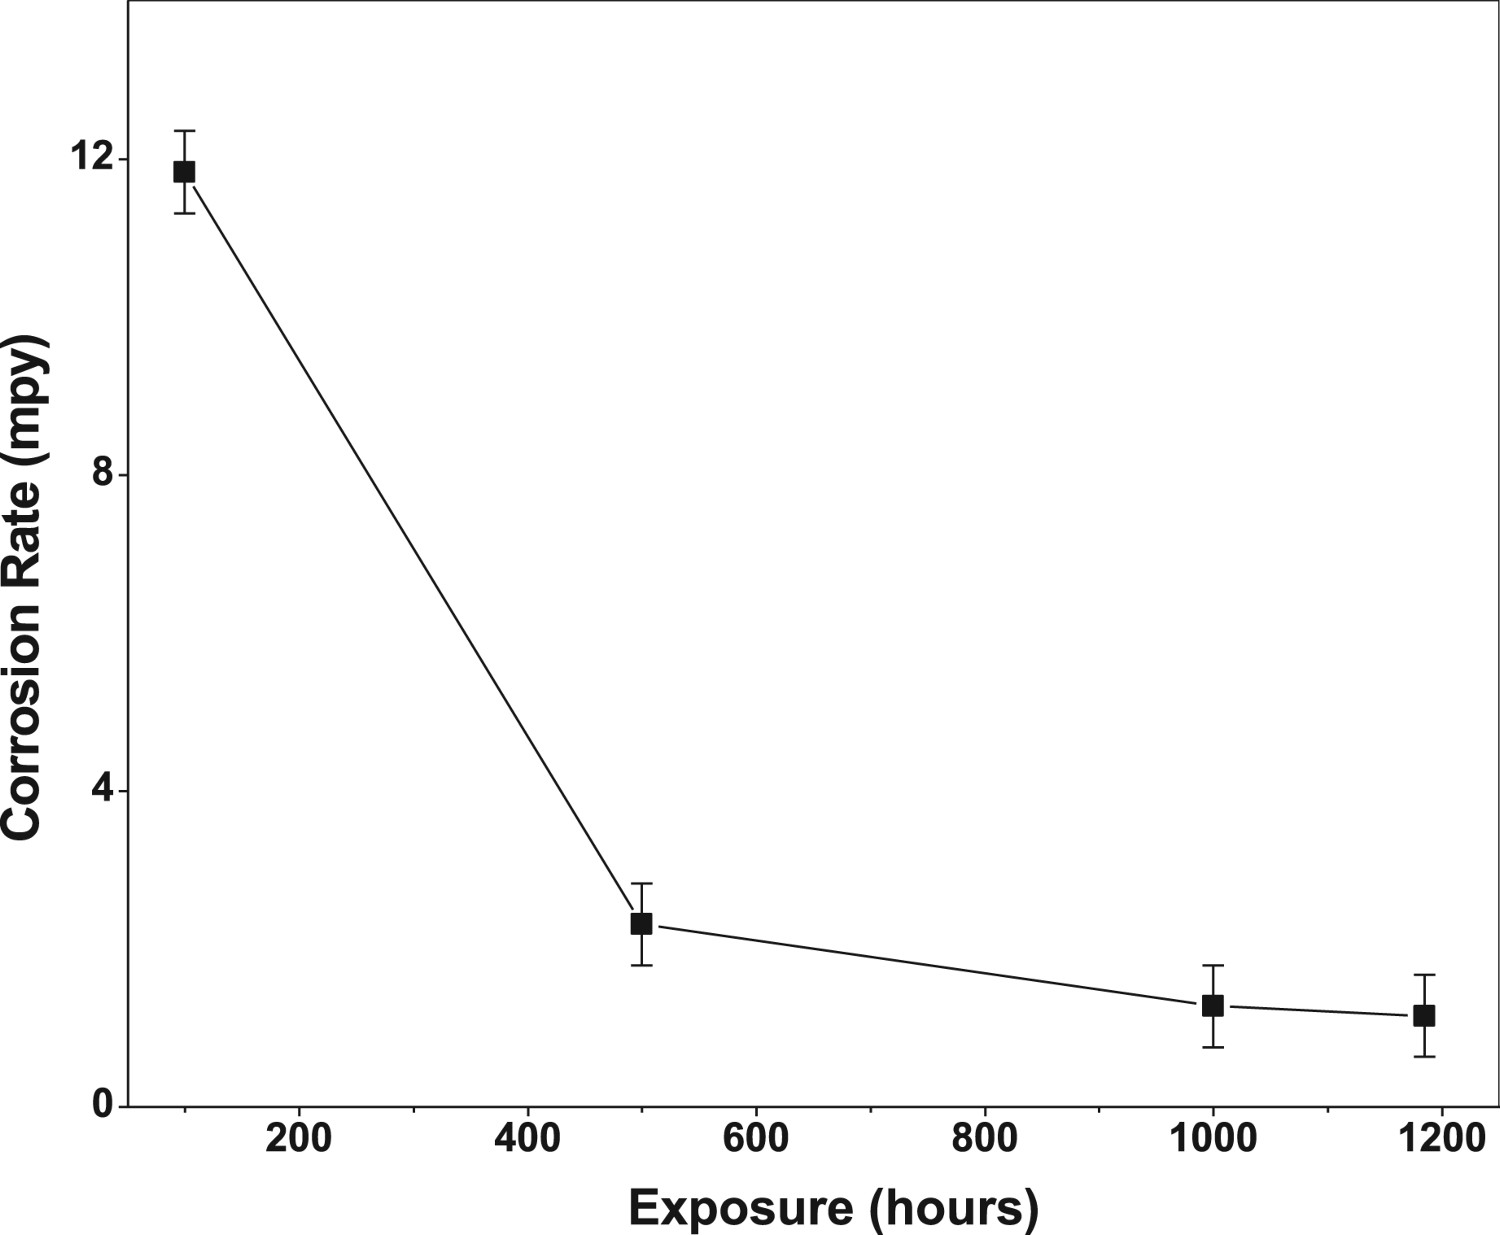
SEM micrographs of PTNT surface recorded before exposure (Figure 4(a)) in SDS showed the presence of uniform coating and the high magnification image (Figure 4(b)) shows the uniform distribution of spherical/agglomerated Pt nanoparticles on the surface. The detailed characterisation of the titanium nanotube array and platinum nanoparticle loaded titanium nanotube array is described elsewhere [19].
(a) SEM micrograph of PTNT surface before exposure in mock-up dissolver vessel and (b) high magnification SEM image of (a).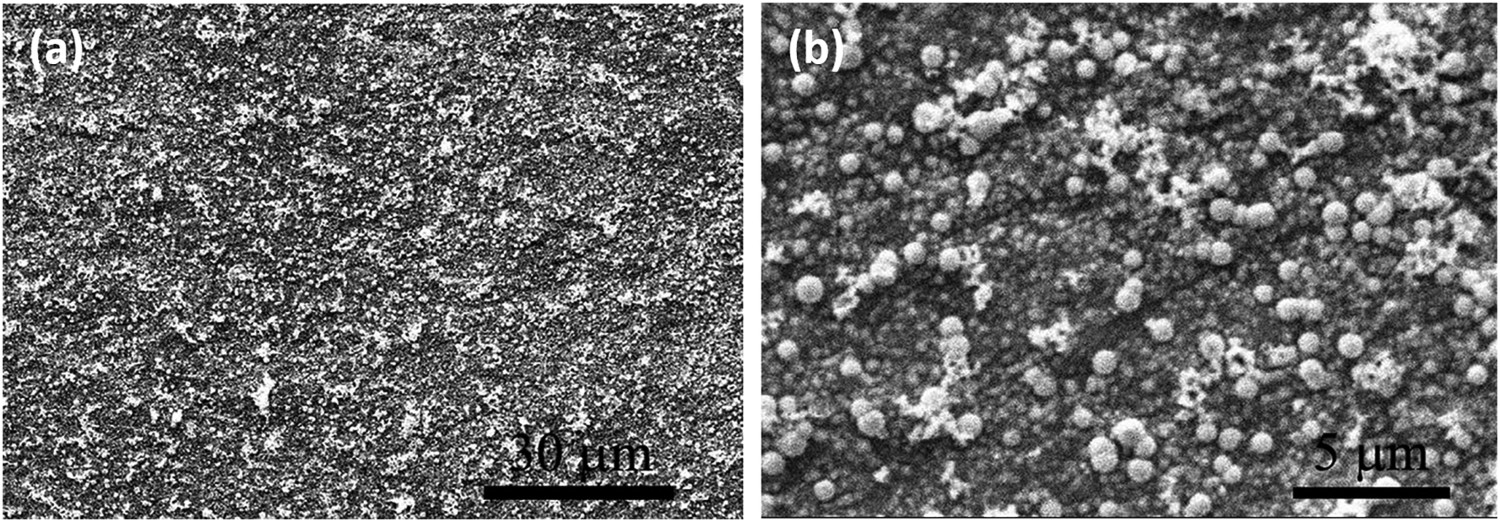
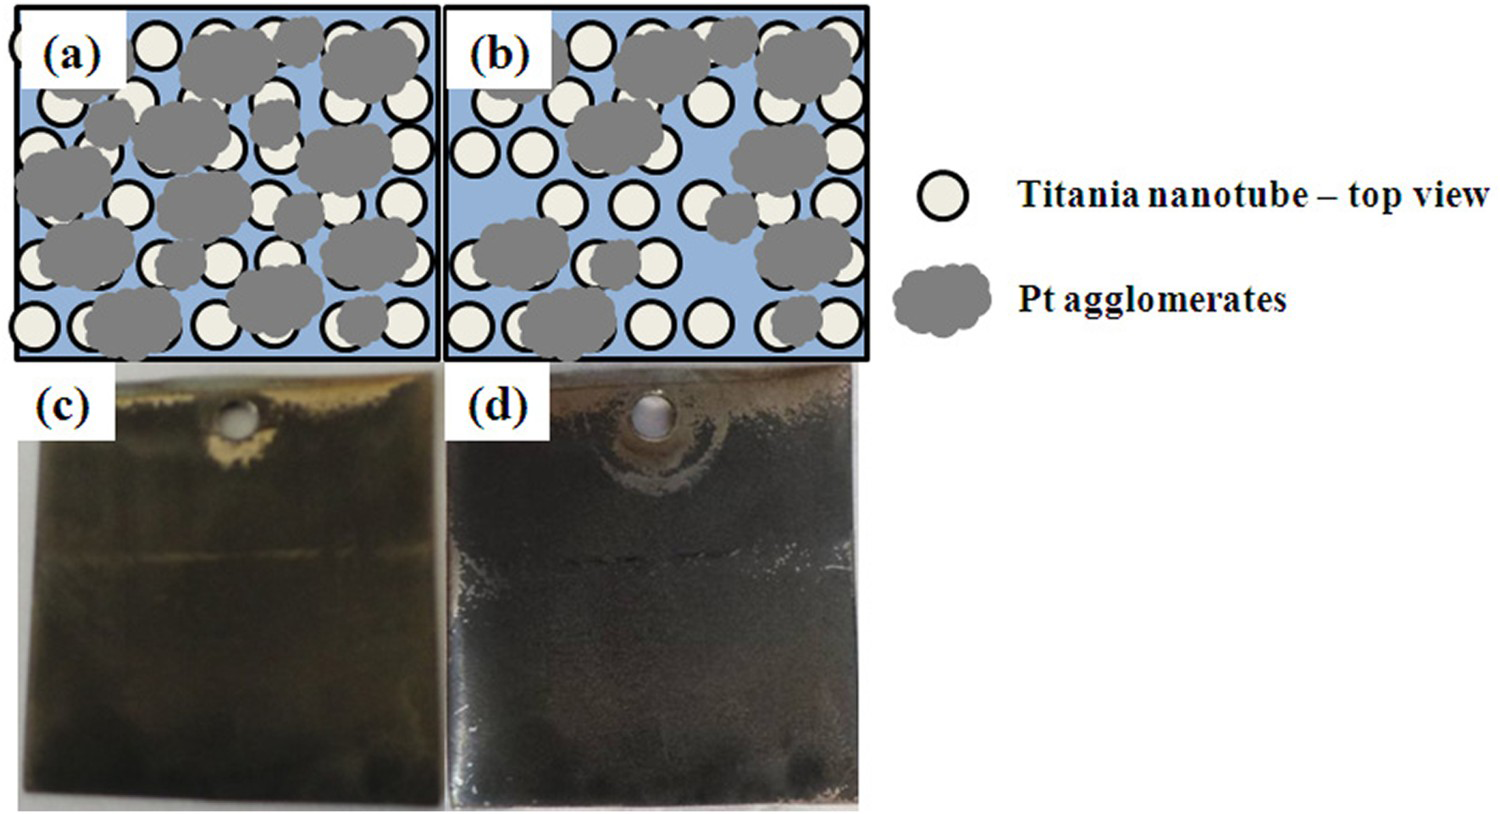
SEM images recorded after exposure in SDS for 100, 500 and 1185 h at 110°C and their corresponding high magnification images are shown in Figure 5(a–f). The micrographs recorded after different exposure time revealed that there are minor cracks and peel off of the coating. However these are localised events. The major portion of the coating was found to be intact and the Pt nanoparticles were found to be fairly distributed over the surface without any degradation. The SEM images did not explicitly show any formation of corrosion products on the surface. Instead the coating morphology was maintained even after 1185 h exposure. Figure 6 represents the schematic diagram showing the top view of the platinum coated titanium substrate (a) before and (b) after exposure in SDS for 1185 h indicating the peel off of the coating in a few places in the sample. Figure 6(c,d) shows the photographs of PTNT substrate before and after exposure in simulated dissolver solution. Visual examination shows that there is no evidence for the formation of cracks, peel-off or accumulation of corrosion products on the sample surface.
SEM micrographs of PTNT surface after exposure in mock-up dissolver vessel. (a,b) 100 h exposure, (c,d) 500 h exposure and (e,f) 1185 h exposure. (a,b) Schematic diagram representing the top view of the platinum coated titanium substrate before and after exposure in SDS for 1185 h and (c,d) Photographs of the platinum coated titanium substrate before and after exposure in SDS for 1185 h.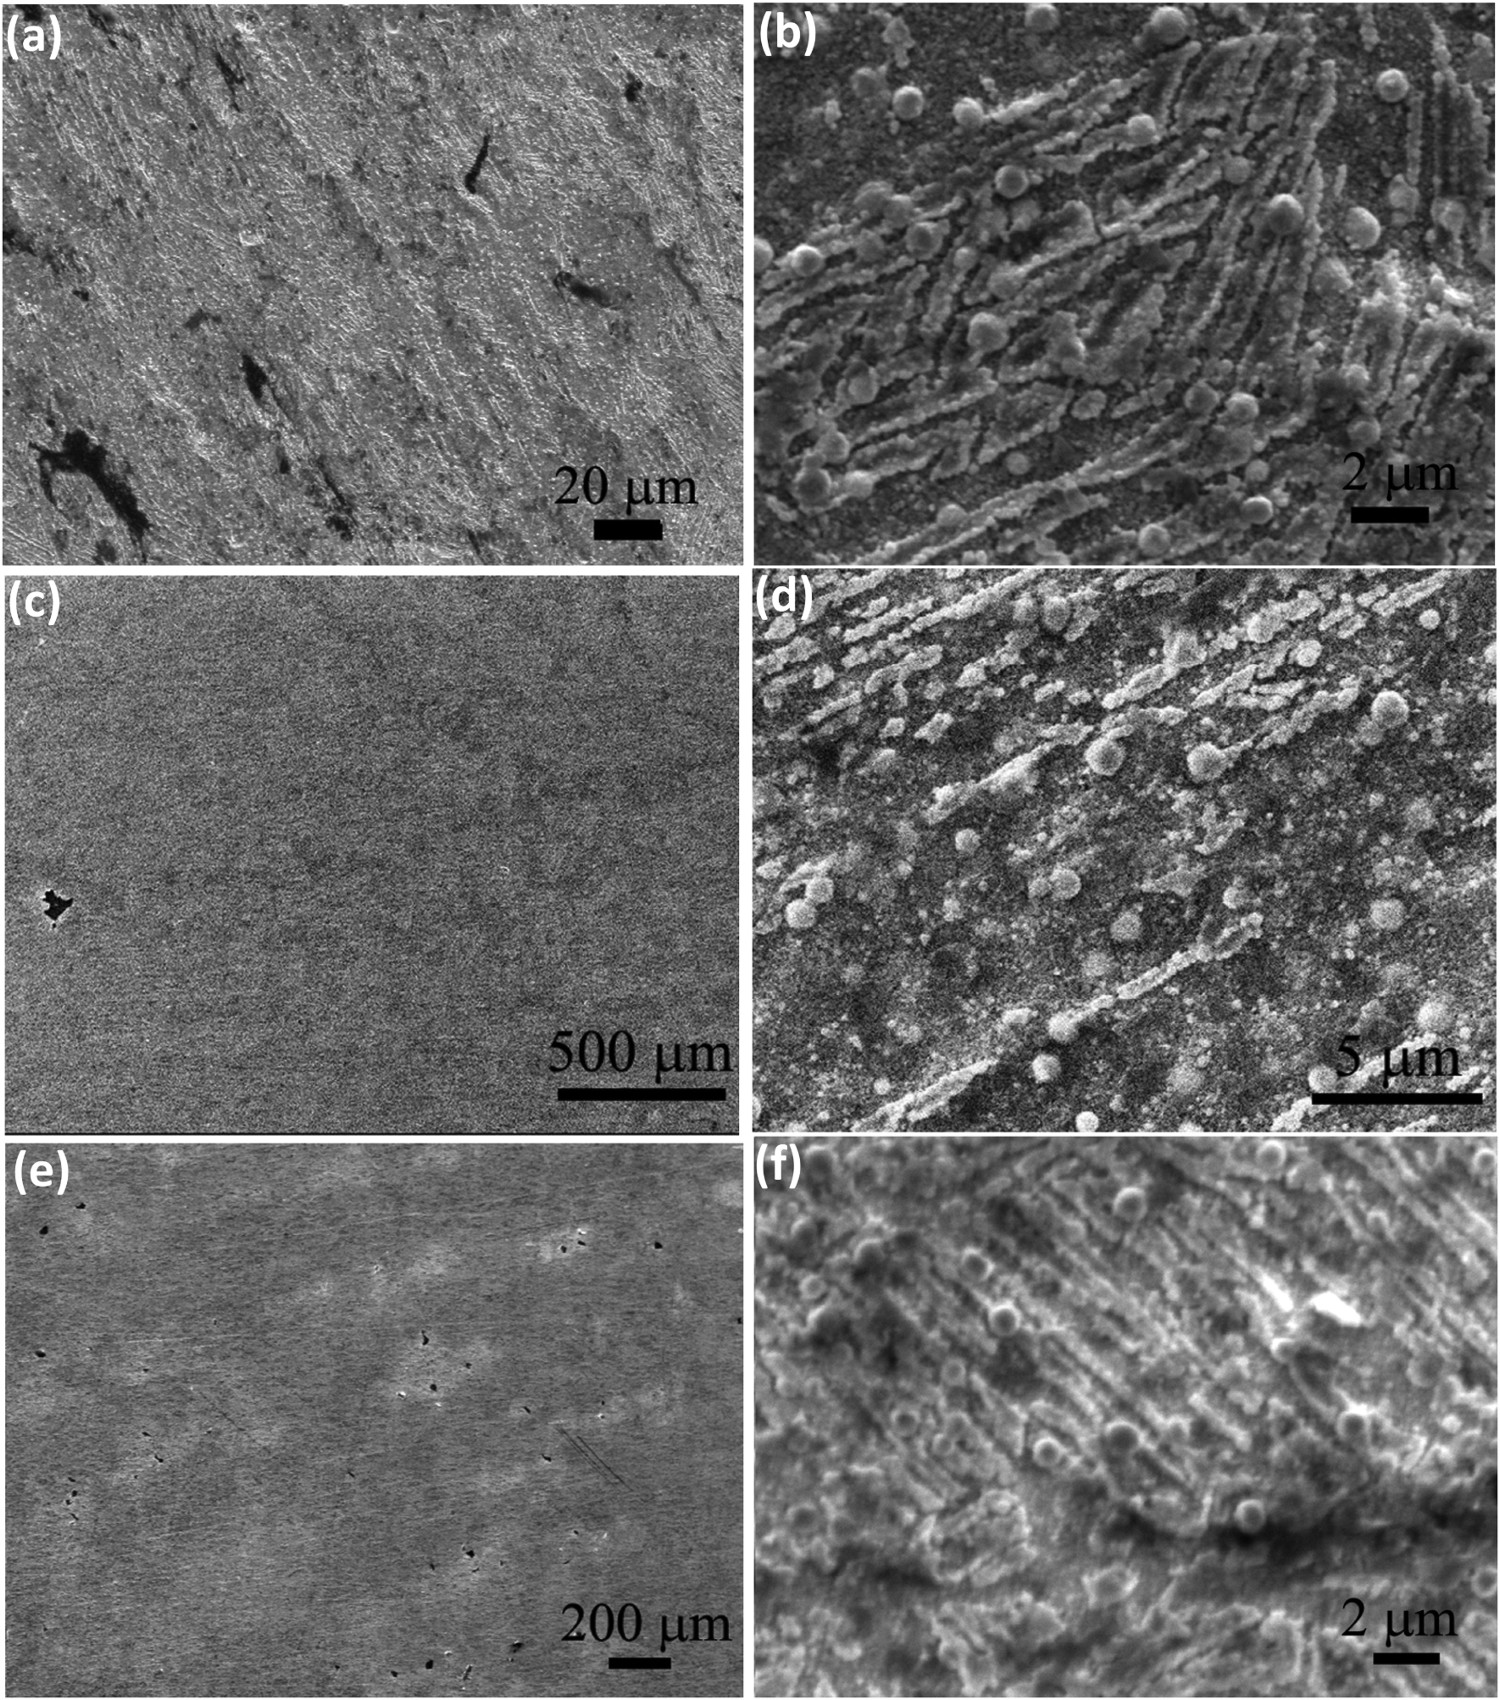
XRD patterns recorded on the PTNT surface before and after exposure were shown in Figure 7. A strong high intensity (111) reflection at 2θ value of 40.6° and a relatively less intense peaks at 46.2° and 68.3° corresponding to the fcc metallic phase of Pt (JCPDS 04-0802) were noted in the XRD pattern [27,28]. The base of Pt (111) peak is broad even before exposure and after exposure it is evidently broad indicating the nanoparticle form of Pt. The other peaks marked as ‘A’ in the XRD were indexed to the anatase phase of TiO2 (JCPDS 89-4921) and the peaks marked as ‘T’ corresponded to the base titanium substrate. With the slow dissolution of Pt ions in boiling nitric acid conditions, the base Ti and TiO2 will be exposed to the strong oxidising nitric acid conditions resulting in the formation of stable protective TiO2 oxide layer on the surface. Therefore, in places where there is Pt nanoparticle coating peeled off, TiO2 oxide layer has formed and protected the inner Ti substrate. In comparison to the XRD patterns recorded before and after exposure, it is evident that the peaks corresponding to Pt nanoparticle coating and the TiO2 nanotubes showed strong intensity which indicate that the coating is still intact without much deterioration after exposure.
XRD pattern of PTNT surface (a) before and (b) after exposure in mock-up dissolver vessel.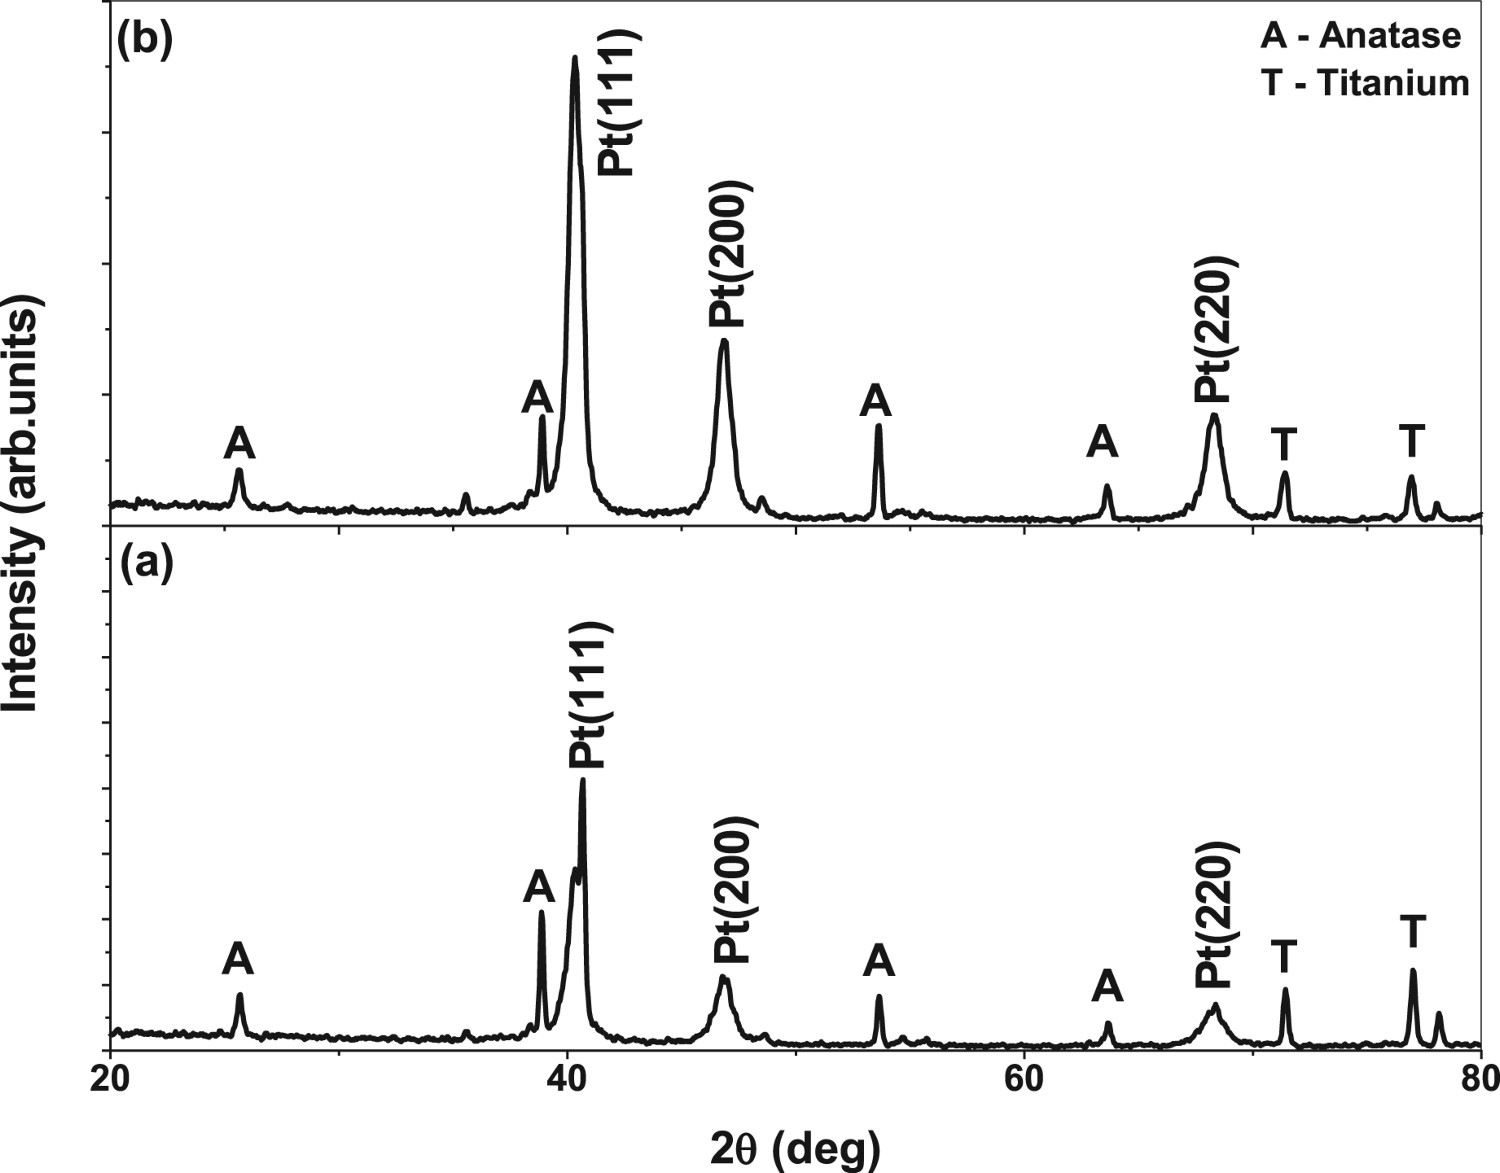
To throw more light on the composition of the surface elements present on the PTNT coupon after exposure in simulated dissolver solution, XPS studies were carried out. XPS spectra of the surface films exhibited peaks corresponding to chromium (Cr 2p), platinum (Pt 4f), molybdenum (Mo 3d), titanium (Ti 2p), tin (Sn 3d), ruthenium (Ru 3d), nitrogen (N 1s), carbon (C 1s) and oxygen (O 1s). The spectra of all the surface elements detected are shown in Figure 8 and the corresponding binding energy values of their chemical states are given in Table 1. The de-convoluted Cr 2p spectra (Figure 8(a)) showed one set of doublet peak at the respective binding energy values (Table 1), corresponding to Cr existing in +3 oxidation state (Cr2O3) [29]. In case of the de-convoluted Pt 4f region, two doublet peaks were fitted as shown in Figure 8(b). The doublet peaks were corresponded to that of Pt in metallic state and in +4 oxidation state (PtO2) with respect to their binding energies [30]. The de-convoluted peaks in both Mo 3d (Figure 8(c)) and Sn 3d regions (Figure 8(e)) each showed one set of doublet peak respectively corresponded to +6 oxidation state (MoO3) [30] and +4 oxidation state (SnO2) [31]. The de-convoluted high-resolution spectra in the Ti 2p region exhibited three peaks as shown in Figure 8(d). The peak observed at the binding energy value at 463.2 eV corresponding to Ru 3p3/2 photoelectron peak [32] which has been overlapped in the Ti region. The other one set of doublet peak with respect to the binding energies shown in Table 1, corresponded to Ti in +4 oxidation state (TiO2), [33]. Interestingly, the de-convoluted high-resolution spectra in Ru 3d + C 1s regions exhibited seven peaks as shown in Figure 8(f). There are two sets of doublet peaks for Ru 3d in the region between 280 and 288 eV, corresponding to the doublet peaks for Ru (+4) 3d5/2, 3d3/2 and their satellite peaks [34]. The other peaks with binding energies of 284.5, 285.9, 287.5 and 288.5 eV were assigned to carbon bonded with C–C/C–H, C–OH/C–N, C=O and COOH group, respectively [35]. Similarly the de-convoluted N 1s spectra showing two peaks with the binding energy values of 398.2 and 400.6 eV were assigned to nitrogen bonded with C–N=C and (N=C–)/(C–N–H), respectively [36,37]. The de-convoluted O 1s peak at the binding energy value of 530, 531, and 532.8 [38], respectively, originated from the oxygen bonded to metal (O–Pt/Cr/Mo/Ti/Sn), oxygen bonded to metal in hydroxide form (HO–Fe), oxygen in H–O–H/O=C– form.
XPS spectra of the de-convoluted peaks of all the elements detected on the PTNT surface after exposed in SDS for 1185 h. (a) Cr 2p, (b) Pt 4f, (c) Mo 3d, (d) Ti 2p, (e) Sn 3d, (f) Ru 3d + C 1s, (g) N 1s and (h) O 1s. Calculated atomic concentration of the elements present on the PTNT coupon after exposure in simulated dissolver solution for 1185 h at 110oC.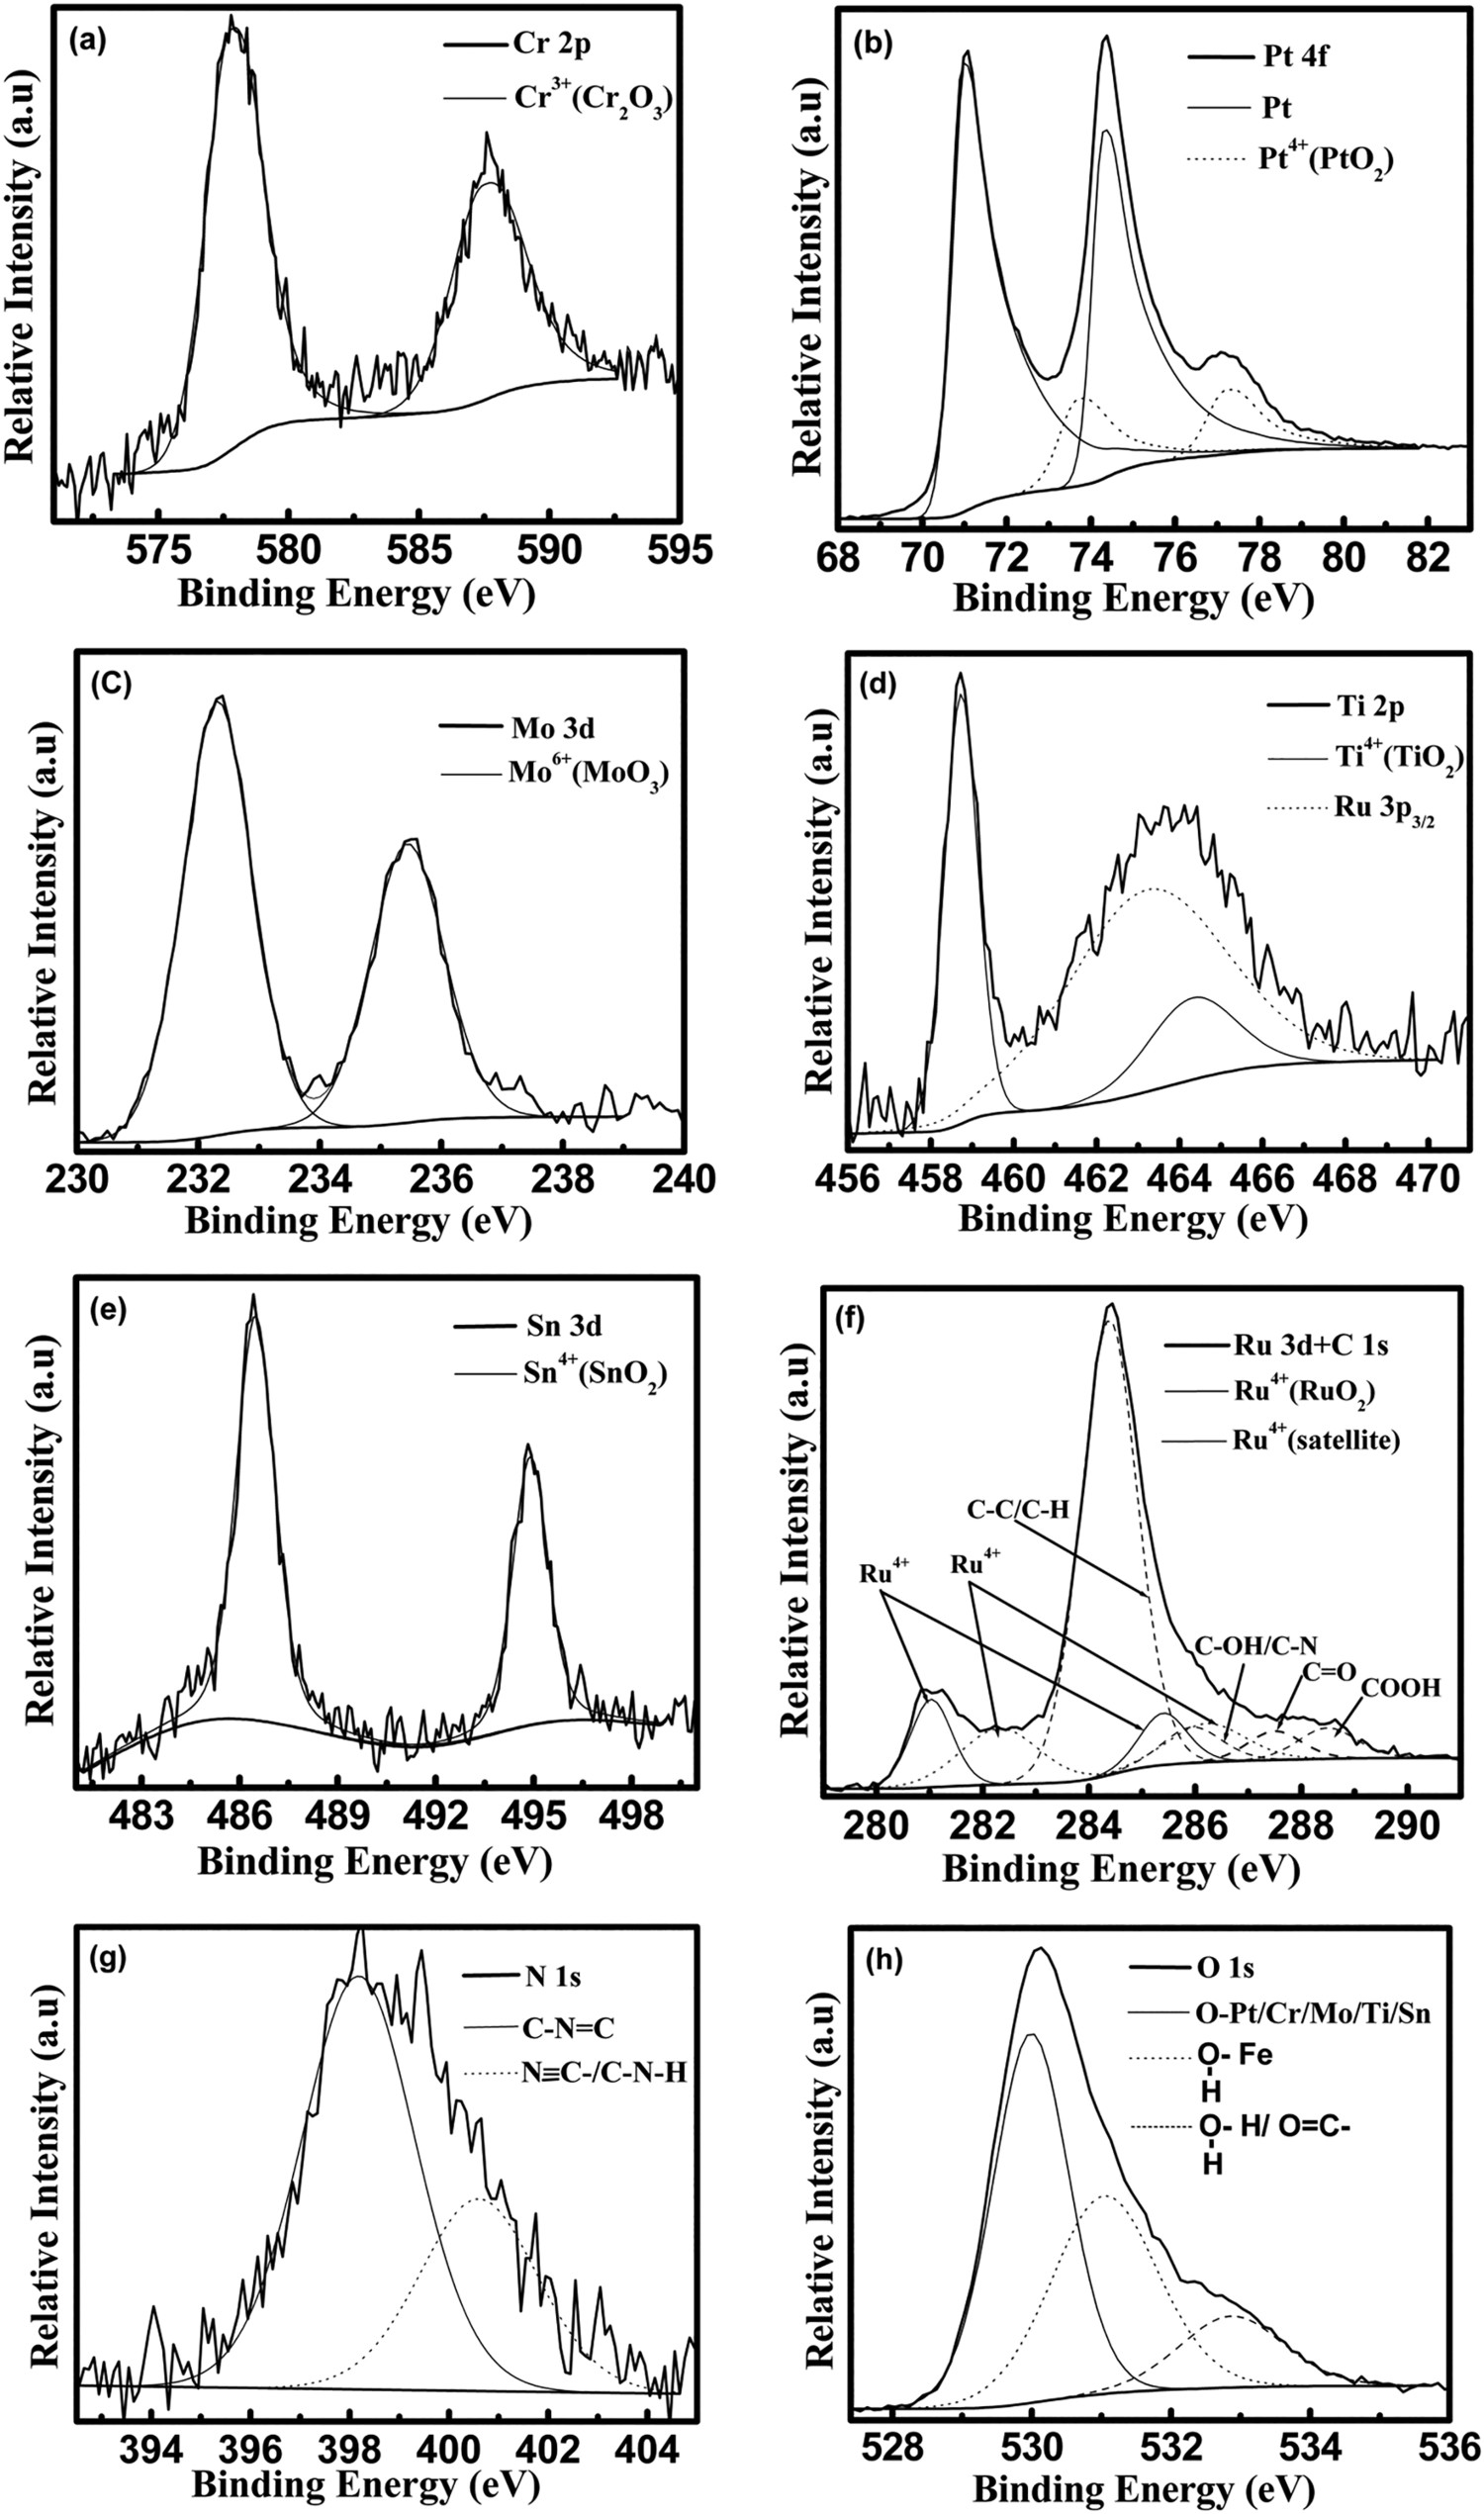
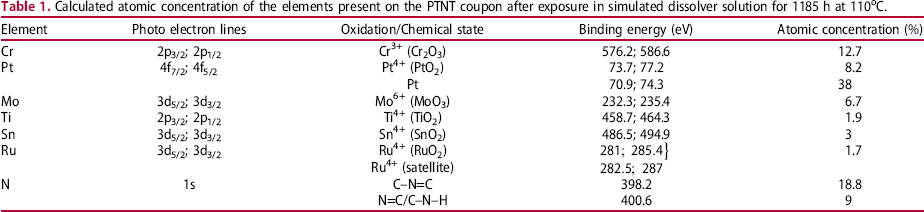
To obtain the relative atomic concentration of the surface elements with its chemical states, quantitative analysis was carried out based on area measurements under each de-convoluted peaks and were corrected for the sensitivity factor of the respective orbital in an element. For quantitative analysis calculation, both carbon and oxygen elements were excluded in the XPS spectra due to adventitious. The cumulative oxide concentration as shown in Table 1 was about 34.2% and the rest being platinum metal (38%) and nitrogen concentration (27.8%).
Comparison of binding energy values of Pt 4f core level and Ti 2p from different substrates.
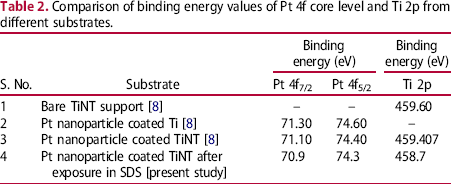
The comparison of the XPS spectra of Pt from Pt nanoparticle coated titanium substrate, Pt nanoparticle coated TiNT and Pt nanoparticle coated TiNT after exposure in SDS for 1185 h is shown in Figure 9. Rasmi et al [19] has shown that a shift to lower binding energies of Pt nanoparticle loaded TiNT with respect to Pt nanoparticle loaded Ti was attributed to higher electronic transfer or charge transfer between Pt and TiO2 support and this is responsible for the enhanced electrocatalytic activity despite higher loading on the surface of Pt nanoparticle on Ti electrode. The spectra of Pt nanoparticle coated TiNT before and after exposure (Figure 9) show that the shift towards the lower binding energy side is slightly enhanced (0.2 eV) even after 1185 exposure. The further reduction in binding energy values after exposure in simulated dissolver solution suggests that the electrocatalytic activity of PTNT remains uncompromised which is a good indication as the PTNT will be used as an anode for cerium oxidation [17,18] in the simulated dissolver solution in the reprocessing plant.
Comparison of the XPS spectra of Pt from Pt nanoparticle coated titanium substrate, Pt nanoparticle coated TiNT and Pt nanoparticle coated TiNT after exposure in SDS for 1185 h.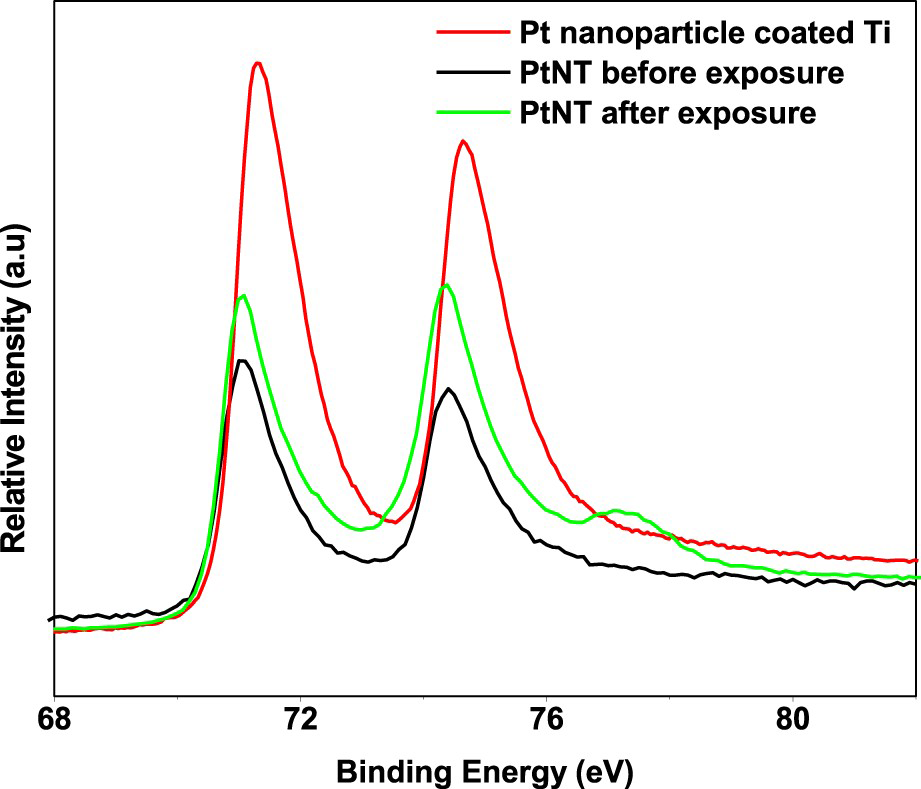
To further validate the electrocatalytic activity of PTNT after exposure, hydrogen adsorption–desorption studies were carried out in acidic electrolyte. The regions marked as I, II and III correspond to hydrogen adsorption–desorption on Pt surface, double layer region and oxygen region [43] in the cyclic voltammograms shown in Figure 10. The charge Q H obtained from the integrated intensity of the hydrogen adsorption–desorption peaks after eliminating the contribution from double layer and dividing by the scan rate is 12 and 6 mC cm–2 for PTNT after exposure and polycrystalline Pt sample respectively. It is worthy to note here that the Q H value for as prepared PTNT was reported to be 22 mC cm–2 [19]. Though there is a reduction in the Q H value after exposure in simulated dissolver solution for 1185 h, the electrocatalytic activity of PTNT is still better than that of polycrystalline Pt, clearly indicating the presence of Pt sites available for electrocatalytic activity and further confirms the electronic contact between Pt nanoparticles and titania nanotubes and the titanium substrate.
Cyclic voltammograms of PTNT before and after exposure in SDS and polycrystalline Pt in 1 M H2SO4.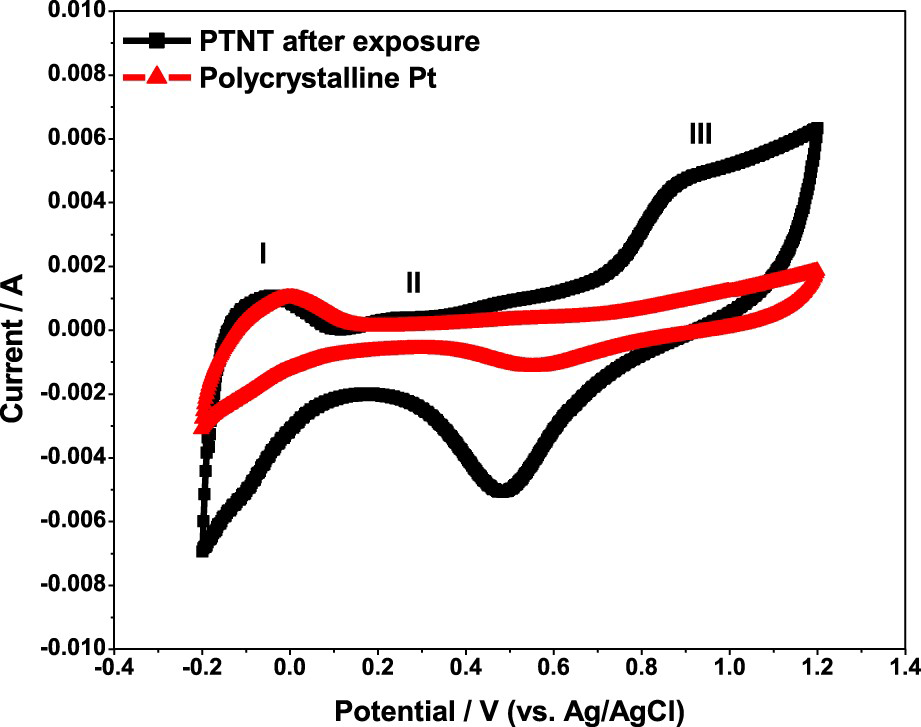
Conclusions
Pt nanoparticle coated titania nanotubes showed stability in 11.5 N nitric acid in simulated dissolver solution for a total duration of about 1185 h. Weight loss measurements indicated that the corrosion rate of the PTNT sample was 1.149 mpy after exposure in SDS at 110°C for about 1185 h. In general corrosion rates higher than 5 mpy is considered as a concern for titanium and hence this corrosion rate of electrode at simulated temperature is considered to be minimal. SEM images of the PTNT surface showed that the Pt nanoparticles were present on the surface with minimal peel off of the coating. Since Pt nanoparticles are coated on anodised Ti and hence in the areas where Pt is peeled off, the surface remains protected with the formation of anatase titania layer in highly oxidising nitric acid medium. Therefore, nano Pt layer on anodised Titanium protects the electrode from corrosion in the aggressive medium and enhances the electrocatalytic activity. Advanced chemical characterisation of surface by XRD and XPS showed dominantly metallic nano Pt on the surface which supports the retainment of electrocatlaytic activity even after 1185 h exposure in flowing SDS solution. The lower binding energy values for exposed PTNT surface compared to that of fresh PTNT surface noticed in XPS and better electrochemically active surface area of exposed PTNT compared to polycrystalline Pt indicate the durability of electrode after 1185 h in SDS at 110°C and the electrocatalytic activity of PTNT surface is retained.
Footnotes
Acknowledgements
The authors would like to acknowledge Shri. U. Veeramani for his help in conducting the exposure studies in nitric acid and Shri. T. Nandakumar for XRD characterisation.
Disclosure statement
No potential conflict of interest was reported by the authors.
Data availability
The raw/processed data required to reproduce these findings cannot be shared at this time due to technical or time limitations.