
Abstract
A wire beam electrode (WBE) method for investigating the crevice corrosion has been demonstrated by mapping non-uniform corrosion processes occurring on copper and copper alloys including the pure copper UNS No. C11000 (Cu), brass UNS No. C28000 (Cu–Zn alloy) and tin bronze UNS No. C51900 (Cu–Sn alloy) in mass 0.6% NaCl solution with the crevice spacings of d=103 μm and 206 μm. It was found that the sequence of three copper alloys in susceptibility for the crevice corrosion was that Cu–Zn alloy > Cu–Sn alloy > pure Cu. The average galvanic current of the Cu–Sn alloy in the covered region was changed from cathode to anode when the crevice spacing was increased to 206 μm. To sum up, it is feasible to study the behaviours of crevice corrosion within the different crevice spacings with the WBE method.
Introduction
Crevice corrosion is a natural and heterogeneous electrochemical process, generally occurring on the metal surface in the electrolyte, under the scale layer, in the gap or in the gap of the metal joints. It is also a special localised corrosion causing the failure of metal [1 3]. When crevice corrosion occurs, inevitably existing on the metal surface in the occlusion region, there is a distinct difference between the anodic and cathodic regions on the metal surface, and also different electrochemical reactions occur in the anodic and cathodic regions [4 6]. Almost as remarkably, crevice corrosion is of particular concern for copper alloys when in contact with chloride-containing solutions.
In general, the spacing of a crevice separates anodic and cathodic regions of corrosion system [7,8]. Therefore, the current moving through the electrolytic resistance between the anodic in the occluded site of crevice and the cathodic at the outer surface, produces an IR drop which has a correlation between the potential of the interior and exterior regions about the crevice [9–12]. Usually, it should be noted that this phenomenon could be affected by active-to-passive potential of the materials, crevice geometry, corrosion potential, galvanic current and solution conductivity.
Many researchers have studied the mechanisms of crevice corrosion and of which two mechanisms have been proposed to explain it, namely critical crevice solution (CCS) and potential drop mechanism [13,14]. For the CCS, the depletion of oxygen in the crevice may finally result in the acidification of crevice solution, causing the break-down of the passive film. For another theory, the consumption of oxygen leads to a potential drop in the crevice, which greatly accelerates the crevice corrosion.
Besides, to determine the sensitivity of crevice corrosion, the factors including the crevice geometry, pH value and Cl− level in the solution in a given alloy in affecting crevice corrosion resistance need to be defined [15 17]. In terms of raw materials, aluminium for the crevice corrosion in a pH=6, mass 0.6% NaCl solution was not found to occur under open circuit or polarised conditions, but there was a crevice corrosion observed in a pH=3 acidic solution [4 6]. In the numerical simulation about crevice corrosion process, the results indicated that the potential drop in a crevice consisted of two components: the chemical potential drop and physical potential drop, well proved by Chang et al. [12–15]. Moreover, it was observed that the values of potential drop in the primary stage of crevice corrosion may be negligible. An IR drop produced in the crevice is not a factor in affecting the occurrence of the pitting and initiation of the crevice corrosion of 316L stainless steel in Ref. [2,3]. Unfortunately, these researchers recognised in a limitation state because they merely concentrated on the final conditions that were generally accumulated from various complex and long-term factors affecting crevice corrosion [18 27]. Furthermore, the conventional electrochemical techniques have also major difficulties in studying this due to the reasons specified elsewhere [28,29]. After all, crevice corrosion is a common and insidious form of the localised corrosion occurring in the fissure or occluded region, such as under washers and at welding joints. Traditionally, the methods for crevice corrosion including the weight-loss measurement, visual and microscopic examination of corroded specimen, the simulated occluded cell method, micro-electrode and freezing methods, etc., have been studied and tested in the labs, which also can be extensively used to study crevice corrosion. These methods can provide valuable information regarding the mechanism of crevice corrosion. However, these researchers have not clearly delineated the process of crevice corrosion and have not made the sensitivity analysis for crevice corrosion under various crevice spacings [14].
Nowadays, the wire beam electrode (WBE) method has been widely used to study the corrosion behaviours of metals [29–32]. The remarkable features of WBE are to simulate the whole electrode with an array of wires acting as electrochemical sensors, which are suitable for the complex surface conditions. Tan et al. studied the localised corrosion and other heterogeneous electrochemical processes using the WBE [18,21]. To evaluate the localised corrosion intensity, as noted in Ref., a new parameter namely the localised corrosion intensity index has been employed by the WBE method. To our knowledge, it has a considerable advantage to study the corrosion behaviours of copper and copper alloys by employing the WBE method due to their complex surfaces.
Therefore, the objectives of this work are to examine the applicability of the WBE method in the study of crevice corrosion under artificial crevice conditions, and to study the corrosion behaviours of three copper alloys, pure copper UNS No. C11000 (Cu), brass UNS No. C28000 (Cu–Zn) and tin bronze UNS No. C51900 (Cu–Sn) in mass 0.6% NaCl solution using WBE. The effects of crevice spacing and sensibility of copper alloys on crevice corrosion were quantitatively discussed. It is expected that this technique could enable the understanding of the crevice corrosion mechanisms of copper and copper alloys in chloride solution.
Experimental procedures
The experimental configuration is shown in Figure 1. Figure 1 shows that to enable the in situ visualisation of electrochemical processes occurring on the surfaces of copper and copper alloys under crevice conditions, the WBE method was employed in this work. The chemical compositions and annealing conditions of these alloys are given in Table 1. The wires sealed in epoxy resin were insulated from each other and were acted as corrosion substrates with a diameter of 1.0 mm and wire spacing of 2.0 mm. The distribution of these wires in the WBE is annealed, as shown in Figure 1(a). The total effective working electrode area (the area exposed by these wires) was approximately 0.79 cm². The shaded portion in the figure was the coverage region, and the WBE was fixed in the environmental cell. Glass sheets with different thicknesses were placed at the four corners of the electrode surface to form two spacings of crevice (d=103 μm and 206 μm), as shown in shaded location in Figure 1. The chloride solution (mass 0.6% NaCl) was then injected into the cell until the gap was completely filled in solution. When a test completed, the working surface of the WBE was polished and cleaned with ethanol and isopropanol.
Schematic diagram of WBE in cevive corrosion (a) and crevice corrosion in electrode testing system (b). The composition and annealing conditions of copper and copper alloys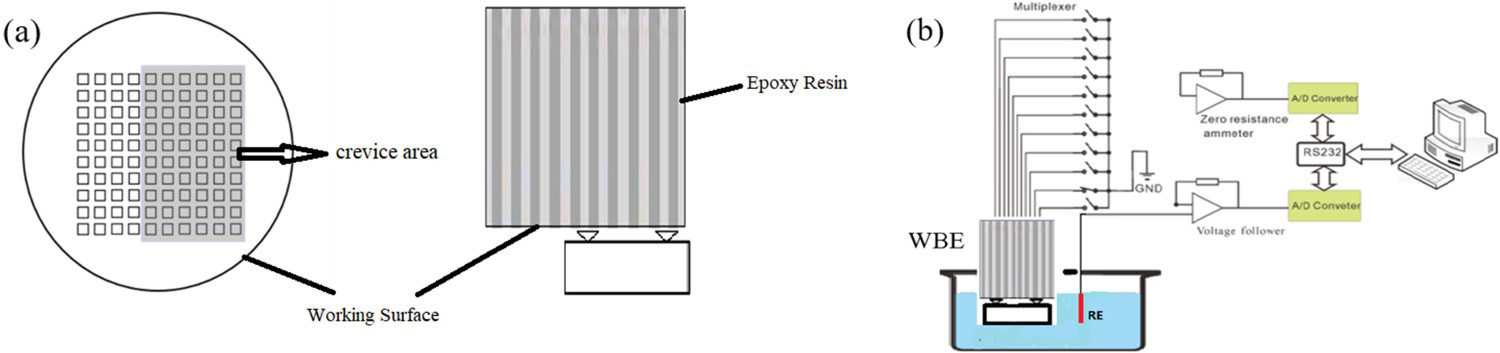
During immersion, all the wire terminals of the WBE were connected together which ensured that electrons moved freely between wires, simulating the electrochemical behaviour of a entire electrode. Corrosion potential and current maps were measured continuously during the exposure of the WBE surface to corrosion solution. Corrosion information was gathered for 5 min after the WBE was immersed in the mass 0.6% NaCl solution. Corrosion potential distribution map was obtained by sequentially measuring the open circuit potential of each wire against a standard calomel reference electrode (SCE), and an automatic computer control switch device. The electrode array connections were managed by an automatic switcher programmed to connect the selected electrode to other electrode and the remaining 99 electrodes to wire 1 (switching once every second). In this way, the current distributions over the whole electrode array were measured by a scan every 100 s. Measurements of corrosion potential and galvanic current distribution maps were performed alternately during the duration (usually 48 h). Electrochemical tests were conducted using the wire electrode potential current scanner CST520 (manufactured by Wuhan Corrtest Instruments Corp., Ltd., China). All electrochemical tests were performed in the mass 0.6% NaCl solution consisting of deionised water and purified sodium chloride. A three-electrode electrochemical cell with copper alloys as a working electrode, a saturated calomel electrode (SCE) as a reference electrode and a platinum electrode as auxiliary electrode were made. The potential and current distribution maps were drawn with OriginPro 2016 software. The labels of X- and Y-axes in figures represented the column and row number of the micro-electrode in WBE, respectively. In addition, the microstructures and corrosion morphologies were observed using a scanning electron microscopy (SEM, ZEISS) with an acceleration voltage of 9 kV. Each group of experiment was carried out three times to obtain accurate results.
Corrosion potential and galvanic current distribution maps
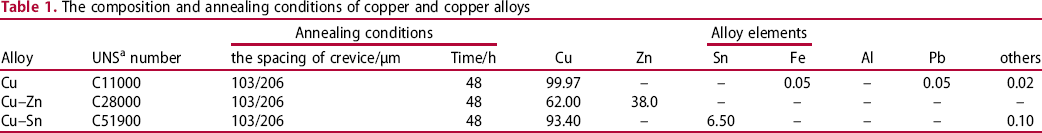
The immersion experiments were established by setting a pretreatment WBE to an electrochemical cell containing mass 0.6% NaCl solution with two crevice spacings (d=103 μm and 206 μm). The great differences discovered after analysing the maps of corrosion potential and galvanic current distribution were mainly attributed to a small corrosion rate, showing a good ability of corrosion resistance of the Cu alloy. Besides, under two crevice spacings, there were distinct corrosion behaviours in terms of three Cu alloys. Moreover, significant numerical differences in the corrosion potential and galvanic current distribution in the areas of Cu alloys also existed. At the same time, the correlation between corrosion potential and galvanic current distribution maps clearly suggested that the corrosion behaviours in different crevice corrosion systems were different at any crevice spacing, most probably attributed to the crevice spacing and compositions of some corrosion products deposited on the WBE surface. In principle, these maps revealed that the content of galvanic current increased with decreasing the corrosion potential behaved as the tendency of corrosion. The red rectangle, given in Figures 2–7, was the coverage region by glass sheet. Figure 2 shows the corrosion potential and galvanic current distribution maps of WBE in the mass 0.6% NaCl solution with the crevice spacing of d=103 μm for the Cu alloy during crevice corrosion process. At the initial stage, it was obvious that the most positive corrosion potential was the crevice area as shown in red rectangle selection, but the most negative potential was in the other regions without being covered shown in the corrosion potential distribution map of Figure 2(a1). It is showed that the Cu alloy without being overlaid as anode was easier to be corroded, and Cu in the crevice location behaved as cathode possessed the highest corrosion resistance in a short time as evidenced in Figure 2(a2). With the development of the corrosion process as illustrated in Figure 2(b1-2d2), the Cu outside of crevice still was taken as the anode, which kept the maximum anodic current. Meanwhile, the red rectangle portion of the Cu behaved as a cathode and was protected by the rest of the WBE. It is noted that the anodic region has experienced a gradually expanding process, most attributed to the presence of the potential differences inside and outside the crevice. It is also shown that the crevice corrosion will not happen to Cu alloy under the crevice spacing of d=103 μm. It is evident that the covered zone was protected in a degree of crevice gap as the cladding played a role the coating which blocked or retarded the transport of corrosive electrolyte to the Cu surface.
The corrosion potential (a1,b1,c1,d1) and galvanic current (a2,b2,c2,d2) distribution maps in mass 0.6% NaCl solution during the immersion process of crevice corrosion (d=103 μm) on the Cu alloy: (a1,a2) immersed in the initial stage, (b1,b2) immersed for 8 h, (c1,c2) immersed for 16h, (d1,d2) immersed for 32 h and (i,f) immersed for 48 h.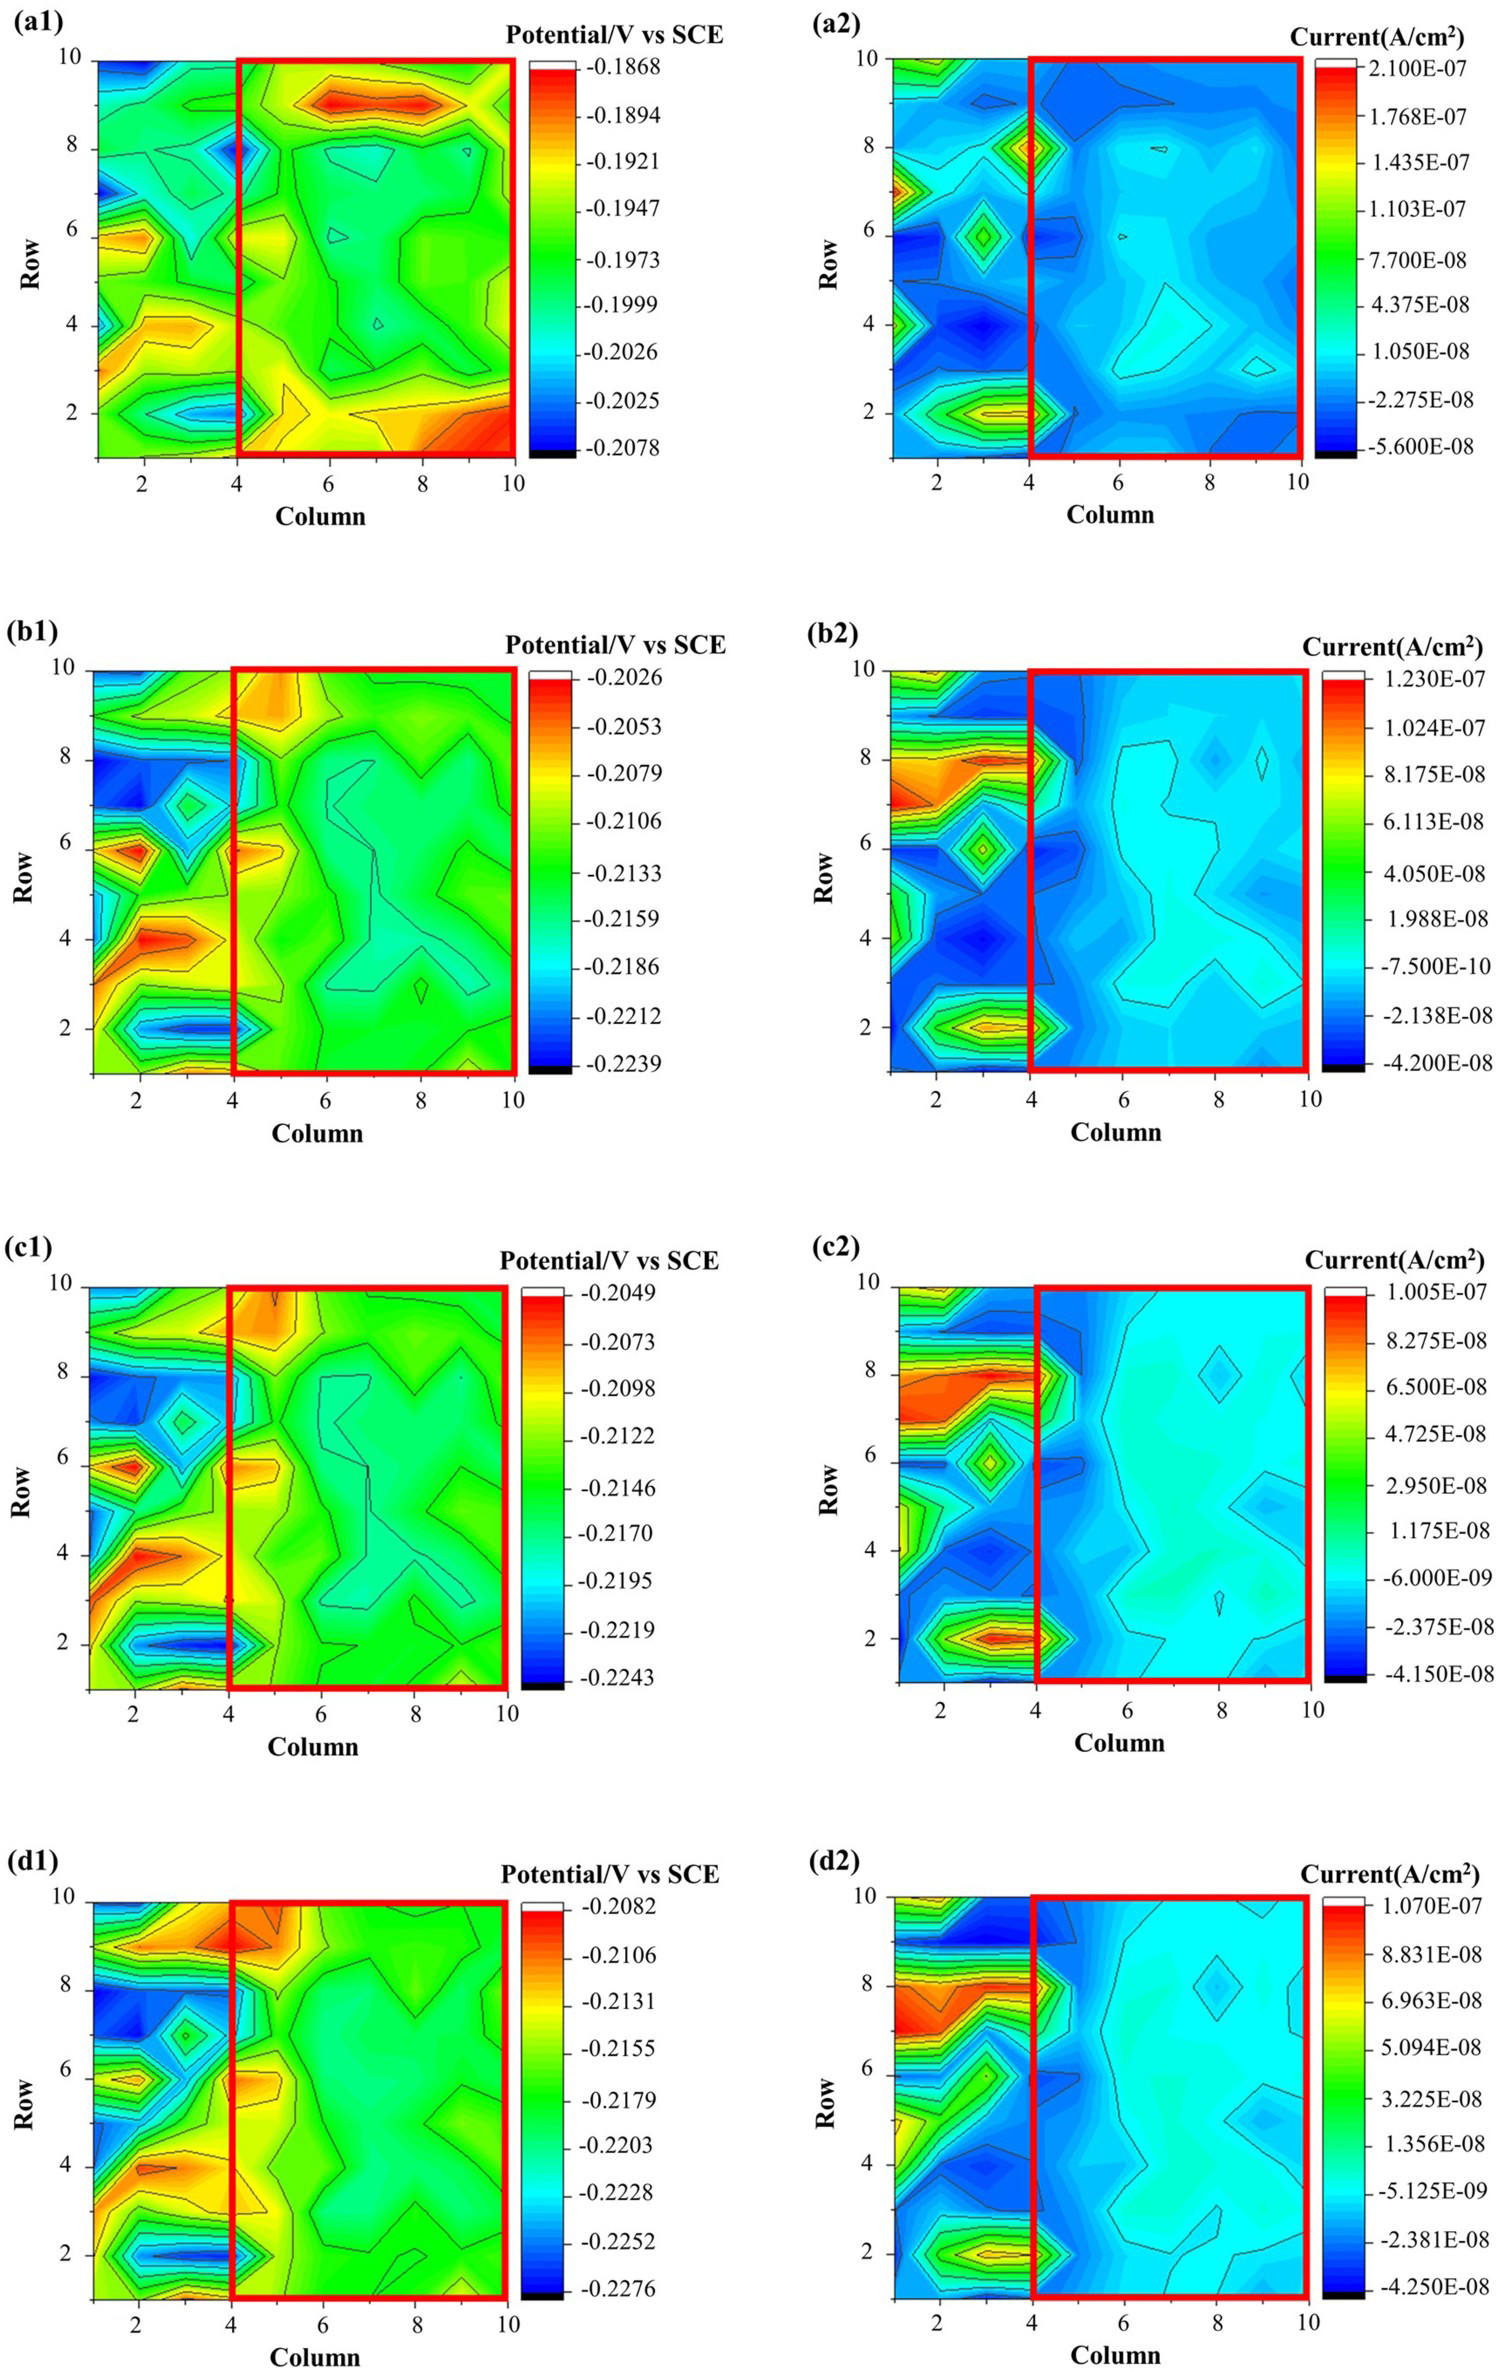
With increasing the crevice spacing to 206 μm indicated in Figure 3(a1–d2), the corrosion characteristics of the Cu alloy keep stable same to those in crevice spacing of d=103 μm when the increment of crevice clearance is observable at the time. In other words, the corrosion behaviour was mainly concentrated outside the crevice area, and the zone of corrosion did not change with increasing the size of the crevice spacing in the range of 103∼206 μm for the Cu alloy.
The corrosion potential (a1,b1,c1,d1) and galvanic current (a2,b2,c2,d2) distribution maps in mass 0.6% NaCl solution during the immersion process of crevice corrosion (a=206 μm) on the Cu: (a1,a2) immersed in the initial stage, (b1,b2) immersed for 8 h, (c1,c2) immersed for 16 h, (d1,d2) immersed for 32 h and (i,f) immersed for 48 h.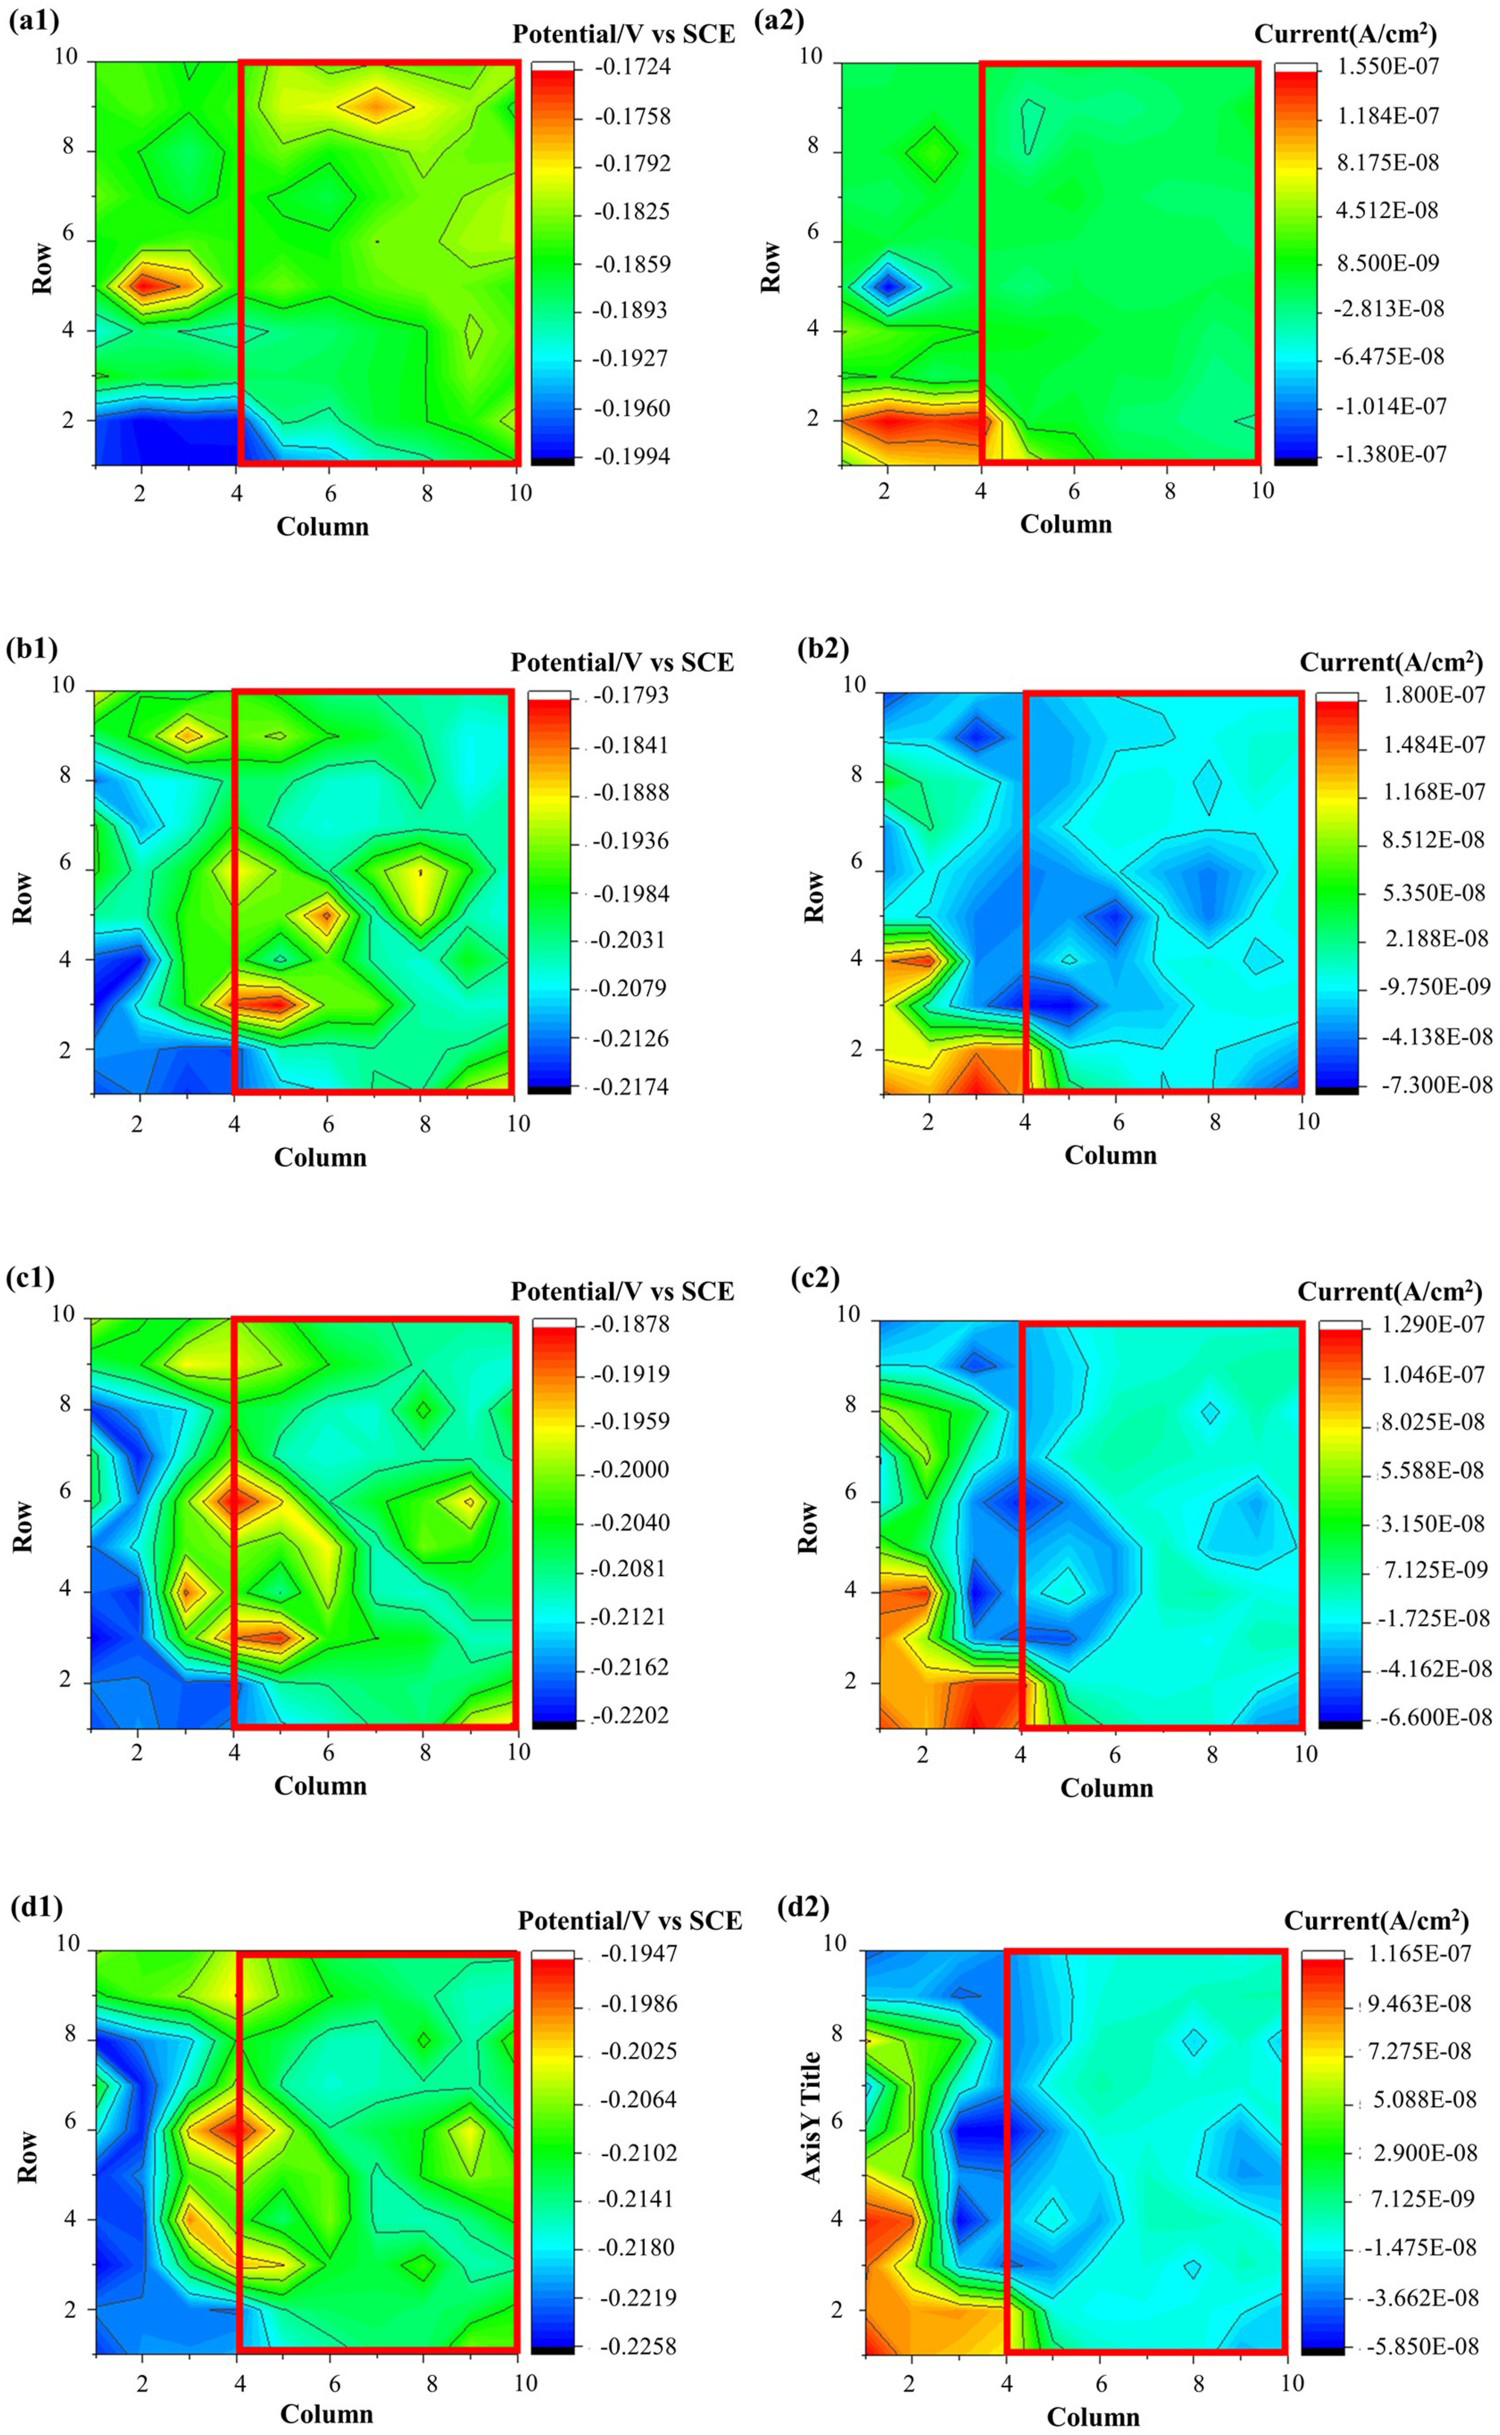
For the Cu–Sn alloy, the crevice corrosion behaviours containing the corrosion potential (a1,b1,c1,d1) and galvanic current (a2,b2,c2,d2) distribution after immersion in mass 0.6% NaCl solution under the spacing of d=103 μm were shown in Figure 4(a1–d2). They consist of two sections (anodic corrosion field and cathodic protection region). It can be found that the potentiodynamic behaviour shows an anode potential region and a cathode potential due to crevice. Comparison of external and internal behaviours of the crevices indicated that in the different regions of the crevice, the measured current differed greatly with multiple orders of magnitude. Based on Figure 4(a1–d2), it can be said that crevice corrosion was successfully initiated and propagated on the surface belonging to the exposed area at first. With the continuous corrosion process, the domains on the juncture of crevice were gradually corroded shown in Figure 4(b2–d2).
The corrosion potential (a1,b1,c1,d1) and galvanic current (a2,b2,c2,d2) distribution maps in mass 0.6% NaCl solution during the immersion process of crevice corrosion (d=103 μm) on Cu–Sn alloy: (a1,a2) immersed in the initial stage, (b1,b2) immersed for 8 h, (c1,c2) immersed for 16 h, (d1,d2) immersed for 32 h and (i,f) immersed for 48 h.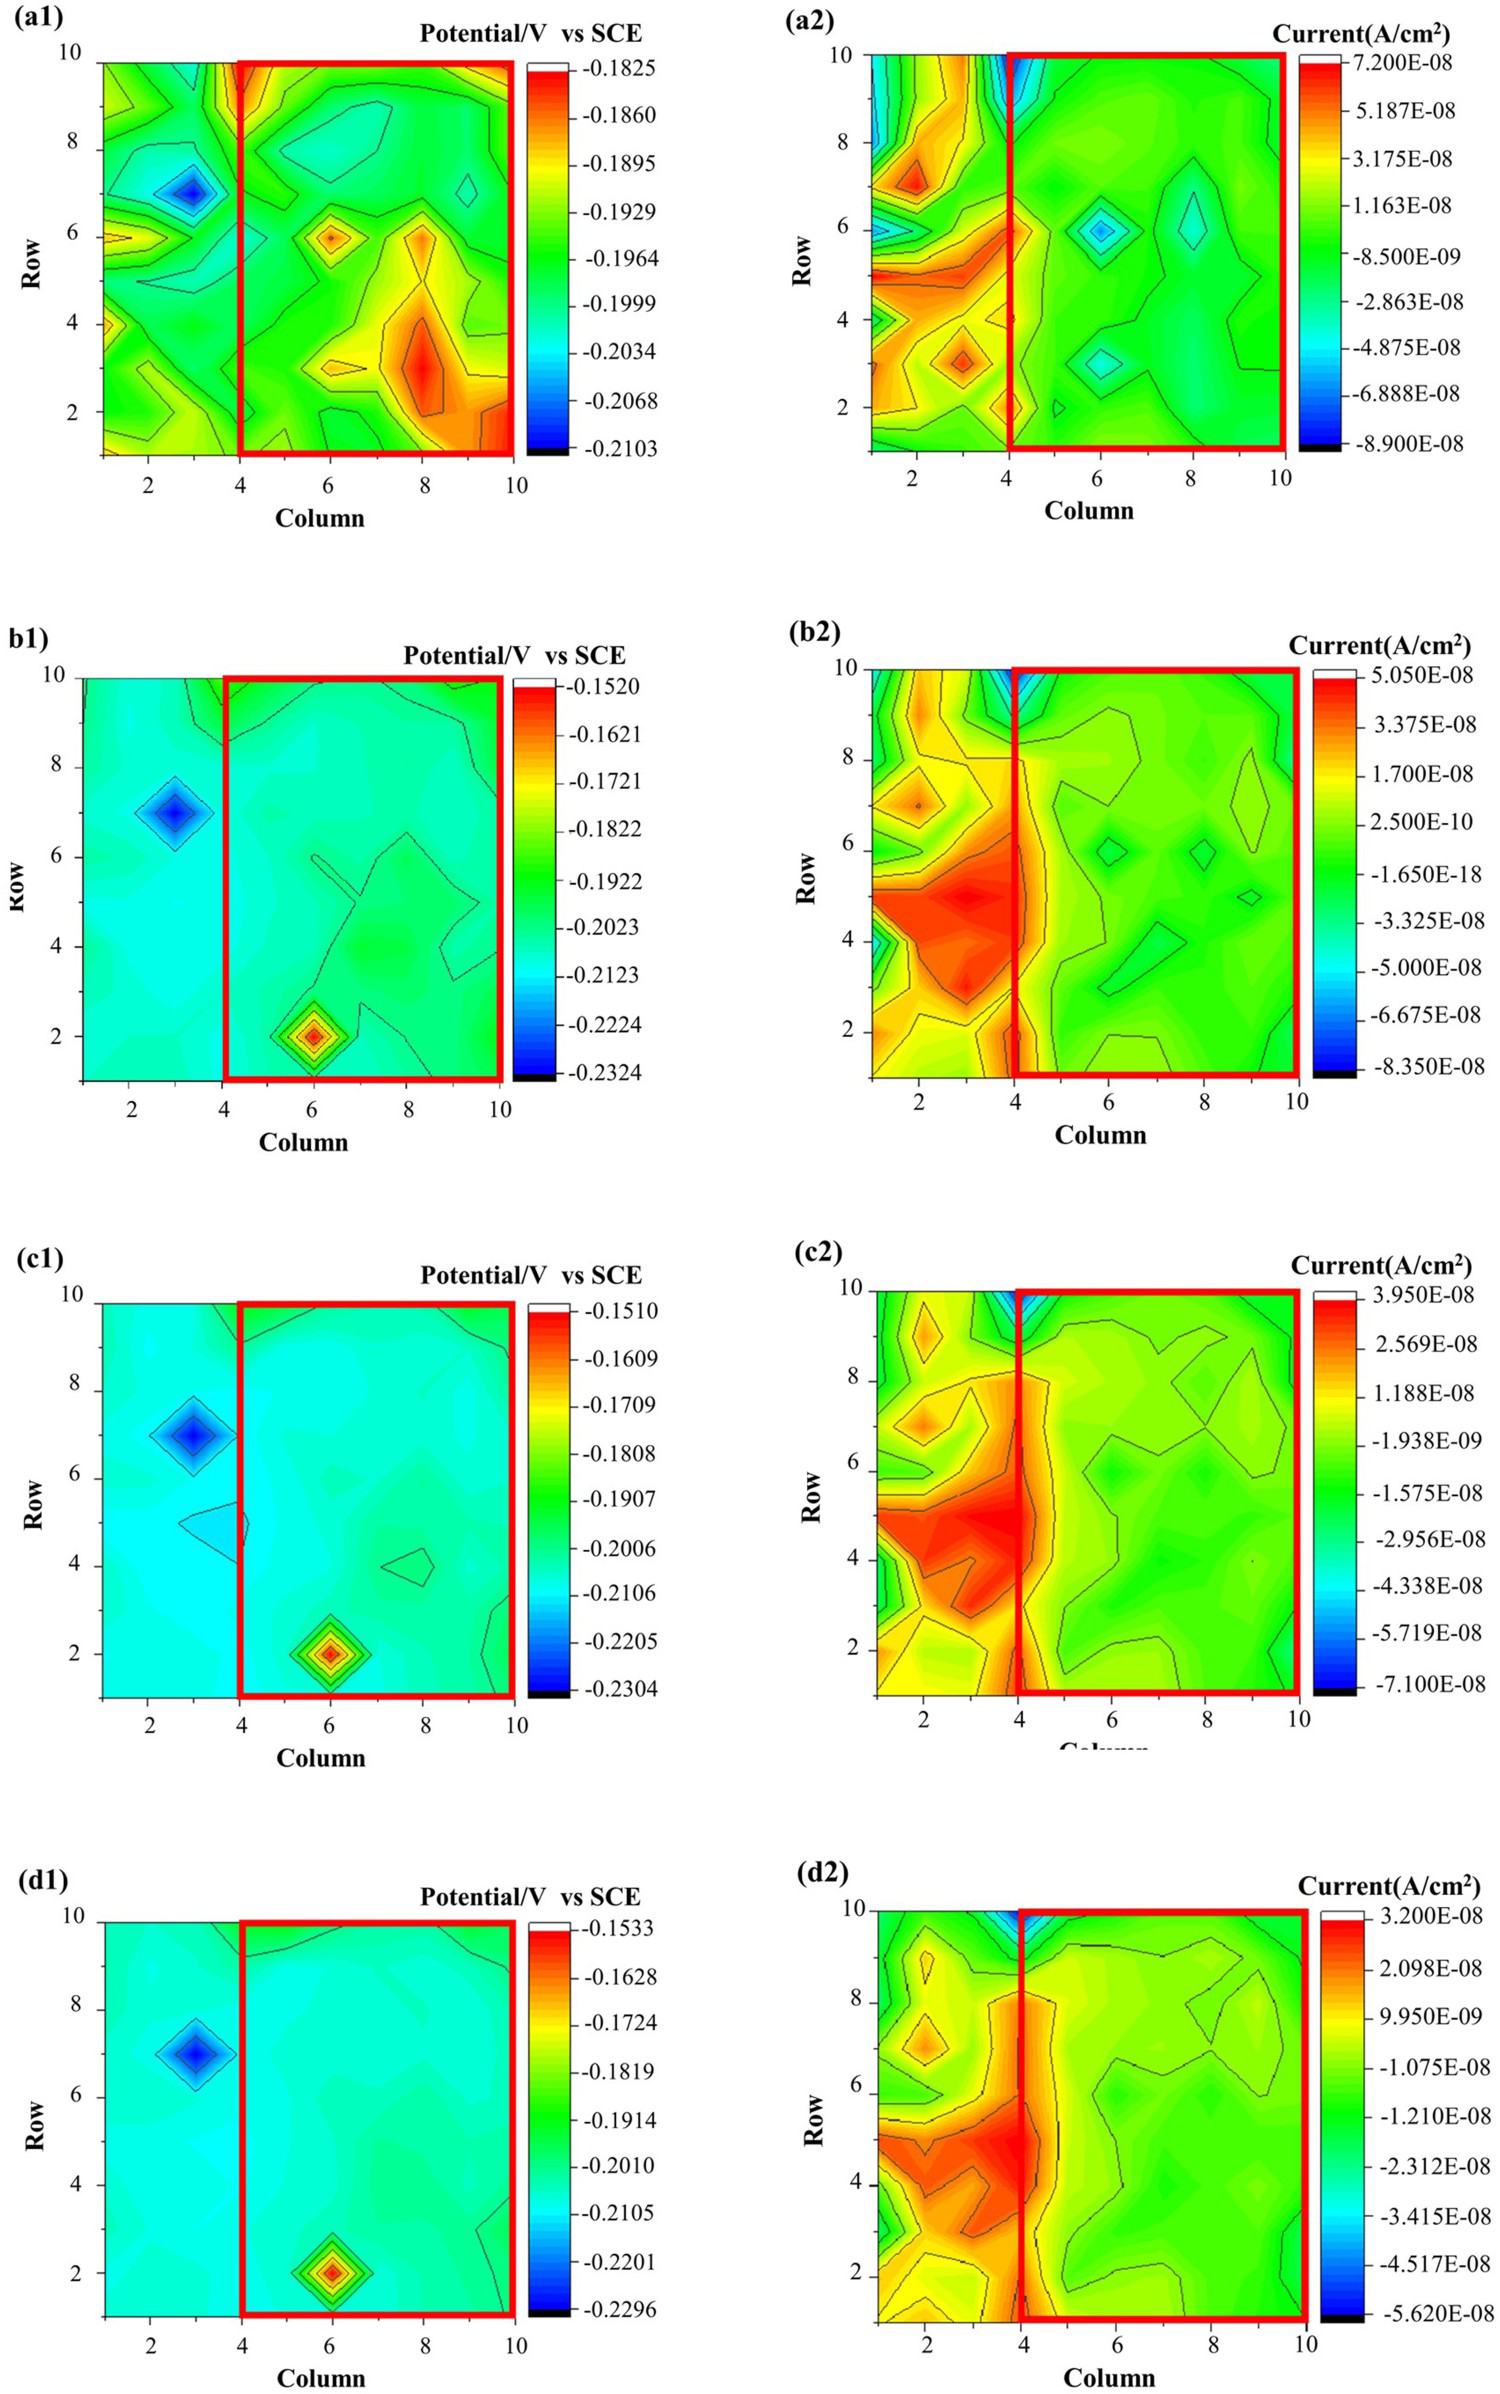
For a better understanding of Cu–Sn alloy, its performance of crevice corrosion was evaluated by the WBE experiments under the crevice spacing of d=206 μm. There appears to be increasing changes for the corrosion potential and galvanic current distribution in a more unstable stance. At the initial stage shown in Figure 5(a1–a2), the uncovered zone turned into cathode and exhibited relatively more positive potential than other areas while most of coverage region behaved as the anode. In particular, with increasing the impregnation time, Figure 5(b2–d2) displayed the maximum anode current from the juncture distance of about 10 mm. The reason can be attributed to the environmental differences in various locations. That is to say, more corrosion products diffused into the crevice to increase the conductivity of the solution, and further ions were released into the solution, resulting in the active area enlarged within the crevice. Proceeding with this process, the metal cations moved towards the inside of crevice. These cations also underwent the process of rapid hydrolysis to lower the pH value and to increase the corrosion current in both active and passive regions. This increase in passive current towards the crevice mouth decreased the electric potential of the solution (and surface overpotential) at crevice juncture due to Ohmic considerations, decreasing current produced at active areas at the juncture.
The corrosion potential (a1,b1,c1,d1) and galvanic current (a2,b2,c2,d2) distribution maps in mass 0.6% NaCl solution during the immersion process of crevice corrosion (d=206 μm) on Cu–Sn alloy: (a1,a2) immersed in the initial stage, (b1,b2) immersed for 8 h, (c1,c2) immersed for 16 h, (d1,d2) immersed for 32 h and (i,f) immersed for 48 h.
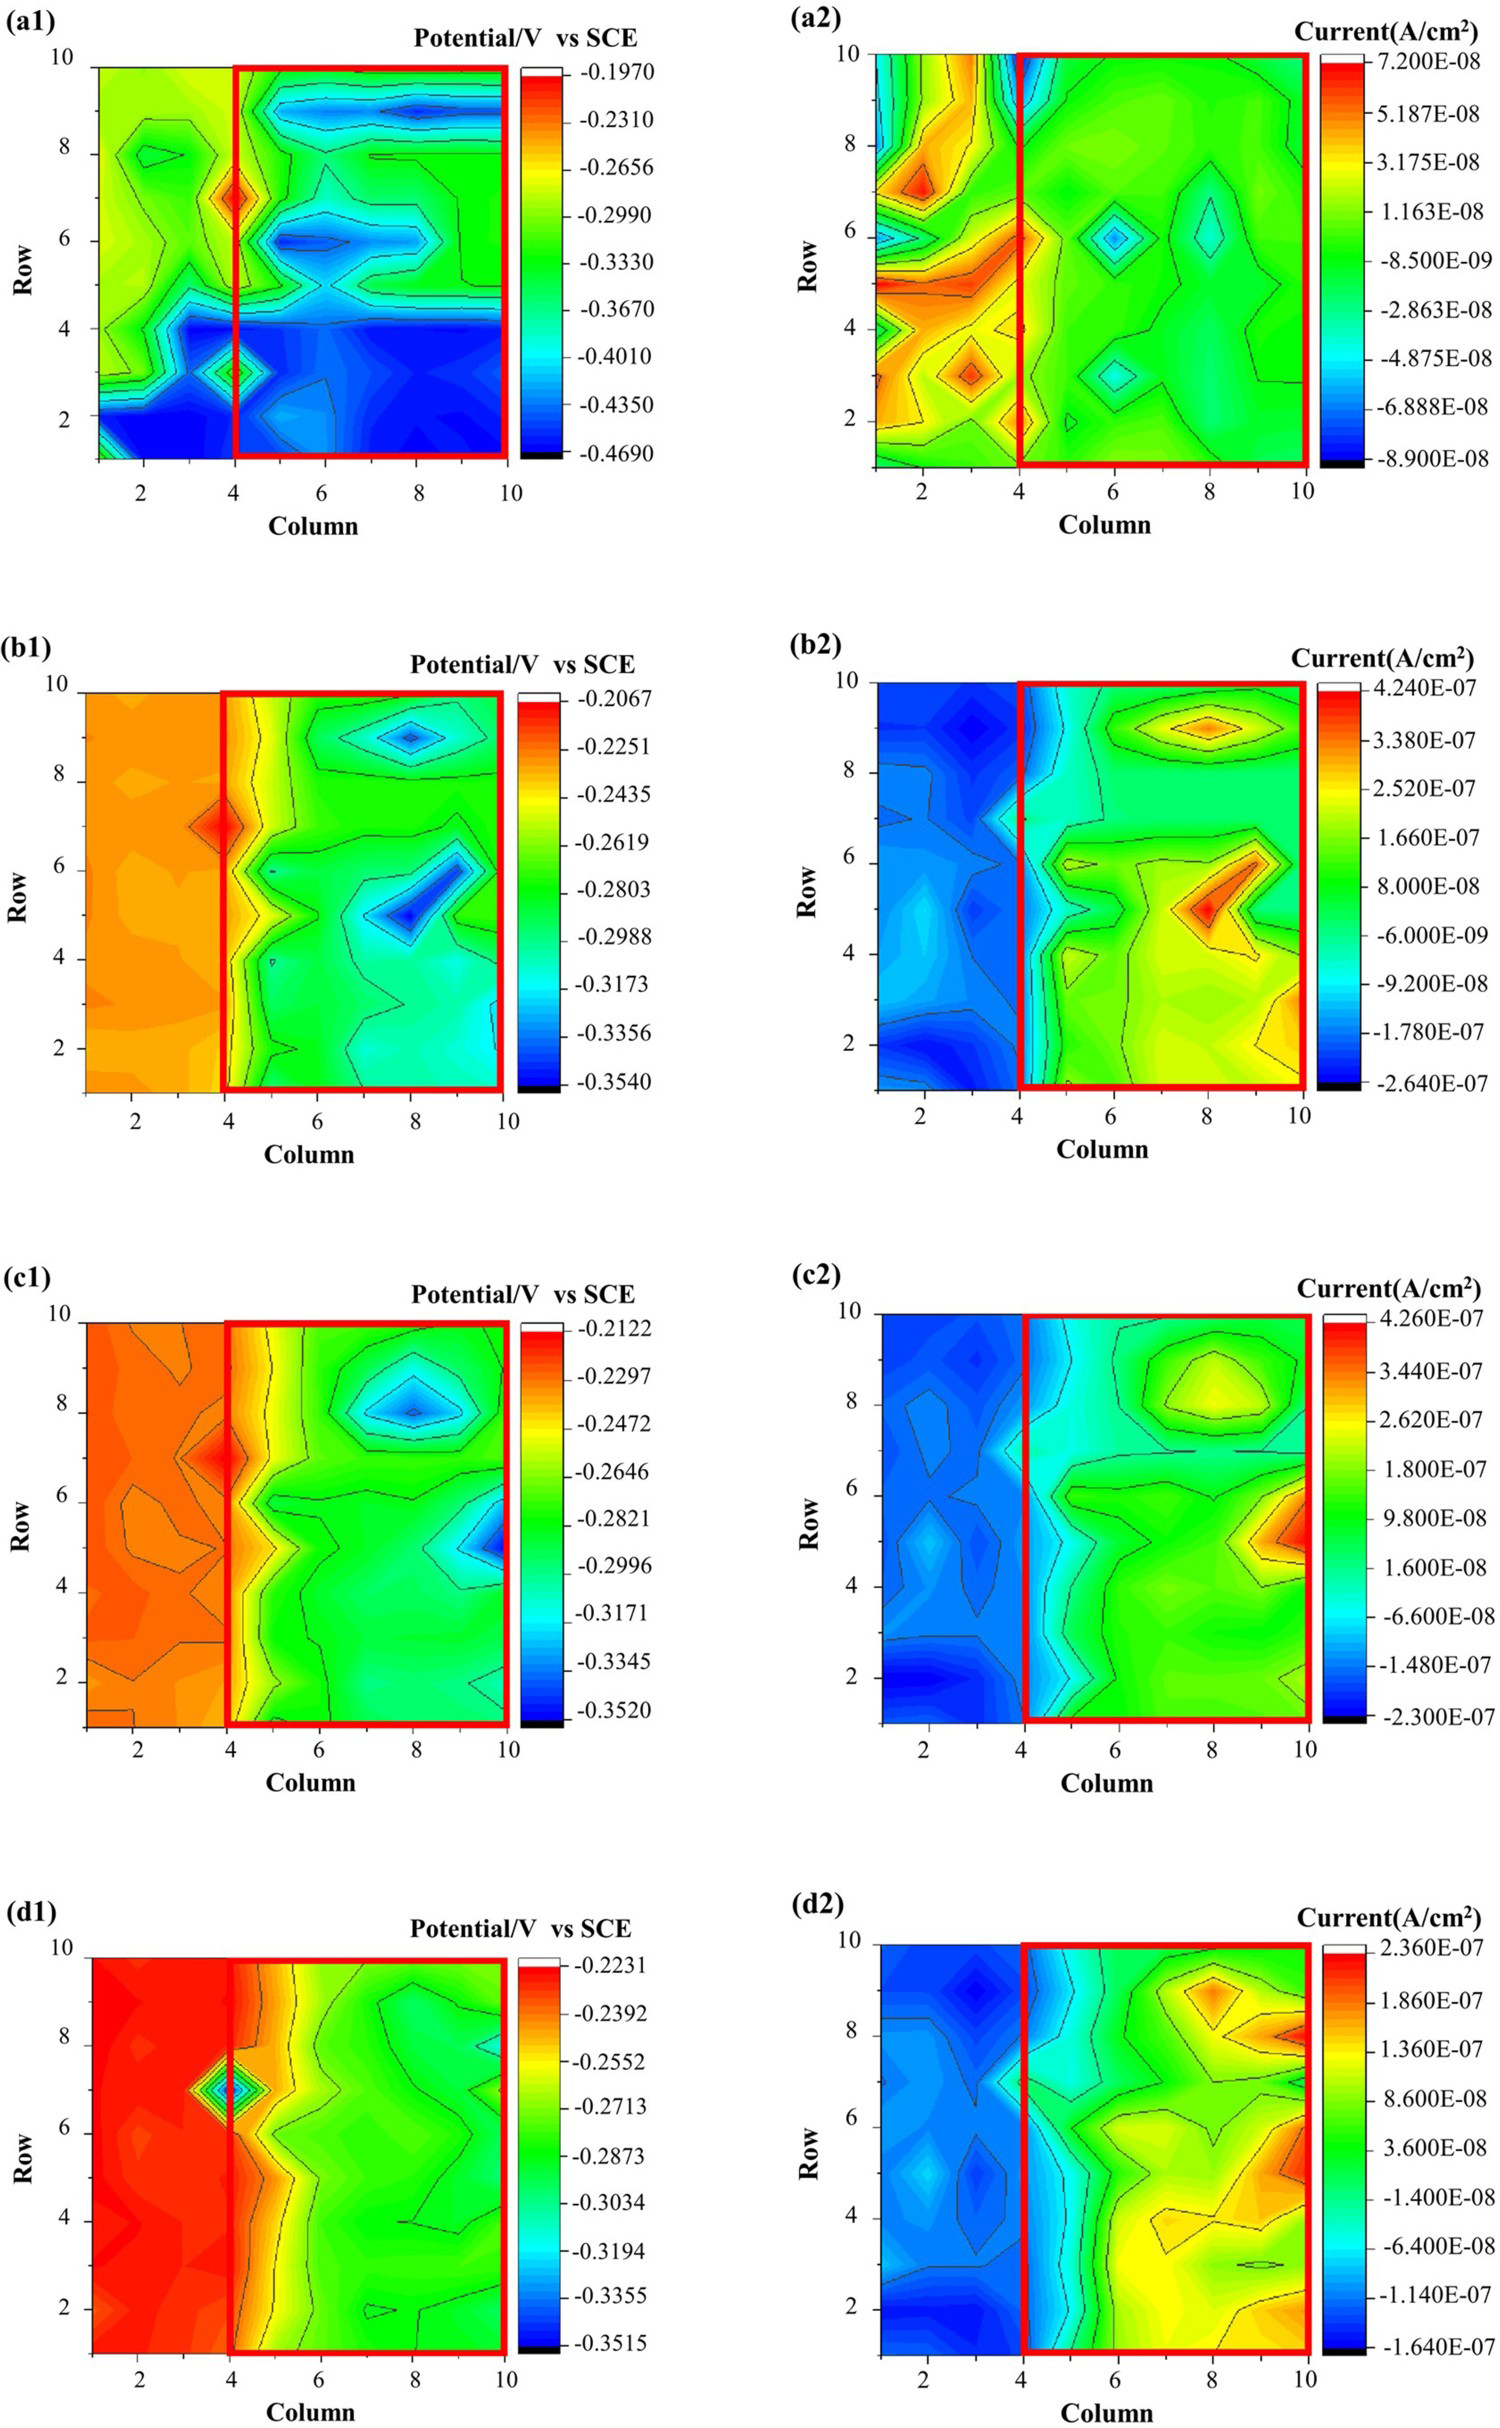
When the corrosion behaviour of Cu–Zn alloy was studied under the crevice spacing of d=103 μm, it existed a phenomenon observed similar to that of the Cu–Sn alloy under d=206 μm shown in Figure 6(a1–d2). It can be observed that the average galvanic current increased with the shift towards the negative direction of average corrosion potential, in good accordance with the principle of electrochemical corrosion. These regions of the alloy in the crevice could be regarded as the anode while the remaining regions of the alloy were acted as the cathode during the immersion process of 48 h. Moreover, it is evident that the difference between two crevice spacings was small after comparison of Figures 6 and 7. Based on these figures, the corrosion distributions under the crevice spacings of d=103 μm and 206 μm were nearly same.
The corrosion potential (a1,b1,c1,d1) and galvanic current (a2,b2,c2,d2) distribution maps in mass 0.6% NaCl solution during the immersion process of crevice corrosion (d=103 μm) on Cu–Zn alloy: (a1,a2) immersed in the initial stage, (b1,b2) immersed for 8 h, (c1,c2) immersed for 16 h, (d1,d2) immersed for 32 h and (i,f) immersed for 48 h. The corrosion potential (a1,b1,c1,d1) and galvanic current (a2,b2,c2,d2) distribution maps in mass 0.6% NaCl solution during the immersion process of crevice corrosion (d=206 μm) on Cu–Zn alloy: (a1,a2) immersed in the initial stage, (b1,b2) immersed for 8 h, (c1,c2) immersed for 16 h, (d1,d2) immersed for 32 h and (i,f) immersed for 48 h.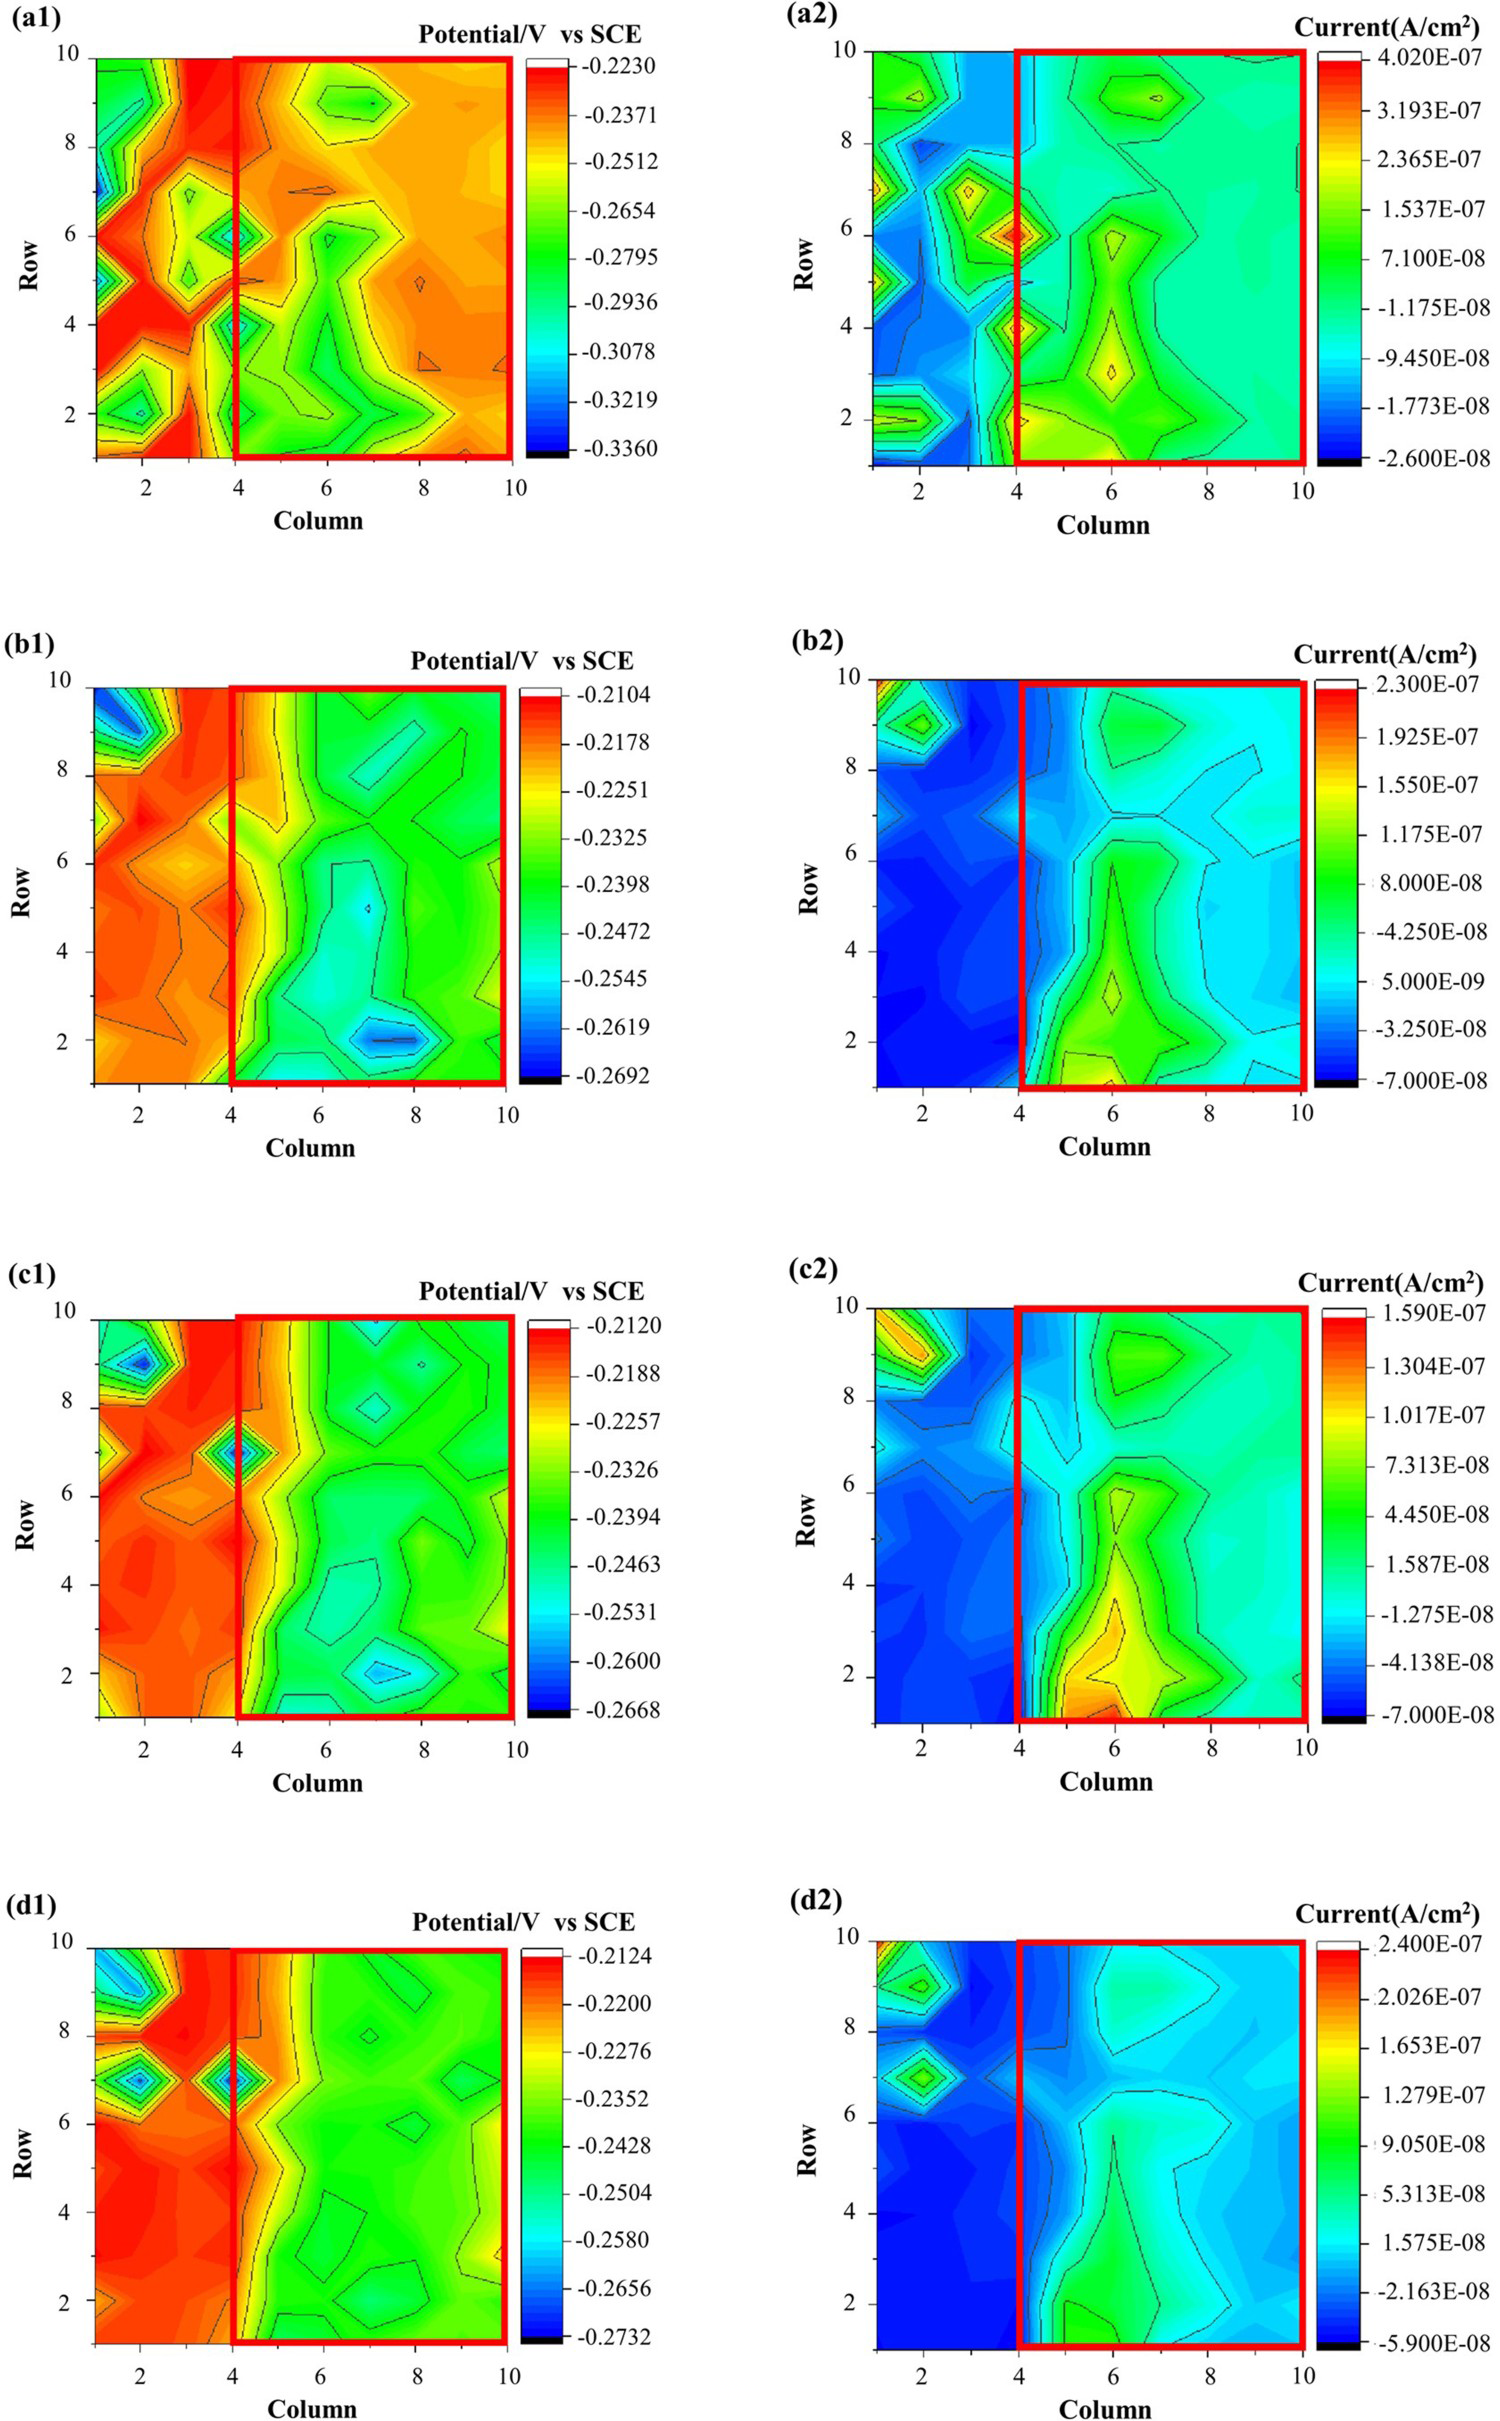
To obtain the accurate numerical variables of electrochemical parameters for different copper alloys in various temperature systems, a series of numerical statistical analyses based on average corrosion potential and galvanic current were applied. For the pure Cu and Cu alloys in the immersed experiments with the crevice spacings of d=103 μm and 206 μm, the mathematical relationship of average corrosion potential and galvanic current with time in certain locations was depicted in Figure 8. As can be seen in Figure 8(a1–a2), by comparing the average corrosion potential and galvanic current of inside and outside the gap of the Cu, the uncovered area of Cu only served as the anode, and its average galvanic current was stable with the time, suggesting that the geometry of the crevice played a role of the protective layer in a period of time obviously. Crevice spacing in the range of 103∼206 μm was not a decisive factor affecting crevice corrosion for Cu. Moreover, Figure 8(b1–b2) shows a significant tendency that the average galvanic current of Cu–Sn alloy in the covered area was gradually changed from cathode to anode with increasing the d. In contrast to Figure 8(c1–c2), Cu–Zn alloy in the covered region remained the anodic current under d=103 μm or 206 μm. It is also revealed that with increasing the crevice spacing from 103 μm to 206 μm, the galvanic current increased in the covered zone, while the galvanic current decreased with time. The phenomenon can be explained here: when the pH and chloride ion concentration in the solution in crevice reached a critical state, disruption of the passive film was caused and crevice corrosion started. This is the onset of the active stage of crevice corrosion with high rates of corrosion occurring in the crevice, causing rapid deterioration of the metal in the crevice and possibly leading to structural failure of the metal. However, dependent upon the geometry of the crevice, oxygen may be depleted in the crevice. Oxygen will be depleted in the crevice if it is consumed faster than that is diffused into the crevice through its mouth, which will suppress cathodic reactions in the crevice. In the last the corrosion current relied on potential drop caused by Ohmic and concentration gradient is balanced with changes in the anodic exchange current density. The potentials in the crevice are steady simultaneously. To sum up, Cu–Zn alloy was the greatest sensitive system under any crevice spacing among the three alloys in this work.
The fluctuation of average potential and galvanic current immersed in mass 0.6% NaCl solution in specific crevice spacing as a function of corrosion time: (a1,a2) d=103 μm/206 μm in Cu, (b1,b2) d=103 μm/206 μm in Cu–Sn alloy, (c1,c2) d=103 μm/206 μm in Cu–Zn alloy.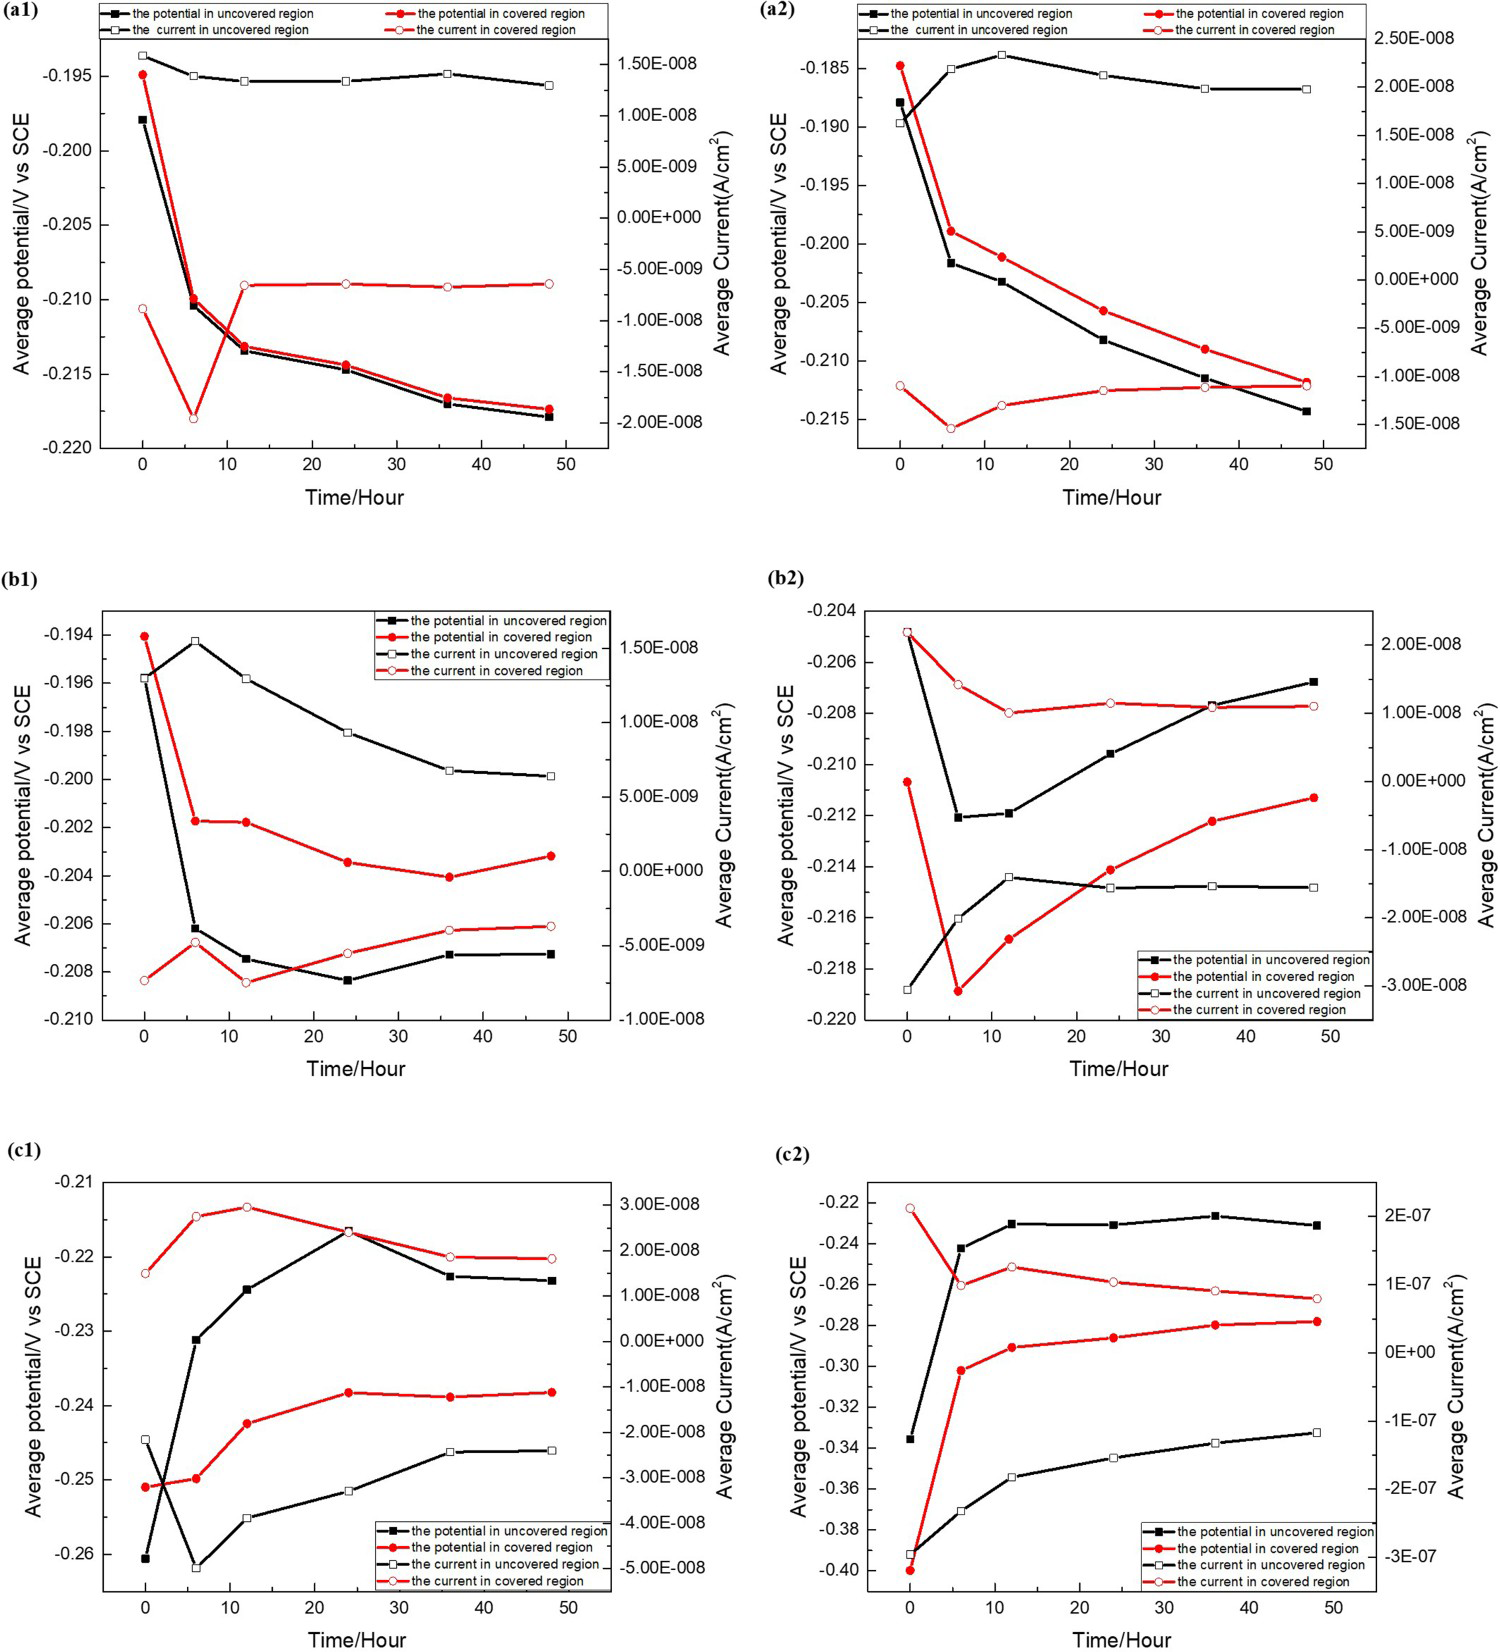
As mentioned above, according to the experimental results, it is summarised that most crevice corrosions occurred in a critical distance from the crevice opening. And the degree of crevice corrosion is strongly related to the crevice spacing and the corrosion object. To visually observe the characteristics of crevice corrosion under different factors, the corrosion surfaces of three Cu alloys under different crevice spacings were studied by the scanning electron microscope (SEM).
Figure 9 shows the SEM images of the corrosion surfaces of samples in different zones under a crevice spacing of d=103 μm or 206 μm after the experiments. The uncovered region is on the upper left side in every image, the other half is the coverage area, and the juncture was laid on the diagonal. It is apparent that the signs of destruction on the crevice specimen have been showed in form of stable pits scattered on the surface. Distribution of these pits does not follow a certain location with the change of alloy system and crevice spacing. Figure 9(a1–a2) shows the difference as a function of crevice spacing. As can be seen, there was a clear dividing line where the juncture and the uncovered areas of crevice were etched under d=103 μm. By contrast, the surrounding area of the crevice was etched under d=206 μm, which matched the corrosion potential and galvanic current distribution maps shown in Figures 2–3. Maybe it plays a major role that the covered as protection coating blocked the transport of corrosive electrolyte to Cu surface. The special SEM images of Cu–Sn are presented in Figure 9(b1–b2) to verify the change of corrosion behaviour, where the image at specific area was further enlarged. The major difference was shown in the covered region in Figure 9(b1–b2), and the pitting corrosion was found, as displayed in Figure 9(b2), which indicated that crevice corrosion for the Cu–Sn alloy had happened under d=206 μm, consistent with the trend of corrosion that the covered zone acted as the anode depicted in Figures 4 and 5. The reason could be attributed to the positive feedback of gap spacing. The increase in the gap spacing accelerated more species to diffuse into the crevice easily, which increased the conductivity of the solution. Ions were released into the solution, and the active area in the crevice was enlarged. For the Cu–Zn alloy shown in Figure 9(c1–c2), the covered area only served as the anode with increasing the immersion time, no matter how much the gap spacing was. As indicated in Figure 9(c2), regions close to the crevice bottom were more susceptible to pitting due to more acidic environment and accumulation of aggressive solution. It is believed that this potential change, corresponding to the beginning of the crevice corrosion, was due to activation of some locations in the crevice area. Moreover, it is found that the pitting potential strongly depended on type, size, shape and coherence of the inclusions existing in the alloy. Besides, the lower corrosion resistance of Cu–Zn alloy compared to Cu results from the passive layer structure consisting of a ZnO·xH2O/Cu2O–CuO layer that is less protective towards the attack of Cl− ions than the Cu2O–CuO passive layer produced on Cu alloy. Maybe it is the primary cause that susceptibility on crevice corrosion was Cu–Zn alloy > Cu–Sn alloy > Cu alloy.
SEM images of the copper and copper alloys surfaces after 48 h immersion time in mass 0.6% NaCl solution under crevice spacing: (a1,a2) d=103 μm/206 μm in Cu alloy, (b1,b2) d=103 μm/ 206 μm in Cu–Sn alloy, (c1,c2) d=103 μm/ 206 μm in Cu–Zn alloy.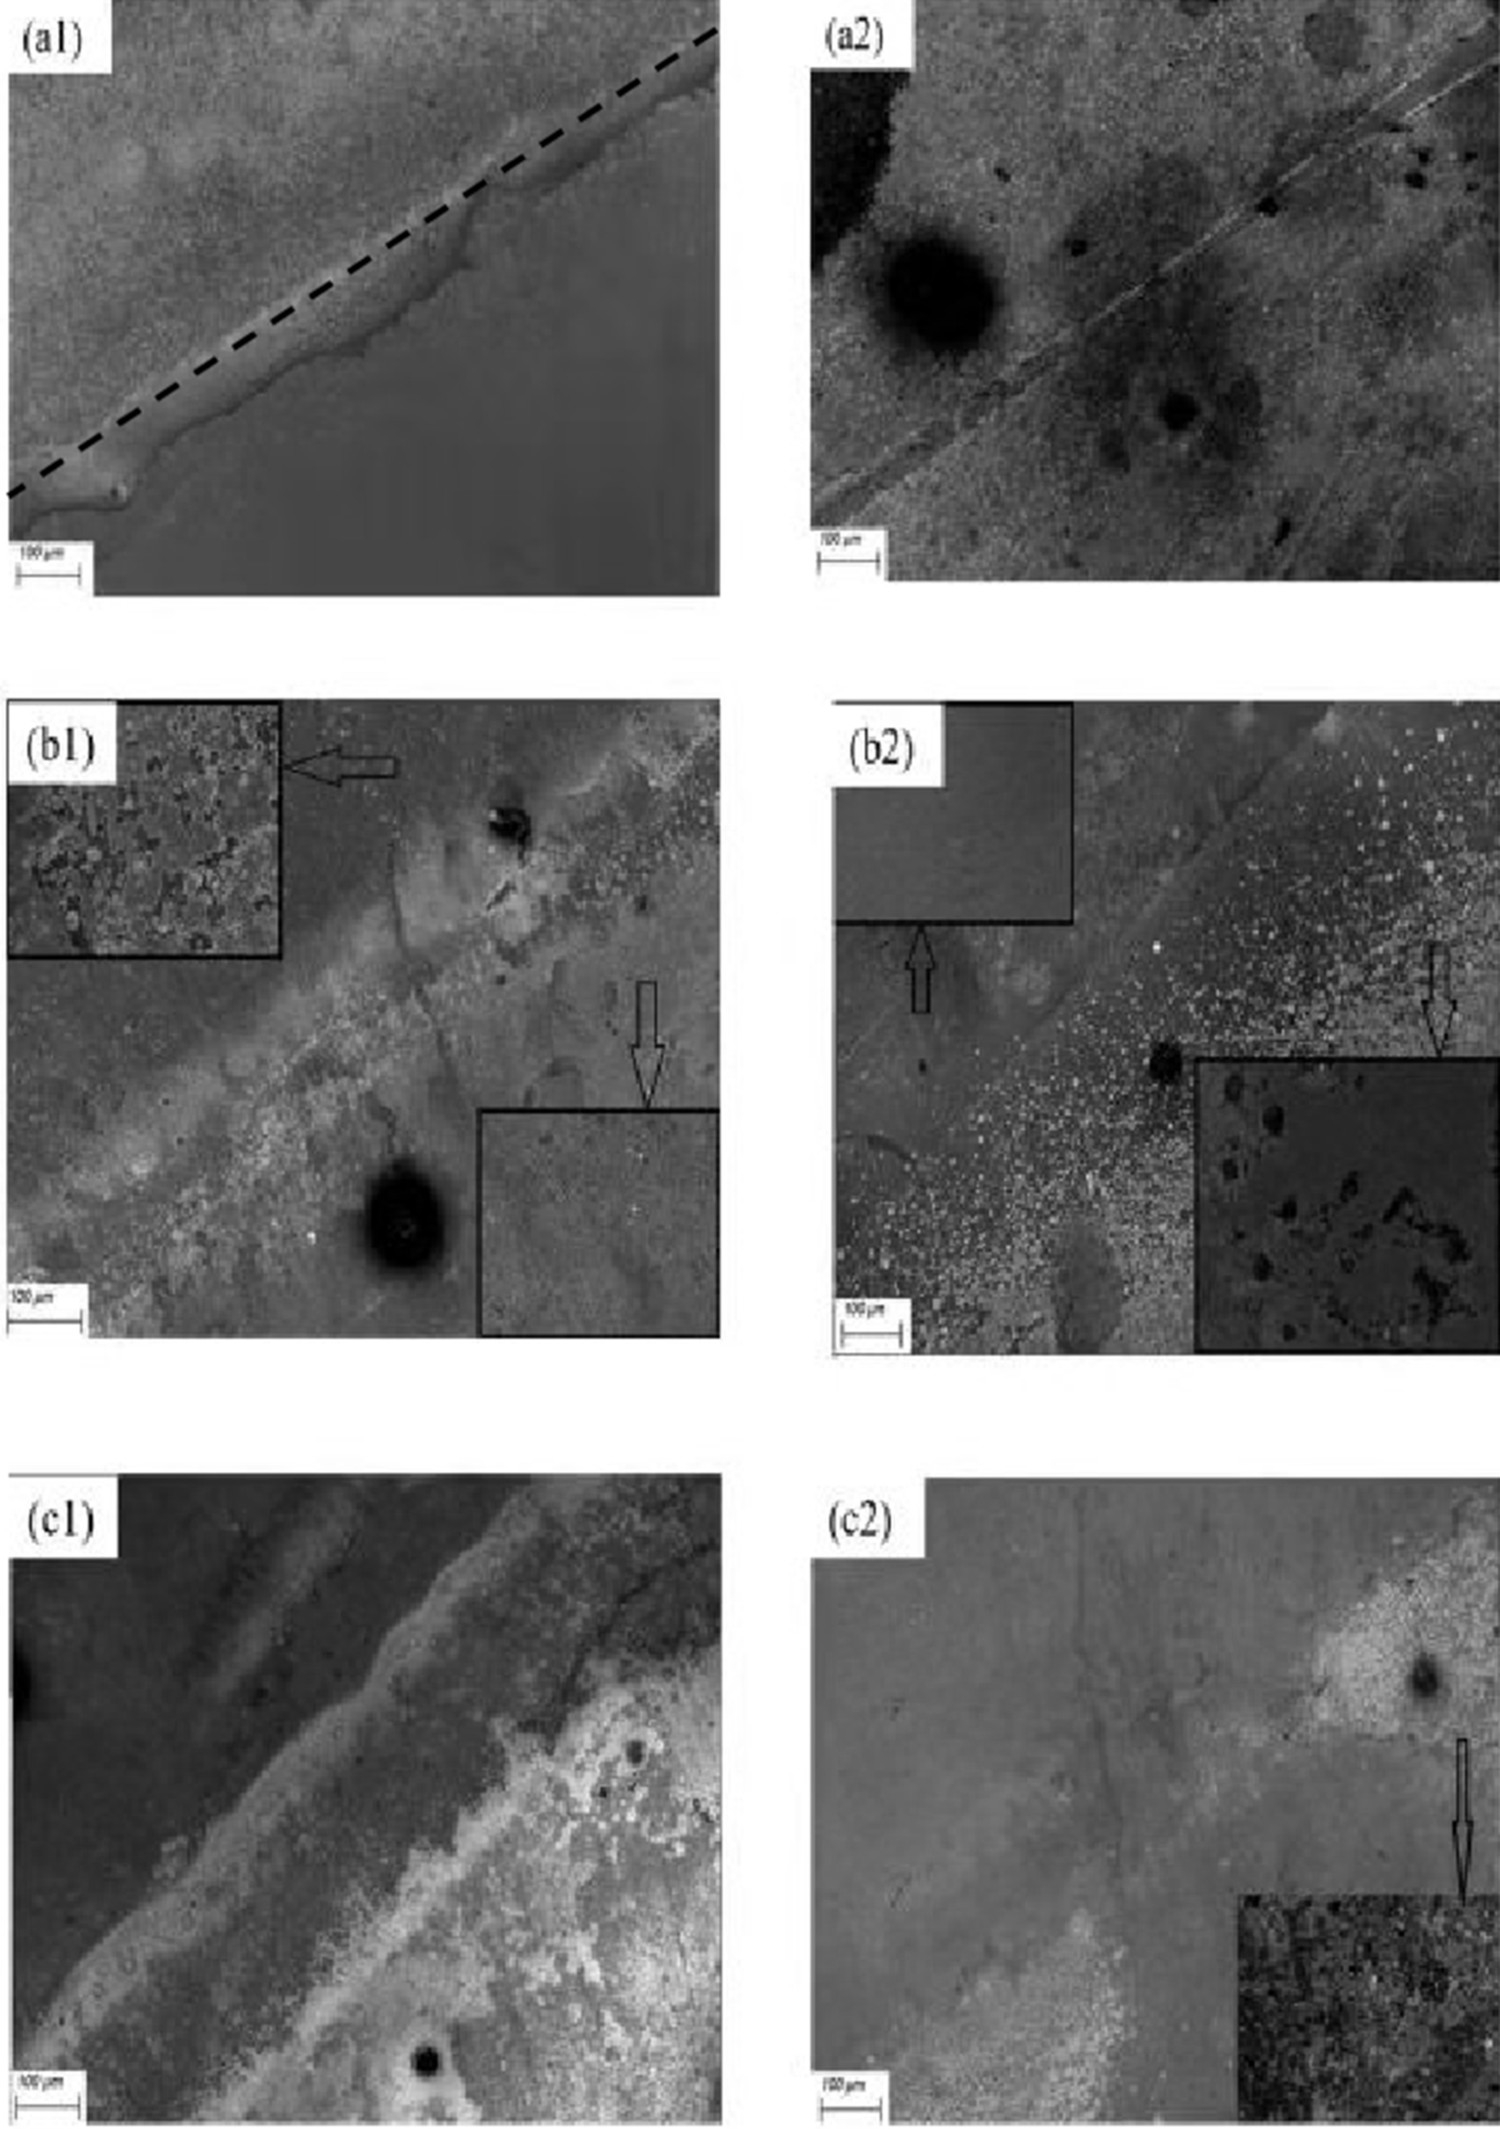
The corrosion behaviours of the Cu, Cu–Sn and Cu–Zn alloys in the mass 0.6% NaCl solution under different crevice spacings were investigated. The results indicated that the susceptibility on crevice corrosion was Cu–Zn alloy > Cu–Sn alloy > Cu alloy. When the crevice spacing was increased to 206 μm, the average galvanic current of Cu–Sn alloy in the covered zone was changed from cathode to anode. Meanwhile, the acidification of the occluded solution in the crevice extended the potential range of the active corrosion, causing a maximum anode current from the crevice juncture of 1 cm. Furthermore, increasing the crevice spacing enhanced the current movement in the solution to a certain degree, resulting in greater magnitudes of corrosion current. To sum up, the WBE method applied in corrosion research is feasible for the evaluation of crevice corrosion behaviours of copper alloys in complex environment.
Footnotes
Acknowledgements
The authors gratefully acknowledge State Key Laboratory of Advanced Special Steel, Shanghai University.