
Abstract
Electrochemical techniques such as Polarisation and Galvanic tests as well as immersion test were used to analyse both the effects of different Bi contents and the length scale of dendritic spacings on Zn–8 wt-%Al–(1.5, 2.3 and 3 wt-%Bi) alloys on their corrosion behaviour. The results revealed that no significant differences in the corrosion kinetics were observed with the scale of the dendritic and lamellar spacings. Conversely, the corrosion behaviour was shown to be dependent on the alloy Bi content. Despite the cathodic character of Bi, its addition to the Zn–8%Al alloy was shown to reduce the corrosion rate as compared with that of the binary alloy.
Introduction
Zn–Al alloys have been widely studied as they present various applications in the industry, e.g. protective layers on steel items [1 5], sacrificial anodes for corrosion protection of marine equipment [6–9], high-temperature solders [10 15] and bearing materials [16 20]. Due to its improved wear resistance, lack of environmental impact and lower production cost, Zn–Al alloys have been used to replace the traditional bronze bearing [21,22]. The commercial denomination of Zn–Al-based alloys is Zamac or Zamak, or simply ZA. The most common Zamac alloys are ZA-8, ZA-12 and ZA-27, where the number represents the aluminium content in weight per cent in the alloy.
Zn–Al alloys have good wear resistance, which is attributed to aluminium and zinc oxides formed on the wear surface. Aluminium oxide is a compound that is harder than zinc oxide contributing towards bearing purposes at the surface, while zinc oxide behaves as a lubricant but with limited and insufficient action [22,23]. In order to enhance the tribological properties, the addition of soft and immiscible elements, e.g. Sn, Pb and Bi, has been used in order to produce self-lubricating alloys [22].
In a previous work, Zn–8 wt-%Al alloys with additions of (1.5, 2.3 and 3 wt-%Bi) were obtained by unidirectional solidification [24]. The experimental set-up system allowed a broad range of solidification cooling rates to be analysed in a single experiment, which permitted to investigate the microstructural development of both Zn–Al and Zn–Al–Bi alloys castings related to the experimental thermal parameters under unsteady-state solidification conditions. It was observed that both binary and ternary alloys have similar microstructure: equiaxed dendrites immersed in a eutectic matrix formed by Al/Zn eutectoid product with fibres and lamellae morphologies. In addition, the ternary alloys present Bi droplets distributed in the matrix and between dendrite branches [24].
Several investigations have reported that the microstructure plays an important role on mechanical properties, wear resistance and corrosion behaviour of metallic alloys, highlighting the importance of microstructural control through solidification thermal parameters during the casting process [25 38]. In addition, the elements that constitute the alloy affect its corrosion behaviour [39]. Due to the electrochemical potential of each metallic element an active corrosion cell that accelerates the alloy degradation can be formed. In this sense, caution must be taken when adding alloying elements, particles or reinforcing fibres aiming to improve the mechanical and wear properties of metallic alloys. They can cause accelerated corrosion of the metallic matrix by inducing the formation of galvanic couples. When it is not possible to seek maximisation of all properties by adding a third element, it is necessary to search for a balance among the properties that satisfy the needs imposed by the project component [40].
Although the wear resistance is usually the main property demanded to Zn–Al alloys for tribological applications, service life assessment also depends on the corrosion behaviour when the component is exposed to aggressive environments. In this sense, many investigations have been reported in the literature concerning the corrosion behaviour of Zn–Al alloys. Yang et al. [41] investigated the influence of Al content on the corrosion behaviour of Zn–Al alloys immersed in simulated acid rain. Their research considered ZA4, ZA8, ZA12 and ZA16 alloys. The authors observed that the Al-rich phase was prone to preferential attack when the Zn–Al alloy was immersed for 5 days. However, the corrosion rate of the alloy decreased with increasing Al content, which may be related to the distribution of the Al-rich phase. It can also be found in the literature works that deal with the corrosion resistance of Zn–Al alloys with additions of a third element: Li, Na and Si [42], Mg [3,4], Cd [6] and inhibitors (heterocyclic pyridine (p), 2-methyl pyridine (2 mp), 3-methyl pyridine (3 mp) and 4-methyl pyridine (4 mp)) [43]. However, to the best of the present authors’ knowledge, there are no studies in the literature on the influence of the addition of Bi on the corrosion behaviour of Zn–Al alloys. Therefore, the present work aims to study, through electrochemical techniques, both the effects of different Bi contents on Zn–8 wt-%Al–(Bi) alloys and that of the length scale of dendritic and lamellar spacings of samples unidirectionally solidified under quite different solidification cooling rates.
Materials and methods
Zn–8 wt-%Al and Zn–8 wt-%Al–Xwt-%Bi (X = 1.5, 2.3 and 3) alloys castings were solidified in a water-cooled directional solidification set-up. The details of the experimental casting apparatus, melting and solidification procedures have been described in a previous study by the authors [24].
A unidirectional solidification device was used to prepare the alloys. The set-up of the experiment permits a range of solidification microstructures to be obtained from the water-cooled bottom to the top of the casting as a result of the differences on solidification thermal parameters. Consequently, the cooling rate is higher close to the water-cooled bottom of the solidification device and decreases towards the top. The microstructural parameters are strongly dependent on the solidification cooling rate; hence, finer microstructures are associated with high cooling rates and vice versa [44 48].
The analyses of microstructural features and corrosion behaviour were performed in samples extracted from the directionally solidified (DS) cylindrical castings. Figure 1 shows schematically the correlation of the microstructure with the evolution of solidification cooling rate along the length of the DS casting. The extracted samples from the DS casting at 5, 20 and 60 mm from the cooled bottom are related to different cooling rates (high, medium and low, respectively) and so they were chosen for the corrosion study in order to investigate the possible influence of the microstructure scale on the corrosion behaviour.
Schematic representations of the correlation between the microstructures and the cooling rate along the length of the DS casting obtained through the unidirectional solidification device.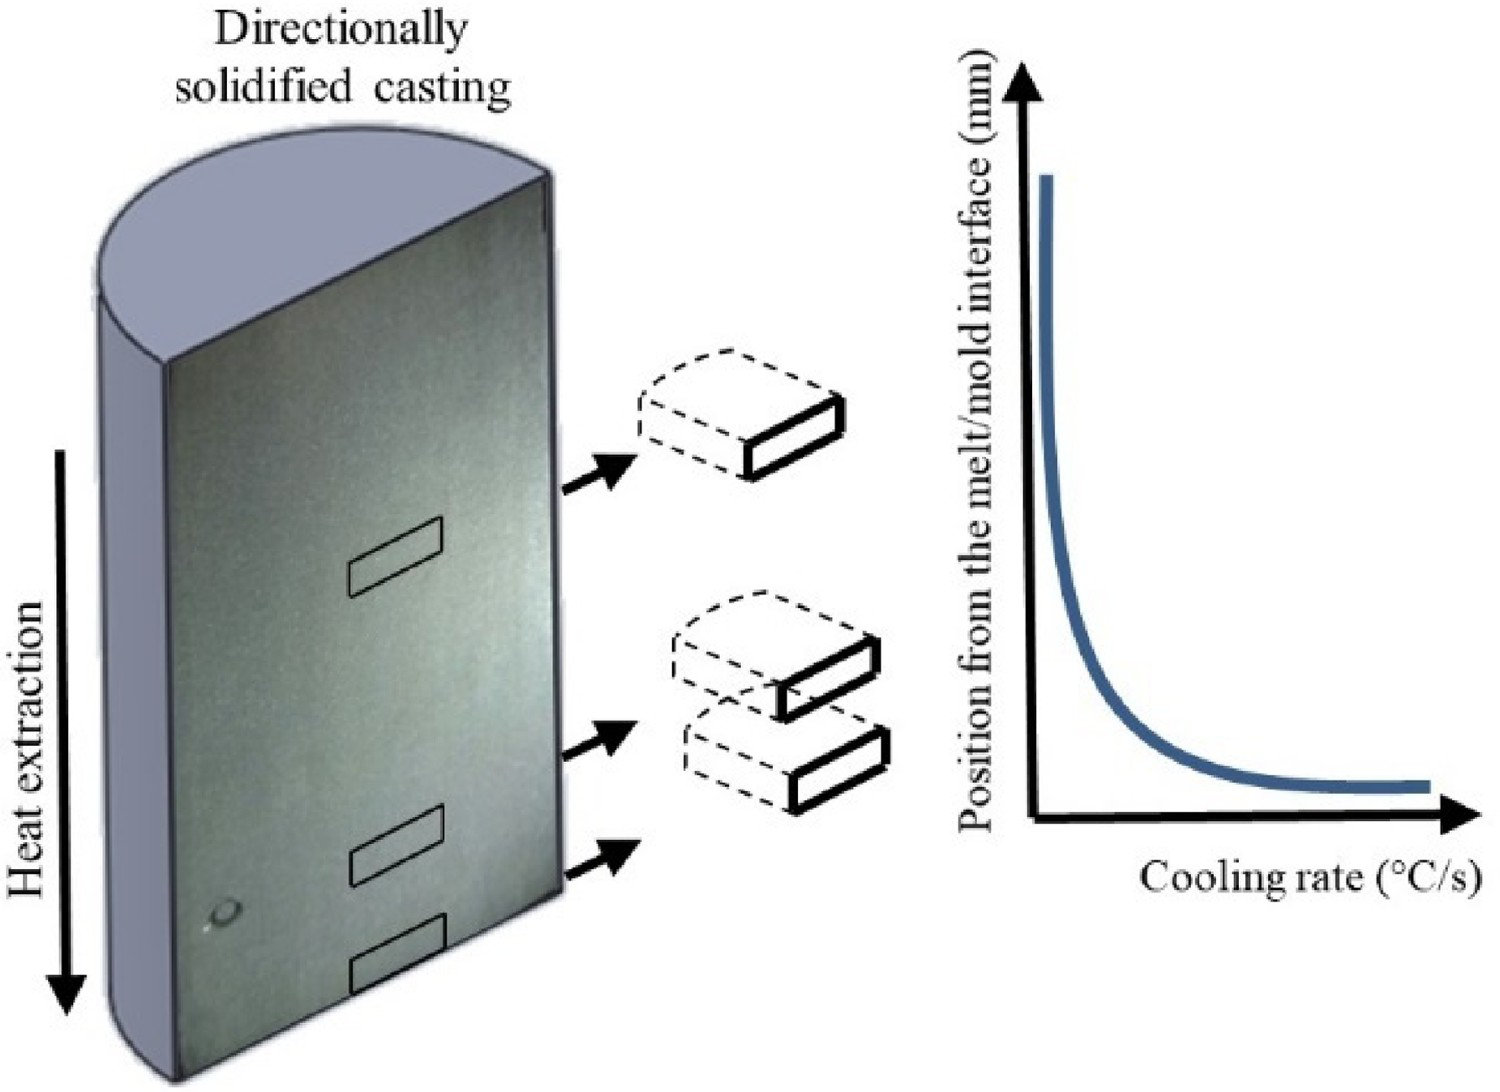
The samples were ground with 100, 200, 400, 600 and 1200 grit SiC papers, and then finely polished with diamond paste (9 and 3 μm). No etching was necessary for revealing the microstructure of the samples. The examination of the microstructure was carried out using an optical microscope (Olympus model 41 GX) and a Back Scattered Electron imaging (BSE) of a scanning electron microscope (ZEISS-EVO-MA15). The measurement of the eutectic lamellar spacing (λ L) was obtained by averaging the distance between lamellae, and the secondary dendritic arm spacing (λ 2) was obtained based on the average distance between the centre of three adjacent secondary arms (intercept method) [49]. The schematic measurements and also a deeper analysis of microstructure and thermal parameters are presented in a previous investigation [24].
In order to analyse the electrochemical behaviour of the studied alloys potentiodynamic polarisation curves, immersion tests, and galvanic tests were carried out on samples after polishing, cleaning in an ultrasonic bath and drying with hot air. In service conditions, moisture-induced problems may lead to operational failure of the bearing [50], therefore, to simulate corrosion induced by moisture as well as to understand the corrosion mechanism, the tests were performed in a more diluted solution (0.06 M NaCl) than the standard solution.
For the potentiodynamic polarisation, the electrochemical cell used was a three-electrode cell, where the Ag/AgCl (3 M KCl) electrode was the reference electrode, the counter-electrode was a platinum wire, and the working electrode was the sample under study (binary and ternary alloys samples). The electrodes were connected to a Gamry Reference 600 potentiostat. The exposed area of the samples was 1 cm2. The volume of the electrolyte used for electrochemical tests was 30 mL.
Prior to the polarisation test, the evolution of the open-circuit potential (OCP) of the working electrode was recorded during 15 min. The initial potential applied was −300 mV with respect to the OCP value, starting the sweep in an anodic direction at a polarisation scan rate of 0.16 mV s−1. The anodic sweep stops either at a limit current density value of 1 mA cm−2 or at a limit potential of 1 V versus Ag/AgCl (3 M KCl). The experiments were performed in triplicate. In order to acquire a deeper and wider knowledge on the corrosion process of the ternary alloys, polished samples of the Zn–8 wt-%Al–3 wt-%Bi alloy were immersed in the saline solution for 15 and 60 min. Subsequently, the samples were analysed by scanning electron microscopy (SEM).
Galvanic corrosion tests were conducted in a three-electrode cell comprised by the reference electrode, and the two electrodes whose galvanic coupling is the object of the study. In this case, both a pure Bi sample and the binary alloy sample were used. The exposed area of each sample was 1 cm2 in a 0.06 M NaCl solution and the volume of electrolyte used for the electrochemical tests was 600 mL. Both samples were electrically coupled to a copper wire. Both alloys were immersed in a beaker of the saline solution, face to face with a fixed distance of 3 cm between them and an area ratio of 1:1. Both the mixed potential (E mix) and the galvanic current density (i galv) were recorded for 168 h. In addition, the OCP of the uncoupled binary alloy and pure Bi were also recorded in order to evaluate the behaviour of each electrode.
All the experiments were performed in triplicate. Finally, after each electrochemical test, the morphology and chemical composition of the corrosion products were characterised by a Hitachi S 4800 J field emission scanning electron microscope (FEG-SEM) equipped with an energy-dispersive X-ray-EDX detector.
Results and discussion
Microstructure characterisation
Figure 2(a) shows the partial binary Zn–Al phase diagram calculated by the Thermo-Calc software, where the Zn–8 wt-%Al alloy is indicated by a vertical line. Figure 2(b) shows the typical microstructure of the unidirectionally solidified Zn–8 wt-%Al alloy, consisting of pro-eutectic dendrites (Al′) immersed in a eutectic matrix. The dendrites are formed by alternated Zn and Al lamellae, which resulted from the eutectoid transformation, (Al′) → (Al) + (Zn). Likewise, the eutectic mixture consists of (Zn) and (Al′) phases, and the latter one also undergoes a eutectoid transformation.
(a) Zn–Al binary diagram obtained by the Thermo-Calc software. (b) Typical Zn–8 wt-%Al micrograph. The microstructure is characterised by a pro-eutectic (Al′) phase with dendritic morphology immersed in a eutectic matrix. Both (Al′) dendrite and lamellae of the eutectic matrix experience eutectoid transformation.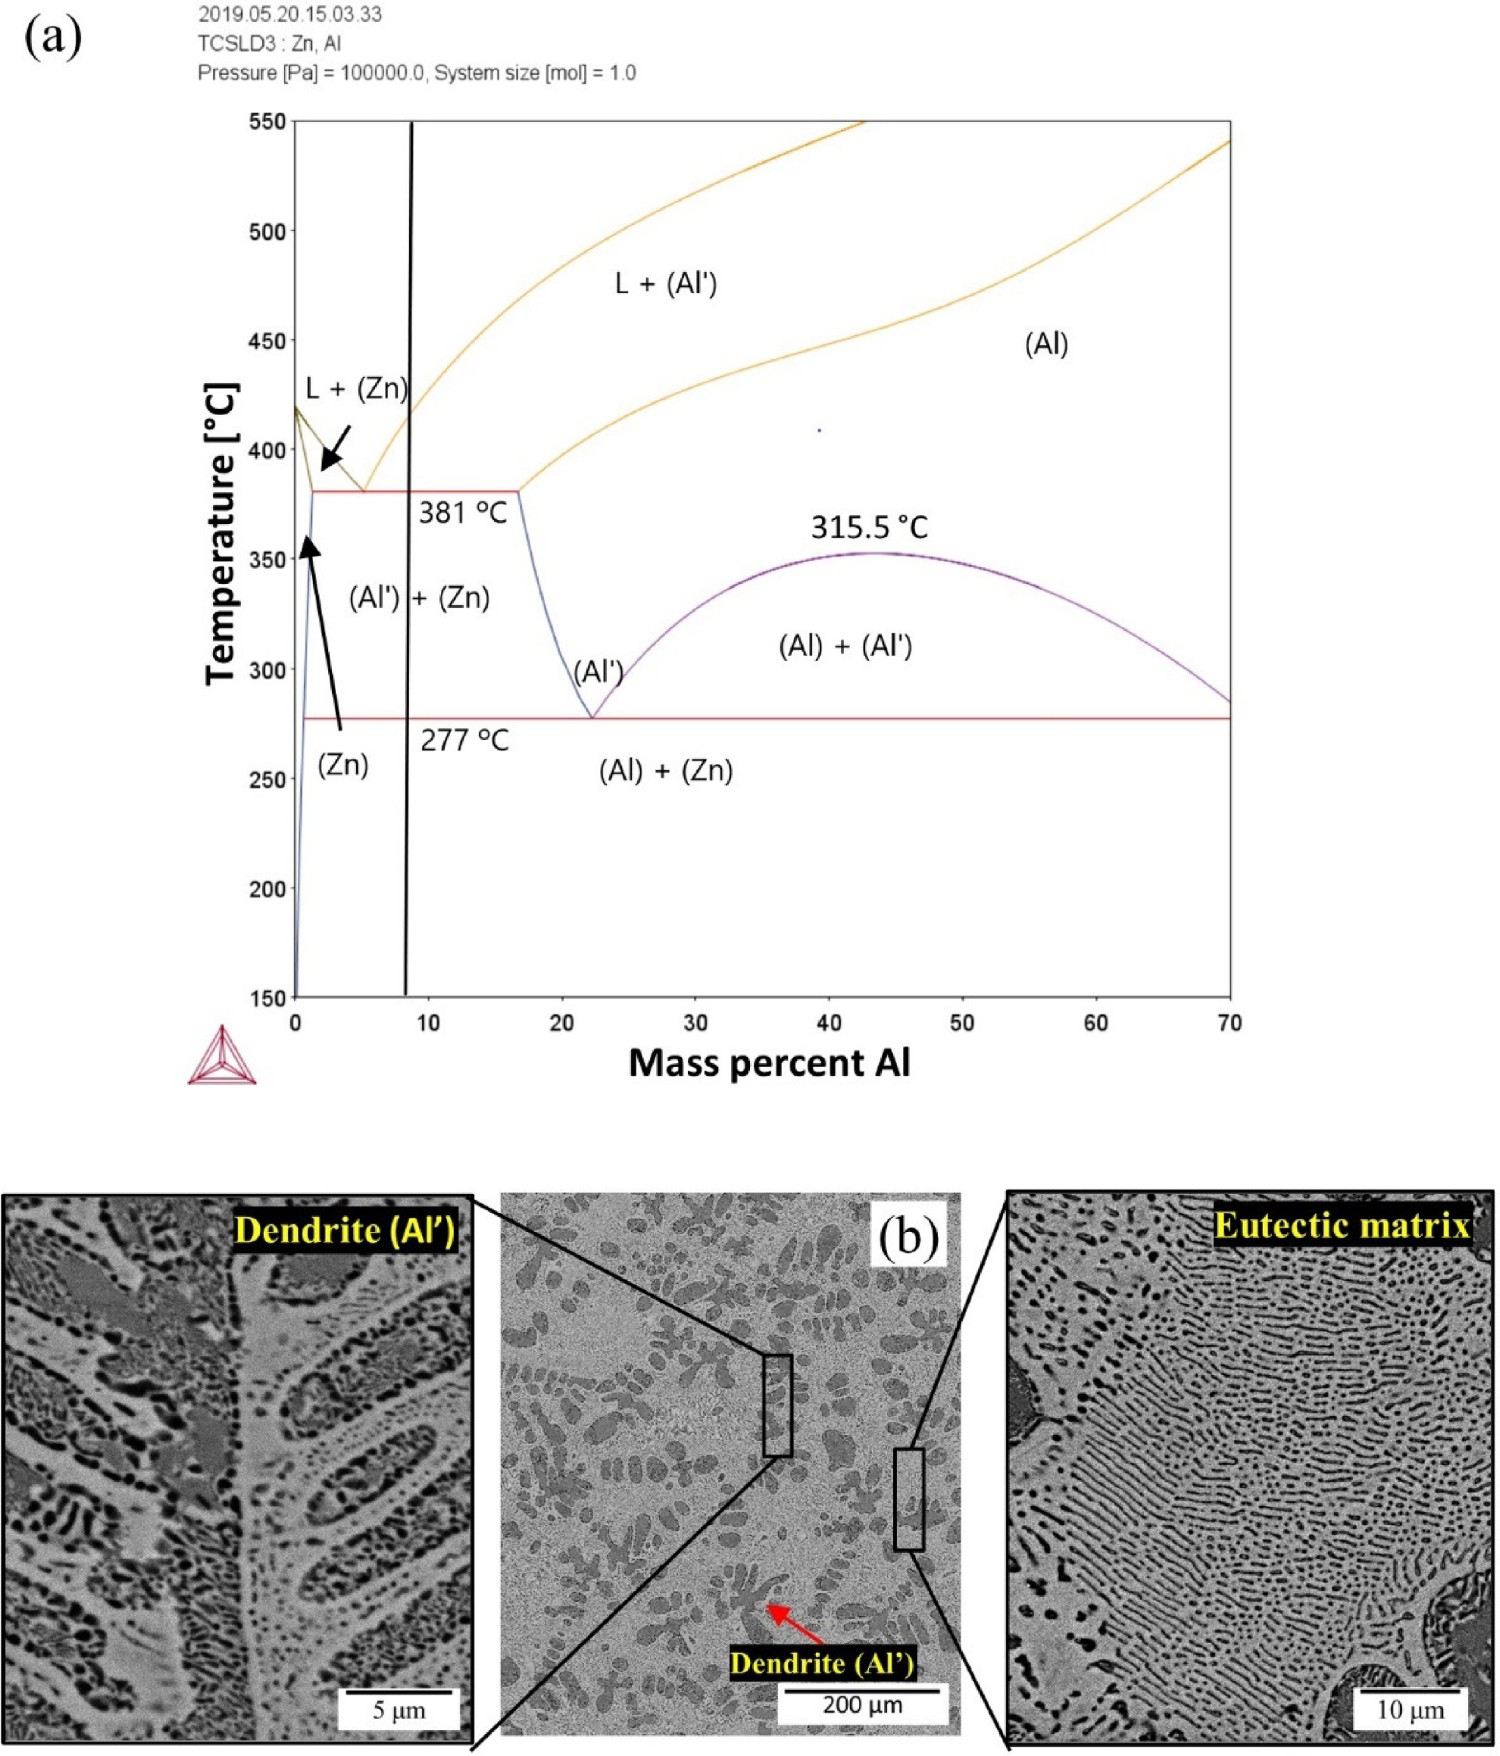
The pseudo-binary Zn–8 wt-%Al–Bi diagram, with the analysed alloys indicated by vertical lines, is depicted in Figure 3(a). The addition of Bi causes a significant change in the phase diagram when compared with that of the binary Zn–Al: Bi addition alters the temperature of the invariant reactions and gives rise to a monotectic reaction. Nevertheless, the microstructure of both binary and ternary alloys remains similar. Due to the immiscibility of Bi, there is no formation of new phases with this element by solid solution. Hence, the only difference is the additional presence of Bi droplets in a typical microstructure of a Zn–8 wt-%Al binary alloy, as can be seen in Figure 3(b)–(d).
(a) Zn–8 wt-%Al–Bi pseudo-binary phase diagram obtained by the Thermo-Calc software. The micrographs depict the typical microstructures of (b) Zn–8 wt-%Al–1.5 wt-%Bi, (c) Zn–8 wt-%Al–2.3 wt-%Bi and (d) Zn–8 wt-%Al–3.0 wt-%Bi alloys. The microstructure is quite similar to that of the binary alloy but with the additional presence of Bi particles (indicated by arrows).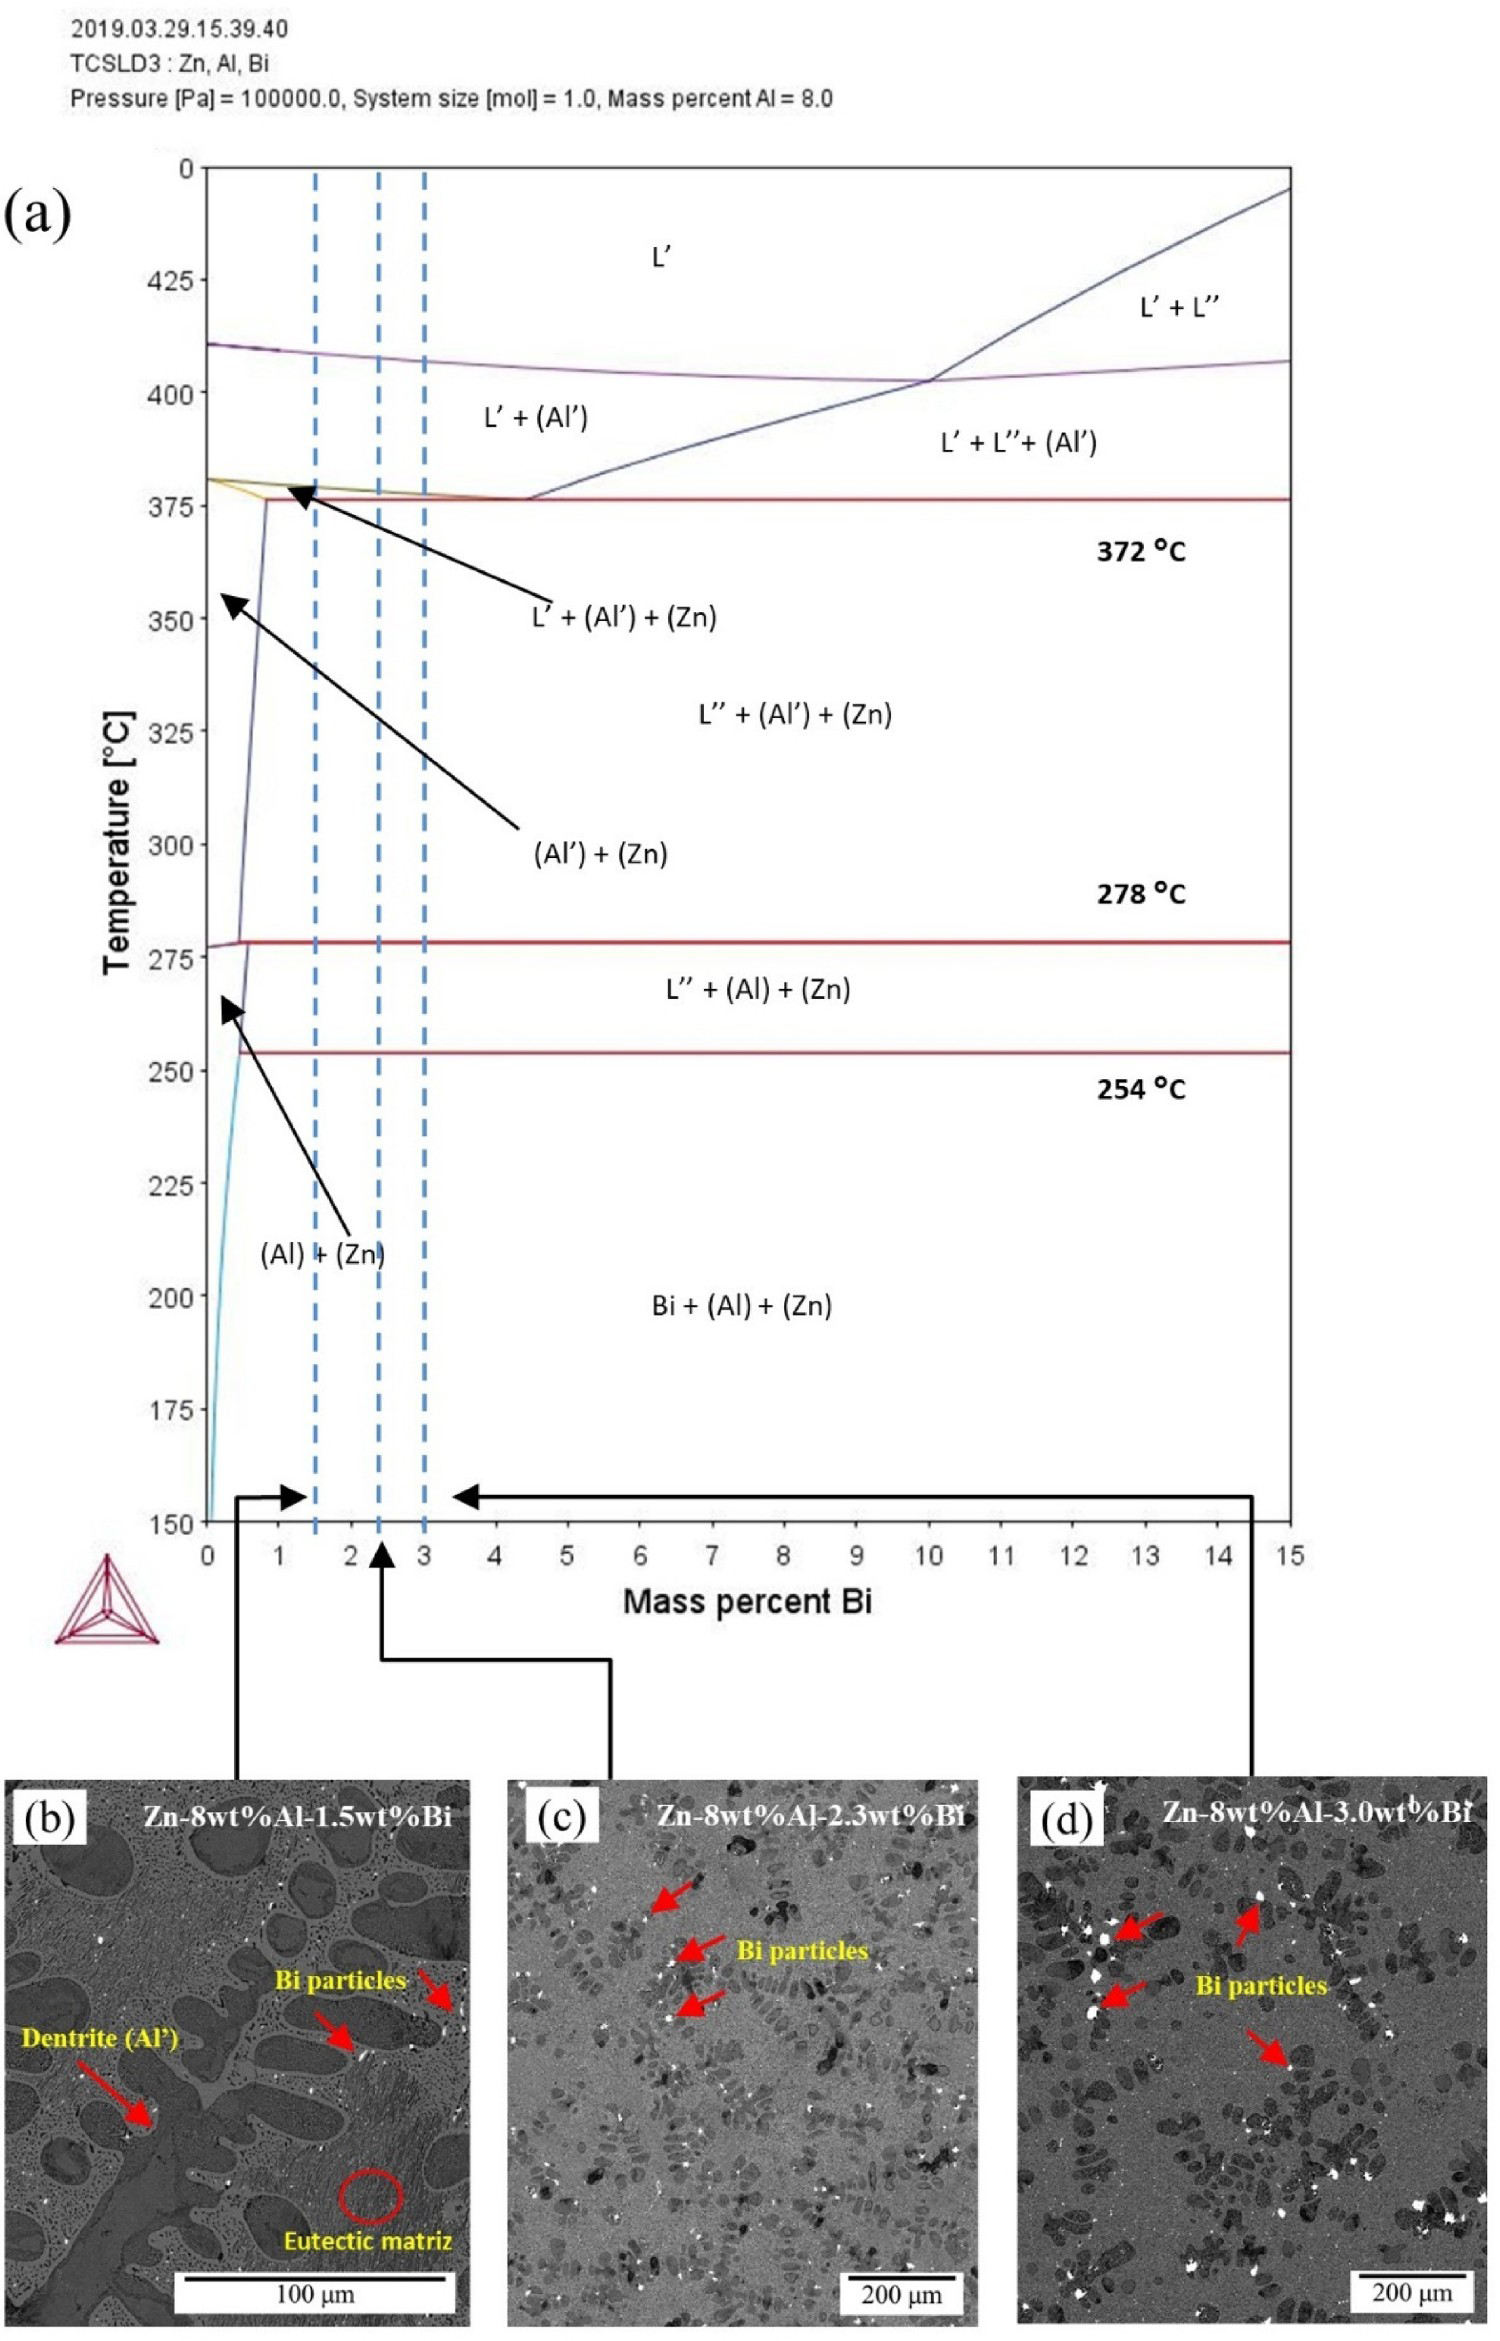
As discussed in a previous work [24], small Bi particles are entrapped in the spacings between eutectic lamellae located in the interdendritic regions of the ternary alloy; however, large Bi particles are located between the dendritic branches only in the alloys containing 2.3 and 3 wt-%Bi. In addition, it was reported that the increase in Bi content from 2.3 to 3 wt-%Bi did not affect the average diameter of the corresponding particles. On the other hand, their distribution area experiences a slight increase.
Potentiodynamic polarisation tests
The potentiodynamic polarisation curves of binary and ternary alloys are presented in Figure 4. The differences in the shape of the polarisation curves between the binary and ternary alloys are significant. While the Zn–8 wt-%Al alloy presents a clear diffusion control of the corrosion process by means of a vertical cathodic branch, the ternary alloys (Zn–8 wt-%Al–Xwt-%Bi alloys (X = 1.5, 2.3 and 3)) exhibit a change in the corrosion mechanism, showing significant differences in both the anodic and cathodic branches. The absolute value of the slope of the cathodic branch for ternary alloys (Figure 4) presents a decrease with the alloy Bi content, being of −349, −209 and −165 mV dec−1 for Bi contents of 1.5, 2.3 and 3.0 wt-%Bi, respectively. This change in the slope reveals that the corrosion process under diffusion control for the binary alloy turns to a mixed control as the Bi content increases in the alloy.
Polarisation curves for Zn–8 wt-%Al and Zn–8 wt-%Al–Xwt-%Bi (X = 1.5, 2.3 and 3) alloys in a 0.06 M NaCl solution. Samples extracted from a position at 60 mm from the base of the DS casting. The dashed lines show how the corrosion current densities were determined.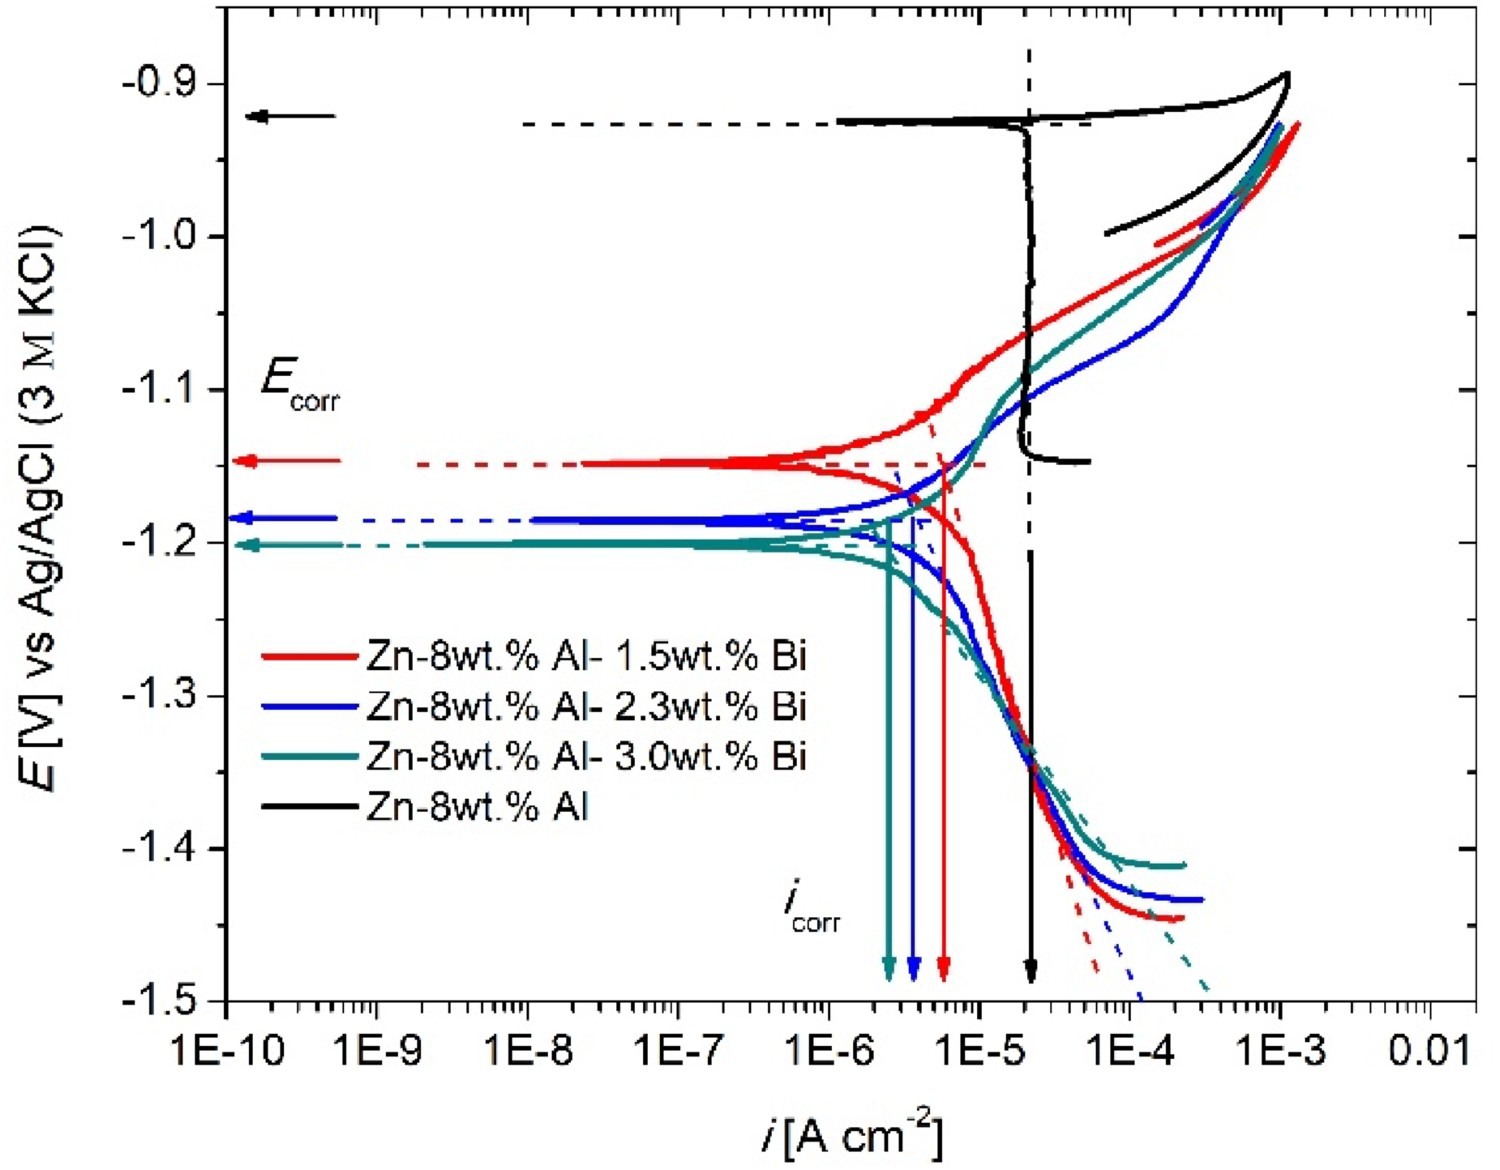
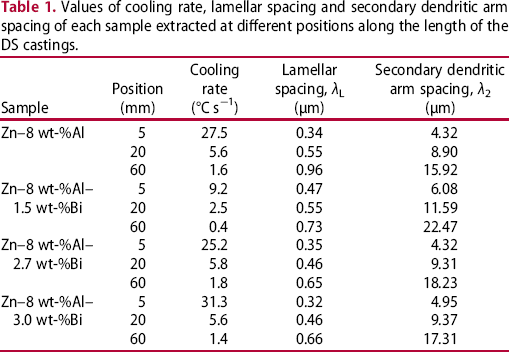
Values of cooling rate, lamellar spacing and secondary dendritic arm spacing of each sample extracted at different positions along the length of the DS castings.
Nevertheless, some dependence of the corrosion current density on the Bi content of the alloy can be observed. Figure 5(a) shows the average values of the corrosion current density plotted versus the position of the sample in the DS cylindrical castings. The addition of 1.5 wt-%Bi decreases the corrosion current density with respect to the binary alloy, and further additions of Bi induce even lower i corr values. The average value of the corrosion current density is 18 μA cm−2 for the binary alloy, and 5.8, 4.4 and 3.3 μA cm−2 for the ternary alloys with 1.5, 2.3 and 3.3 wt-%Bi, respectively. Thus, from the corrosion kinetics point of view, it appears that the addition of Bi tends to decrease the corrosion rate. The higher the alloy Bi content, the lower the corrosion kinetics of the ternary alloys.
(a) Corrosion current density and (b) corrosion potential as a function of the position of the sample in the DS casting for Zn–Al and Zn–Al–Bi alloys. Samples extracted at 5, 20 and 60 mm from the bottom of the DS casting. The error bars represent the standard error of the triplicated analysis.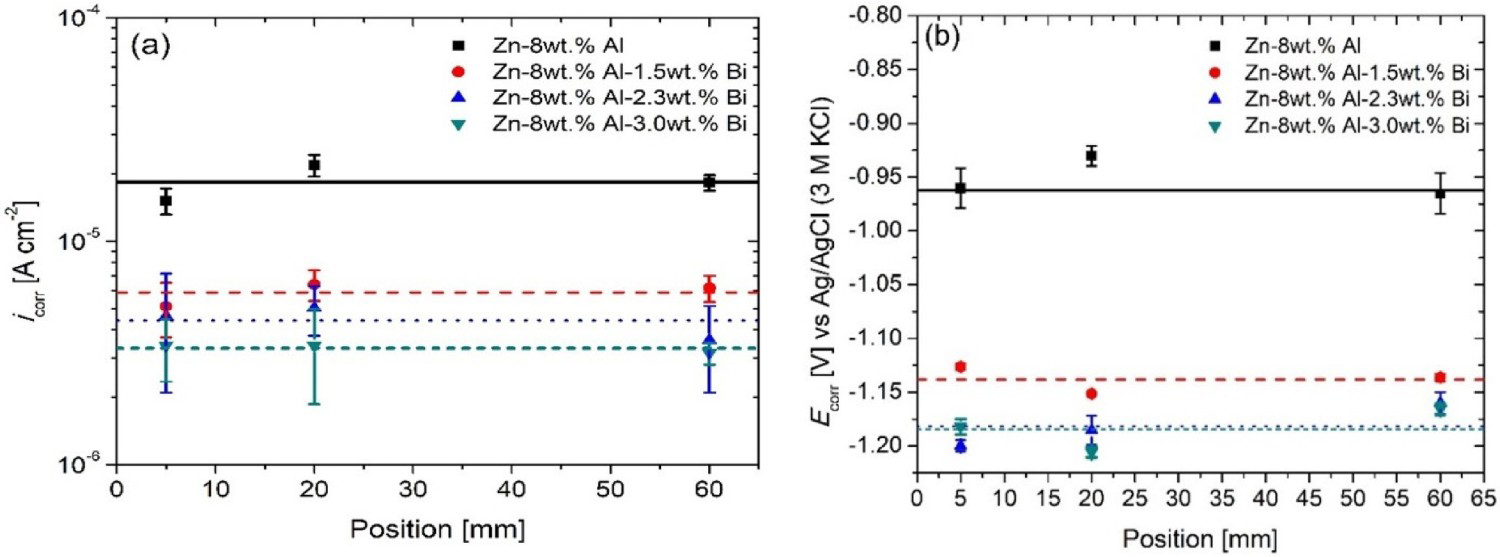
The corrosion potential for the binary alloy is about −950 mV (Figure 5(b)) no matter the position of the sample, i.e. the size of the secondary dendrite arm spacing. For ternary alloys samples, E corr ranges between −1125 and −1200 mV, that is, Bi additions shift the corrosion potential towards the cathodic direction by approximately 250 mV as compared with the binary alloy.
The polarisation curves have shown that the corrosion behaviour of the studied alloys does not depend on the position of the analysed sample, i.e. the microstructure. Therefore, hereafter the following studies were performed on samples extracted at 60 mm from the cooled base of the DS castings. The results obtained for these samples with coarse microstructure are representative of the corrosion behaviour of samples extracted from any other position.
The OCPs corresponding to the Zn–8 wt-%Al and Zn–8 wt-%Al–Xwt-%Bi (X = 1.5, 2.3 and 3) alloys were also recorded for 900 s (Figure 6). For all the alloys, at the beginning of the immersion, the potential shifts towards nobler values as a result of the reorganisation of the charge at the metal/surface interface. Afterwards the potential achieves a stable value which remains constant throughout the immersion time.
Evolution of open-circuit potential in a 0.06 M NaCl solution. Samples extracted from a position at 60 mm from the cooled bottom of the DS alloys castings.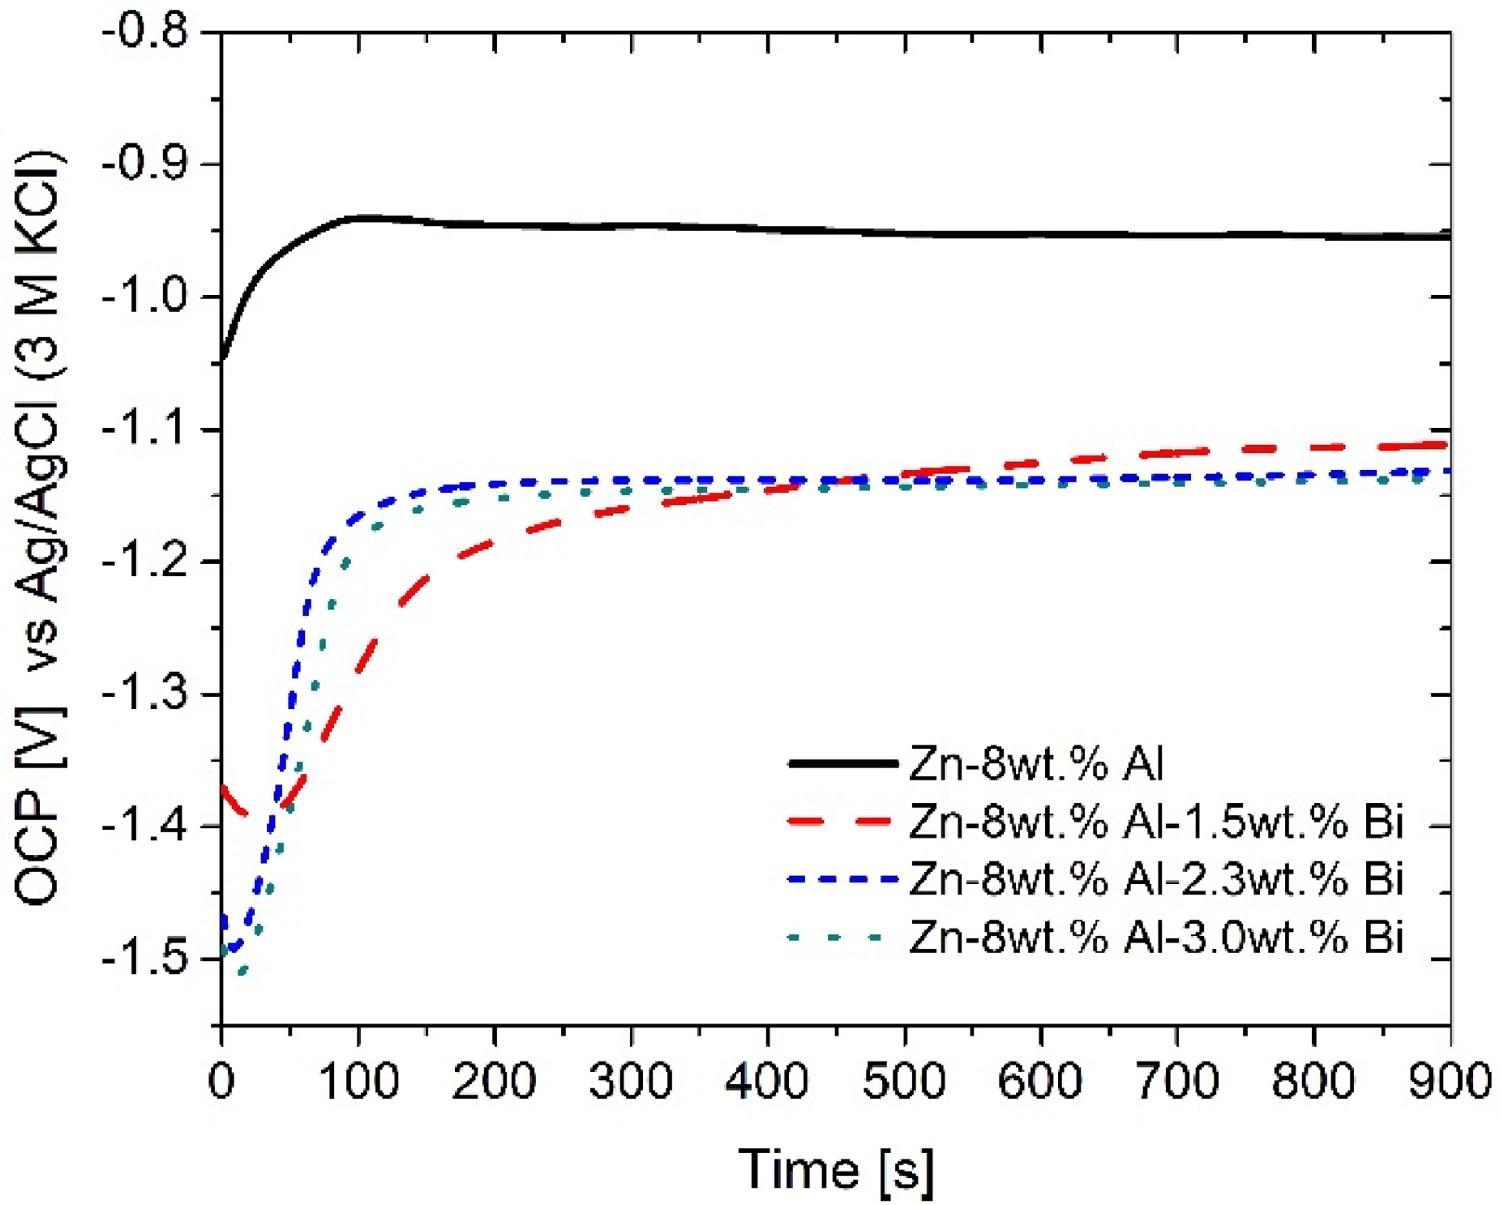
Such stable values are quite different depending on the examined alloy. The OCP of the binary Zn–8 wt-%Al alloy is 250 mV nobler than those obtained for the ternary alloys. Thus, it appears that the addition of Bi into the Zn–Al alloy shifts the OCP in the cathodic direction no matter the alloy Bi content. This is in agreement with that observed for the corrosion potential in the polarisation curves.
Figure 7 shows the surface of the Zn–8 wt-%Al and Zn–8 wt-%Al–3 wt-%Bi alloys during the immersion in saline solution. Immersion tests were conducted up to 15 min where the OCP were recorded, and then, immersion was extended to 60 min. As can be seen for the ternary alloy, immediately after the immersion in the solution some bubbles, presumably of hydrogen, grow on the surface and lately detach from it. On the contrary, no bubbles are observed on the surface of the binary alloy. According to the Pourbaix Diagram of Bismuth [51], at potentials below −1.2 V/SHE, Bi reacts to form BiH3. Therefore, at the low OCP recorded for the ternary alloys, Bi particles may react to form hydrides. Due to the instability of the hydride, it quickly decomposes into bismuth and hydrogen. Therefore, the formation of Bi hydride would allow to explain the release of hydrogen when the Zn–Al–Bi sample is immersed into the solution, as it was observed during the OCP measurements.
Samples of (a) Zn–8 wt-%Al and (b) Zn–8 wt-%Al–3 wt-%Bi alloys submerged in the saline solution.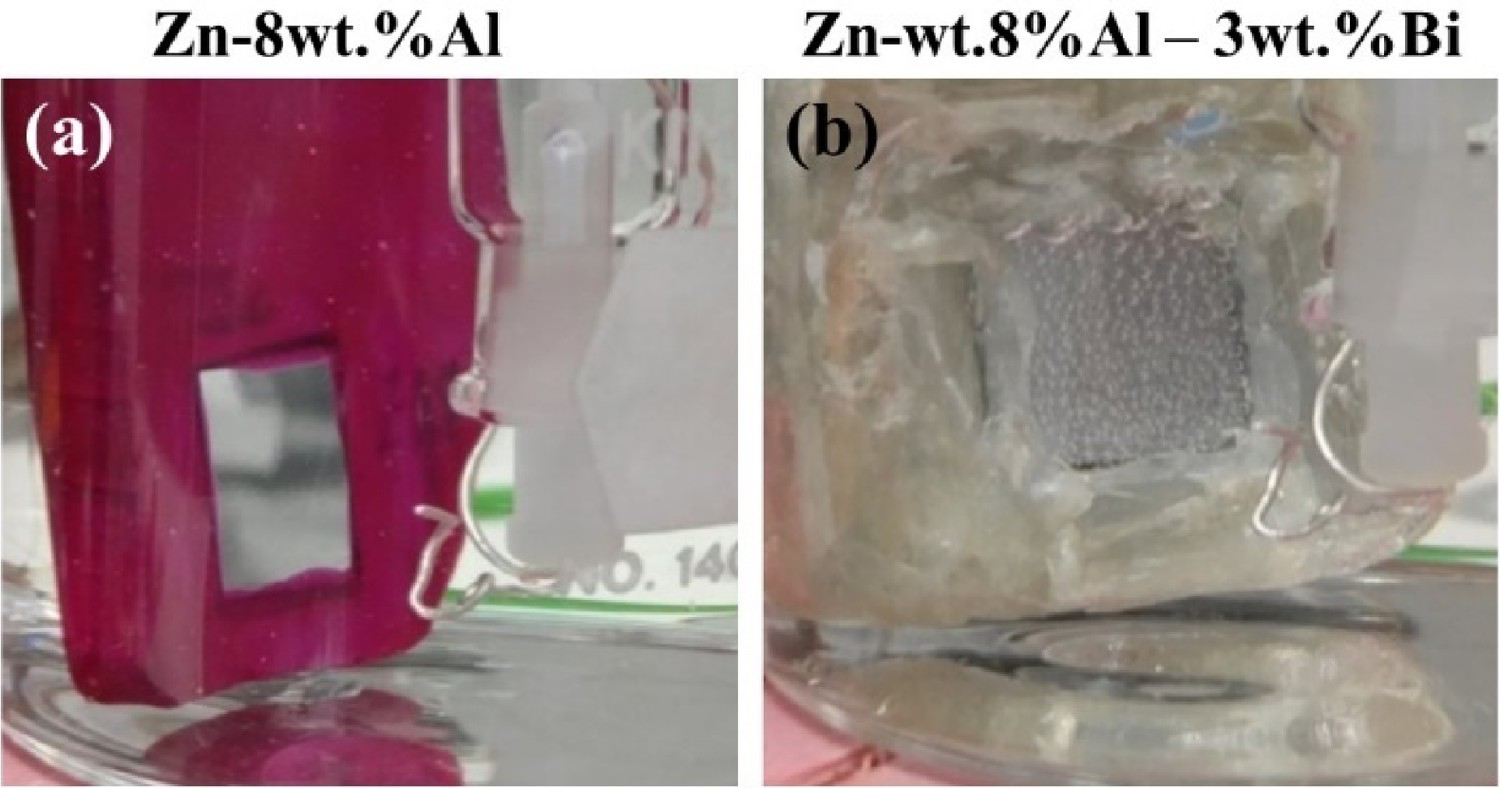
Figure 8 shows the SEM micrographs corresponding to the top view of Zn–8 wt-%Al–3 wt-%Bi ternary alloy, after 15 and 60 min of immersion. The dotted line in Figure 8(a) separates the exposed area (left side) from the non-exposed area (right side).
Surface images of Zn–8 wt-%Al–3.0 wt-%Bi alloy sample extracted from a position at 60 mm from the bottom of the DS casting, immersed in a 0.06 M NaCl solution during (a) 15 min and (b and c) 60 min. The arrows indicate the presence of corrosion products.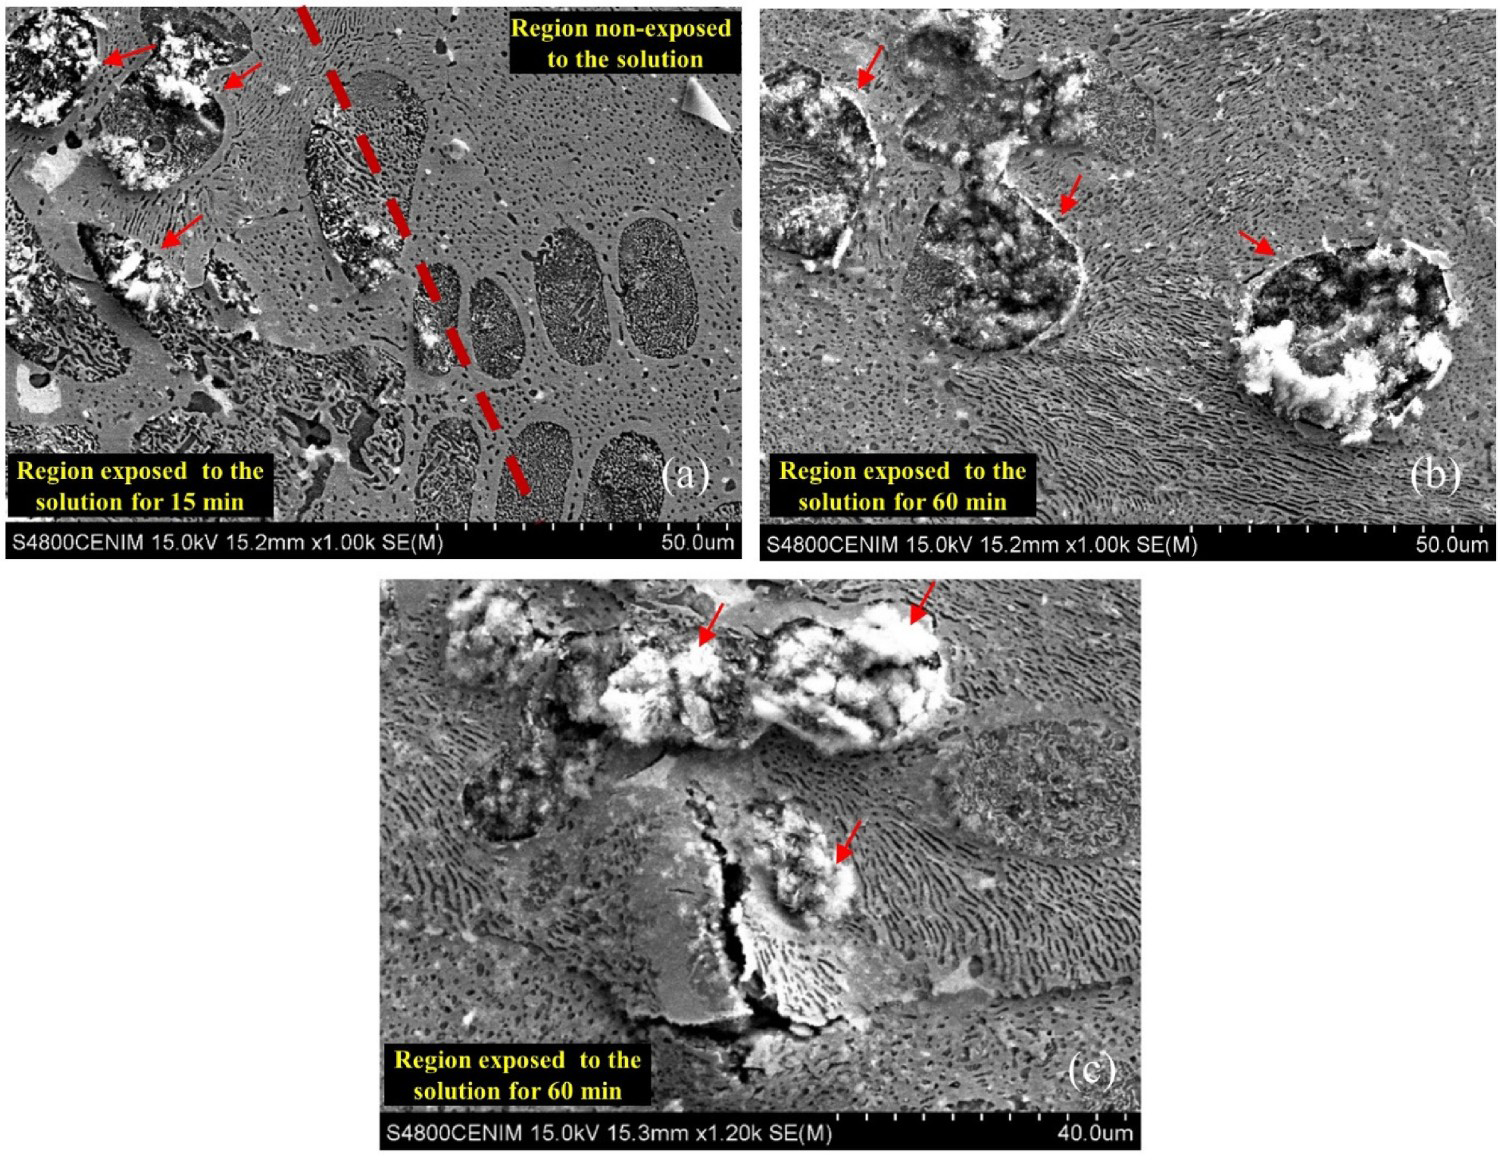
As can be seen, after 15 min of immersion, oxides deposit over some dendrites (Figure 8(a), arrows). In a previous study [24], the authors pointed out that both dendrites and matrix are formed by lamellae of Zn and Al; however, inside the dendrites, the lamellae are more refined and there is a greater area of contact between Zn and Al of the eutectoid mixture, which makes the dendrites more prone to corrosion. Moreover, as it was previously discussed, Bi presents a nobler corrosion potential compared with Al and Zn; hence, it is expected the dissolution of these phases within the dendrites rather than that of the Bi particles. For 60 min of immersion besides the products formed on the dendrites (Figure 8(b)), some blisters burst and cracked appear on the matrix (Figure 8(c)). This damage may likely form as consequence of the hydrogen bubbles resulting of BiH3 formed on Bi particles when the solution penetrates into the metal under the surface. Inner Bi particles might react to form BiH3, which subsequently decomposed in bismuth and hydrogen. The pressure exerted by hydrogen would lead to the formation of a blister, which eventually may burst by the hydrogen gas pressure.
Similarly, the appearance of the surface of the samples after the polarisation curves also showed some differences in the morphology of the corrosion attack depending on the composition of the alloy. At naked eye (shown in Figure 9), the surface of the binary alloy shows localised attack while the ternary alloy revealed homogeneous corrosion all over the surface.
Surface appearance after polarisation test: (a) Zn–8 wt-%Al and (b) Zn–8 wt-%Al–3 wt-%Bi alloys samples. The samples were extracted from a position at 60 mm from the bottom of the DS casting.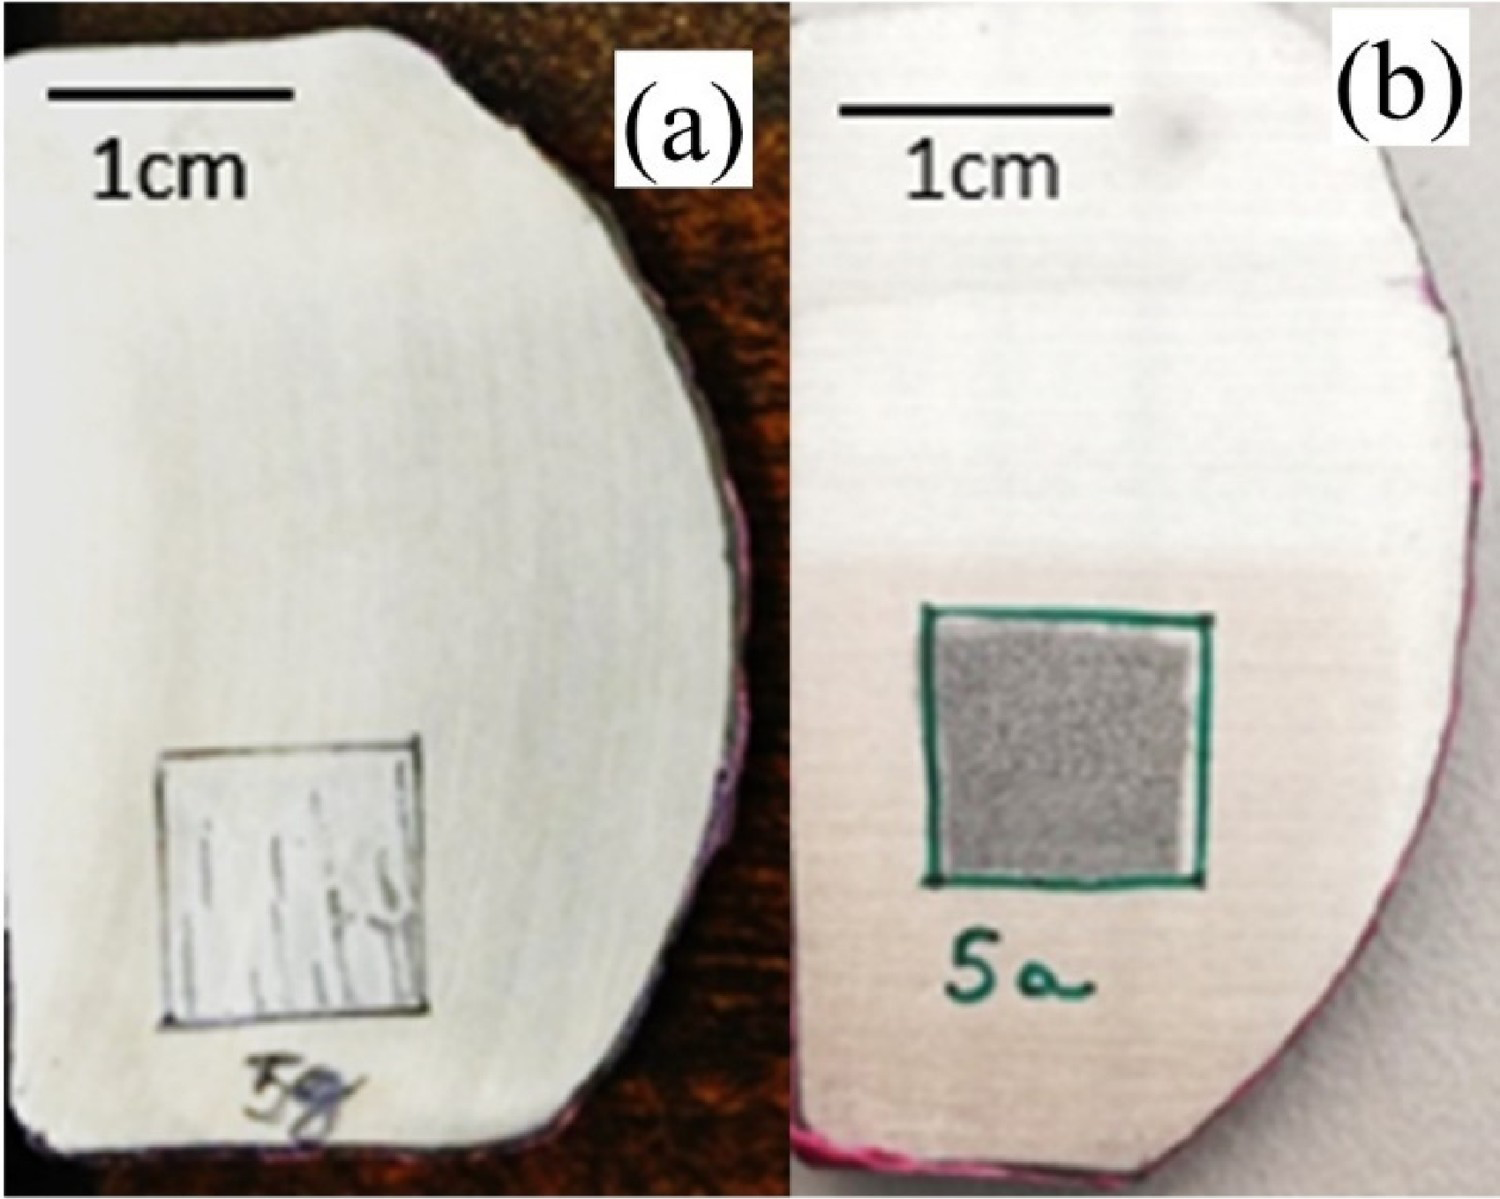
SEM analysis shows a heterogeneous distribution of the corrosion attack over the surface of both binary and ternary alloys (Figure 10). Since the present study focuses on multicomponent alloys, the heterogenous attack might be the consequence of the corrosion driven by merging dissimilar metals. However, from a macroscopic point of view, the corrosion attack on the binary alloy is shown to be more punctual, that is, starts and spreads in certain regions (Figure 10(a)), while on the ternary alloys, the entire region exposed to the saline solution suffers the corrosion attack (Figure 10(b)). Such differences of the corrosion damage might be related to the homogeneous distribution of Bi in the alloy.
Secondary electron (SE) image after the corrosion test (polarisation curves): (a) Zn–8 wt-%Al and (b) Zn–8 wt-%Al–3 wt-%Bi alloys samples. The samples were extracted from a position at 60 mm from the bottom of the DS casting.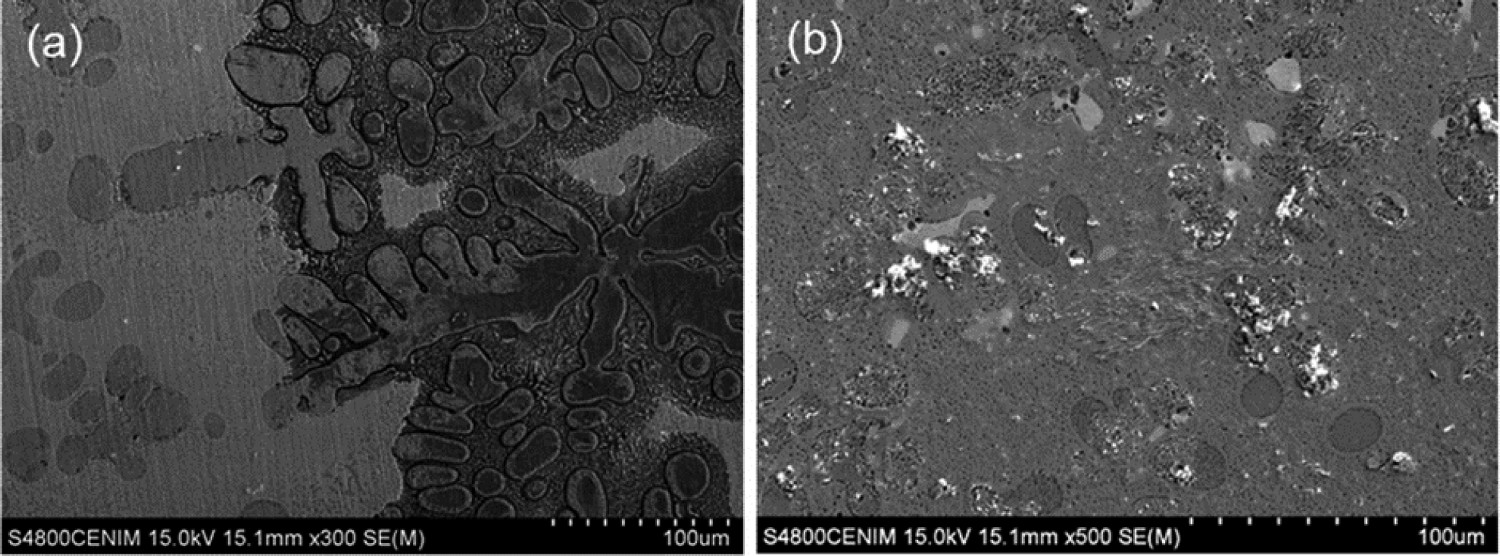
Figure 11 shows an SEM micrograph and energy-dispersive X-ray spectroscopy (EDS) results of the surface corresponding to the binary alloy sample after the polarisation test. It can be noted that the attack occurs selectively at preferential sites of the surface. The comparison of EDS analyses of corroded and non-corroded regions reveals the higher oxygen and Al content (49.13 wt-%), detected in the corroded region (spectrum 1), pointing out to a selective dissolution of the dendritic Zn-rich phase to form a zinc oxide/hydroxide and loss of Zn by the corrosion process. Conversely, in the non-attacked region, Spectrum 2, the Zn and Al contents in the dendrite are about 81.82 and 14.77 wt-%, respectively.
SEM/EDS after the corrosion test (polarisation curves): Zn–8 wt-%Al (P60 mm, position at 60 mm from the bottom of the DS casting).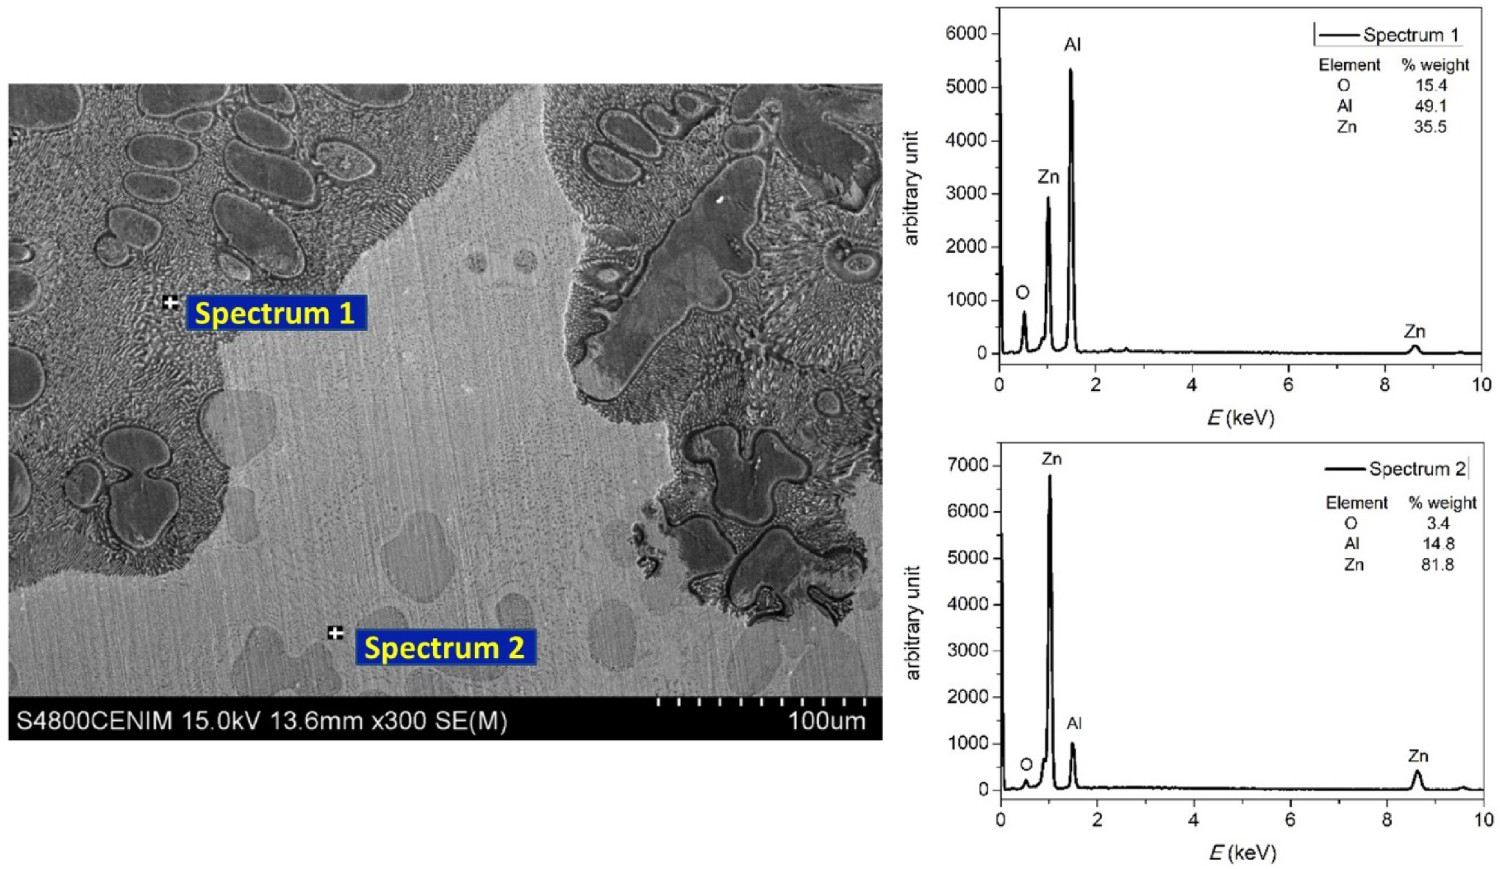
The different electrochemical nature of the phases that constitute the microstructure of an alloy is the responsible for the onset of a local corrosion cell. [52] In the present case, the local corrosion cell established between Zn and Al triggers the preferential dissolution of the zinc-rich phase. Figure 12 shows the preferential dissolution of the zinc matrix. At higher magnifications, Figure 12(b) shows a detail of the remainder Al lamellae left after Zn dissolution.
Secondary electron (SE) and backscattered electrons (BSE) images after the corrosion test (polarisation curves) of the Zn–8 wt-%Al alloy (position at 60 mm from the bottom of the DS casting): (a) attacked region, magnification of 1000× and (b) detail of the dissolution of the zinc matrix, magnification of 10 000×.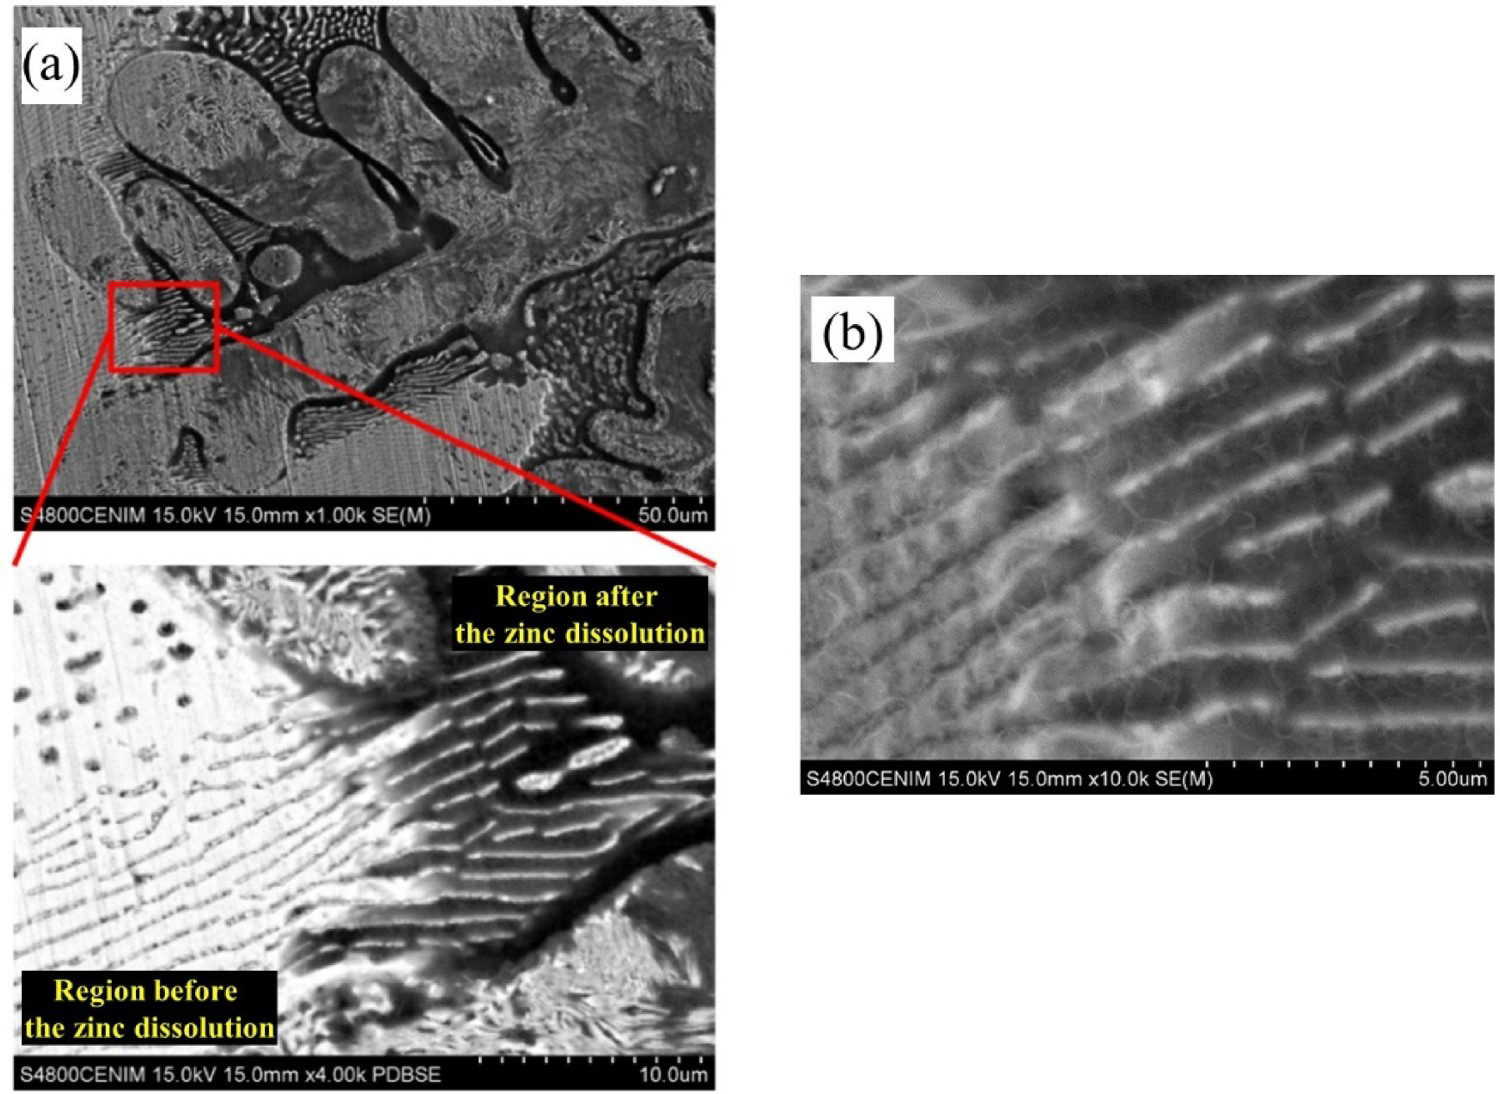
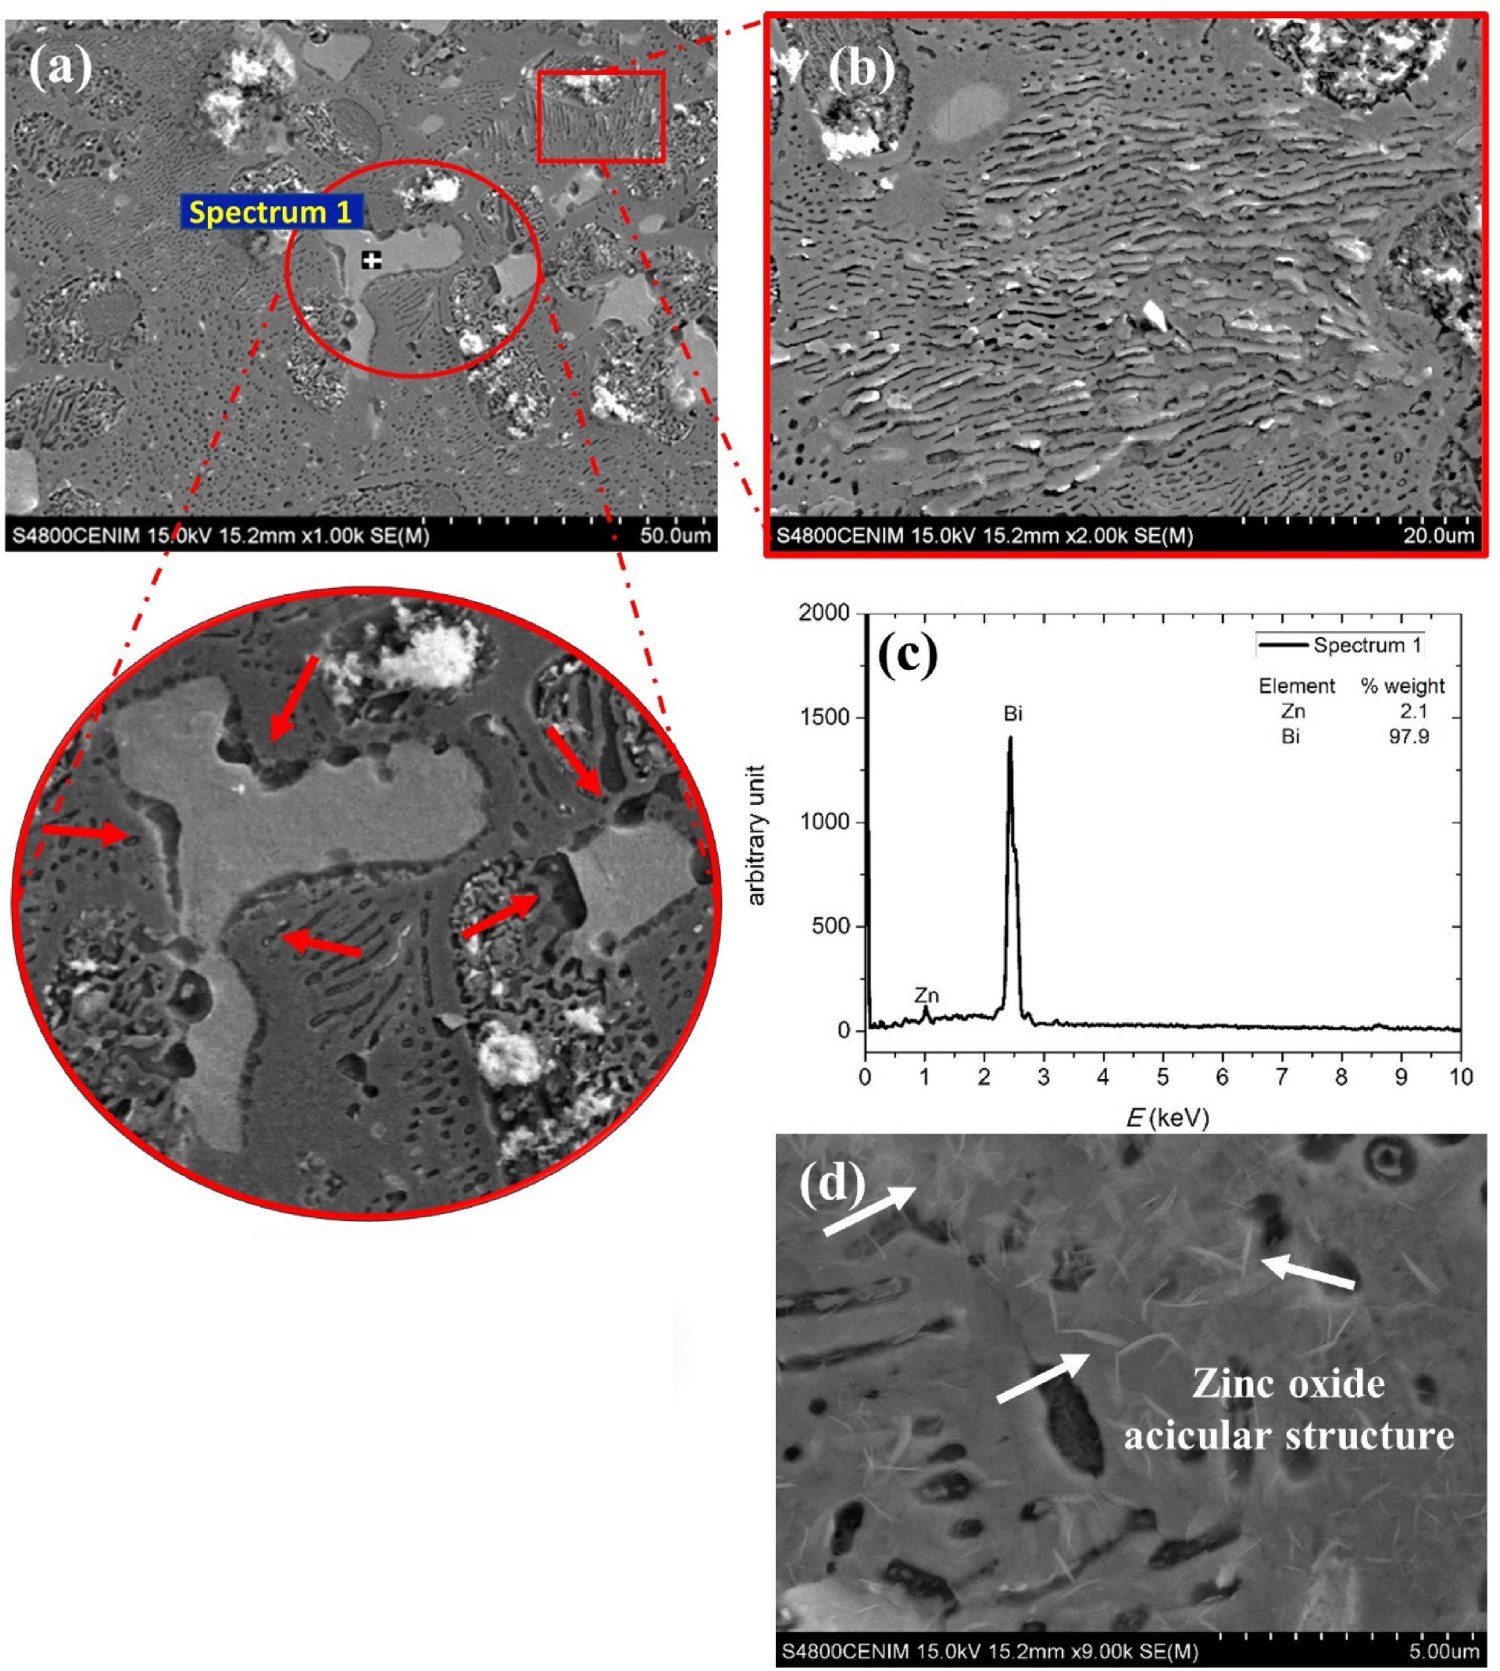
SEM images corresponding to the ternary Zn–8 wt-%–3 wt-%Bi alloy after the polarisation test are shown in Figures 13 and 14. In principle, as Bi has nobler corrosion potential compared with Zn and Al [53], the addition of Bi should induce preferential dissolution of both Zn and Al enriched areas (Figure 13). Small Bi particles are located between the lamellae and fibres of the monotectic matrix and, larger Bi particles are placed between the dendritic branches. The cathodic nature of these Bi particles triggers corrosion cells at the different locations of the surface, leading to the dissolution of the matrix and phases around them. This can be observed in spectrum 1 of Figure 13 obtained at the matrix surrounding a dendrite, where there is a lower content of aluminium, suggesting a preferential dissolution of Al in the matrix. Moreover, the presence of small holes (voids) in the matrix results from the detachment of submicron-sized Bi particles. The small particles of bismuth are difficult to notice in the corroded sample even by EDS analysis. Conversely, the EDS analysis corresponding to the dendrite, spectrum 2, reveals that the Al content rises as a result of the preferential dissolution of Zn. In Figure 14(a), it is possible to perceive the presence of larger Bi particles (Spectrum 1, Figure 14(c)) and the dissolution of the matrix and phases around them. In Figure 14(b), protruded lamellae and fibres can be noted due to partial matrix dissolution. Some small particles of bismuth have been detached as a consequence of the dissolution of the region around them. The higher oxygen content observed corresponds to zinc corrosion products (zinc oxides), which show their characteristic acicular morphology (Figure 14(d)). These results indicate that the addition of Bi not only decreases the corrosion kinetics but also change the corrosion mechanism and the resulting morphology of the attack.
SEM/EDS after the corrosion test (polarisation curves) of Zn–8 wt-%Al–3 wt-%Bi (P60 mm). Secondary electron (SE) images after the corrosion test (polarisation curves): Zn–8 wt-%Al–3 wt-%Bi (Position 60 mm). (a) Surface aspect of the corroded region, magnification of 1000×; (b) protruded lamellae and fibres resulted from partial matrix dissolution, magnification of 2000×; (c) EDS analysis of Bismuth particle and (d) zinc oxide morphology, magnification of 9000×.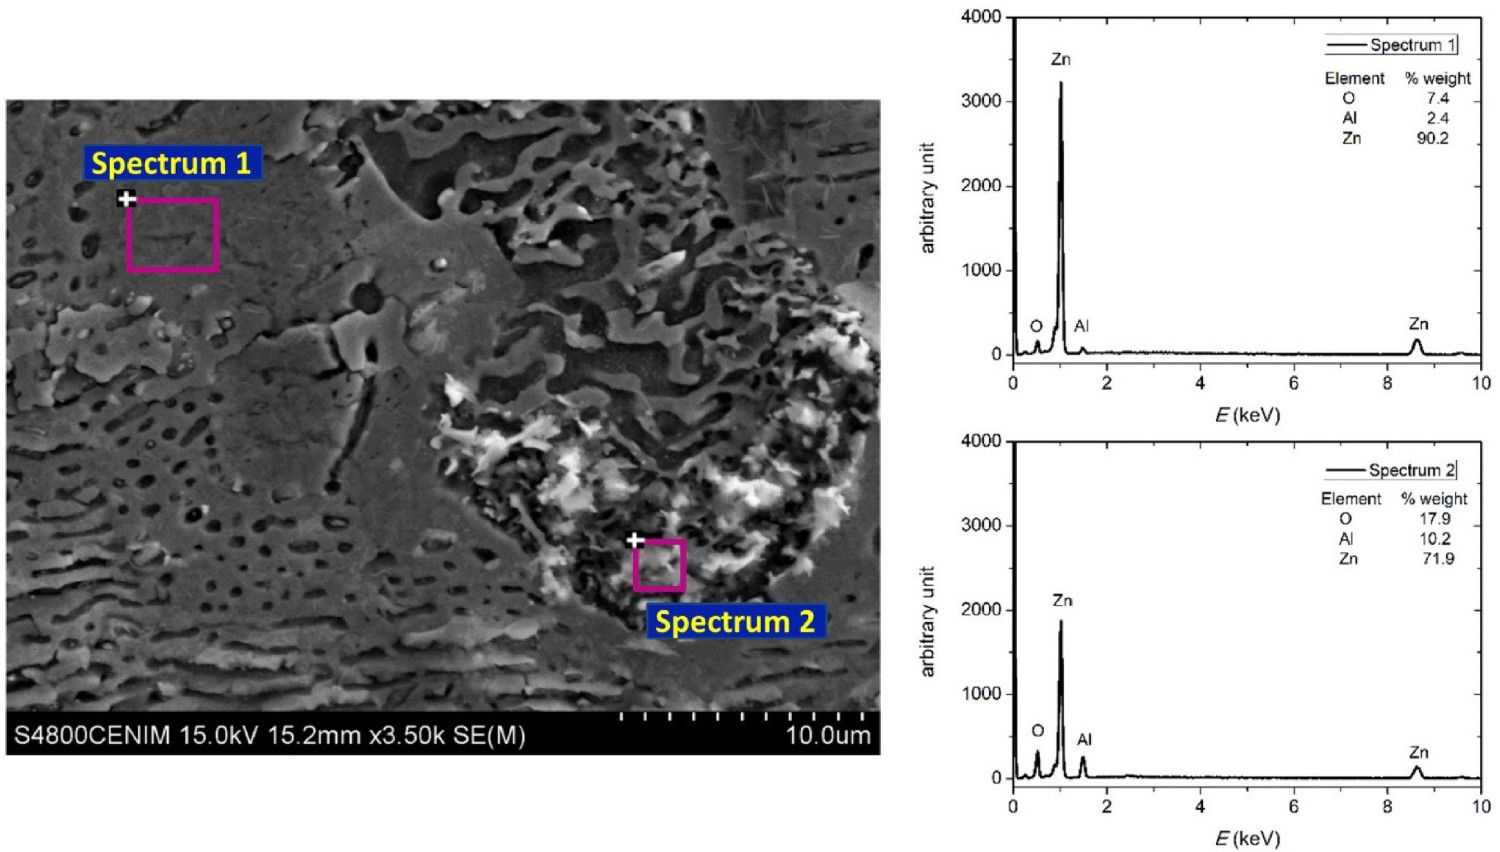
Galvanic couple between Zn–8 wt-%Al and Bi
In order to understand the role played by the Bi particles on the corrosion behaviour of Zn–Al–Bi alloys, the study of the galvanic couple established between Bi and Zn–8 wt-%Al was performed. The evolution with time of the mixed potential (E mix) and galvanic current density (i galv) flow between the Zn–8 wt-%Al alloy and pure Bi samples, with an area ratio of 1:1, in a 0.06 M NaCl solution was recorded for 168 h. Figure 15 shows the evolution of the OCP corresponding to both the uncoupled binary alloy and pure Bi samples. The potential of the binary alloy is about 700 mV more negative than that of Bi. This confirms the nobler nature of Bi with respect to the binary alloy, and therefore, the behaviour of the Bi particles as cathodes homogeneously distributed within the microstructure of the ternary alloy described before.
Open-circuit potential of Zn–8 wt-%Al and pure Bi in a 0.06 M NaCl solution for 168 h. The error bars indicate the standard deviation of the triplicate experimental results.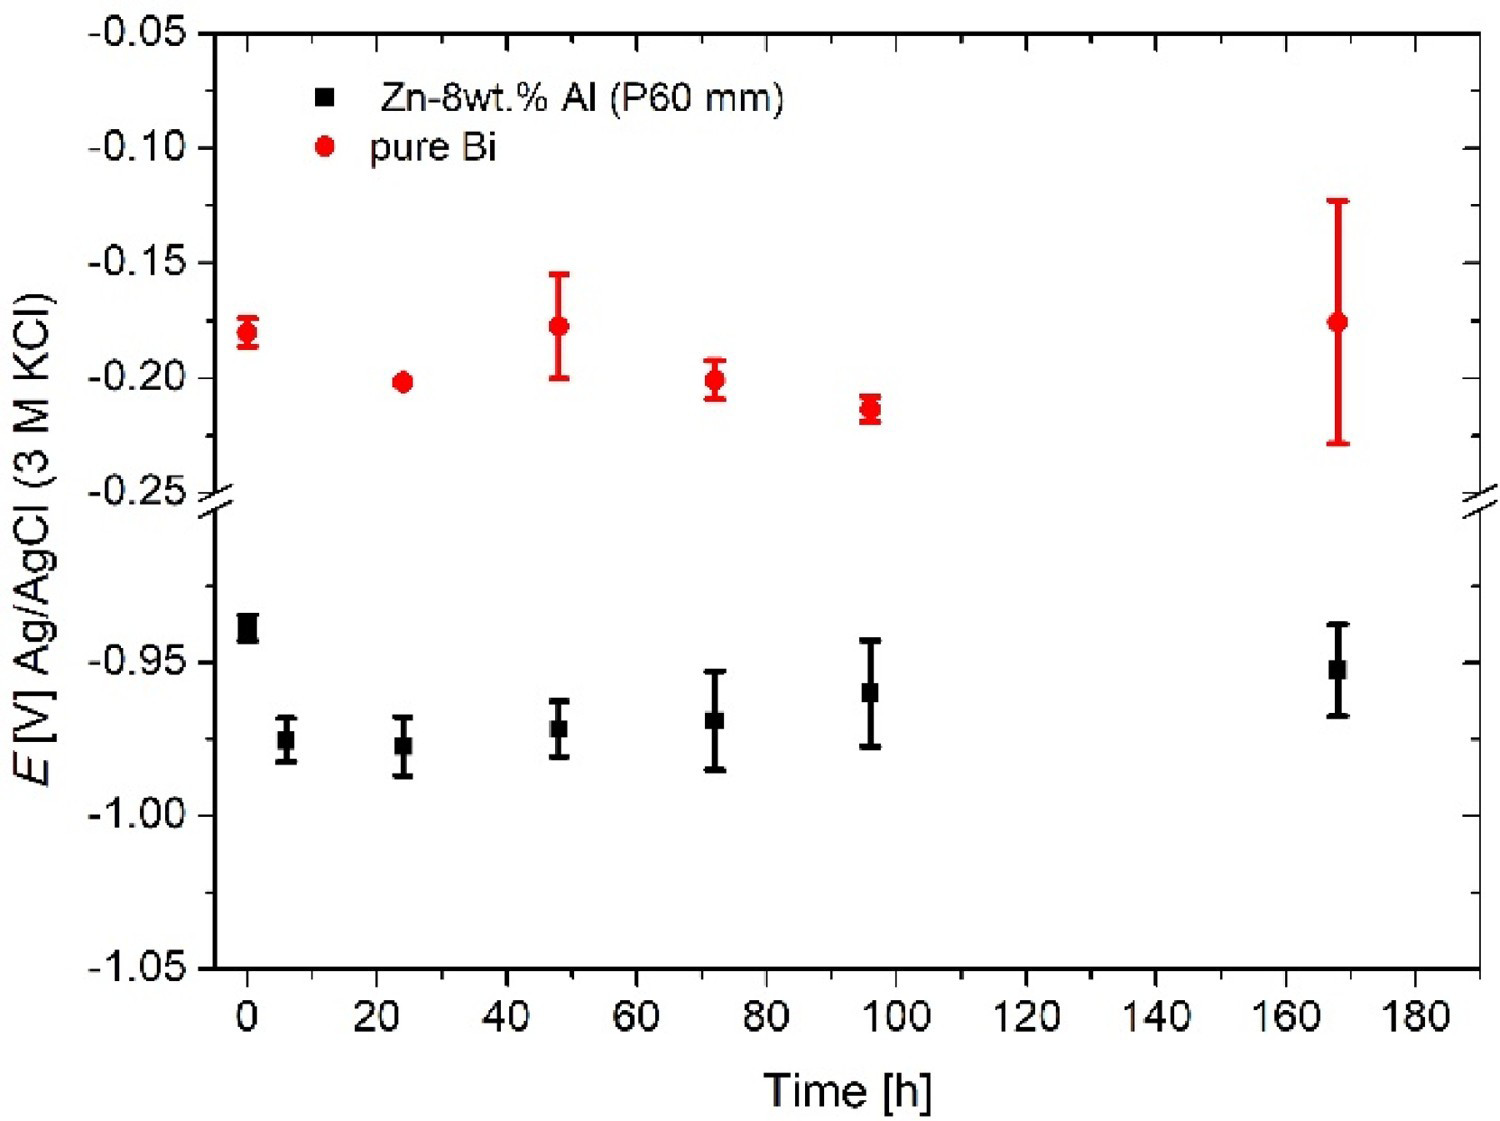
The variation of the mixed potential of the galvanic coupled formed by Zn–8 wt-%Al and Bi, as well as the galvanic current density flow, are shown in Figure 16. As can be seen in Figure 16(a), the mixed potential is close to the OCP value of the Zn–8 wt-%Al alloy (Figure 15), and it is practically constant over time. The galvanic current density (Figure 16(b)) is about 3.7 × 10⁻⁵ A cm−2 at the beginning of the immersion time and 5.3 × 10⁻⁵ A cm−2 after 168 h. The i galv is quite steady with time and it is just slightly higher than the corrosion rate of the uncoupled binary alloy, 18 µA cm−2. These results indicate that even in less favourable conditions, an area ratio of 1:1, the corrosion rate of the binary alloy increases just slightly but still within the same range of the uncoupled alloy. Therefore, it is expected that the ternary alloy, whose area ratio between the anode/cathode within the microstructure is lower, will have a lower corrosion rate than the evaluated galvanic couple, as it is confirmed by the corrosion current density obtained from the polarisation curves of the ternary alloys.
(a) Mixed potential (E mix) and (b) galvanic current density (i galv) of Zn–8 wt-%Al/Bi couple immersed in a 0.06 M NaCl solution for 168 h. The error bars indicate the standard deviation of the triplicate experiment results.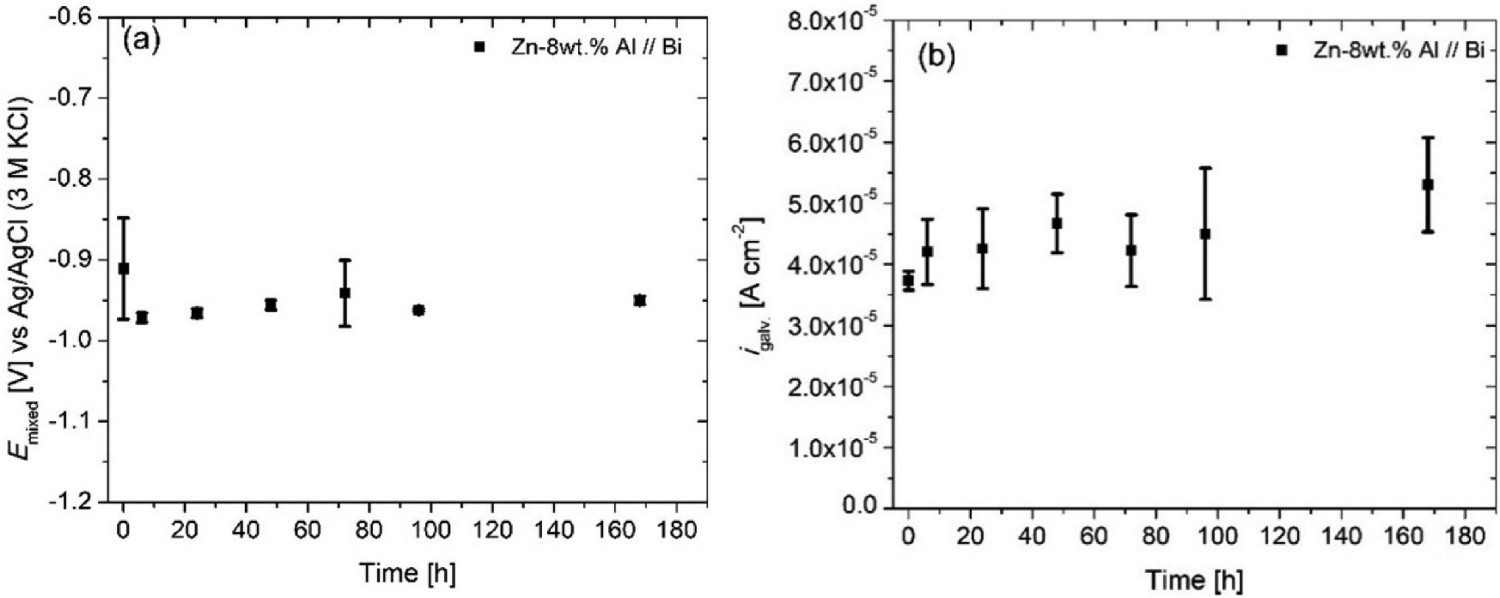
Conclusions
The corrosion resistances of Zn–8 wt-%Al and Zn–8 wt-%Al–Xwt-%Bi (X = 1.5, 2.3 and 3.0) alloys samples have been evaluated by means of electrochemical tests as well as by immersion tests.
The additions of Bi evaluated tend to decrease the corrosion current density as compared with the Zn–8 wt-%Al alloy. The average i corr decreases from 18 μA cm−2 for the binary alloy to 5.8, 4.4 and 3.3 μA cm−2 for the ternary alloys with 1.5, 2.3 and 3 wt-%Bi, respectively. Therefore, the higher the Bi content in the alloy, the lower the corrosion kinetics of the ternary alloys. The OCP of the binary Zn8 wt-%Al alloy is 250 mV nobler than those obtained for the ternary alloys. The addition of Bi into the Zn–Al alloy shifts the OCP in the cathodic direction no matter the Bi content. The galvanic tests carried out in coupled Zn–8 wt-%Al alloy/pure Bi specimens with an area ratio of 1:1 revealed that the mixed potential value of the system is close to the OCP value of the binary alloy and it remains practically constant over time. Similarly, the galvanic current density is just slightly higher than that of the binary alloy in non-coupled conditions. This means that despite the potential difference of 700 mV between bismuth and the binary alloy, the galvanic coupling established between pure Bi and the Zn–8 wt-%Al alloy, with an area ratio of 1:1 does not increase significantly the corrosion rate of the binary alloy. Both binary and ternary alloys do not show significant dependence of the corrosion kinetics on the coarsening of the microstructure, i.e. with the increase in the secondary dendritic arm spacing. Surface analyses of the samples after the polarisation and immersion tests revealed a change in the morphology of the product of the corrosion attack with the addition of Bi as compared with that of the binary alloy.
Conflict of interest
The authors declare that they have no conflicts of interest.
Footnotes
Disclosure statement
No potential conflict of interest was reported by the authors.