
Abstract
The combined effects of high temperatures and different acetic acid (HAc) concentrations on corrosion and deposition of FeCO3 scales on API X65 carbon steel in CO2-saturated brines were investigated. Conditions with the absence and presence of 100 and 600 ppm of HAc were evaluated under high pressure at 90°C and 120°C. Electrochemical impedance spectroscopy, linear polarisation resistance, weight loss and characterisations through scanning electron microscopy, energy-dispersive spectroscopy and X-ray diffraction were conducted. Conditions with the absence of acid presented a huge deposition of sweet corrosion products and low corrosion rates. The addition of 100 ppm of acid at 90°C did not increase significantly corrosion rates; however, it retarded the precipitation of FeCO3. Higher temperatures favoured iron carbonate nucleation even in the presence of HAc. The highest corrosion rates were observed for the environment with 600 ppm of HAc at 120°C.
Introduction
Corrosion is responsible for the major problems and losses observed for the oil and gas structures in general [1 3]. Carbon steel pipelines are one of the most susceptible given the medium aggressiveness that oil and its byproducts may provide. CO2 is one of the main contaminants present in this environment and its effects have been widely studied in recent years [4 8]. The CO2 mechanism, known as sweet corrosion, takes place when the gas is hydrated forming H2CO3. The latter dissolves releasing carbonates (e.g  and
and  ) into the medium. The carbonates may combine with the iron ions released from the corrosive process forming an iron carbonate [9,10], a corrosion product, according to the following reaction:
Acetic acid (HAc) is the main organic acid found into the pipelines of oil and gas industry [12,13] and CO2 corrosion is known to be deeply affected by its presence in brine media [14,15]. One of the major effects played by HAc in sweet corrosion is related to the formation of a protective layer of FeCO3 [16 18]. Crolet, Thevenot and Dugstad [19] suggested that the presence of HAc causes an extra reserve of H+ that reduces pH and increases the solubility limit of the corrosion scales. Since that the solubility limit is pH-dependent [20], the precipitation and growth of protective layers might be delayed depending on the concentration of HAc.
Numerous other studies have focused on evaluating each parameter that affects, alongside with HAc, the formation of FeCO3 in acidic media, such as temperature and pH. Gulbrandsen and Bilkova [21] observed that at room temperature, HAc might play an inhibitive role in the anodic reaction, decreasing corrosion rates. However, George and Nesic [22] reported a high effect by HAc in the cathodic reactions at temperatures up to 80°C, mainly at pH lower than 4. Dugstad [23] dedicated to assess the amount of Fe2+ needed to observe FeCO3 precipitation in different concentrations of HAc in CO2-saturated brines at 60°C. The author concluded that the necessary concentration of Fe2+ for pH values between 3.5 and 4 does not vary significantly, and a big drop is seen at pH above 4.5, when the necessary concentrations tend to values close to zero.
Although many studies have been conducted about the effects of HAc on the formation of sweet protective scales, very little have been dedicated to comprehend the effects under temperatures above 80°C. All the works aforementioned in this section limited their temperature range of evaluation up to 80°C, which is surprising given the fact that a lot of works have reported that higher temperatures are also related with better precipitation and coverage of corrosion products, mainly in the range from 90°C to 120°C [8 10,24].
Consequently, this work focuses on the combined effect of different concentrations of HAc on the sweet corrosion of API X65 carbon steel in brines under temperatures of 90°C and 120°C. Conditions with the absence and the presence of 100 and 600 ppm of HAc were evaluated through electrochemical tests, weight loss and surface characterisations to enhance understanding of the formation of CO2 corrosion products under such complex media.
Materials and methods
The experiments were conducted in a liquid stationary environment containing CO2 saturated with and without the addition of acetic acid. Different concentrations of HAc were set based on the common ones found in the field, and six conditions were defined, as shown in Table 1. The initial pH values of each condition were acquired through simulation by the thermodynamic software Multiscale 8.0, given the difficulty of measuring pH under high pressures and temperatures. Every condition was composed by a base solution of 1.8 L of distilled water with 0.1% wt NaCl to perform electrochemical and weight loss tests. A 2-L autoclave (Figure 1) was used to reach temperatures of 90°C and 120°C at a fixed 5 bar pressure of CO2 for all tests over 48 h. The autoclave temperature was controlled and monitored via the heat system for all tests. The chemical composition of API X65 carbon steel in weight percentage is listed. C: 0.090, Mn: 1.45, Si: 0.27, P: 0.013, S: 0.002, Ni: 0.27, Cr: 0.08, Mo: 0.07 and Fe balanced.
Autoclave setup. Test conditions (saturated CO2).
Sample preparation
The specimens for the corrosion tests were machined in two different geometries. For the electrochemical impedance spectroscopy (EIS) and linear polarisation resistance (LPR) tests, the cylindrical shape (type A) with 630 mm2 exposed area was used. A rectangular type with dimensions of 20 mm × 70 mm × 2 mm (type B) for weight loss measurements and further surface analysis. All specimens (3 types A and 5 types B for each test) were ground with a series of silicon carbide (SiC) papers (240, 400 and 600), cleaned with distilled water and acetone, dried with air, weighted and packaged in a vacuum desiccator to prevent any pre-oxidation on the surfaces.
Weight loss
Prior to every test, the samples of each condition had their initial weight taken with an analytical balance with ±0.0001 g accuracy. After 48 h of tests, the samples were removed from the autoclave, rinsed with distilled water, cleaned with acetone, dried with hot air and stored for further analysis. After the characterizations, the samples had their corrosion products completely removed, according to ASTM G31 [25] standard, as well as had their final weight loss measured. Then, with the initial and final weight, corrosion rates were calculated with the following equation:
Electrochemical tests
The electrochemical tests were performed inside an autoclave, under the conditions described in Table 1. Tests were performed using a three identical electrode cylinders as a counter, reference and work electrodes. This assembly was adopted based on the work developed by Souza et al. [8] because, given the aggressiveness of the evaluated environments, the tests would hardly provide reliable and reproducible responses with the use of conventional reference electrodes. Some researchers have used the same assembly and have also observed a good correlation with results obtained with a conventional assembly [26–29].
Prior to the tests, CO2 was used to deaerate the Autoclave and the Supporting reservoir, in which the solution was being simultaneously saturated with the CO2 gas. This process lasted for 4 h in order to guarantee the saturation of the solution inside the supporting reservoir as well as the complete removal of any trace of O2 from the system. Afterward, the solution was transferred from the supporting reservoir to the preheated autoclave by pressure difference. As of this step, the electrochemical and weight loss tests started.
An AUTOLAB μAutolab type III/FRA2 potentiostat with NOVA 1.11.2 software was used to the acquisition and processing of the electrochemical results.
Electrochemical impedance spectroscopy
The test parameters were evaluated on the frequency range from 10 mHz to 10 kHz, applying tension with an amplitude of 10 mV and obtaining 7 measures per decade of frequency.
Linear polarisation resistance
LPR technique was used to monitor steel behaviour during the immersion time in each condition in a range of −15 to 15 mV, with 1 mV step potential and a scan rate of 0.33 mV s−1.
Surface characterisation
For each studied condition, samples were analysed by scanning electronic microscopy (SEM) with energy-dispersive spectroscopy (EDS) coupled using the HITACHI TM 3000 equipment. X-ray diffractometry (XRD) was also conducted through a Bruker D8 Advance equipment with X-ray beams focusing in the samples with 2∅ ranging from 20° to 90° in order to identify and quantify the surface precipitated films.
Results
Weight loss
The corrosion rates calculated from weight loss for all six conditions are plotted over the temperature in Figure 2.
Weight loss corrosion rates.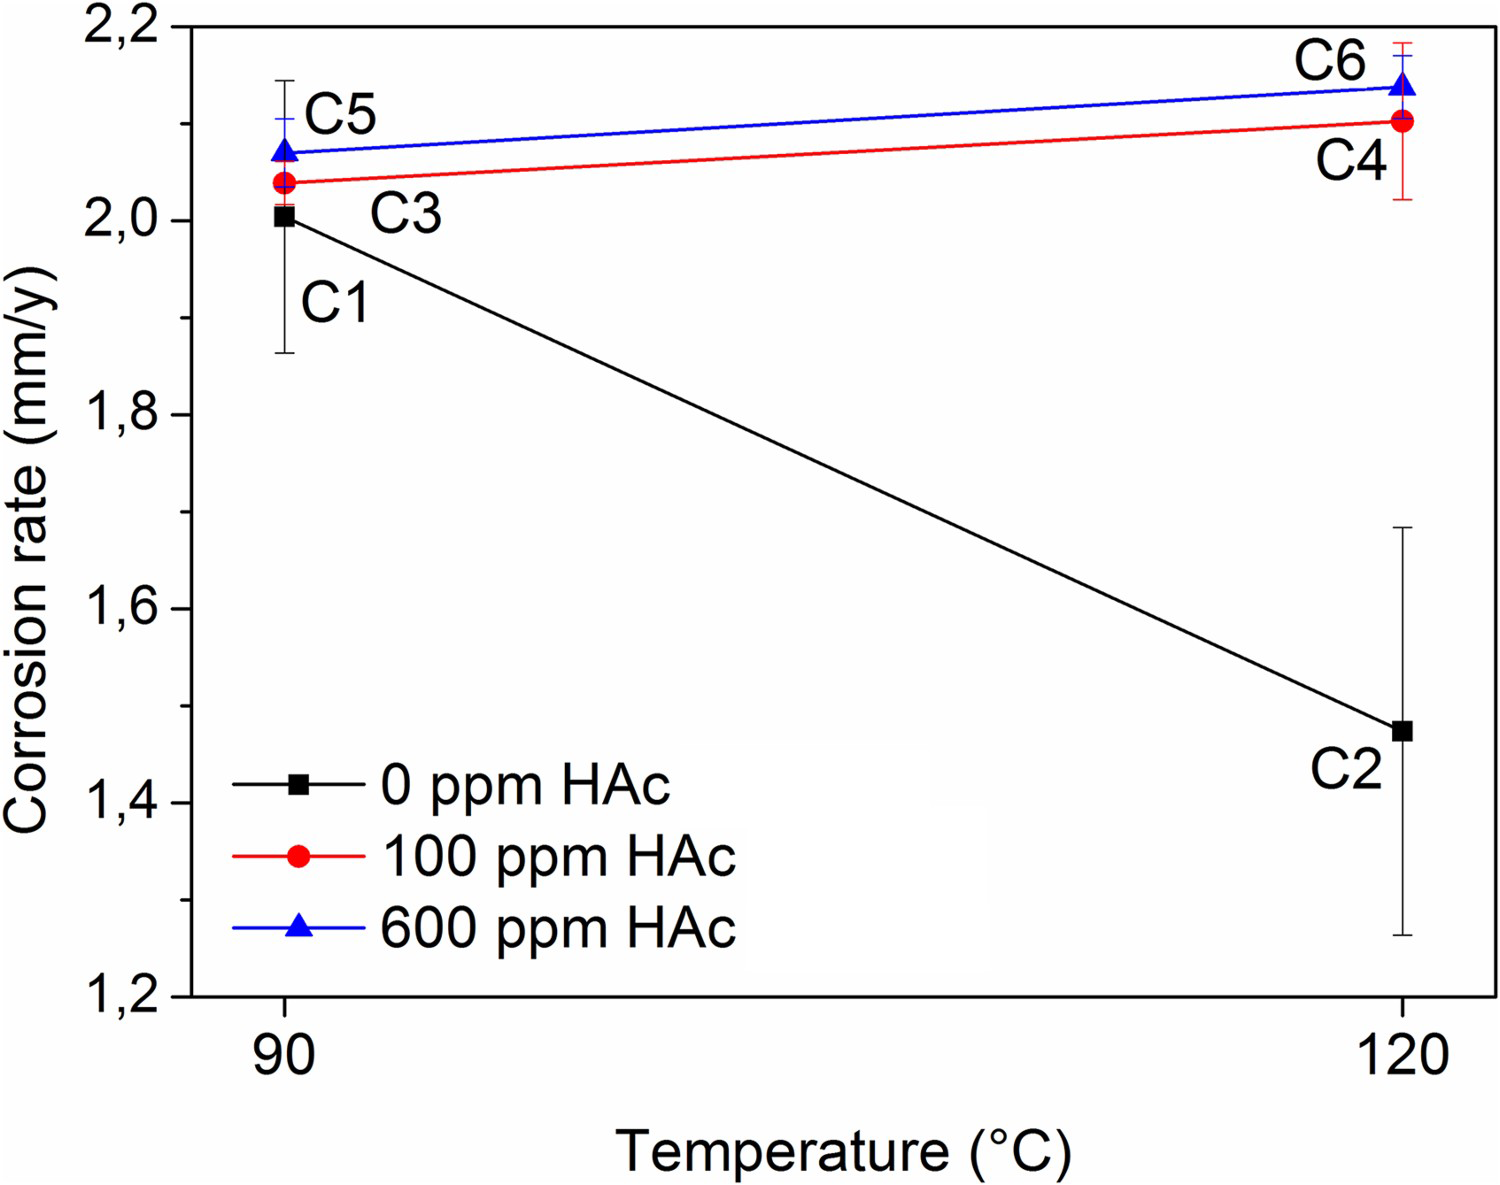
From Figure 2, it is possible to verify that the addition of HAc in the medium promotes an increase in the corrosion rates. A small raise is seen at 90°C, from condition with the absence of HAc C1 to the others with the addition of 100 and 600 ppm C3 and C5, respectively. However, the corrosion rates rose when comparing C2 (absence of HAc) with C4 and C6 (100 and 600 ppm of HAc, respectively). From Figure 2, it is also noticeable that the increase promoted by the temperature on the corrosion rates, in conditions with the same concentration of HAc, was almost the same for 100 and 600 ppm. On the other hand, the decrease on the rates seen with absence of HAc comparing C1 to C2 was more pronounced. The surface examinations in the next sections will better elucidate the differences on the rates among all conditions.
Electrochemical results
Electrochemical impedance spectroscopy
Figure 3 presents the Nyquist plots for all six conditions studied. The values used for the axes were set referencing the condition with the highest values, aiming to compare equally each condition. Therefore, zoom-in graphs were applied in every condition to show details.
Nyquist plots for the six conditions.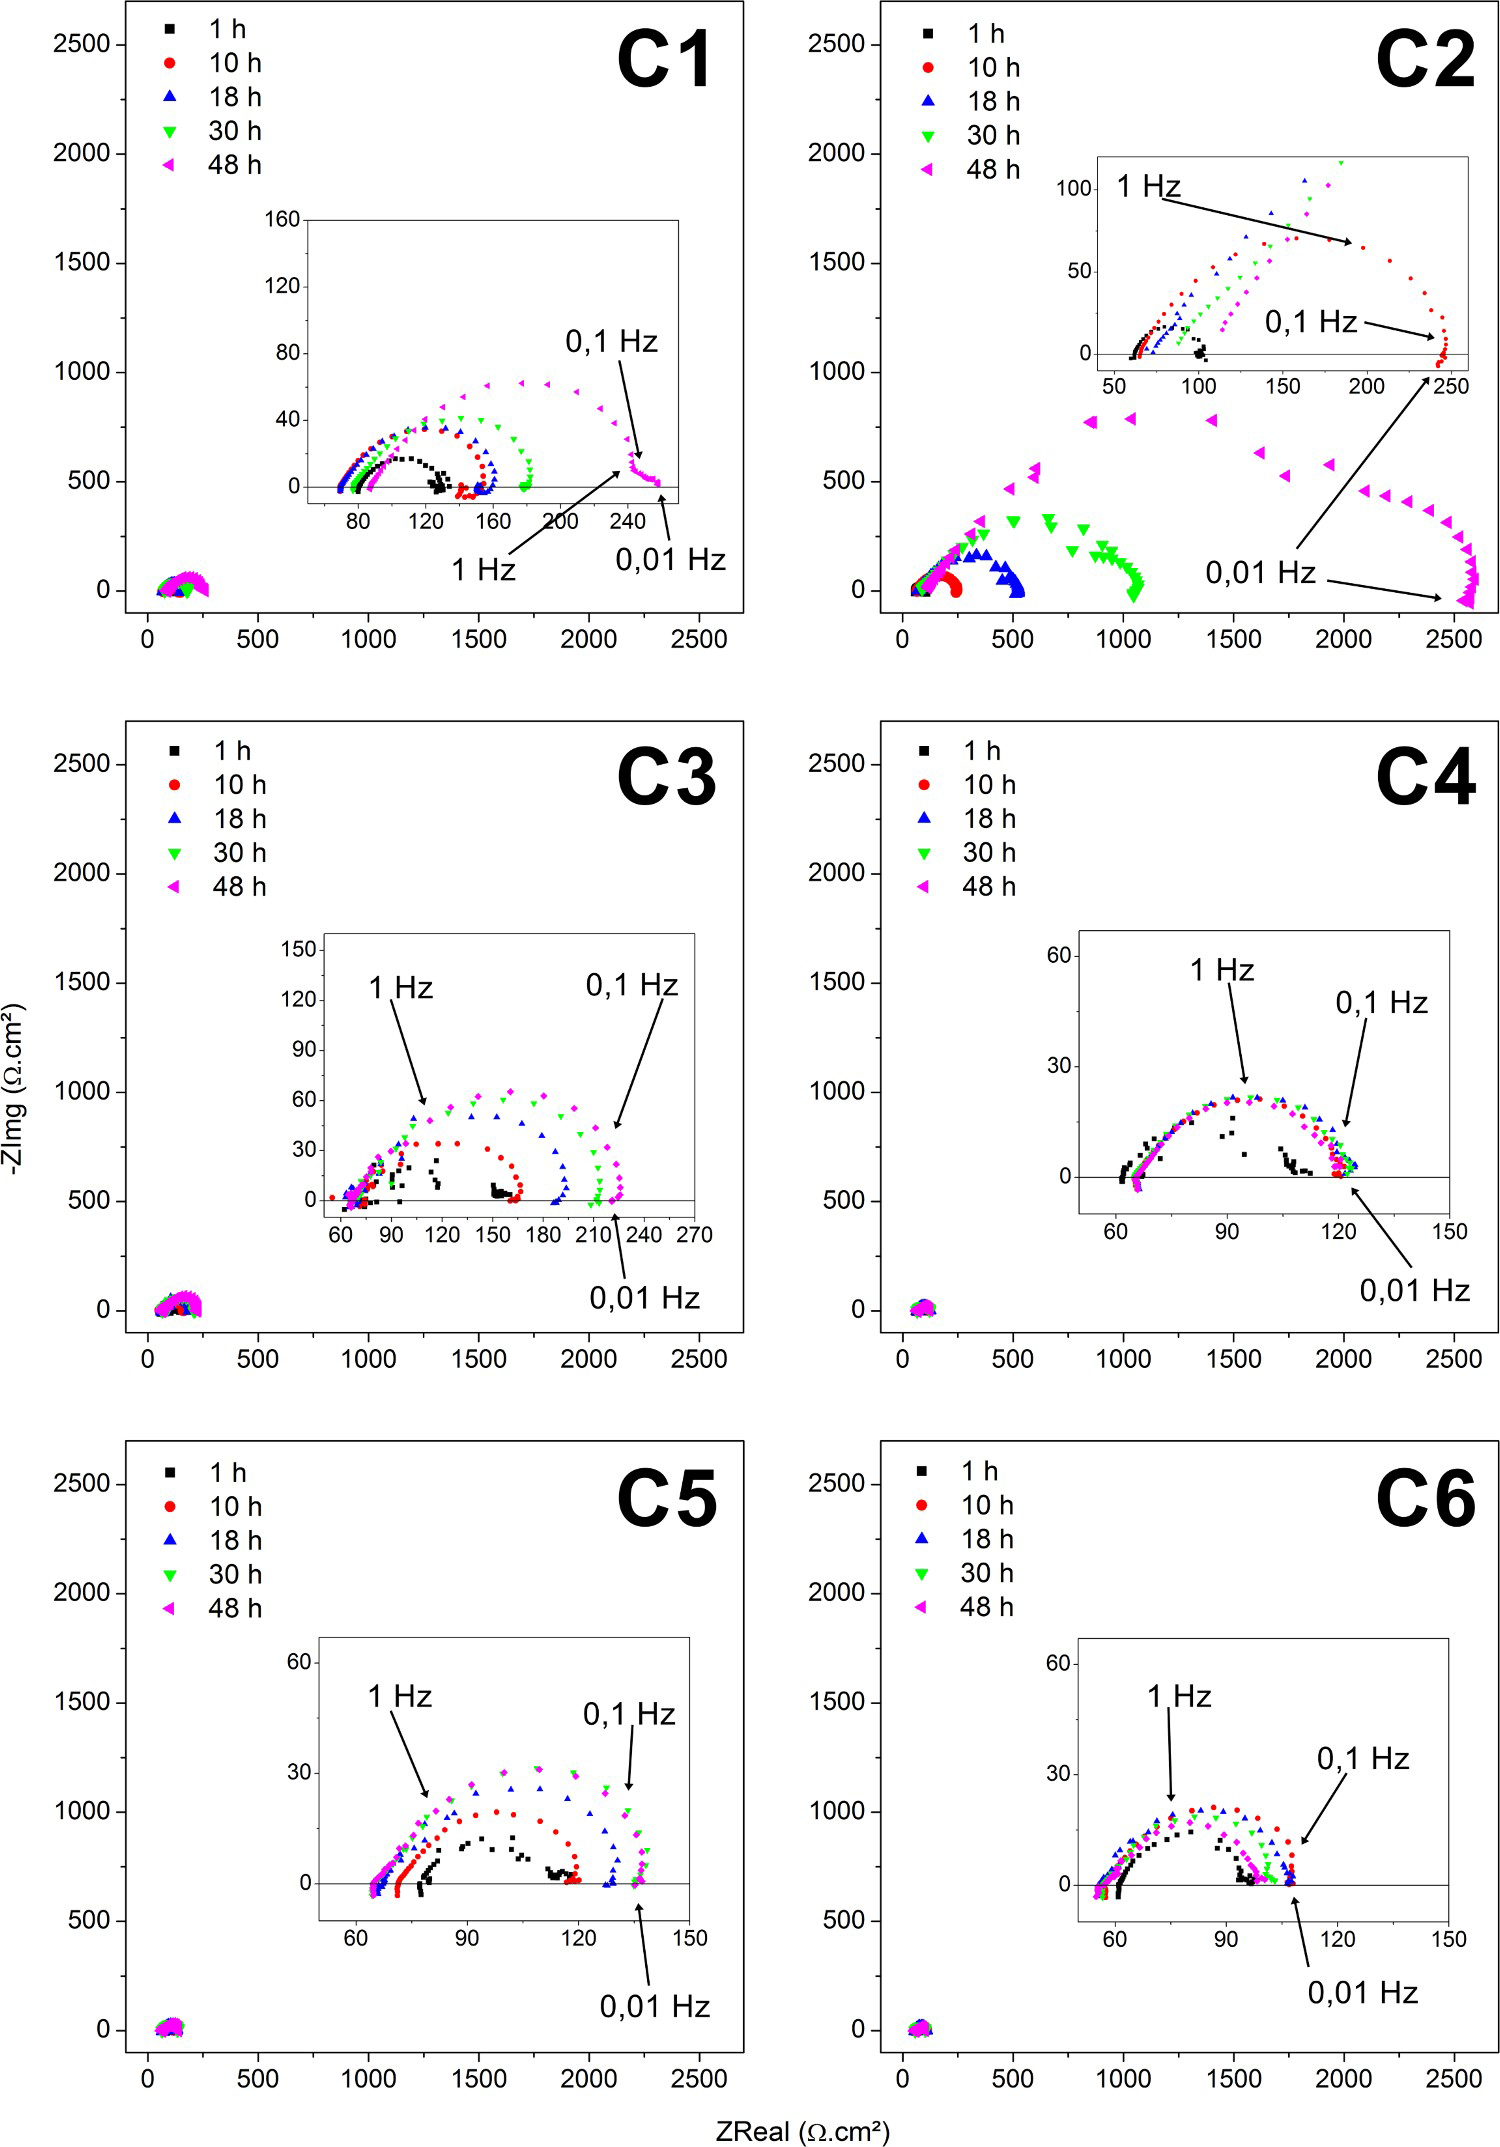
The plots of C1 and C2 show a semicircle from high to medium frequencies and the appearance of a second arc with inductive character at low frequencies. The inductive feature was more evident at 90°C while at 120°C. The shift in temperature from C1 to C2 also promoted a big increase on the impedance values at low frequencies region once that C2 reached more than 2500 Ω.cm² in the Real axis, while C1 reached around 250 Ω.cm², after 48 h of experiment, at 0.01 Hz. At 120°C (C2), the capacitive tendency in the second arc, seen only in the last interval of C1, was more visible and occurred from the 18-hour interval ahead. Although condition C2 has presented the greatest curves as well as the highest Rp (polarisation resistance) of all conditions evaluated at the end of the tests, its main electrochemical behaviour was resistive, what will be confirmed by the Bode analysis.
With the presence of acetic acid, C3–C6 plots presented distinct behaviours when compared with conditions without acetic acid. Although an increase in the impedance values by the hours was also noticed, as seen in conditions C1 and C2, with the presence of HAc only one arc was noticeable after 48 h of the test were observed.
In C3 plot, with the addition of 100 ppm of acetic acid at 90°C, it is possible to notice a slight reduction in the capacitive arc when compared to C1 plot, without the addition of acetic acid. Still, no visible inductive arc was seen at low frequencies. In C4 plot, condition with addition of 100 ppm of acetic acid and temperature of 120°C, a severe reduction in the capacitive arc diameter was noticed, which is aggravated when compared with its equivalent condition without the addition of acetic acid, C2. Unlike what occurs between conditions C1 and C2, the increase in temperature provided a reduction in the diameter of the capacitive arcs between C3 and C4, accelerating the corrosive process.
In the fifth condition (C5), with 600 ppm of acetic acid at 90°C, the behaviour of the curves was maintained with a small reduction in the diameter of the capacitive arc related to the third condition (C3). The increase in HAc concentration did not cause great differences on the EIS measurement between conditions C3 and C5.
In condition C6, with 600 ppm of acetic acid at 120°C, the reduction on the diameter of the capacitive arc was aggravated with respect to the previous condition. This condition also confirmed the negative role played by the temperature increase. Both conditions C4 and C6 were the ones with less development of the capacitive arcs, consequently lower Rp values.
Bode plots displayed in Figure 4 confirm the results observed for the Nyquist plots in Figure 3.
Bode modulus (line plot) and phase (point plot) for the six conditions.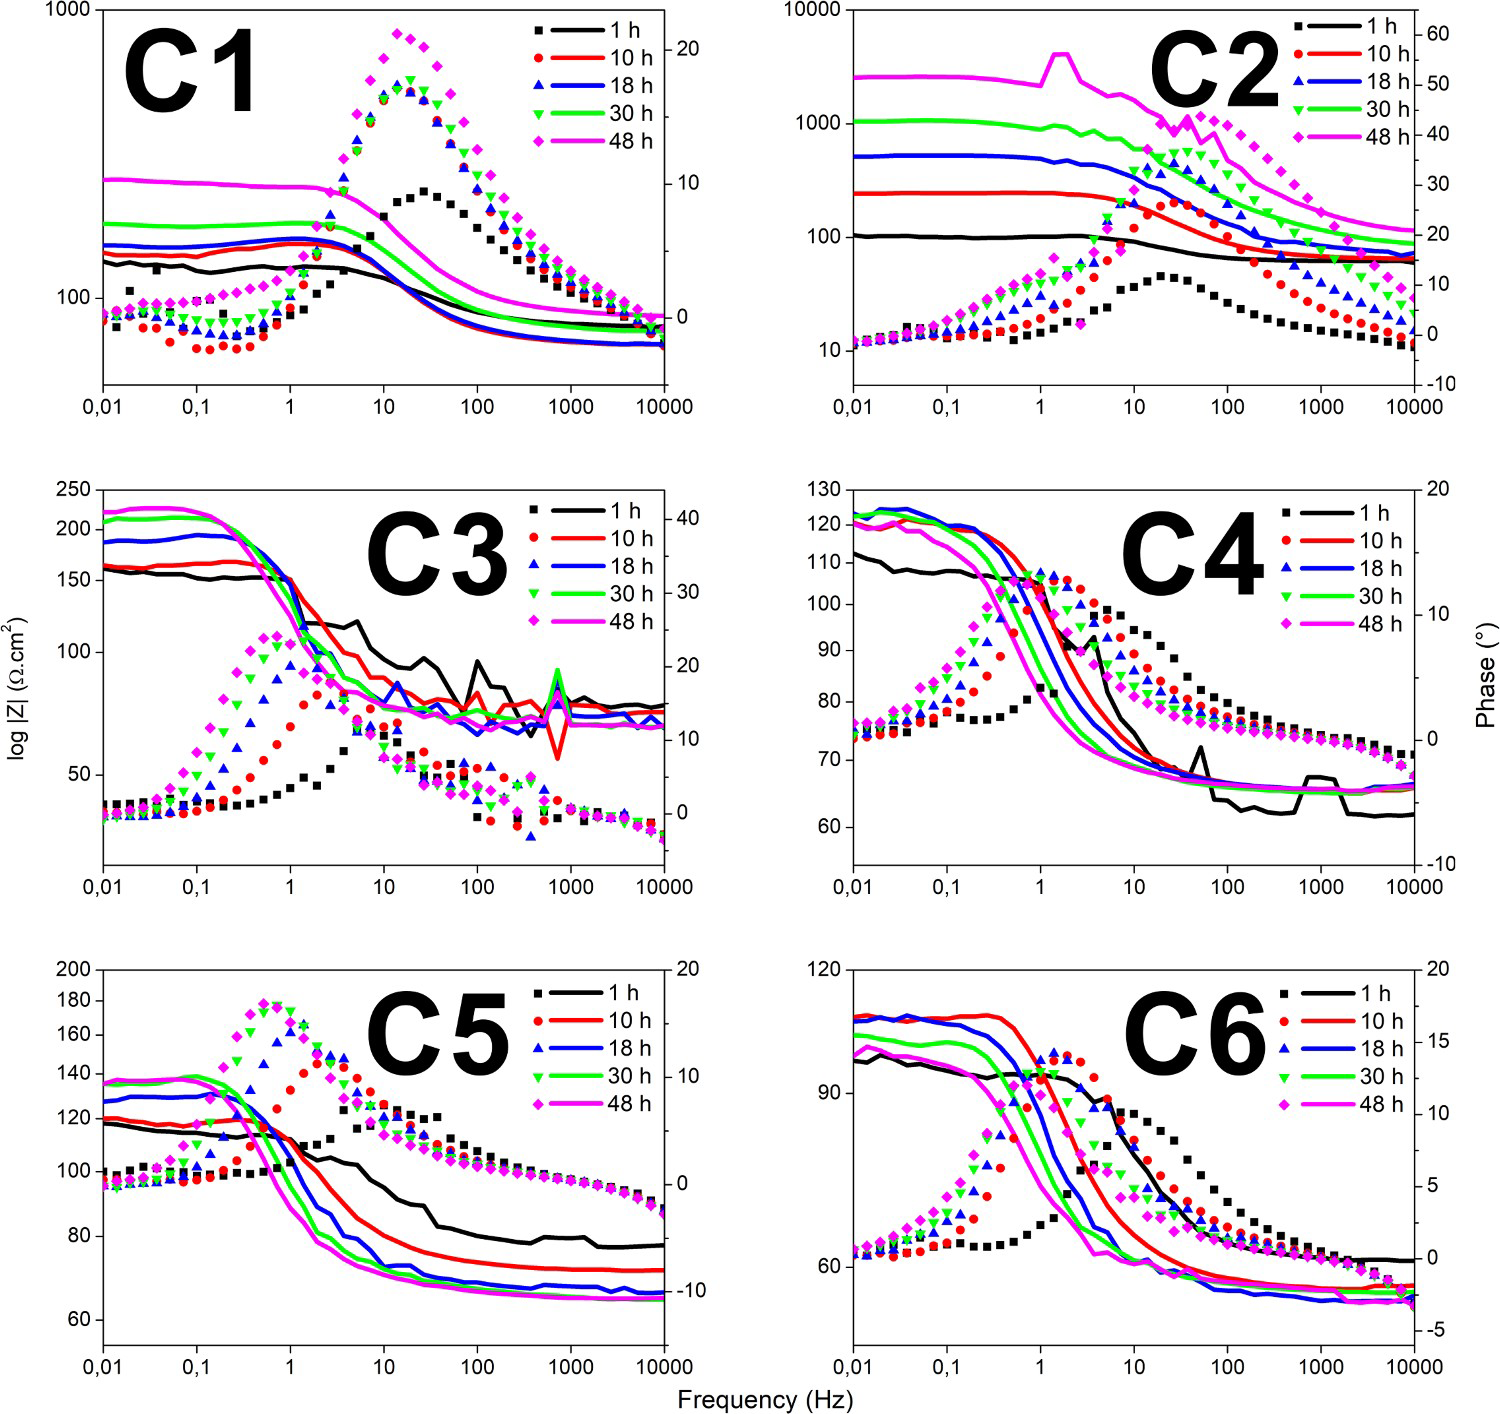
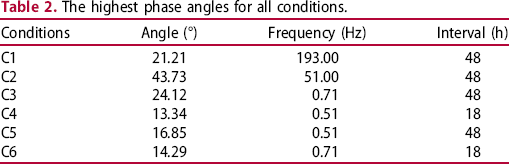
The highest phase angles for all conditions.
In the presence of HAc, either conditions with 100 ppm (C3 and C4) or 600 ppm of HAc (C5 and C6) presented a displacement on their phase peaks towards the low-frequency region. This behaviour was expected since all of these four conditions had their main capacitive arc related to the double-layer capacitance, and this tendency is commonly seen over time. However, no condition with the presence of acetic acid has reached phase angles higher than 25°, which means low protective power.
Conditions C4 and C6, at 120°C, were the ones with the lowest values of phase angles. The higher angles were 13.345° and 14.229° for conditions with 100 and 600 ppm, respectively. Differently from their equivalent conditions at 90°C (C3 and C5) and the two with absence of the acid (C1 and C2), the higher phase angles for conditions C4 and C6 were observed at 18 h. After that, for both conditions, the electrochemical responses have decreased in terms of capacitive character. This indicates that different electrochemical behaviours are seen in the electrode surface when the temperature is heated up in the presence of HAc. This behaviour will be better elucidated in the next sections through surface examinations.
Figure 5 presents two electrochemical equivalent circuits. Figure 5(a) represents conditions with inductive character in which R s is solution resistance, CPEdl is constant phase element representing the double-charge layer capacitance, R ct is the charge-transfer resistance, R L is the inductive resistance and L is the inductance. Figure 5(b) represents conditions with huge formation of corrosion products hence more capacitive behaviour in which there is a CPE for the protective layer and an R pore representing the imperfections on the layer with an exposed substrate. None EIS fitting were performed in this work.
Equivalent circuits for the EIS data. (a) Inductive character and (b) capacitive character.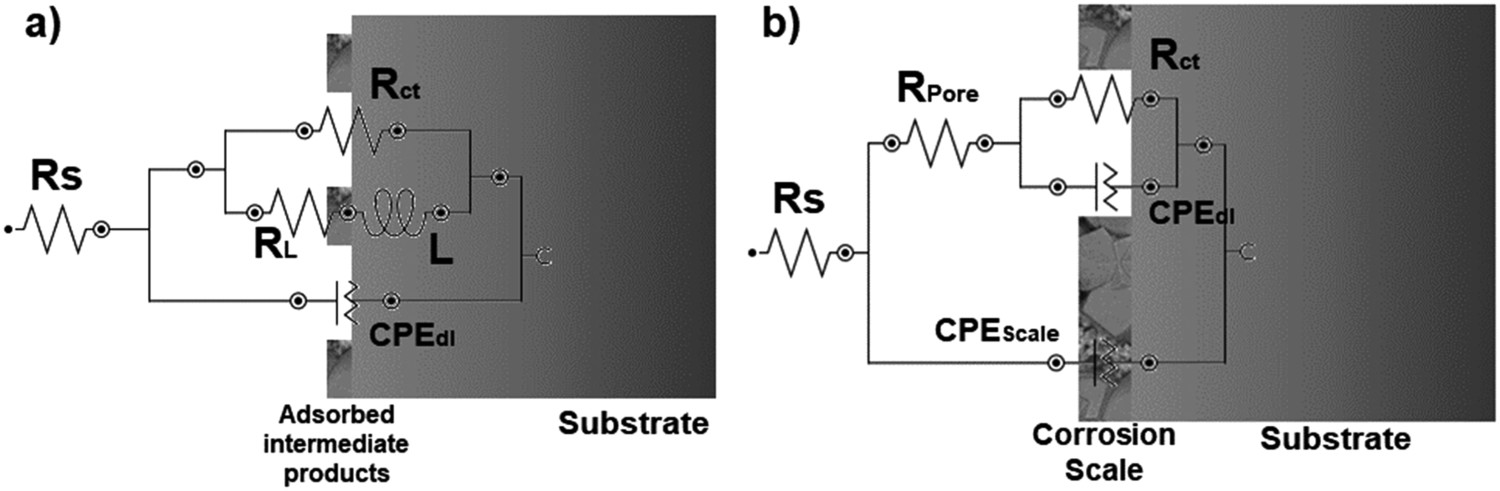
Linear polarization resistance
Figure 6 exhibits the corrosion rate measured throughout the 48 h of test, for each condition, from the R p values, extracted from the LPR tests. The rates were calculated according to the ASTM G59 [30] by linear regression. To ease viewing, Table 3 presents the corrosion rates magnitude decrease percentile from the beginning of the experiment (0 h) to the end (48 h) for C1–C6.
LPR corrosion rates. Corrosion rates decrease in magnitude throughout the test for all conditions.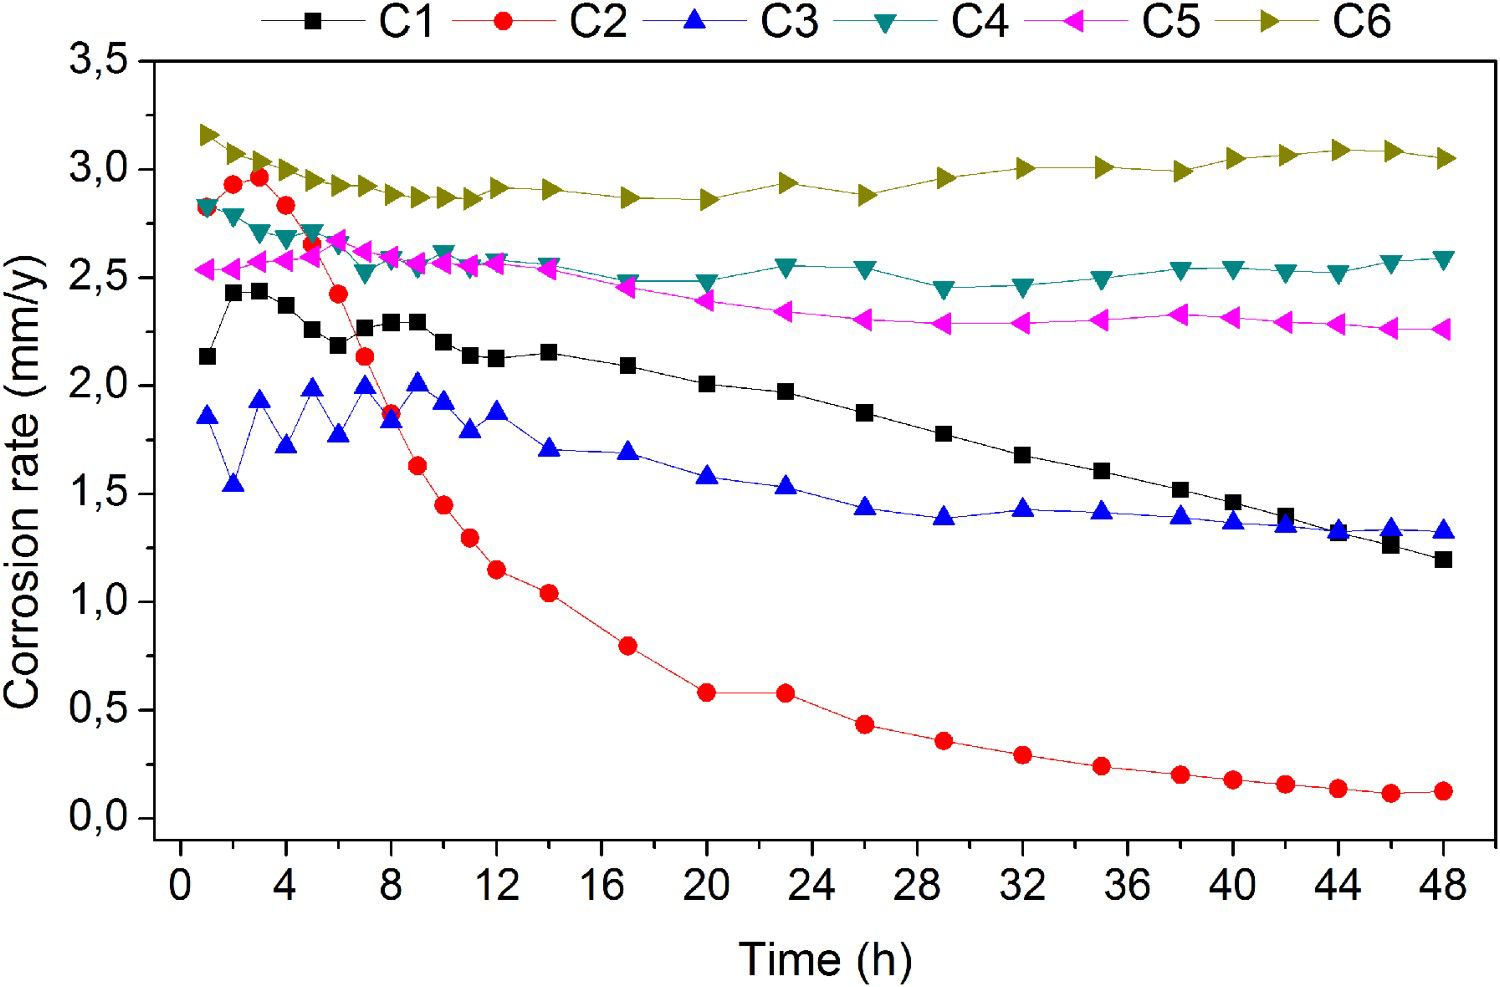
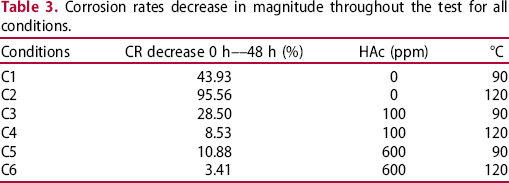
In the absence of HAc, C1 and C2 were the conditions with the lowest rates at the end of the test among all conditions. Condition C2 in particular, started with high corrosion rates, but after 4 h a huge decrease was observed until approximately 24 h. Afterwards, corrosion rates have levelled-off with a slight decrease until the end of the test. As shown in Table 3, the corrosion rates have decreased 95.56% since the beginning of the test for condition C2.
On the other hand, at 90°C without HAc (C1), the corrosion rates oscillated in the first hours and a constant decrease, that lasted the rest of the test, were seen only after 12 h. This tendency made corrosion rates of C1 the second lowest of all conditions evaluated, which is in agreement with the rates calculated by weight loss, as shown in Figure 2.
For C3, even with the presence of 100 ppm of acid, the rates presented similar behaviour as seen by C1. Firstly, the oscillation until the first 12 h and then, a modest decrease on the corrosion rates. It is also verified by the high percentage of decrease for C3 in Table 3. Furthermore, surprisingly the rates for C3 started lower than the ones observed at 90°C without HAc, but were a bit higher than C1 at the end of the test. The few differences between the responses of C1 and C3 are in agreement with the EIS results shown above. When the temperature was heated up to 120°C, (C4) the corrosion rates started and remained higher during the whole immersion time, with only 8.53% of decrease. Here, condition C4 presented the opposite behaviour of its equivalent without HAc (C2), and no relevant signal of improvement on the polarisation resistance was observed.
Both conditions with 600 ppm of HAc (C5 and C6) exhibited a similar tendency on their corrosion rates: a fluctuation on their values throughout the tests without any remarkable decrease. For these two conditions, the final corrosion rates remained almost the same of the beginning of the tests, and the one evaluated at 120°C (C6) presented the highest rate by LPR measurements, among the eight conditions, with a decrease of only 3.41%. This latter result is once again in agreement with corrosion rates by weight loss.
Corrosion products analyses
SEM and EDS
Figure 7 presents the surface SEM magnifications of the six conditions after the 48 h of the test.
Backscattered electron image for conditions C1–C6.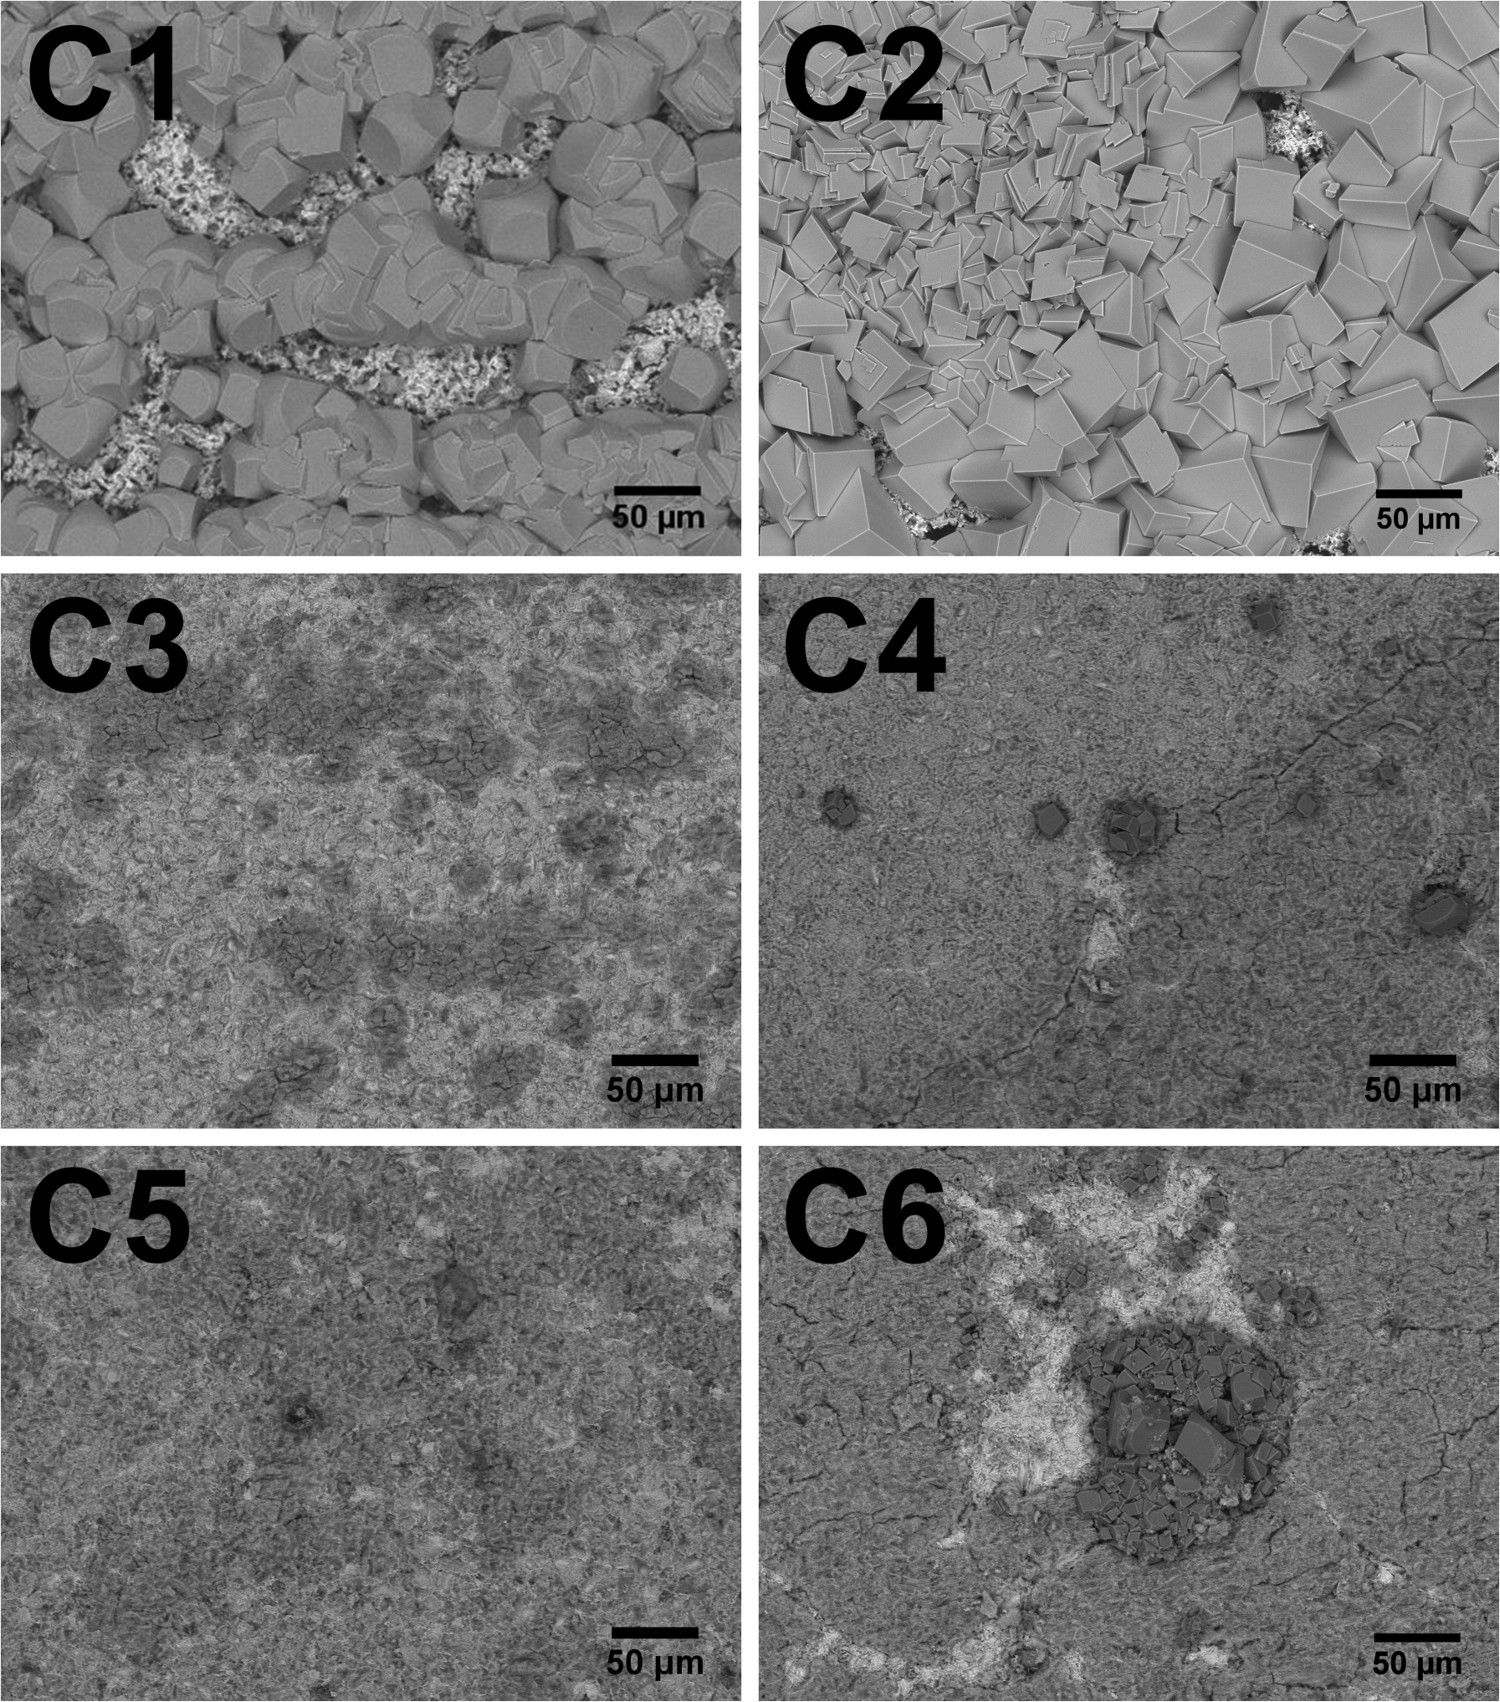
Concerning the two first conditions with the absence of HAc, C1 and C2, it is noteworthy the huge deposition of corrosion products on both surfaces. On the basis of earlier work [8,31,32], it is likely that the precipitated layer is the main sweet corrosion product, the iron carbonate siderite (FeCO3). Supporting evidence for this assignment will be provided in the XRD analysis section. The magnification of C1 (90°C) exhibits a good accumulation of siderite with round-shaped crystals distributed along the steel. Nevertheless, several spots of uncovered steel surface remained exposed after the 48 h. On the contrary, in condition C2 the coverage by the iron carbonate was more even, with very few spots of uncovered steel. At 120°C siderite precipitated in a rectangular shape in greater diameters. Although there were spots of uncovered steel for both C1 and C2, no sign of localised corrosion was identified nor discussed in this study.
When 100 ppm of HAc was added, the precipitation of FeCO3 was totally harmed. From the magnification of condition C3, no visual siderite crystal was seen, only the steel surface with scattered oxides. Analysing the magnification of C4, it is possible to observe that some crystals of FeCO3 were able to be deposited on the steel surface at the higher temperature. Notwithstanding, this precipitation did not represent any coverage or significant protection for the diminishing of the corrosive processes, as shown by the corrosion rates results (Figures 2 and 6).
A similar behaviour was recognised in conditions C5 and C6. The presence of 600 ppm of HAc also hindered the deposition of iron carbonate on the steel. At 90°C, only the bare steel was identified through the magnification as well as some spots of what might be cementite Fe3C, present by the preferential dissolution commonly found in corrosion of ferritic-pearlitic steels. With the temperature increase to 120°C, the iron carbonate was present, as seen in C4. Comparing both conditions at 120°C with 100 and 600 ppm of HAc, C4 and C6, it is important to highlight that, even though the FeCO3 crystals have not presented any protective coverage, they had greater diameters in C6.
An analysis by EDS was carried out alongside with the SEM examinations in every condition, and the results are shown in Figure 8. Only the elements Iron (Fe), Oxygen (O) and Carbon (C) were left on the analysis aiming to clean the EDS images as well as to avoid the colours overlaid by elements from the steel composition.
EDS maping for conditions C1C6.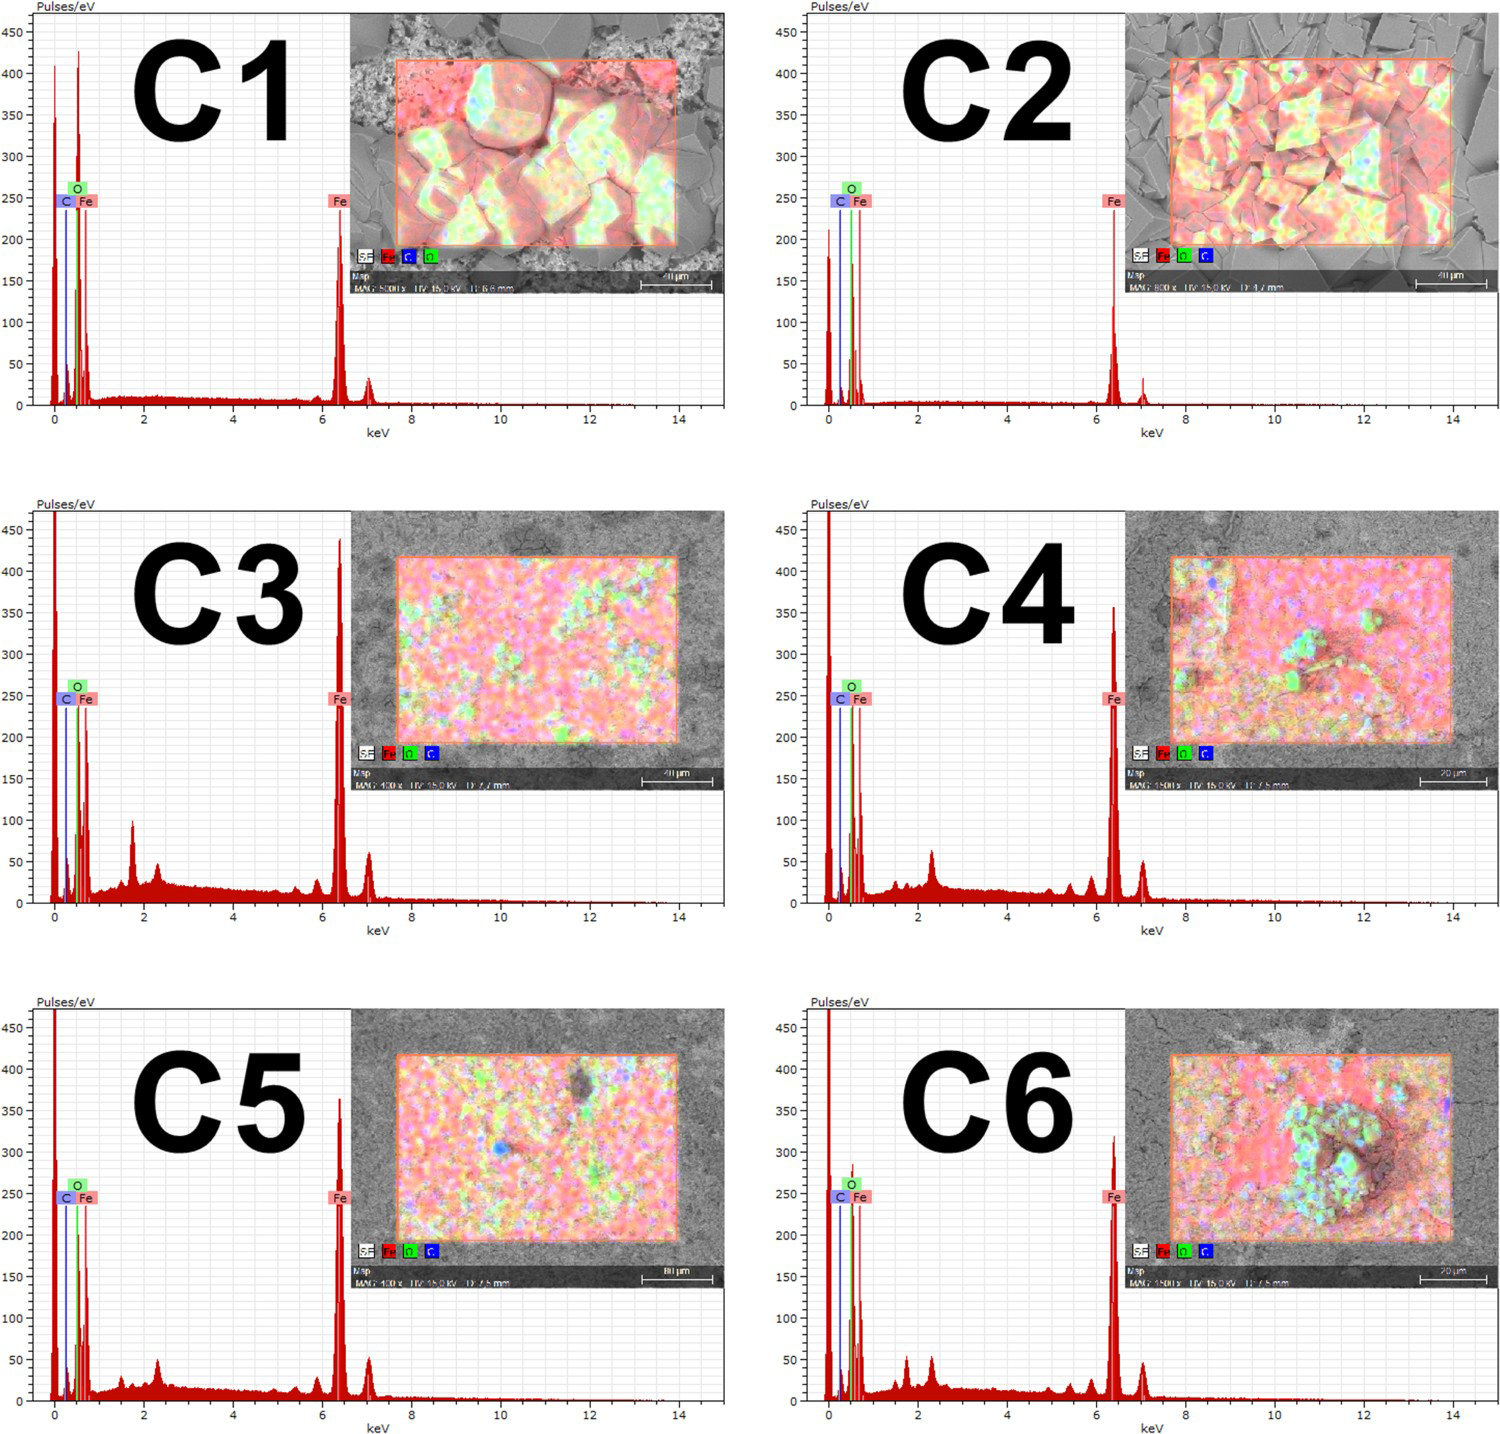
From the images it is clear to observe the colours tendency. The regions with lighter colours are related either with carbonates or oxides that were present on steel surface. Conditions with higher peaks related to iron (Fe) are the ones with less coverage provided by iron carbonate. Still, it is remarkable the spots of uncovered steel by the regions in strong red for all six conditions. Some strong blue points (Carbon) were also found mainly in C4, C5 and C6, probably related to the cementite phase. This last assumption will be confirmed in XRD examination section.
The graphs in Figure 9 present an analysis performed from the SEM magnifications of the average diameter of iron carbonate crystals as well as the coverage offered by them. For Figure 9(a), the comparison between conditions without HAc, C1 and C2, and for Figure 9(b) an analysis comparing the conditions evaluated at 120°C (C2, C4 and C6).
Crystal size and coverage analyses.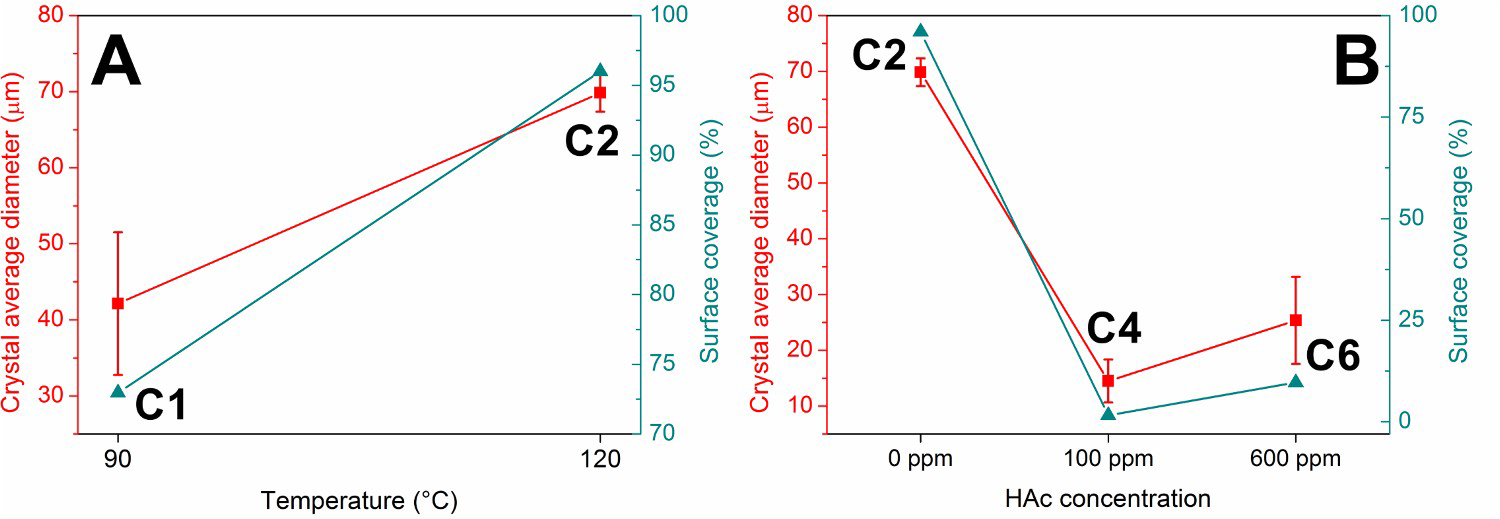
In Figure 9(a), it is noticeable the evolution in the coverage and the growth in crystal diameters with the increase in temperature. Whereas condition C2 presented 96% of its surface covered by FeCO3, condition C1 had 72.96%. Also, Figure 9(a) shown that the increment in temperature from 90°C to 120°C meant an increase of approximately 65% in the iron carbonate crystal diameter from condition C1 to condition C2.
Concerning Figure 9(b), it is important to highlight that the size of the diameter presented significant reduction from the medium with the absence of acid (C2) compared to the ones with the presence of HAc (C4 and C6). However, with the increase in the acid concentration, from 100 to 600 ppm, the crystal sizes tended to increase a bit. The same occurred for the coverage. Although the samples evaluated under 600 ppm of HAc presented the highest corrosion rates through both methods used (Figures 2 and 6), FeCO3 crystals were able to cover around 9.67% of the surface, against 1.6% observed in condition C4 with 100 ppm. This behaviour shown in the results above will be better elucidated on the discussion section.
X-Ray diffractometry analysis
Figure 10 presents the X-ray spectra for conditions C1–C6. Some peaks were clearly identified from the results, and they were highlighted. However, a more thorough analysis was needed to quantify the phases present on the samples after the tests. Thus, a Rietveld refinement was conducted in every XRD result. The percentiles of each phase are shown in Figure 11.
XRD results of all tested conditions. (1) Siderite and (2) Ferrite. Phases quantification by Rietveld refinement.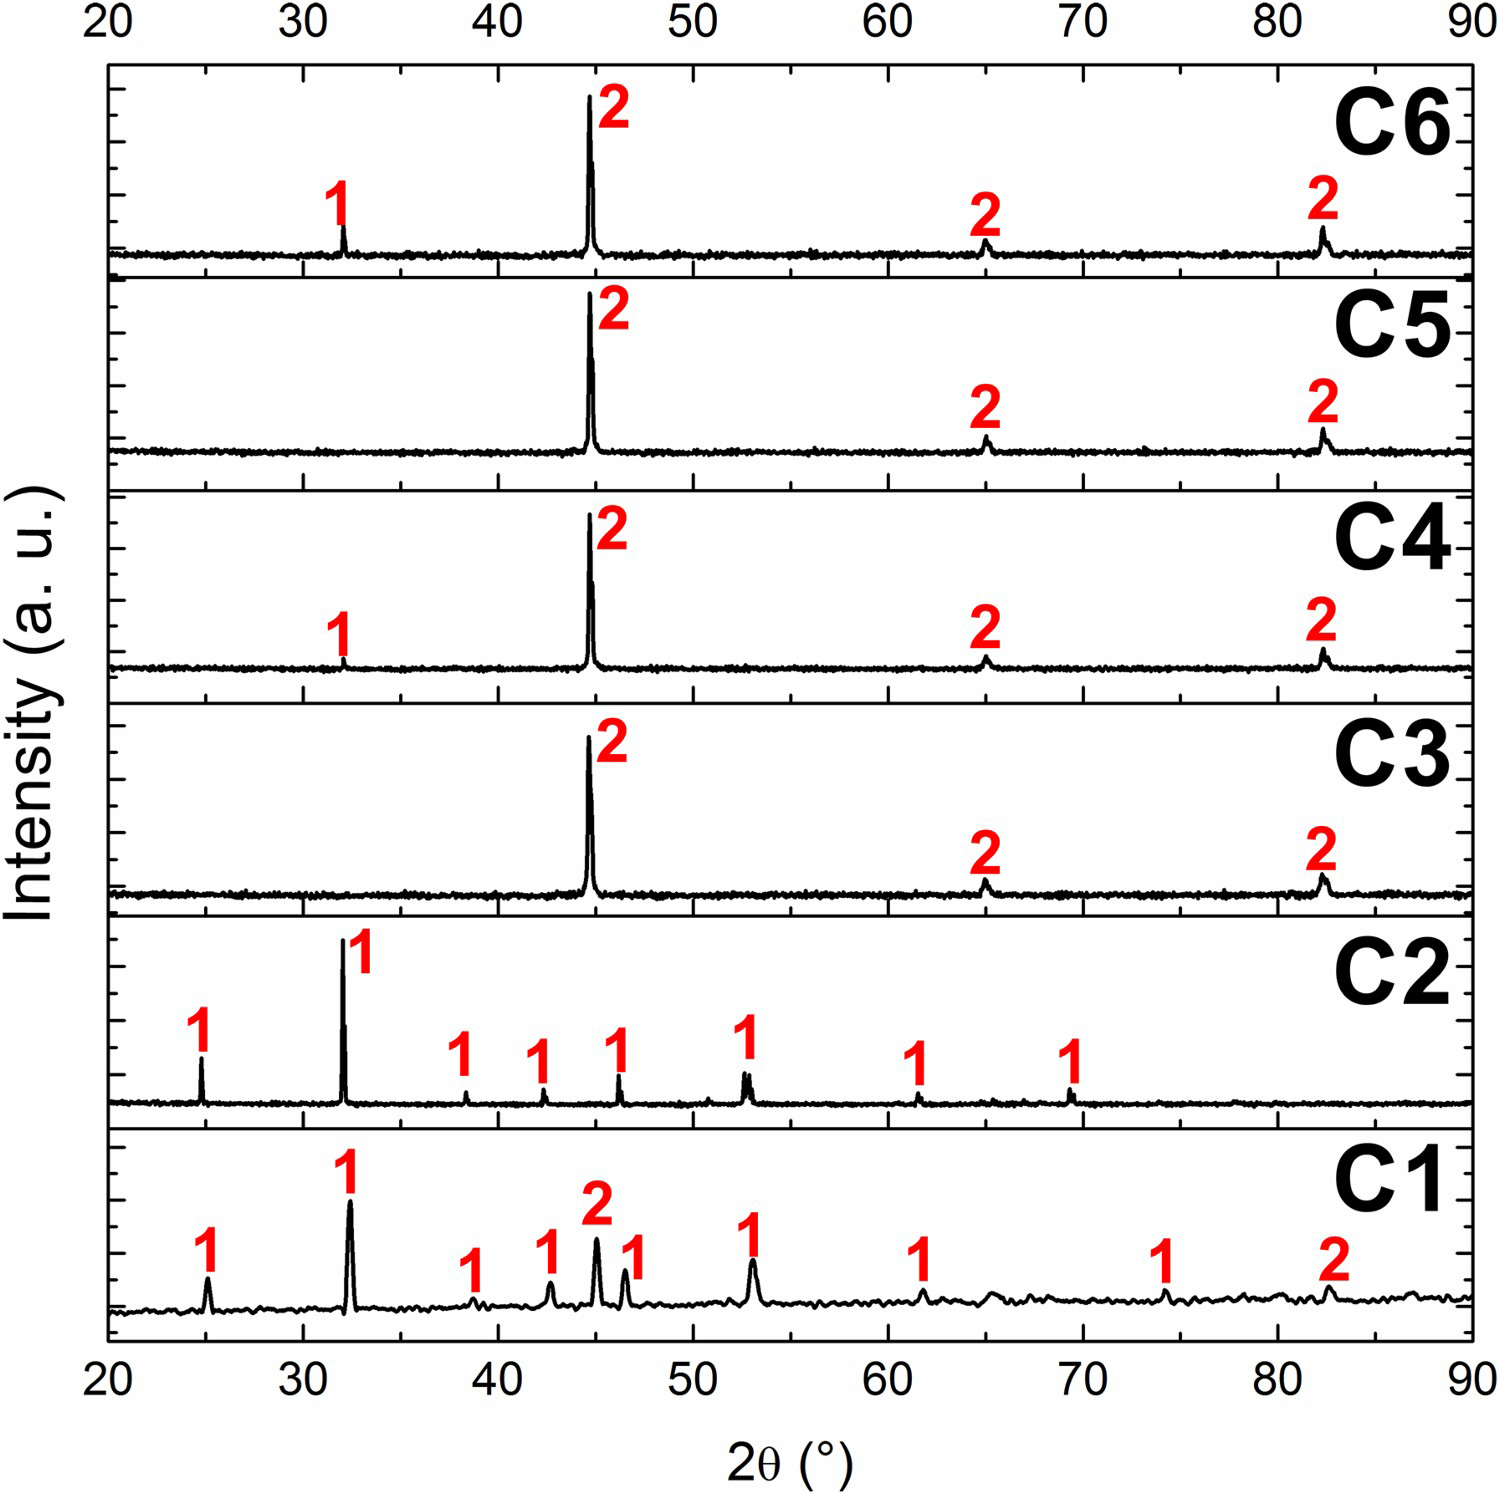
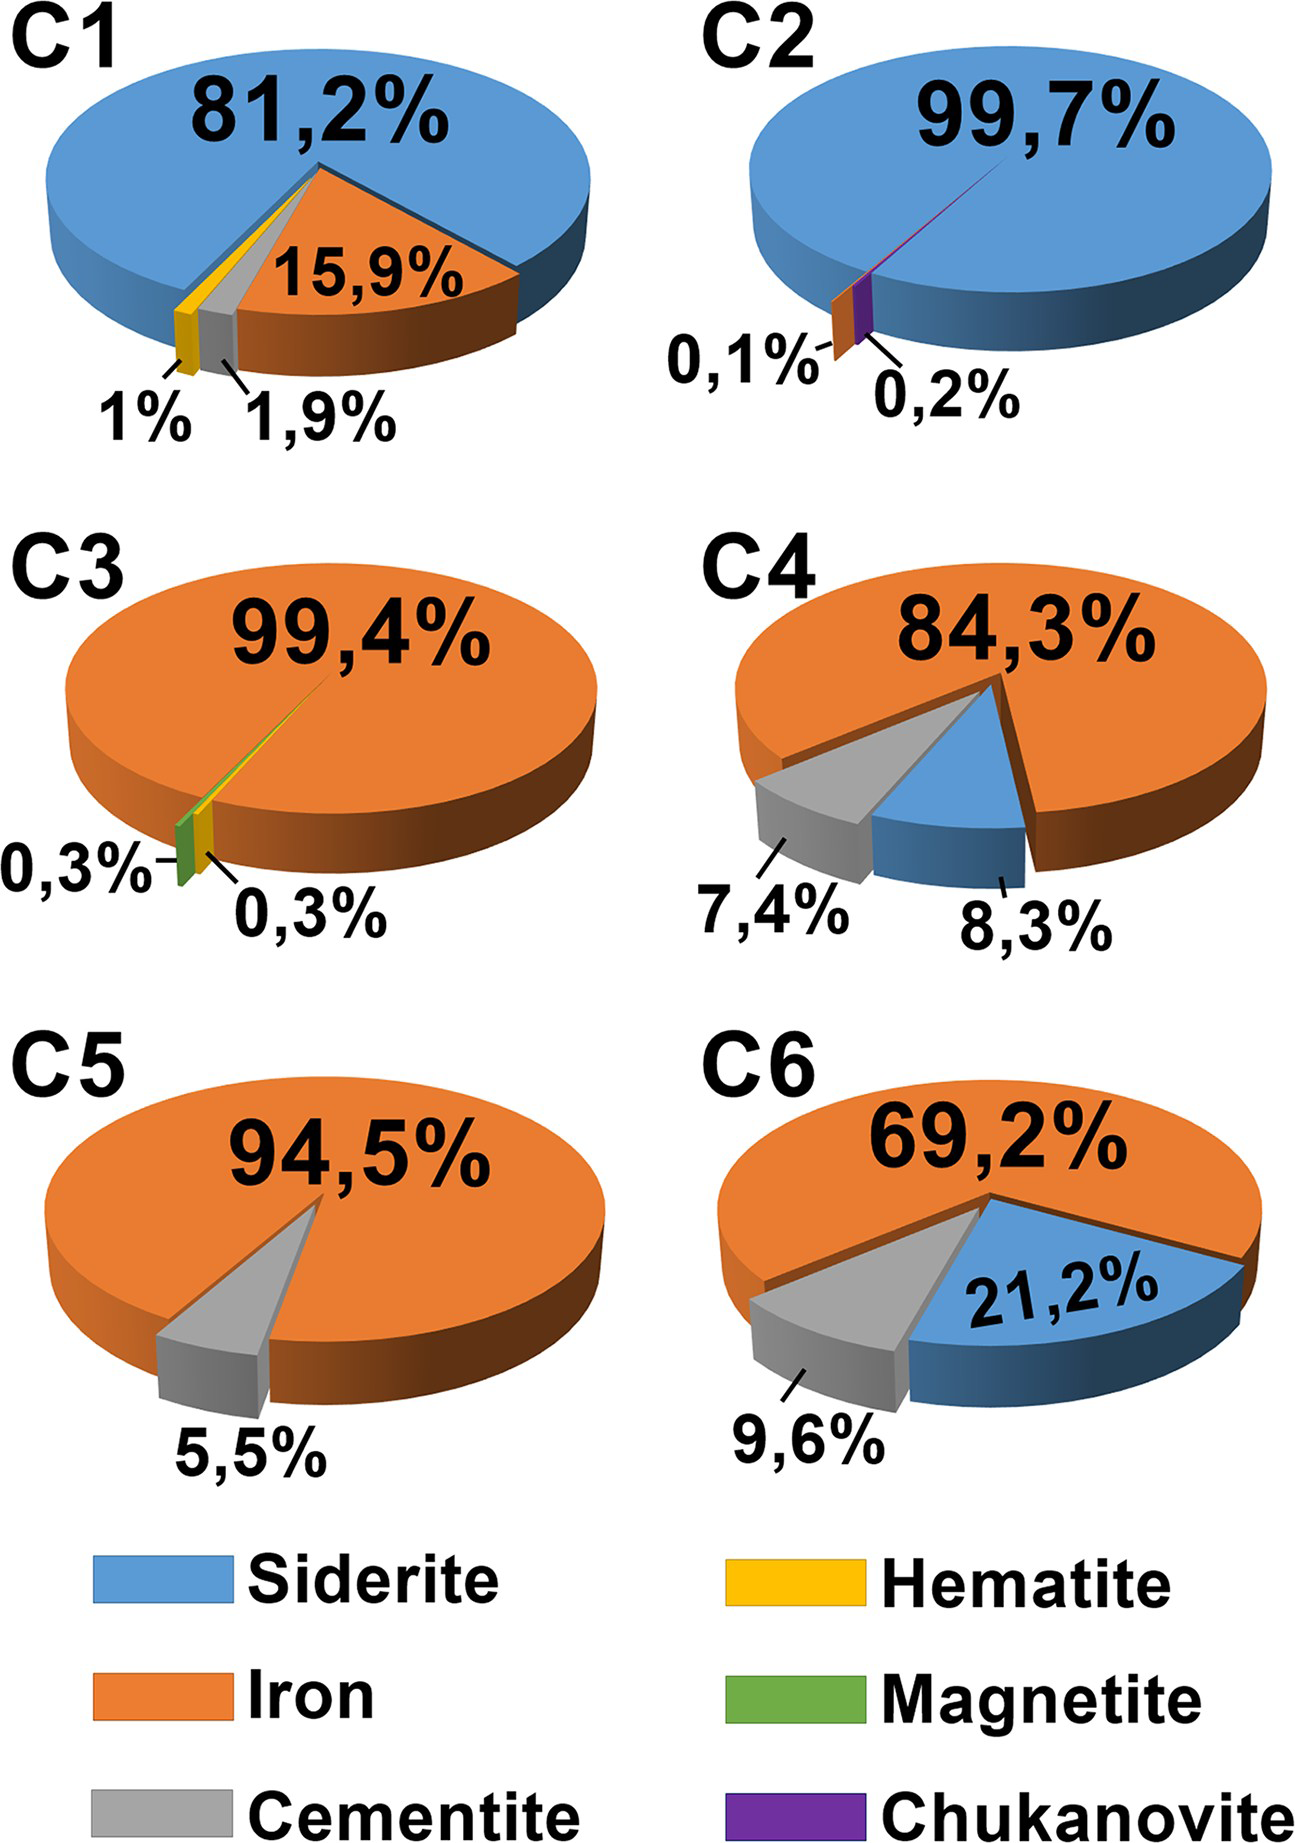
The refinement confirms the results from SEM/EDS examinations seen in Figures 7 and 8. Conditions C1 and C2, with the absence of HAc, had been covered most of their surfaces by siderite. As expected, the one evaluated at 90°C presented a greater amount of iron identified than the one evaluated at 120°C, which in turn had only 0.1% of substrate main phase.
When the amount of 100 ppm of HAc was added, iron carbonate precipitation was hindered. For condition at 90°C (C3), only iron and a few portions of oxides were identified. Although at 120°C, 8.3% of siderite has been quantified, the amount of 84.3% of iron alongside with 7.4% of cementite confirms the low coverage power seen by the others examinations for this condition.
Condition C5, with 600 ppm of HAc at 90°C, presented similar iron portions as condition C3, except the fact that under the more acidic medium 5.5% of cementite were identified and no oxide was present. On the other hand, at 120°C, XRD results confirmed what was seen through SEM magnifications Figure 7 for condition C6 in which 21.2% of siderite was present. This result is also aligned with the analysis conducted in Figure 9(b) in which condition C6 presented a bit higher coverage played by the iron carbonate than its equivalent with 100 ppm of HAc, C4.
Discussions
HAc effect
Firstly, taking as reference the magnifications presented in Figure 7, conditions C1 and C2, with the absence of HAc (90°C and 120°C, respectively), were the only ones with huge precipitation of iron carbonate, what was also noticed in some other studies [8,32,33]. The coverage presented by conditions with 100 and 600 ppm of HAc, either for 90°C or 120°C, was almost null (Figures 7, 9 and 11). However, in electrochemical terms, few differences were observed between conditions at 90°C, C1 (0 ppm of HAc) and C3 (100 ppm of HAc), mainly in terms of capacitive behaviour and LPR corrosion rates. Some authors have reported that an inhibitive effect might be seen with low concentrations of HAc up to 100 ppm due to a reduction on the anodic current [21,22,34]. In some cases, it might happen even without any corrosion layer deposition on the working electrode surface. Instead, this might be related to intermediate products that could be adsorbed on steel surface delaying the corrosive processes, such as FeOH, FeCO2H and FeHCO3 [8,35]. Even though most of the aforementioned studies have been performed at room temperature or up to 80°C, it is possible to infer that the results shown above are in agreement with the literature. This means that even at temperatures up to 90°C, there is a remaining trace of the inhibitive effect played by HAc in concentrations up to 100 ppm. In a nutshell, the formation or not of an iron carbonate layer is not necessarily related to a protective behaviour nor the addition of small portions of acetic acid means a significant increase in the medium aggressiveness.
On the other hand, when 600 ppm was added, at 90°C (C5), the electrochemical results (Figures 3, 4 and 6) were harmed a bit when compared to the conditions C1 and C3, which have not presented significant distinctions at first. According to Zhang et al. [36], an increase in the concentration of HAc accelerates the cathodic current by the reduction of the free HAc. Also, the presence of the acid raises the amount of H+ hence decreasing the pH. Once that is the undissociated form of HAc (free HAc) that is harmful for steel in CO2 environments, and its amount increases in low pH [21,37], poor electrochemical responses as well as higher corrosion rates are expected in these conditions, confirming the results found (Figures 2 and 6).
Controversial results concerned to iron carbonate precipitation were observed when compared conditions at 120°C, C4 and C6, with 100 and 600 ppm of HAc, respectively. With the increase in the acid concentration, less deposition of FeCO3 was expected for condition C6. Nevertheless, the magnifications in Figure 7, the surface analysis in Figure 9 as well as the Rietveld refinement in Figure 11 showed the contrary. The condition with 600 ppm (C6) was able to precipitate 21.2% of siderite against 8.3% observed for condition with 100 ppm of HAc (C5). From Table 1, the initial simulated pH for C4 and C6 were 3.83 and 3.51, respectively. This means that, in terms of acidity, condition C6 was more aggressive to the steel than condition C4. According to some previous works, an increase in the medium acidity leads to an increase in corrosion rates [19,38] hence more Fe2+ being released into solution. Also, Dugstad [23] concluded that the amount of Fe2+ necessary to observe precipitation of FeCO3 in CO2-saturated brines with pH from 3.5 to 4 is almost the same, presenting a slight variation. Then, it is possible to suggest that in condition C6, the higher aggressiveness led to an accelerated dissolution of Fe2+ in some spots over the bare steel surface and consequently a local supersaturation occurred reaching the iron carbonate solubility limit. This assumption upholds the results found by XRD and SEM analysis (Figures 7 and 11).
Temperature influence
The effects played by the temperature on the formation of corrosion products in CO2 environments are well known by the literature [8 10,24,31,32,39]. Most of the studies agreed that an increase in temperature leads to a reduction on the solubility limits of species, favouring the precipitation of corrosion products, such as FeCO3 [17,38]. Still, authors reported that environments with temperatures above 80°C are desirable to observe better precipitation of protective coverages that might diminish the corrosive processes on steel surface [40]. However, this tendency is mostly observed in non-acidic solutions with ideal pH, usually above 6. In fact, conditions C1 and C2 (0 ppm of HAc, 90 and 120°C, respectively) confirmed this behaviour once that condition C2 presented a huge increase on the protective features played by the iron carbonate coverage in its surface, when compared to its equivalent at 90°C, C1. In addition, lower corrosion rates either for weight loss or LPR (Figures 2 and 6) were found for C2 as well as siderite crystals in sizeable diameters (Figure 9). Shamsa et al. [24] noticed that conditions in higher temperatures tend to develop its iron carbonate coverage faster than others in less heated environments. This is related to an increase in the chemical reactions kinetics observed in warmer media, which hasten the precipitation and deposition of a protective coverage. The authors also reported that this behaviour leads to less steel consuming by the corrosive processes and consequently less steel weight loss, which supports the results observed in Figure 2 [24,41].
Still regarding conditions with the absence of HAc, from SEM magnifications in Figure 7, it is possible to see that different shapes of siderite crystals were seen at 90°C (C1) and 120°C (C2). A more rounded for C1 and a more rectangular for C2. Some works have observed the same shape for iron carbonates at temperatures around 90°C [8,39,42] and others confirmed the rectangular shape at temperatures from 120°C ahead [24,39]. Joshi et al. [32] suggested that the tendency is the development of a quadratic shape over the exposure time by the agglomeration movement observed for the FeCO3 crystals that occurs by the continuity of the crystals growth process. This latter is also known to be accelerated with the increase in temperature [9]. Then, rectangular shapes for siderite crystals are more likely to be seen at 120°C than at 90°C in conditions with the same exposure time, since that the kinetics are faster at higher temperatures, which backs the results found in Figure 7.
The low electrochemical performance observed by C1, in comparison with C2 for instance, might be addressed by the amount of uncovered substrate seen through the SEM magnifications in Figure 7. Some works reported that uncovered sites of steel in a surface with huge precipitation of corrosion products, such as FeCO3, might lead to an acceleration in the iron dissolution by the occurrence of a galvanic couple increased by the presence of great cathodic sites (iron carbonate structures) alongside small anodic spots (uncovered steel) [24,32,43]. This latter behaviour also might be the cause of the low capacitive feature at low frequencies on EIS analysis (Figures 3 and 4) for condition C2 (120°C, absence of HAc) [44]. Even though this condition presented the highest impedance values in low frequencies, as well as the lowest corrosion rates among the six conditions studied, the small percentage of uncovered steel for C2 probably kept the continuity of the corrosive processes pronouncing the resistive character at the end of the tests. Indeed, iron carbonate is well known by the literature to provide uneven coverages, since its nucleation and growth process commonly takes place with crystals in considerable diameters and the agglomeration of these structures is time-dependent, differently what occurs with iron sulphide coverages for instance [8,28,32]. So, exposures higher than 48 h are desirable to observe the densest coverage of iron carbonate in CO2 media. Finally, it is possible to infer that the lack of density in the FeCO3 layers might lead to the continuity of the corrosive processes even in conditions with satisfactory deposition of iron carbonate, as seen at 120°C in condition C2.
The temperature effects in environments with the presence of HAc (C3, C4, C5 and C6) were the opposite as the ones seen in conditions without the acid (C1 and C2) in terms of corrosion rates. Whilst the increase in temperature from C1 to C2 promoted a raise in the protective feature of iron carbonate coverage, for conditions with 100 ppm (C3 and C4) and 600 ppm (C5 and C6) the temperature shift aggravated the corrosive process leading to higher corrosion rates (Figures 2 and 6). The combination of acetic acid, either for 100 or 600 ppm, with environment under 120°C proved itself to be the worst corrosive scenario for carbon steel, among the conditions evaluated in this study. George and Nesic [22] reported that the negative effects of HAc in CO2 corrosion are more pronounced with the increase in temperature. Even though their work has not conducted any experiment in temperatures above 60°C, the tendency observed by them sustains the results shown in this study.
However, even though conditions with the addition of 100 and 600 ppm of HAc have been the most aggressive for carbon steel in this study, the trend observed with the increase in temperature from 90°C to 120°C in conditions C1 and C2, remained for conditions with 100 ppm of HAc (C3 and C4) and with 600 ppm of HAc (C5 and C6). The small portions of iron carbonate observed in Figure 7 for conditions C4 and C6 and confirmed by Figure 11, supports the agreement in the literature that higher temperatures favour the deposition of corrosion products [9,32,38], even in acidic media. Nevertheless, the precipitation of FeCO3 identified for C4 and C6 did not mean a proper coverage (Figure 9) and was not enough to provide the diminishment of the corrosion processes.
Conclusions
The combined effects of the presence of HAc and temperature on CO2 corrosion in carbon steel have been evaluated. The most important findings that emerged from this present study are as follows:
Overall, the addition of HAc, either at 90°C or 120°C, led to an increase in corrosion rates. Environments with the absence of HAc were the ones with the most precipitation of iron carbonate. The condition evaluated at 120°C presented the lowest corrosion rates and the higher coverage by siderite. The addition of 100 ppm of HAc at 90°C promoted slight changes in electrochemical and weight loss terms, indicating that an inhibitive role might be played in small amounts of acid. However, at 120°C, none inhibitive feature was observed but an increase in the medium aggressiveness. The increase in the acid concentration to 600 ppm harmed the electrochemical responses as well as increased the corrosion rates for conditions at 90°C and 120°C. The one evaluated at the higher temperature presented the worst results of all conditions studied. Even though conditions with HAc evaluated at 120°C were the most damaged by the corrosive processes, they were capable of presenting a modest precipitation of iron carbonate in their surface, which did not occur for none of their equivalents at 90°C.
Footnotes
Disclosure statement
No potential conflict of interest was reported by the author(s).