
Abstract
The development of temporary protective coatings on magnesium implants is a priority in the biomedical field. In the present study, corrosion rates were determined by various techniques for powder metallurgy Mg and AZ31 magnesium alloy uncoated and coated with phytic acid (PA). Weight loss measurements, potentiodynamic polarisation, and electrochemical impedance spectroscopy were performed to monitor the corrosion evolution in a phosphate-buffered saline solution at 37°C. The corrosion rates of all samples determined from weight losses were higher than those obtained by electrochemical techniques. According to electrochemical data, the initial corrosion current density of the coated samples decreased by three orders of magnitude as compared with that of the bare substrates. However, the protective effect weakened with the testing time due to the presence of microcracks in the PA conversion coating, which indicated the potential applicability of the coated AZ31 alloy as a biodegradable and resorbable temporary implant material for bone repair.
Introduction
Magnesium and its alloys are the lightest structural metallic materials, which can be potentially used as temporary biomedical implants [1 3]. However, their high reactivity and rapid corrosion in physiological fluids are important factors affecting these applications [4 6]. The use of magnesium as a structural material necessitates the development of standardised testing procedures [6] because the corrosion rates of Mg-based materials estimated from weight loss data in previous studies did not match the values measured by electrochemical tests. These differences resulted from material disintegration (decomposition into fine particles) and/or the participation of monovalent Mg+ ions in corrosion reactions as intermediate species [6–9].
Electrochemical impedance spectroscopy (EIS) is one of the most commonly used corrosion evaluation techniques. However, its suitability for measuring the corrosion resistance of technological materials such as Mg and its alloys is limited due to the difficulty of interpreting test results. In addition, monitoring electrochemical parameters as functions of time by this technique is a challenging task [10], while the obtained results cannot be accurately interpreted by a simple comparison of numerical values. Thus, the presence of one or two capacitive loops at high and medium frequencies and an inductive loop at low frequencies is common for the Nyquist plots of the coated and uncoated Mg alloys exposed to saline [11 36] and simulated physiological or buffer solutions [37 58]. However, some authors did not mention or include the inductive loop in their analysis even when they were clearly seen in their impedance diagrams [38,39,43]. This omission led to an underestimation of the Mg corrosion rate by a factor of two or more [24]. The inductive loop was related to the relaxation processes caused by the adsorption and desorption of Mg(OH)+ ads or Mg(OH)2 species on/from the Mg substrate surface, suggesting the occurrence of coating cracking and substrate attacks by the corrosive medium [21,25], which was also related to the dissolution of partially protective surface films [19] or microgalvanic corrosion [21]. In any case, there is no consensus about the proper interpretation of this inductive behaviour, which is a likely reason for the incorrect assessment of this loop in the previous studies [26].
Some authors observed that the diameters of the two capacitive loops obtained for magnesium alloys at high and medium frequencies were directly proportional to the charge transfer resistance (Rt) and the resistance of either corrosion products or the coating on the metallic surface (Rc), respectively [20,27,28,40,41,43,46]. It is noteworthy that uncoated Mg was studied only in Reference [28]. Other authors related the diameter of the high-frequency loop to the corrosion products or coatings and the diameter of the medium frequency loop – to the charge transfer process [9,15,19 21,39,42,52]. The second attribution has been successfully used in multiple studies on the protective behaviour of organic coatings on metal surfaces. In some works, the constant phase element (CPE) of the first process or the first time constant was associated with the Warburg impedance [30]. To avoid confusion between the parameters of time constants, they were simply considered resistances or CPEs with high and low frequencies [24,29,35]. Owing to the complexity of surface reactions involving multiple competing processes as well as the formation of an oxide film on the Mg alloy surface with a heterogeneous microstructure, it is not reasonable to formulate equivalent circuit models for impedance measurements [49]. Usually, two time constants are identified in impedance Nyquist plots. However, the experimental data analysis by linear regression can extract up to five time constants because their separation is not always possible due to overlapping [59]. Figure 1 displays the equivalent electrical circuits of the coated and uncoated Mg-based materials reproduced from the reviewed works. In general, a better fit of experimental data can be obtained by increasing the number of equivalent circuit elements. Nevertheless, to accurately characterise the corrosive behaviour of a material, each element of an equivalent circuit must have a physical meaning and be related to a specific electrochemical phenomenon [46].
Equivalent circuits used to fit experimental EIS spectra of uncoated and coated Mg and its alloys. Numbers correspond to references.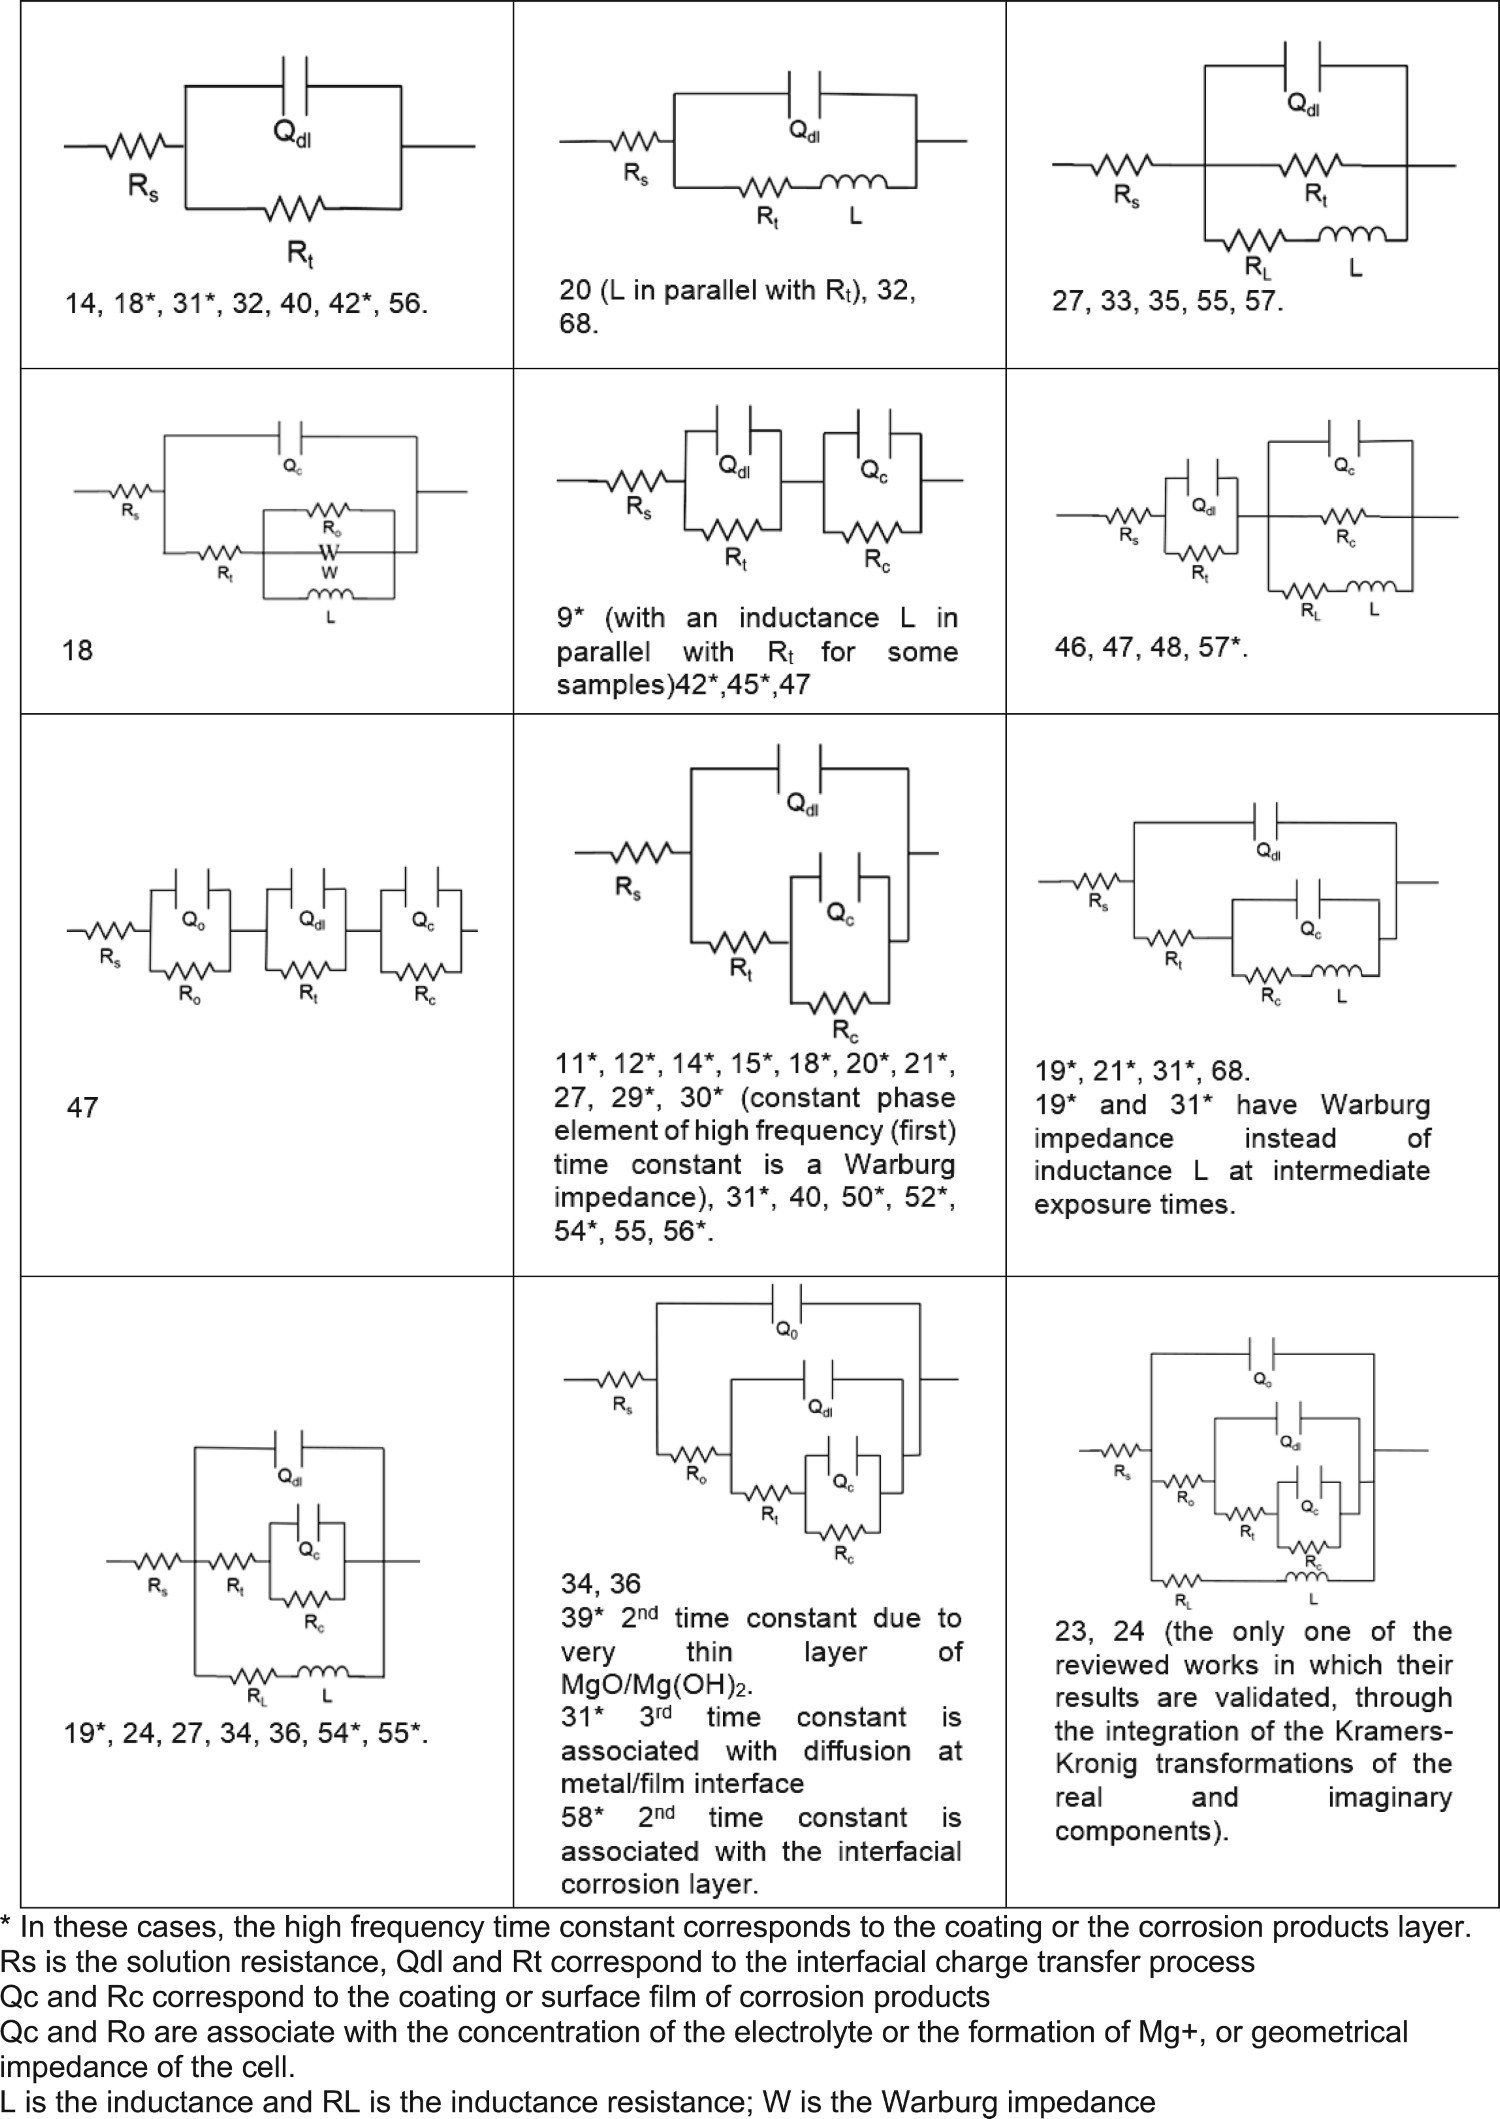
Among the different surface treatments, conversion coatings have been developed extensively for Mg and its alloys due to their low costs and ease of application [1,4]. In particular, phytic acid (C6H18O24P6) (PA) has been used for this purpose. It is a natural compound present in most legumes, cereal grains, and beans, which includes approximately 70% of their phosphorus contents [60]. Meanwhile, PA is harmless to human health and the environment. Phytate ions have a negative charge and low density that promote their chemical interactions with numerous metallic cations, forming stable chelate deposits on the metal surface and a stable chemical conversion layer, thereby increasing the corrosion resistance. Although PA coatings on Mg-based substrates demonstrated a high potential for medical applications [61 63], such conversion coatings often consist of two layers: a compact inner layer and an outer layer with a network of fine microcracks [38,39,41,64–67], which may accelerate the corrosion of Mg-based substrates due to the electrolyte permeation into the coating/substrate interface [15,41]. The density of microcracks increases with increasing PA coating thickness [39]. At the same time, the network of cracks can enhance the adhesive abilities of the PA coating and outer paint coatings [67] and even promote the formation of an inner layer between these two components [68]. Moreover, PA conversion coatings have been tested only at relatively short immersion times (hours or a few days) in corrosive media, although the corrosion rate tends to change significantly with the exposure time [9,34]. Thus, a possible dissolution of the inner layer or crack sealing by the formed corrosion products after prolonged exposures has not been examined yet.
A large number of studies related to the determination of corrosion rates of Mg-based alloys have been performed using DC and AC electrochemical techniques; however, only a few of them qualitatively compared the results of the numerical fitting of EIS profiles and experimental potentiodynamic polarisation curves (PPCs). The objective of this work was to quantitatively compare the corrosion rates obtained by weight loss and electrochemical measurements for the PA-coated powder metallurgy (PM) magnesium and AZ31 alloy for their potential applications as biodegradable temporary endoprosthetic implants. Experiments were conducted at relatively large testing times (for up to 336 h), which represented a novelty of this work. In addition, chemical and morphological characterisations of the coatings on Mg-based substrates were performed.
Materials and methods
Sample preparation
The studied metallic materials included PM pure Mg (325 mesh, Alfa Aesar, USA) and AZ31 alloy. The powders were cold-pressed and then extruded at 420°C. The chemical compositions of PM Mg and AZ31 alloy determined by wavelength dispersive X-ray fluorescence were 0.032 wt-% Al, 0.131 wt-% Si, 0.194 wt-% Ca, 0.019 wt-% Mn, 0.017 wt-% Fe (balance Mg) and 3.37 wt-% Al, 0.78 wt-% Zn, 0.22 wt-% Mn (balance Mg), respectively. Before coating, all samples were prepared by grinding (using grit sizes of 300, 600, and 1200), ultrasonic cleaning with ethanol for 10 min, and drying in hot air. Conversion coatings on Mg-based substrates were obtained by their immersion in a PA solution (0.5 vol.-% in deionised water) for 1 h at 60°C [69]. The solution pH was adjusted to 5.0 with triethylamine.
Surface and coating characterisation
The morphologies and compositions of the conversion coatings and corrosion products were analysed by X-ray diffraction (XRD) (Brucker D8 Advance software Diffrac.eva v 5.1), Fourier-transform infrared spectroscopy (FTIR) (Shimadzu IRAffinity-1), and scanning electron microscopy (SEM) (JEOL JSM-6610LV) combined with a Link System electron microprobe analyser; the last device receives X-rays from each point on the surface over which the electron beam passes. As the energy of the X-rays scattered by any particle is characteristic of its constituent element(s), this device provides qualitative and quantitative analytical information of the selected points, lines, and areas on the surface of the sample [70].
Corrosion studies
Weight loss measurements were conducted for the AZ31 alloy (specimen dimensions: 10 mm × 10 mm × 4 mm) and PM Mg (specimen dimensions: 10 mm diameter × 4 mm height) in both the uncoated (as-received) and coated states. During testing, each sample was suspended with nylon strings and immersed in 500 mL of the naturally aerated phosphate-buffered saline (PBS). The chemical composition of PBS was: 8.0 g L−1 NaCl, 0.2 g L−1 KCl, 0.2 g L−1 KH2PO4, and 1.15 g L−1 Na2HPO4. The solution pH was 7.4; the solution temperature was maintained at 37°C; and the immersion times were 1, 24, 168, and 336 h. After the different immersion periods, the samples were cleaned by dipping in a solution of CrO3 (200 g L−1) and AgNO3 (10 g L−1) for 2 h, washed in acetone, and dried in hot air. Specimen weights were recorded using a balance with an accuracy of 0.01 mg. Weight loss measurements were performed in triplicate. During electrochemical corrosion tests (Gamry Reference 3000), the uncoated and coated PM Mg and AZ31 alloy samples were encapsulated in a quick-cure acrylic resin; their surface areas exposed to the electrolyte (PBS) were equal to 0.78 and 0.81 cm2, respectively. The open circuit potential (OCP) was continuously recorded before these tests. PPCs were obtained after immersing the samples in PBS for 1 h at a scan rate of 1 mV s−1 in the voltage region from −500 to +1000 mV (vs. OCP). A saturated calomel electrode and two high-density graphite rods were used as the reference and auxiliary electrodes, respectively. The working electrodes were the PM Mg and AZ31 alloy specimens in the as-received and coated states. EIS measurements were conducted by applying a sinusoidal potential with frequencies ranging from 105 to 10−2 Hz and amplitude of 10 mV with respect to OCP after 1, 24, 168, and 336 h of testing. High reproducibility of the obtained results was ensured by testing at least two specimens under each surface condition. The main corrosion parameters were calculated via the Tafel fit routine of the Echem Analysit 5.56 software, which used a non-linear chi-square minimisation procedure to fit the data in a selected region with the Stern–Geary equation. The three-point method was employed, and a potential was selected within the range from +100 to −100 mV with respect to Ecorr, ensuring that a selected value on the anodic curve was not in the passivation or localised attack zones. Equivalent circuit parameters were calculated by fitting the measured spectra with the impedance function using a non-linear least squares program. The fitting quality was evaluated first with the lower value of the chi-square (χ2) followed by the lower estimated errors (in %) for all components.
Results and discussion
Surface and coating characterisation
The surface of the PM Mg sample coated with PA contained two layers: an upper layer detached in several regions with large cracks and an apparently continuous sublayer with small cracks (Figure 2(a)). The continuous layer exhibited a microcracked compact morphology, which was likely related to the major hydrogen evolution during the reaction and/or dehydration processes and contraction that occurred during drying. Figure 2(b) shows the cross-section of the PA coating, which exhibits a compact and continuous morphology; however, some cracks and elongated cavities connected to the substrate are present in the lower layer. The related XRD and FTIR data have been previously published in the literature [64,71].
SEM morphologies of PA conversion coating on the PM Mg: (a) surface aspect, (b) cross-section with a total thickness of 4.34 µm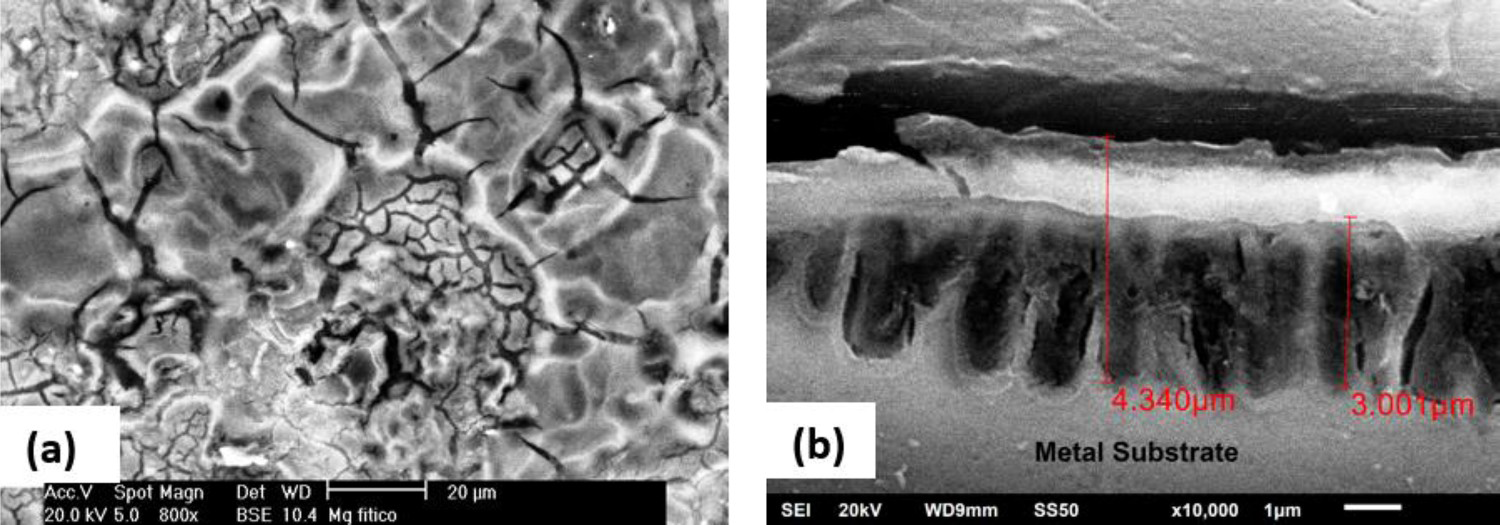
Corrosion studies
Weight loss measurements
It is well known that gravimetric weight loss measurements provide reliable corrosion rates. Figure 3 shows the weight loss plotted as a function of the immersion time for the uncoated and coated PM Mg and AZ31 alloy (the average values were obtained from the results of three measurements). Because the PBS solution was very aggressive (especially towards the uncoated PM Mg samples), measurements could only be performed for 1 and 24 h of immersion. At higher immersion times, the samples did not dissolve completely but underwent fragmentation preventing the completion of the testing process. For the coated PM Mg samples, the weight loss was detected until 168 h, reaching an average value of 86.83 mg cm−2. The high degradation rate of PM Mg may be explained by the fact that although the PM processing of Mg usually leads to superior mechanical properties, it also produces a detrimental effect on the corrosion rate [42]. The inherent intrinsic porosity and heterogeneity resulting from this process tend to increase the surface area exposed to the corrosive medium. The estimated pore volume fraction was 0.098, which represented a porosity of 9.8%. This high porosity promoted the metal dissolution process, as the surface porosity of 4.0% was considered high for the components manufactured by PM with the subsequent hot densification [72]. The possibility of using PM Mg for temporary implant applications was evaluated due to its good mechanical properties, high tolerance by the human body during degradation, and the ability to promote bone mineralisation. Nevertheless, the high degradation rates of both the coated and uncoated PM Mg make it unsuitable for temporary implant applications because it would cease functioning as a bone repair support after a very short time.
Variation of the weight loss of Mg-based samples after different immersion times in PBS solution at 37°C.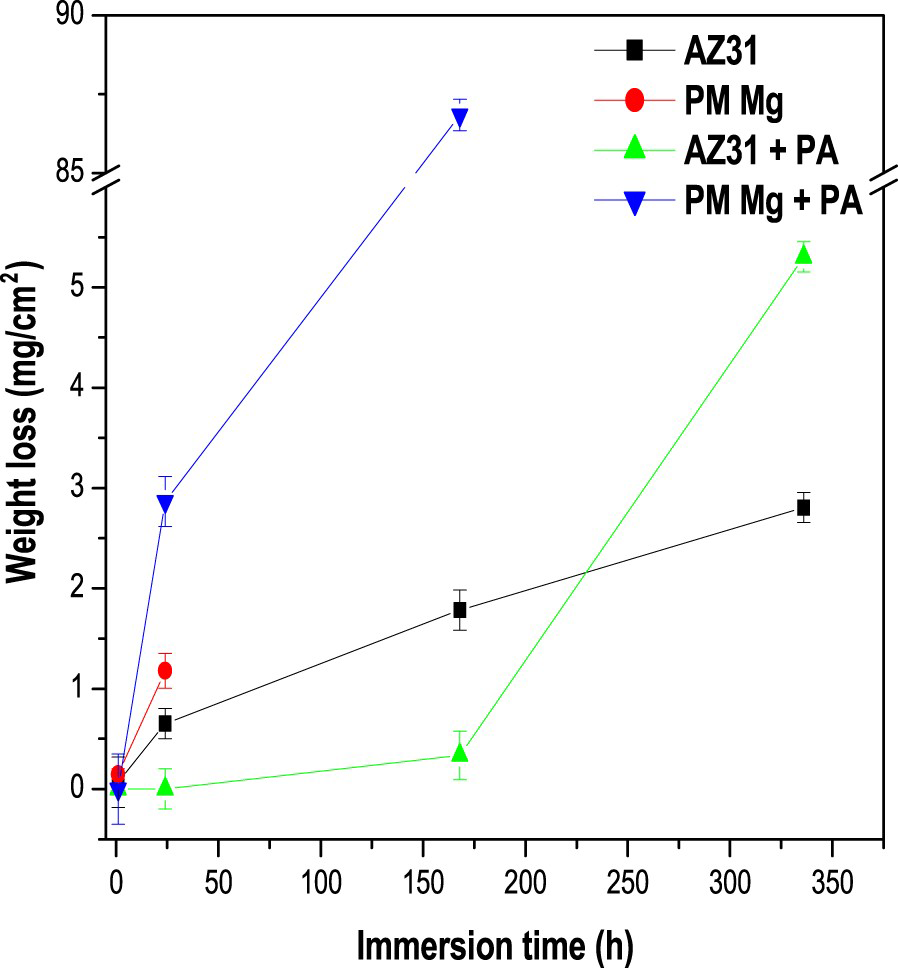
The uncoated and coated samples of AZ31 alloy can endure the immersion in PBS for 336 h. The PA coating protects this alloy against corrosion until approximately 200 h of immersion according to the weight loss data presented in Figure 3. For the immersion time of 336 h, the opposite behaviour was observed (the weight loss of the as-received AZ31 alloy was lower than that of the coated sample). In both the coated and uncoated configurations, the AZ31 alloy satisfied the requirements for temporary biodegradable materials. The corrosion rates of the coated samples decreased for almost 200 h, suggesting that their mechanical properties very likely remained intact; however, at longer exposures, they underwent more intense degradation as compared with that of the bare material, indicating higher biodegradability. A similar effect was observed for the corrosion current densities (icorr) determined from PPCs [71]. This surprising behaviour can be partially explained for the case when the PA coating is cathodic with respect to the Mg substrate, this electrochemical potential difference enhances the dissolution process due to the high reactivity of Mg (although no evidence supporting this hypothesis is provided). It was suggested previously that the presence of microcrack networks in PA coatings could initiate pitting corrosion and crevice corrosion, owing to the existence of concentration gradients [39].
Electrochemical monitoring of corrosion evolution
Figure 4 shows the OCPs of the PM Mg and AZ31 alloy samples (with and without coatings) plotted as functions of the immersion time in the PBS solution at 37°C. In general, the OCP magnitudes measured for the uncoated samples shifted toward more positive values after coating. For the coated PM Mg, the loss of ennoblement occurs at 24 h exhibiting a significant potential drop to negative values, which suggests that the electrolyte penetrates through the coating and promotes the corrosion of the Mg substrate. This behaviour is consistent with the sudden weight losses of the coated PM Mg samples presented in Figure 3. In the case of the coated AZ31 samples, a potential drop occurs after 150 h in PBS, indicating a strong barrier effect of the PA layer. However, this protective effect gradually weakens until 336 h, after which a significant weight loss is detected (Figure 3), demonstrating that the OCP value was more negative than that of the uncoated samples. The uncoated samples of PM Mg and AZ31 alloy exhibit a slight potential ennoblement with increasing immersion time, which can be related to the formation of a layer of corrosion products with protective barrier properties. Other researchers have related the OCP ennoblement with the coating process [15,38,39,41,65 67], although this effect was not as remarkable as that observed in the present study.
Evolution of the OCP as a function of time of the PA-coated and uncoated PM Mg and AZ31 alloy samples.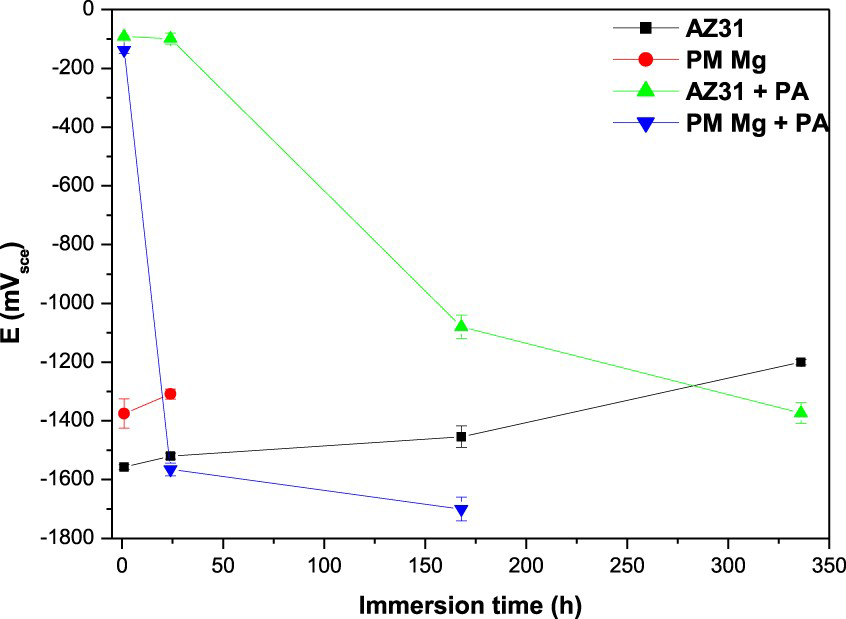
PPCs
Figure 5 displays the electrochemical behaviour of the coated and uncoated PM Mg samples observed after their immersion in PBS for 1 h at 37°C. It shows that the coating shifts Ecorr towards more noble values with respect to those of the uncoated samples, while the corresponding PPCs are shifted towards the lower current densities with approximately three orders of magnitude lower icorr magnitudes. Other researchers have reported similar initial results [15,65,67]. The PPCs obtained at testing times of 24, 168, and 336 h showed that the icorr values of the coated samples increased considerably, whereas those of the uncoated samples exhibited a moderate decrease with the testing time. A similar trend was observed for the PPCs recorded for the uncoated and coated AZ31 alloy specimens (more details are provided in Reference [71]).
Typical PPCs of the PA-coated and uncoated PM Mg samples in PBS at 37°C.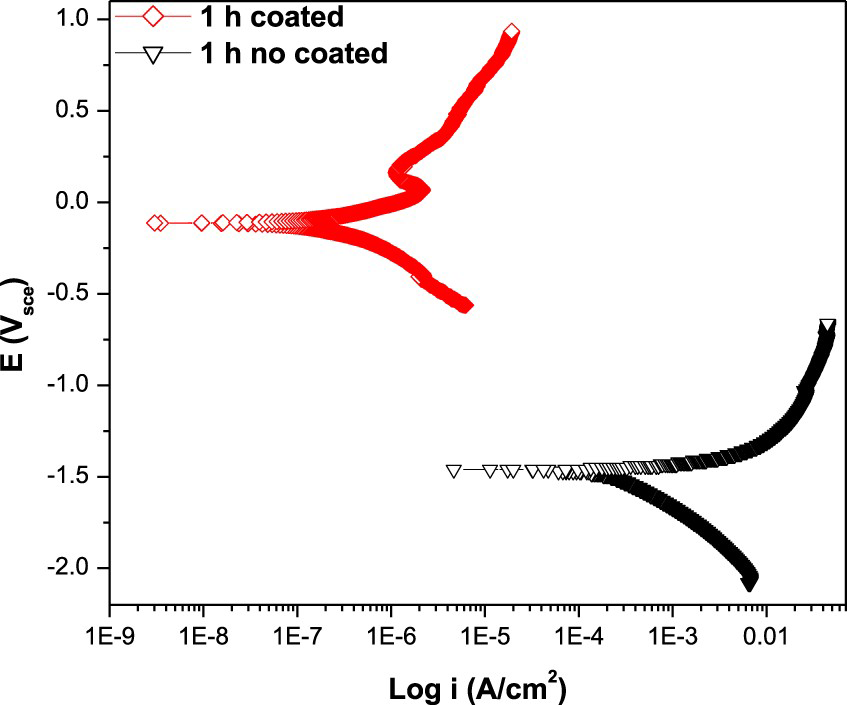
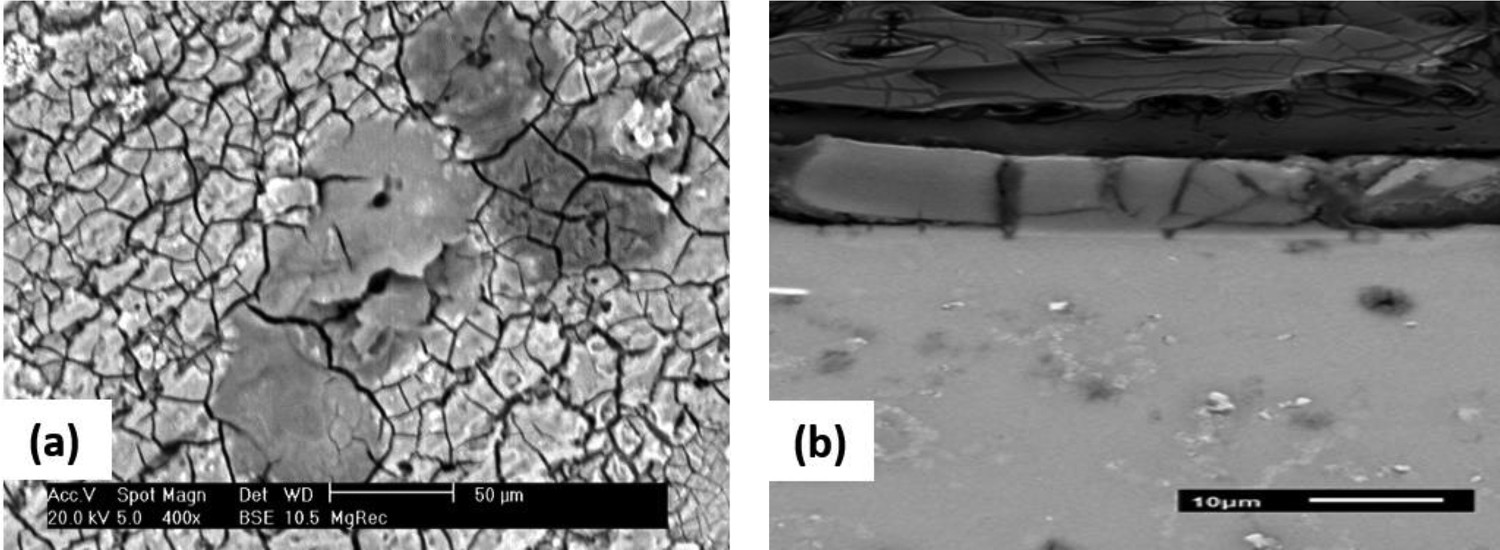
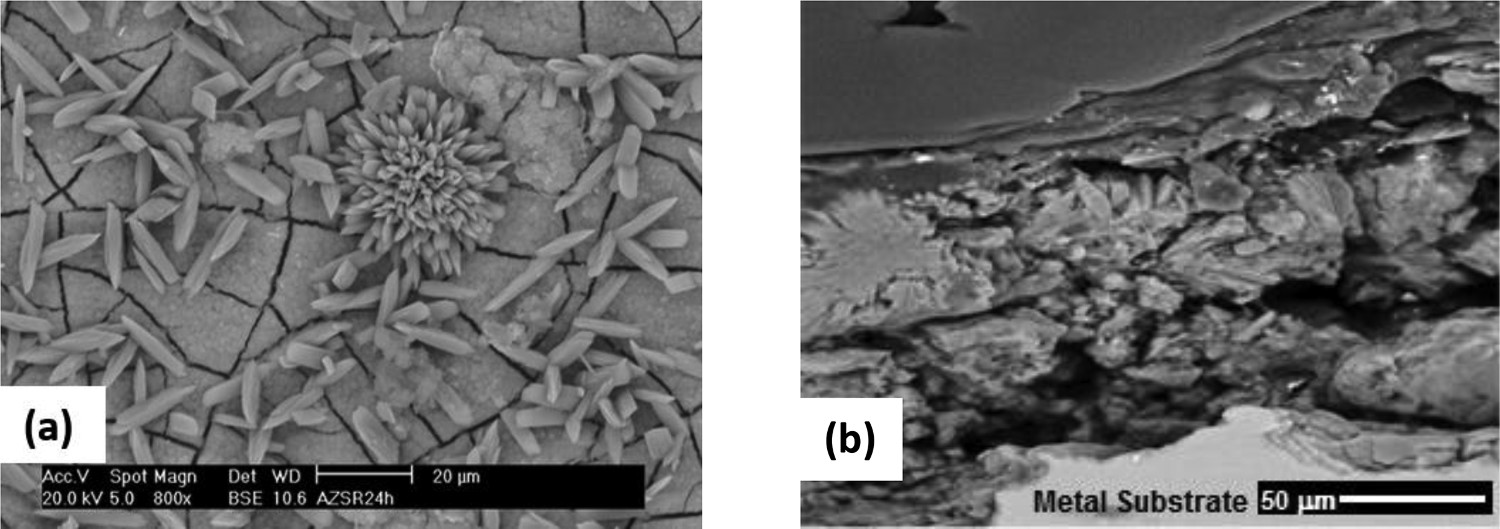
The morphologies, compositions, and depths of the corrosion products were examined by SEM–energy dispersive X-ray spectroscopy. After 1 h of immersion, the uncoated PM Mg surface exhibited localised attack zones and underwent precipitation of acicular crystals with high contents of Na, K, and P elements as well as the incipient formation of spongy corrosion products (Figure 6(a)). After 24 h of immersion, the surface was completely covered by acicular and granular corrosion products (Figure 6(b)); however, they also formed gaps through which the electrolyte continued to attack the surface. Figure 6(c) shows the depth attack in a cross-section due to the lack of compactness and adhesion of the cracked corrosion products to the substrate. The coated PM Mg sample exhibited a uniform and cracked surface since the first hour of the testing process (Figure 7(a)). After 24 h of exposure, the cross-section of the coated PM Mg contained a coating with cracks serving as preferential paths for electrolyte molecules that allowed them to reach the specimen surface and cause its detachment (Figure 7(b)). After 24 h of immersion, the surface of the AZ31 alloy was mostly covered by the small rice-shaped crystals with a high P content but without Na or K atoms as well as by the large acicular crystals with high Na, K, and P contents (Figure 8(a)). The gaps between the two types of crystals allow observing a continuous layer of the cracked corrosion products consisting of magnesium phosphates and MgO/Mg(OH)2 under the acicular phosphorous-rich crystals [44,73,74]. According to Figure 8(b), the sample cross-section contains these crystals on the magnesium phosphate and MgO/Mg(OH)2 layers [73,74].
Surface morphologies of the corrosion products on the uncoated Mg PM immersed in PBS solution at 37°C after: (a) 1 h, (b) 24 h and (c) cross-section morphology after 24 h. Surface morphology of the corrosion products on the coated PM Mg immersed in PBS solution at 37°C after: (a) 1 h and (b) cross-section morphology after 24 h. Surface morphology of the corrosion products on the uncoated AZ31 alloy immersed in PBS solution at 37°C after: (a) 24 h, (b) cross-section morphology after 24 h.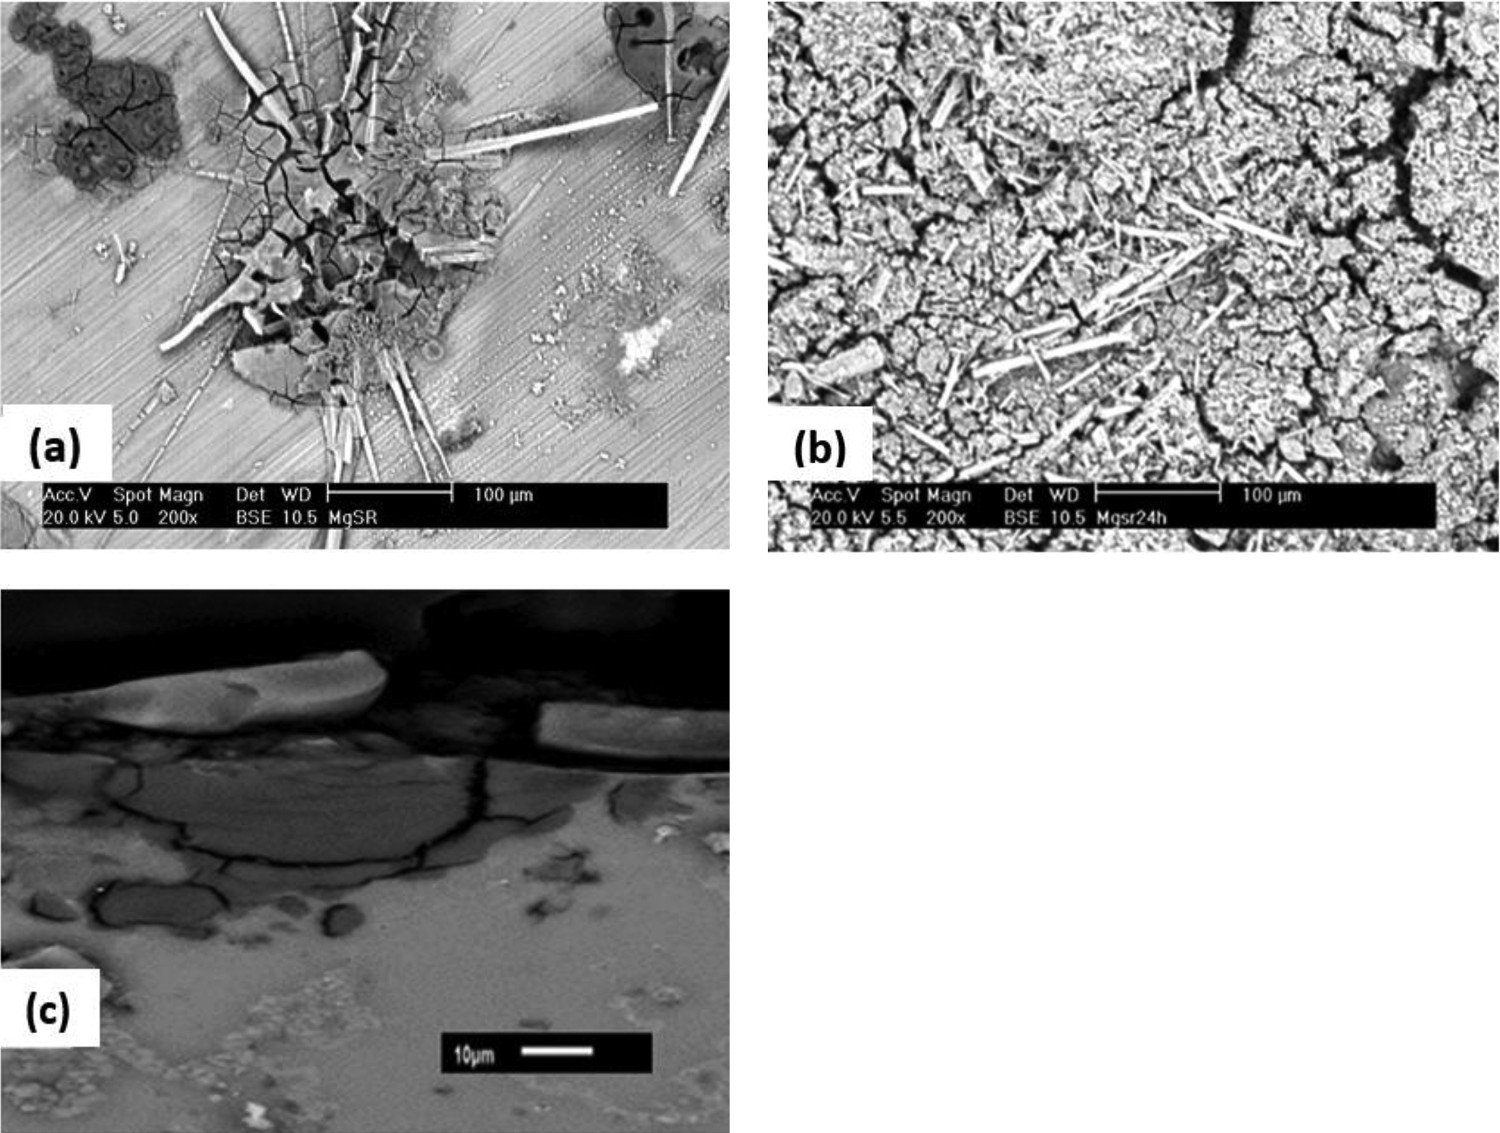
An XRD analysis of the obtained corrosion products was performed previously [71]. They had complex compositions and were present in many phases and compounds. Mg(OH)2 and its hydrated basic chloride Mg2(OH)3Cl.(H2O)4 were detected in all the analysed samples. Owing the aforementioned chemical complexity of the corrosion products, the rice-shaped crystals were likely formed from the following compounds: (1) MgAl2(PO4)2(OH)2.8H2O, (2) Mg(OH)2, and (3) Mg2(OH)3Cl.(H2O)4. The acicular crystals present on the PM Mg surface (Figures 6(a,b)) represent a mixture of Na-, K-, and P-rich compounds with the stoichiometric formula Mg2K0.956Na0.954(PO4)2.(H2O)14. Other authors attributed the presence of these crystals to the interactions between AZ alloys and the PBS solution [75,76]. In the present work, this phosphate type was detected after 168 h of immersing the AZ31 alloy in PBS, as shown in Figure 9.
Diffractograms obtained from the PA-coated AZ31 alloy after 168 h of immersion.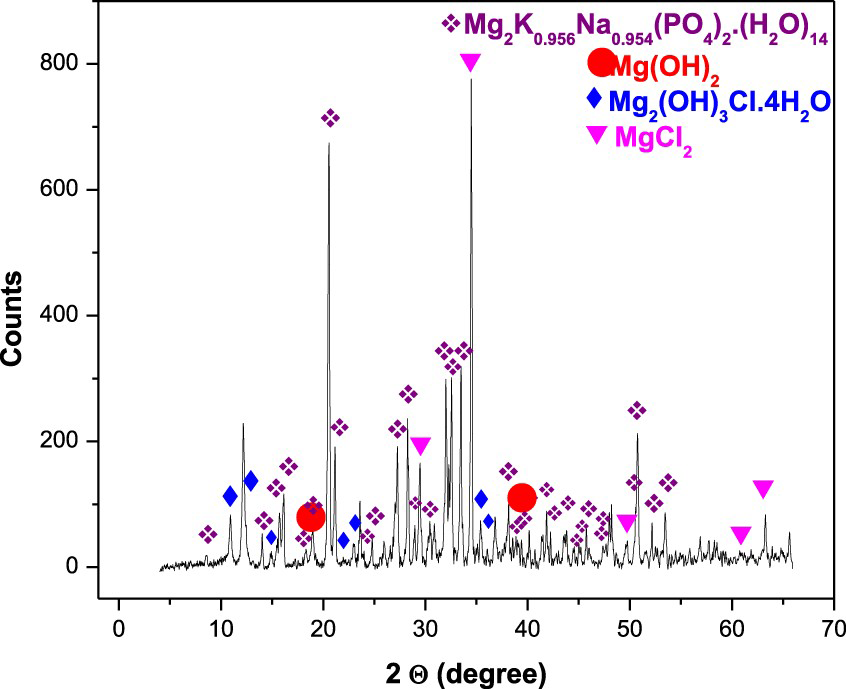
EIS studies
Figure 10 shows the Nyquist and Bode impedance plots for both the uncoated PM Mg (a, c, e) and AZ31 alloy (b, d, f) samples immersed in PBS for various times. An inductive loop is observed at low frequencies for the PM Mg samples after 1 h (Figure 10(a)) and for the AZ31 samples after 1 and 24 h of immersion (Figure 10(b)). As mentioned earlier, this loop is related to the relaxation processes caused by the adsorption and desorption of Mg(OH)+ ads or Mg(OH)2 species on/from the Mg substrate surface [25,77] or by the pitting corrosion of the magnesium substrate [78]. The subject of equivalent electrical circuits will be discussed later; in particular, it was necessary to introduce an inductor L and a resistance RL into the circuits depicted in Figures 12(a) and (b) to explain the inductive behaviour. In addition to the time constant (τ) of this inductive behaviour, Figure 12(a) describing the uncoated AZ31 alloy immersed for 1 and 24 h shows another time constant corresponding to the charge transfer process, while Figure 12(b) (characterising the uncoated PM Mg after 1 h of exposure) exhibits two time constants associated with the charge transfer process and the film of corrosion products. At longer immersion times (24 h for PM Mg and 168 and 336 h for AZ31), only two capacitive loops were observed with two different τ. The first τ corresponds to the corrosion phenomenon or charge transfer, and the second τ corresponds to the corrosion products and protective layer formed on the submerged samples. The Bode plots (Figures 10(c–f)) are in good agreement with the Nyquist plots. The positive values of the phase angle (Figure 10(e) and f) confirm the inductive behaviour demonstrated by the Nyquist plots. Meanwhile, for both the Mg-based materials, the diameter of the capacitive loops (or depressed semicircles) increases with increasing immersion time, indicating that the corrosion resistance increases due to the formation of protective corrosion products. These observations can be explained by the decrease in the corrosion rate due to the thickening of the Mg(OH)2 layer [77] or the presence of protective MgCO3 species [33]. This behaviour was observed until the end of the testing period (336 h) for the AZ31 alloy, while PM Mg exhibited it for 24 h.
EIS diagrams of the uncoated Mg-based samples after different immersion times in PBS solution for PM Mg: Nyquist (a), Bode (c, e), and AZ31 alloy: Nyquist (b), Bode (d, f). EIS diagrams of the coated Mg-based samples after different immersion times in PBS solution for PM Mg: Nyquist (a), Bode (c, e), and AZ31 alloy: Nyquist (b), Bode (d, f).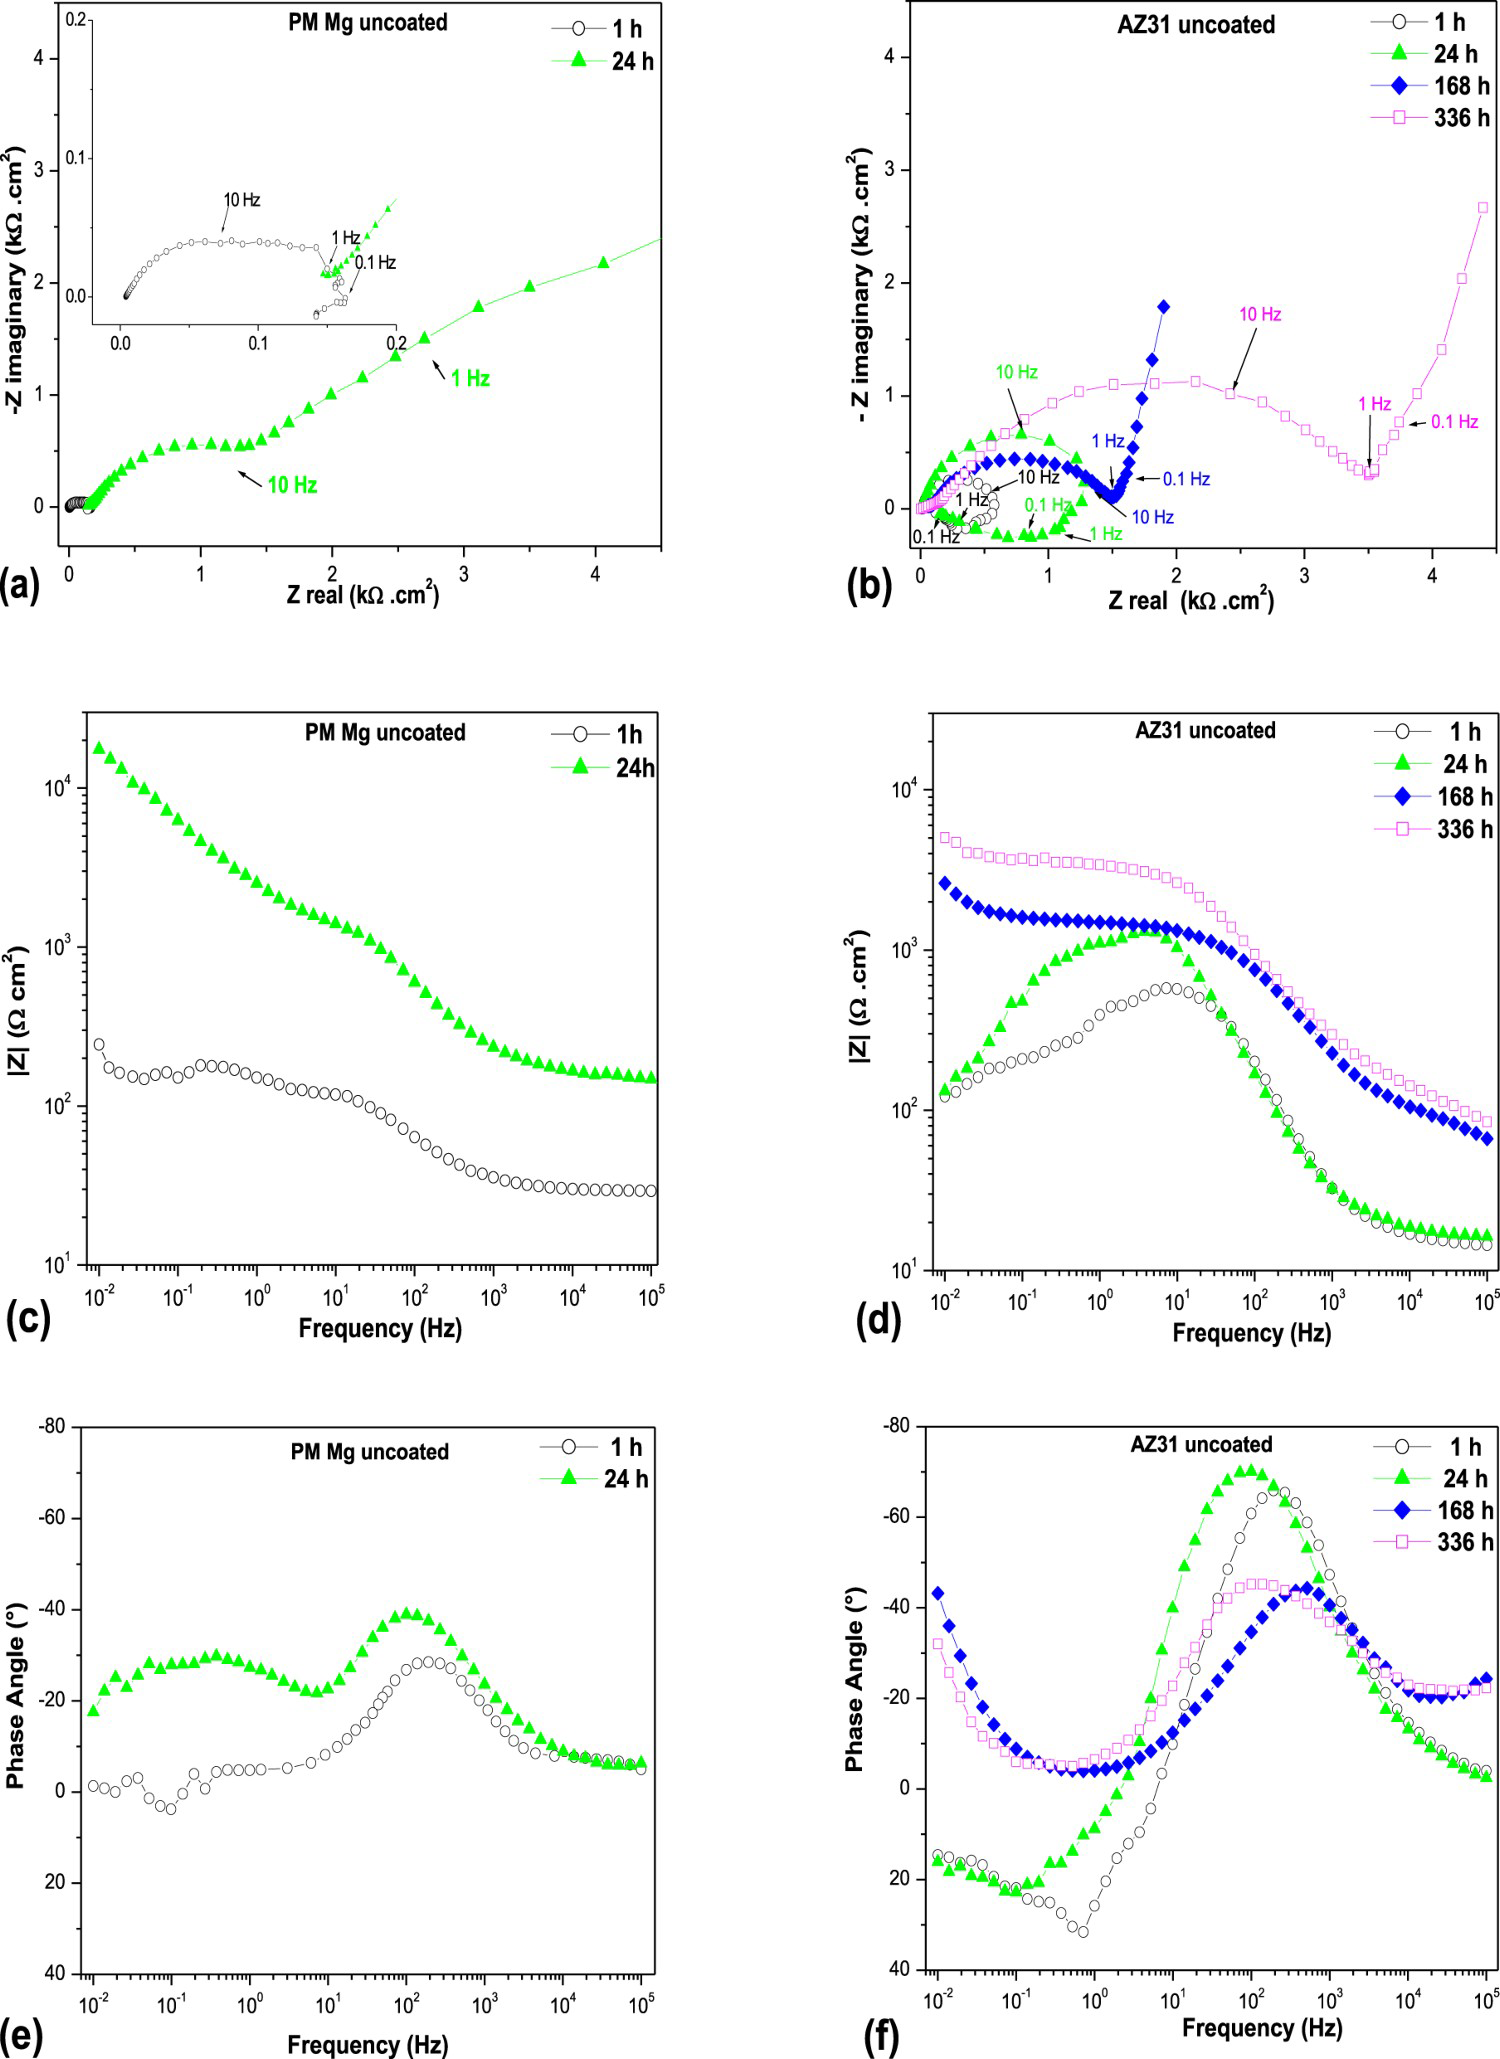
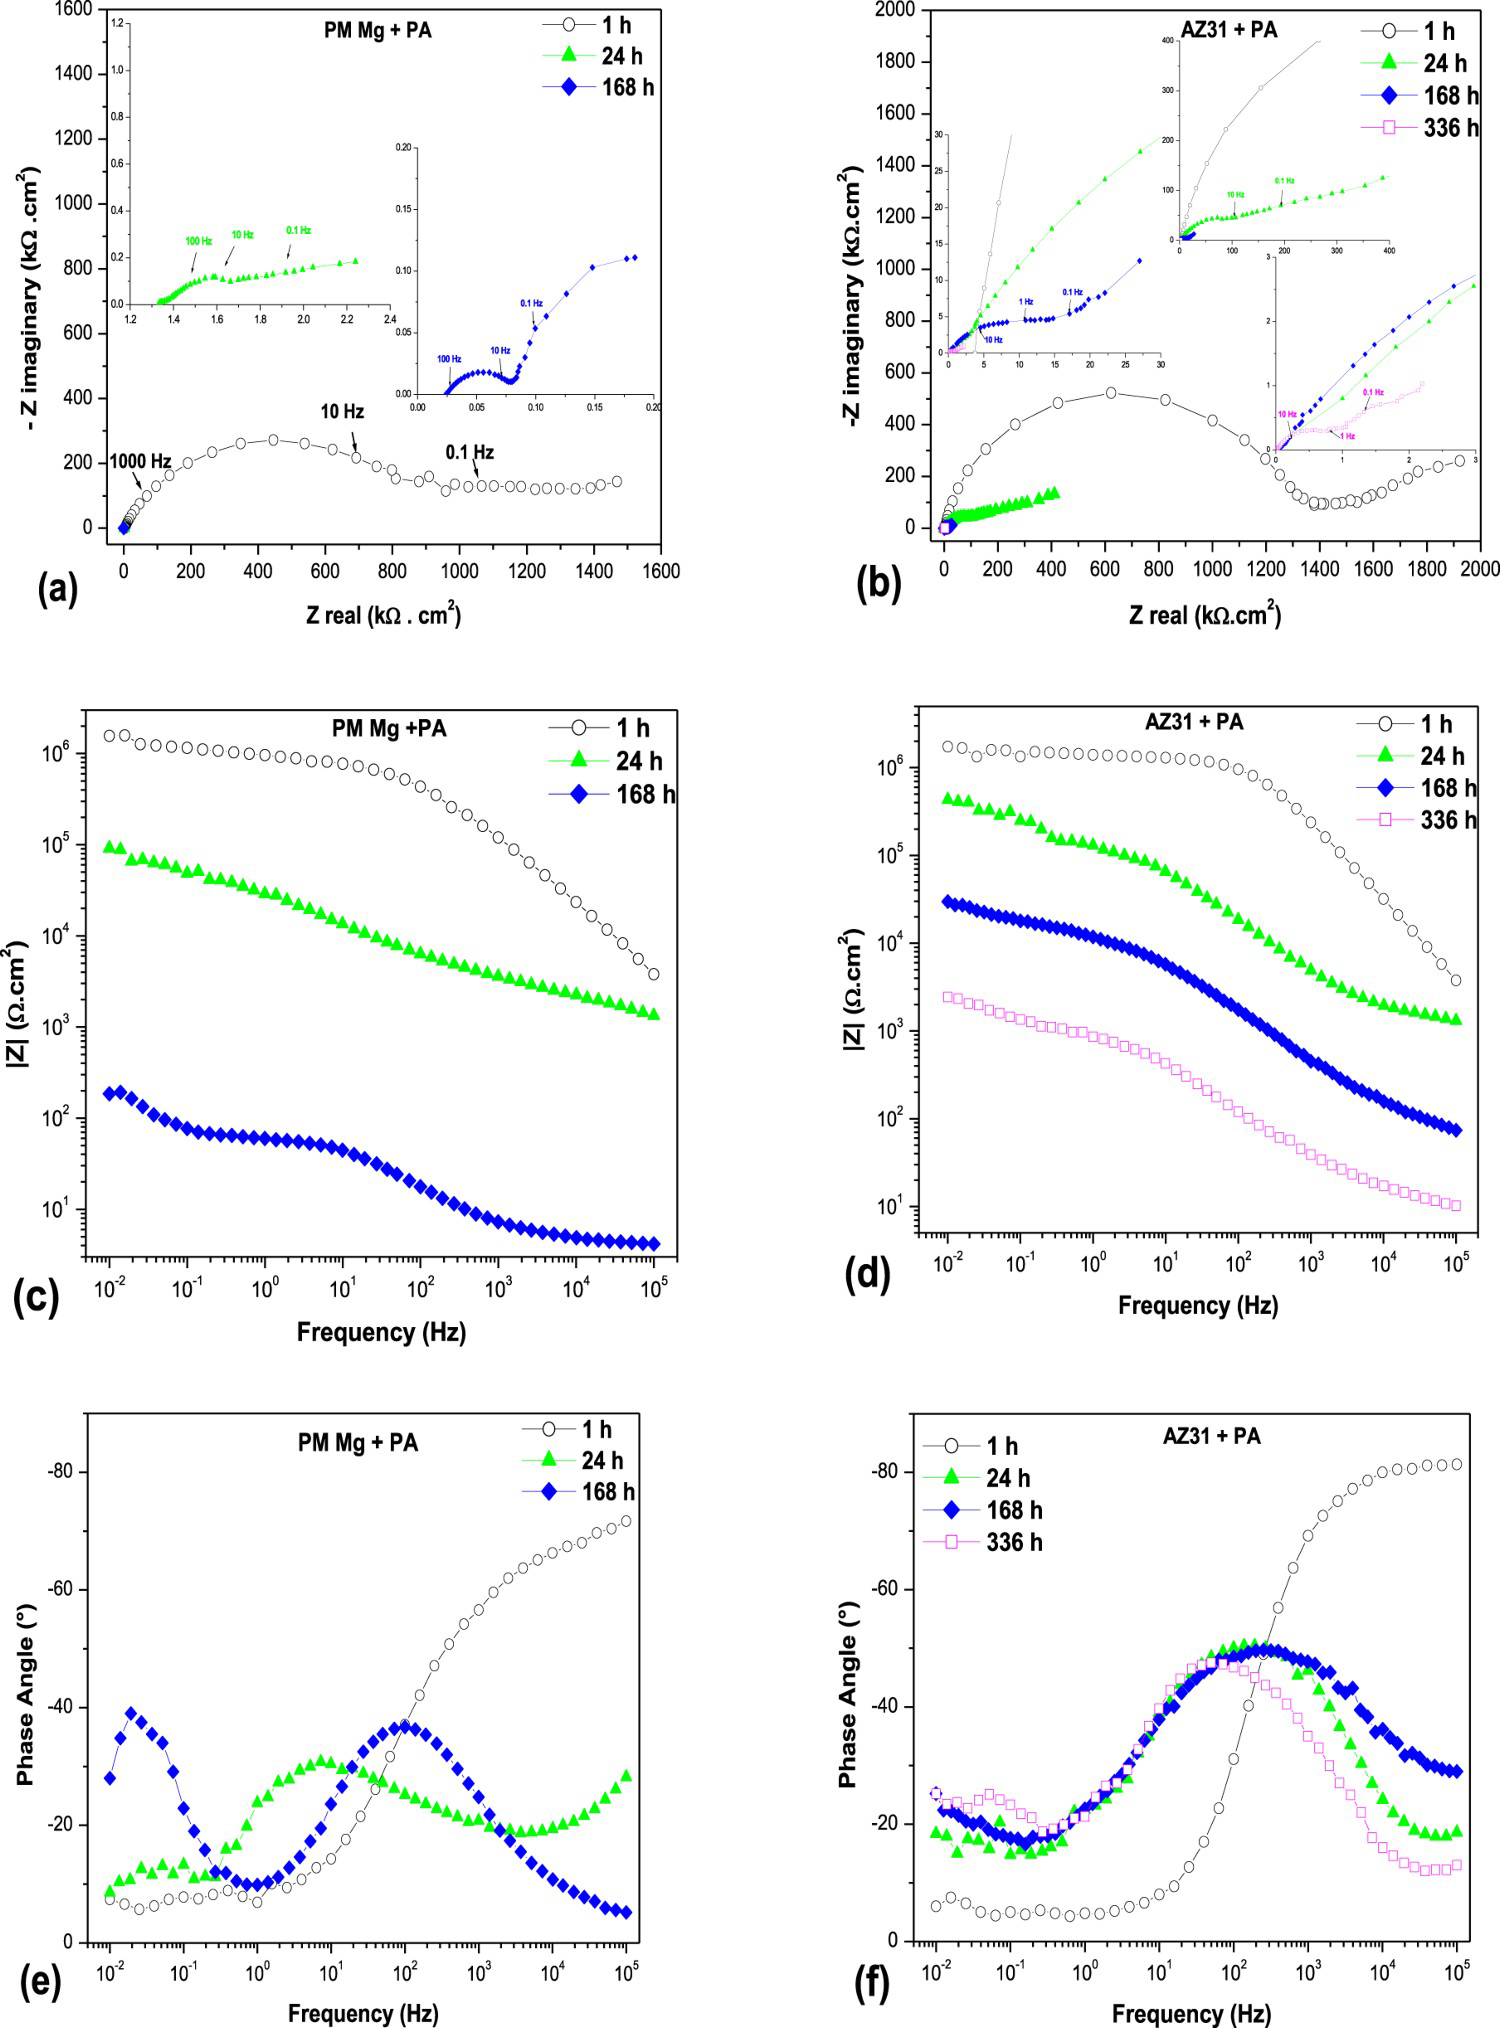
Figure 11(a) and (b) shows the Nyquist plots obtained for the PA-coated PM Mg and AZ31 alloy samples. Except for the samples exposed for 1 h, all the studied specimens exhibit two poorly defined capacitive loops, which was indicative of the occurrence of several surface processes with a smooth transition between time constants. The total impedance was approximately three orders of magnitude higher than that of the uncoated samples (Figure 10(a,b)), suggesting that the coating process produced an effective initial barrier. However, the evolution of the Nyquist plots with the immersion time shows large decreases in the loops diameters and thus the corresponding charge transfer resistance (Rt) values of these samples, indicating weaker corrosion protection during all the immersion tests, which resulted in a fragmentation of the coated PM Mg specimens before 336 h. The loops shape remained mainly unchanged over time except for the diameter decrease, implying a higher corrosion rate. Figures 2(a) and 7(a) confirm the PA coating cracking before the contact with the electrolyte and after 1 h of immersion, respectively. Such cracking is likely related to the straight lines with a slope of approximately 45° in the obtained Nyquist graphs that appeared at high frequencies after 1 h of testing and became more pronounced at longer testing times. This phenomenon is typically observed for porous electrodes (similar to the Warburg behaviour) and associated with the presence of a thin coating or superficial defects (such as cracks) on the electrode surface [79,80]. As the testing time increases, the Nyquist plots can evolve to a shape without a straight line, as observed for the coated PM Mg samples after 168 h. Most of the published studies on PA coatings reported the occurrence of cracking; however, none of them described the behaviour of porous electrodes observed in the present work, which was likely caused by the much shorter testing times (less than 1 h) [38–41] and drawing only Bode plots for longer exposures [15].
Equivalent circuits used to adjust the impedance data of the PM Mg and AZ31alloy: (a) for uncoated AZ31 alloy 1 and 24 h; (b) for uncoated PM Mg 1 h, (c) for all others, uncoated AZ31 alloy 168 and 336 h, uncoated PM Mg 24 h, coated AZ31 alloy 1-336 h, PM Mg coated 1-168 h.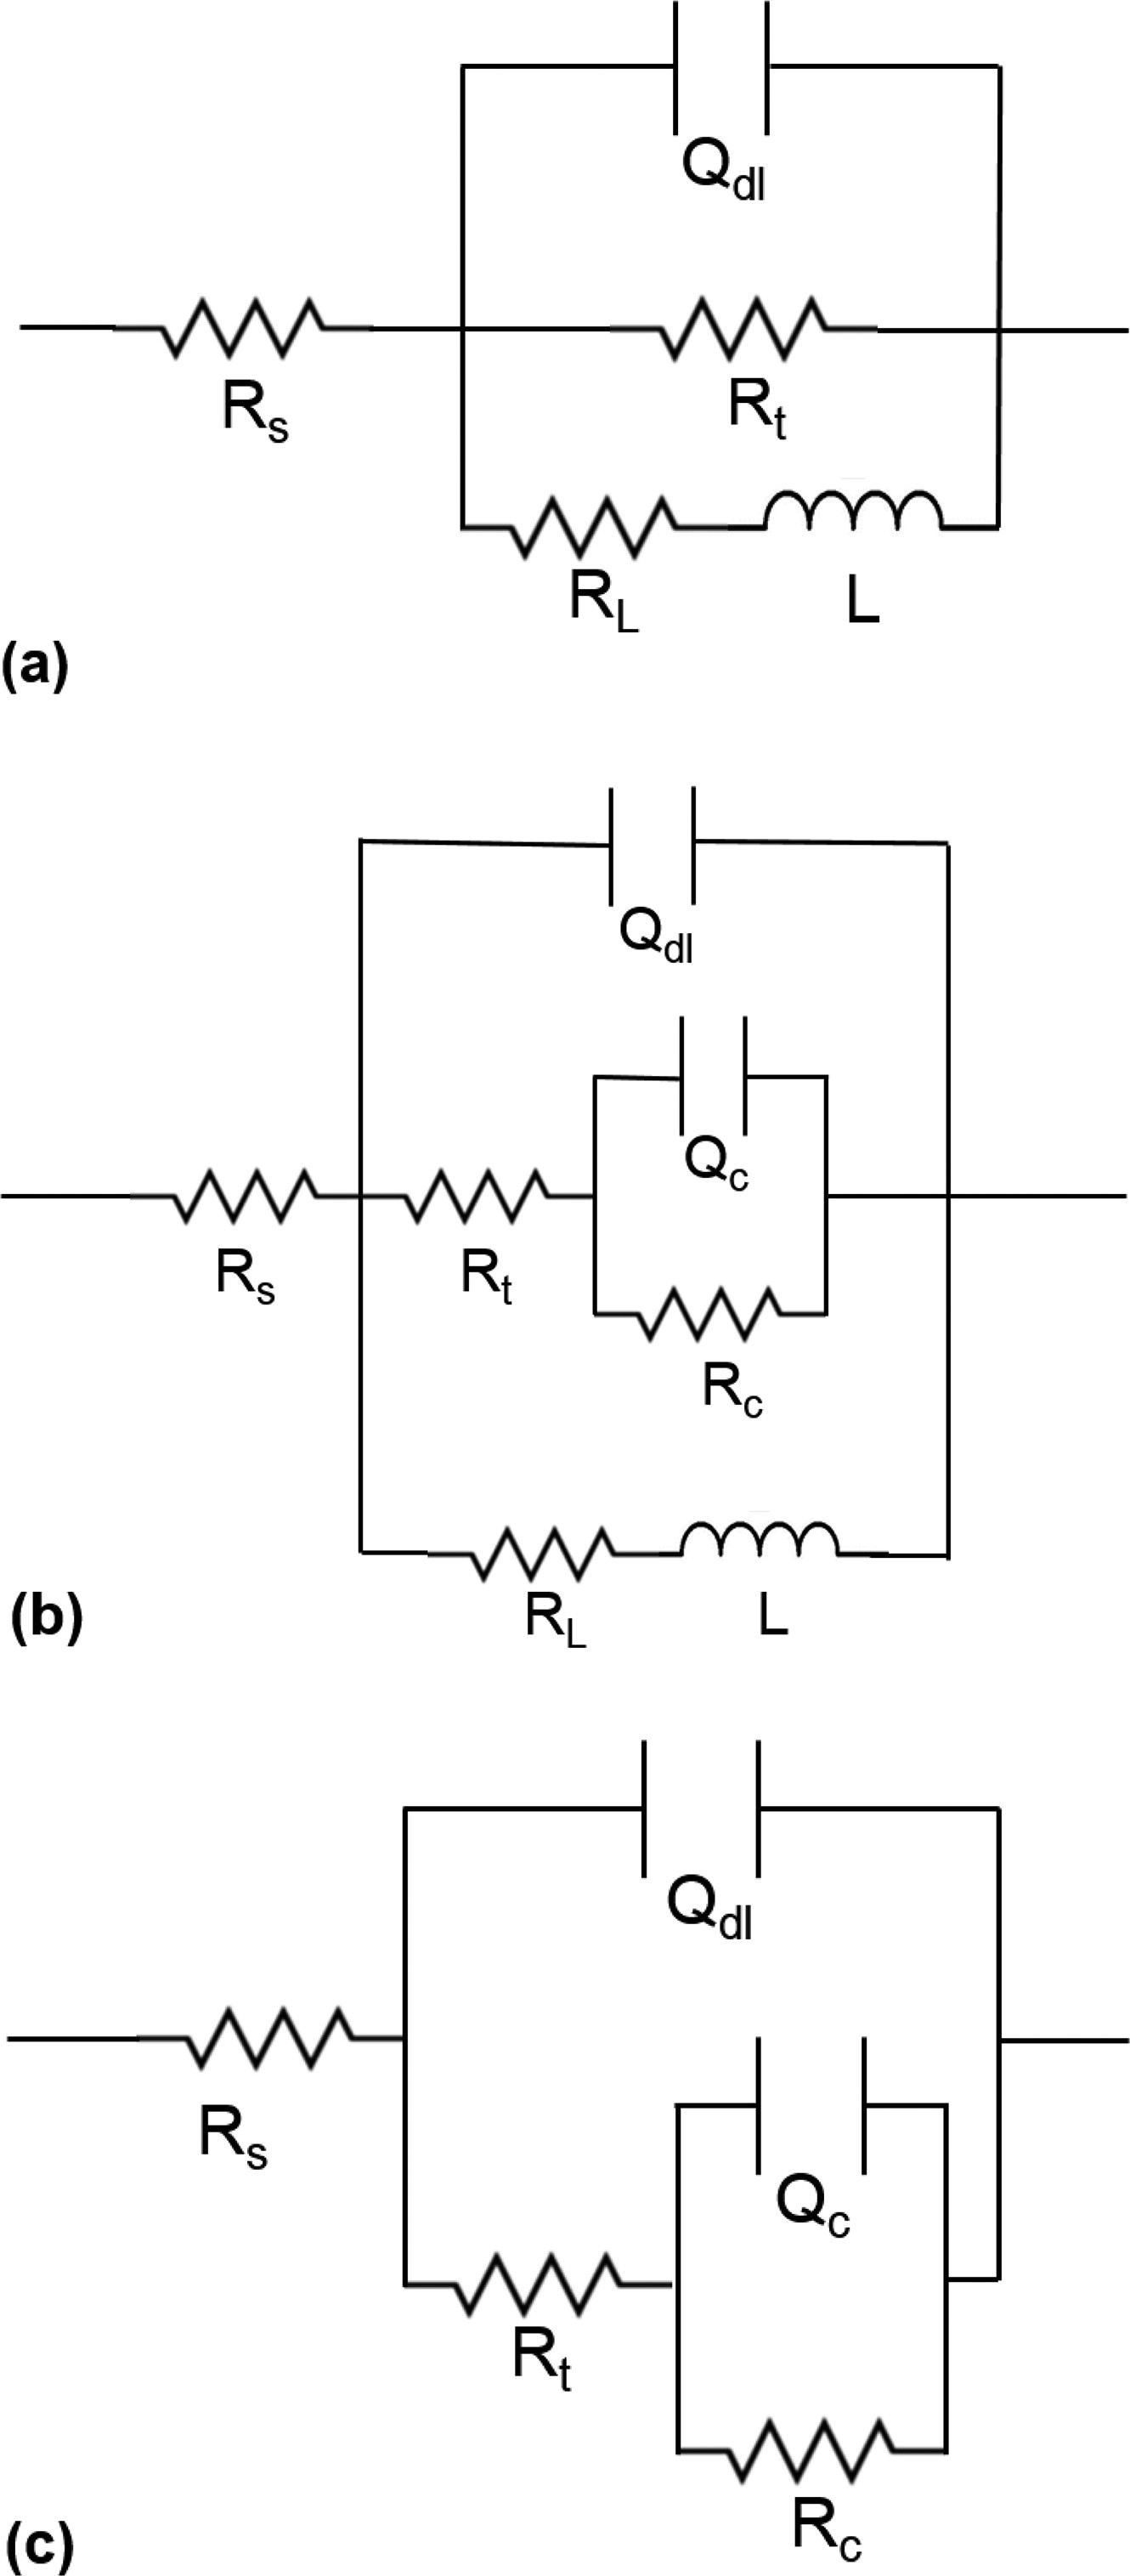
The different corrosion resistances of the PA conversion coatings are more clearly seen in the Bode magnitude plots obtained at different PBS immersion times (Figure 11(c,d)). In both plots, the total impedance │Z│, 0.01-Hz impedance (Zf), and the entire diagrams decrease with an increase in the immersion time. The reduction in Zf observed for PM Mg is much higher than that for the AZ31 alloy due to coating degradation, which increases the corrosion rates of the substrates. Compared with the PPCs reported in Reference [71], the test results obtained by direct and alternating currents are very close to each other. Several characteristic parameters extracted from Figure 11(e) and (f) have been proposed to provide a rapid response to the corrosion of coated materials [31]. Their values can be determined directly from the experimental spectra without data adjustment and the calculation errors resulting from the equivalent electric circuit models. One of these parameters is the phase angle at 10 kHz. The greater is its value, the higher is the compactness of the coating or corrosion product layer and the stronger is its protective effect [38,81]. In the Bode plots of the coated samples, the samples with the highest values of the phase angle at 10 kHz have the highest Zf values (Figure 11(e,f)). It is widely accepted that each maximum corresponds to a certain time constant. However, it is often not possible to clearly identify such maxima because time constants overlap, and their separation is not possible [59]. In other situations, they are not clearly distinguished in the measured frequency range [31,57,58].
The equivalent circuits that produced the best fits to the experimental data are shown in Figure 12. The main criterion for the data adjustment included the diameter of the first loop (determined graphically), which corresponded to the charge transfer resistance. In the three selected equivalent circuits, the high-frequency time constant (τ) is assigned to the interfacial corrosion layer, while the second τ is associated with the PA coating or the corrosion product film except in Figure 12(a) where it is assigned to the inductive loop. The equivalent circuits depicted in Figure 12(a) and (b) exhibited two and three τ, respectively, and were applied to the uncoated Mg-based materials. The equivalent circuit displayed in Figure 12(c) (2 τ) was used for both the Mg-based materials coated with PA and uncoated AZ31 alloy after 168 and 336 h of exposure. The χ2 of the obtained regressions varied from 10−3 to 10−4. A good fit between the experimental data and the proposed equivalent circuit was obtained for the uncoated AZ31 samples after 168 and 336 h of immersion (Figure 10(d)). The main question was whether the Warbug (W) impedance is present in τ at low frequencies or is the beginning of a new semicircle that has not been defined yet. To address it, the experimental data were fitted to the equivalent circuit presented in Figure 12(c) with and without W. The obtained χ2 values were 10−2 and 10−4, respectively. In addition, the exponent n associated with the CPE (Qc) was equal to 0.9 and 1.0 at immersion times of 168, and 336 h, respectively, which represented a capacitor and the beginning of a new semicircle.
The components of the equivalent circuits depicted in Figure 12 included the solution resistance (Rs), the CPE (Qdl) associated with the capacitance of the double layer, the charge transfer resistance (Rt), the capacitance of the PA coating or surface film produced by corrosion (Qc), the pore/microcrack resistance of the PA coating or the surface film of the corrosion products (Rc), the inductance (L), and the inductance resistance (RL). These components were used to describe the low-frequency inductance loop. The Q parameter is commonly used in equivalent circuits because it represents deviations from the ideal capacitance due to surface heterogeneity, roughness, fractal geometry or electrode porosity, current distribution, and the potential related to the electrode geometry [29]. It is defined by Y0 and exponent n; if n is equal to 1 or 0.5, Q represents a capacitor or a Warburg impedance (W), respectively.
The most important impedance parameters obtained from the numerical fitting were recorded, and their evolution with time was monitored in Figure 13(a)–(d). In these figures, it is easy to distinguish the large variations among the obtained values, which require a semi-log graph. Furthermore, the recorded parameters exhibit clearly defined trends, which significantly differ from the results of other published works containing multiple variations of these parameters [46,58]. Figure 13(a) and (b) describes the effect of the testing time on the evolutions of Rt and Rc, respectively. They show that in the case of the uncoated samples, these parameters increase with the testing time due to the deposition of corrosion products on the sample surface. The PA-coated samples behave differently; in their case, Rt and Rc decrease with time, which indicates that the coating loses its anticorrosive ability, a key property required for temporary implant applications. Once the coating fulfills its purpose of serving as a physical support for bone repair, it must be dissolved. Equivalent behaviours were observed for the uncoated (the anticorrosive resistance increases) and coated (the anticorrosive resistance decreases) samples as functions of the testing time in the OCP evolution (Figure 4), the weight loss data (Figure 3) and icorr obtained from PPCs in a previous study [71]. The resulting Rt and Rc values were consistent with the expected time variations of Qdl and Qc (a decrease for the uncoated samples and increase for the coated samples, as shown in Figure 13(c,d), respectively). When the PA-coated AZ91D alloy is immersed in the electrolyte, the coating thickness increases, leading to an increase in Rp and decrease in CPEdl. However, a further increase in the coating thickness due to immersion produces a loss of coating protection, which decreases Rp and increases CPEdl [28]. Because the capacitance of the double layer is proportional to the area exposed at the interface between the substrate and the solution, the increase in capacitance indicates that a larger defective area extends into the coating. The initial values of Rc and Qc obtained for both the coated Mg-based materials are very close because the coating strongly influences the corrosion resistance at the beginning of the immersion process. As mentioned previously, when Rc decreases and Qc increases, the barrier properties of the coatings deteriorate and their protective ability decreases [58]. In addition, Rc > Rt in all cases, which means that the resistance of the coating or corrosion products is greater than the charge transfer resistance.
Effect of immersion time on the evolution of: (a) charge transfer resistance (Rt), (b) pore/microcracks resistance of the PA coating or surface film of corrosion products (Rc), (c) capacitance of the double layer (Qdl) and (d) capacitance of the PA coating or surface film produced by corrosion (Qc), for the Mg-based samples tested in PBS.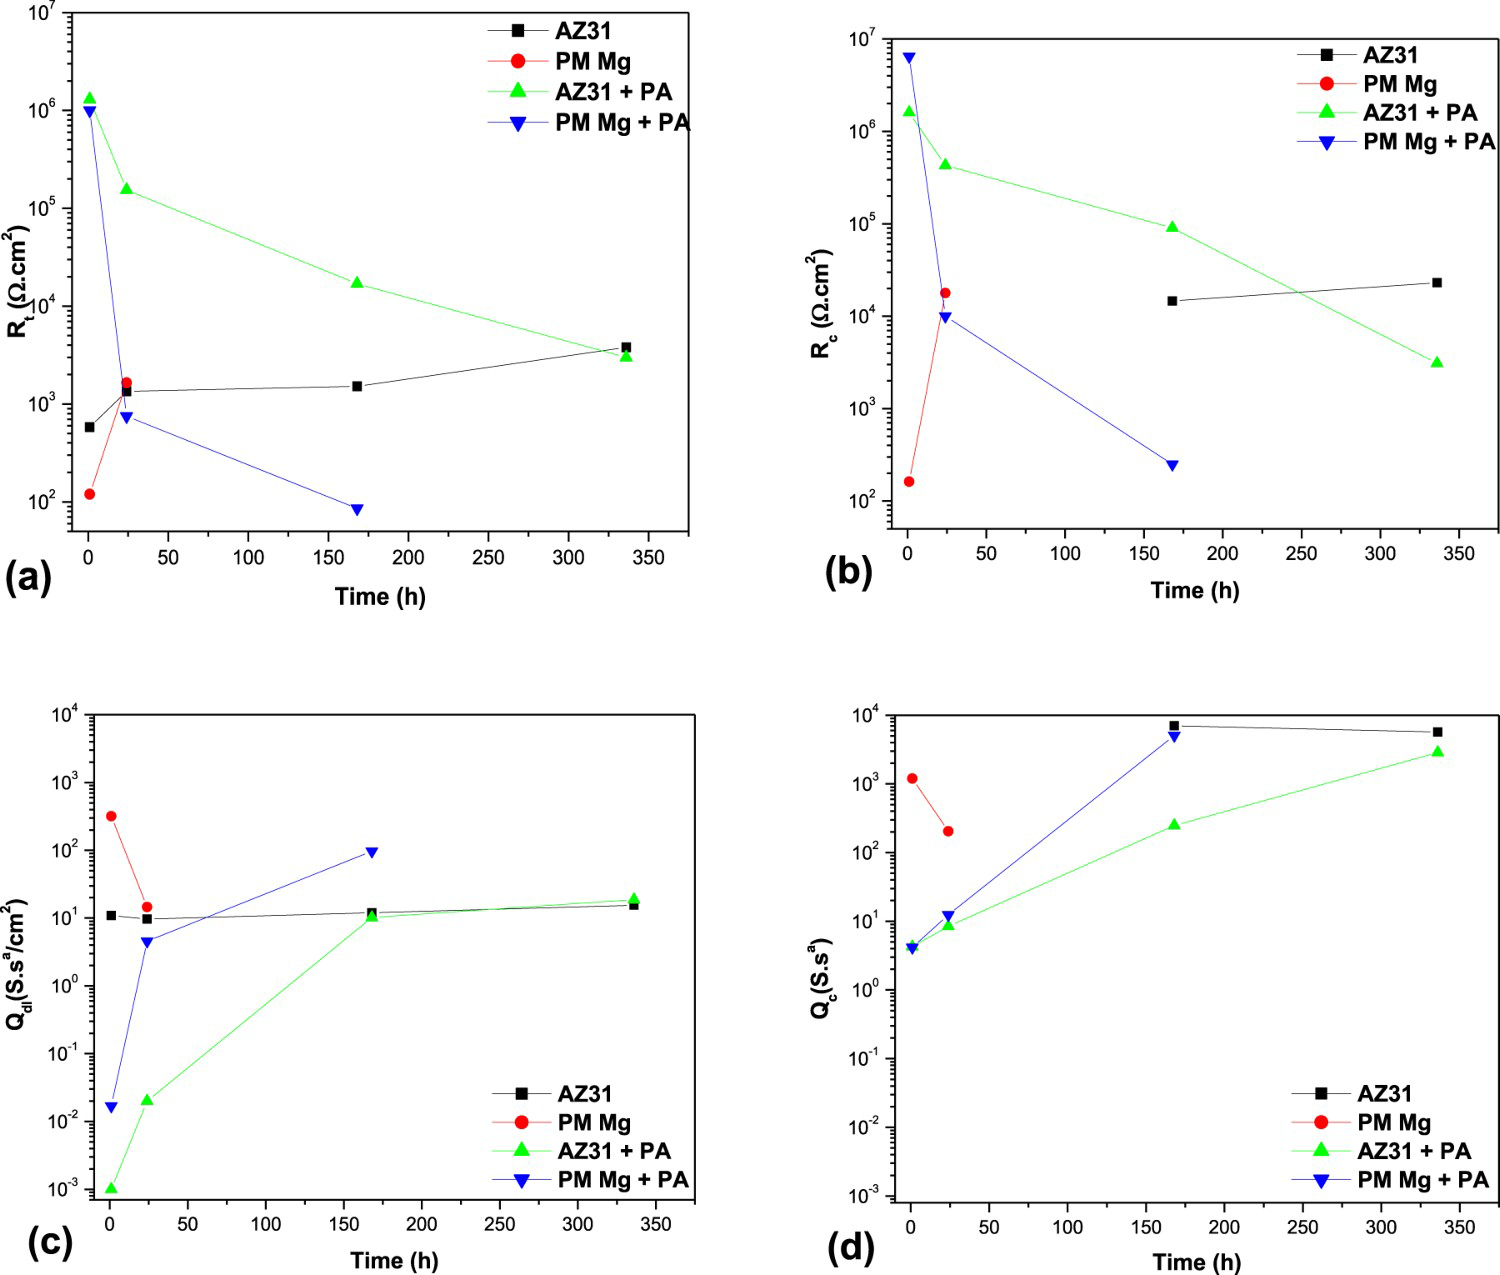
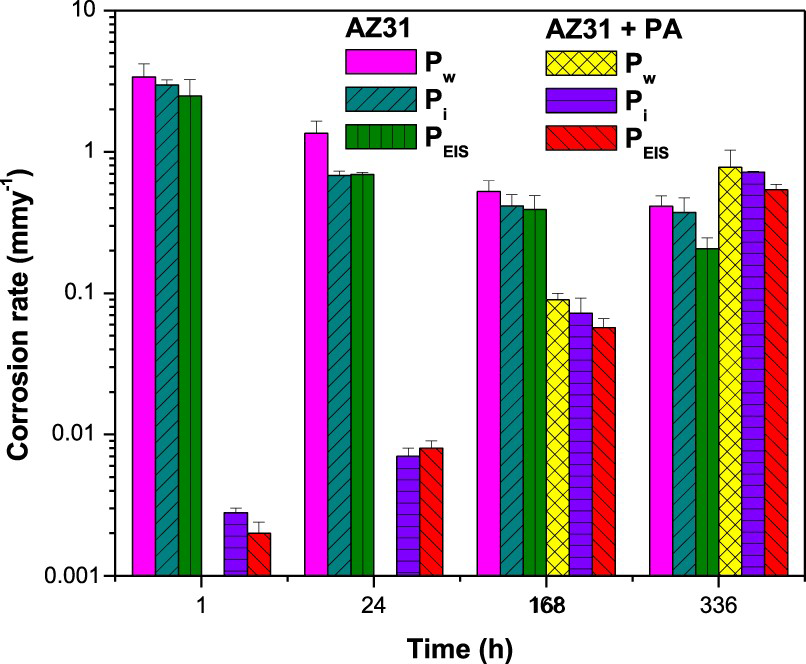
Finally, we compared the average corrosion rates of the uncoated and coated samples of AZ31 alloy and PM Mg obtained by the electrochemical techniques and weight loss measurements (Figures 14 and 15, respectively). The corrosion rate Pi (mm/y) and corrosion current density icorr (mA cm−2) are related via the following equation [8]:
Comparison of corrosion rates (mm/y) obtained from weight loss (Pw), PPC (Pi) and EIS (PEIS) for the PA-coated and uncoated AZ31 alloy after different immersion times in PBS solution at 37°C. Comparison of corrosion rates (mm/y) obtained from weight loss (Pw), PPC (Pi) and EIS (PEIS) for the PA-coated and uncoated PM Mg after different immersion times in PBS solution at 37°C.


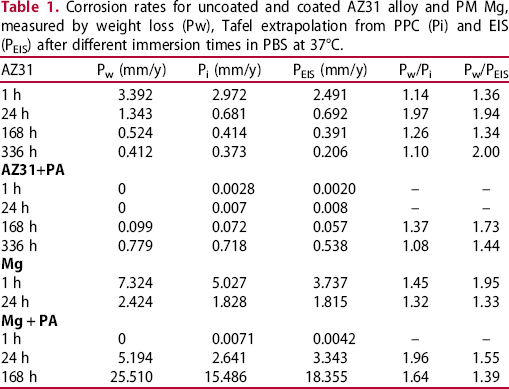
Corrosion rates for uncoated and coated AZ31 alloy and PM Mg, measured by weight loss (Pw), Tafel extrapolation from PPC (Pi) and EIS (PEIS) after different immersion times in PBS at 37°C.
Conclusions
Mg-based materials are interesting alternatives for use as temporary implants in bone repair; coatings are designed to prevail until healing is complete, after which they are dissolved away by body fluids without the need for any surgical interventions to remove the implant. This study demonstrated that the AZ31 alloy could be used as an implant, while PM Mg could not. The phytic acid conversion coating does initially protect the substrate in the PBS solution at 37°C, but the network of microcracks present in the coating reduces its protective effect with time. Studies have shown that sealing these microcracks increases the protection provided by the coating [37 41], however, these experiments were performed for short test times. Hence, the impact of sealing the microcracks on its behaviour for longer times of testing remains unclear. The following conclusions were drawn from the obtained results:
PA conversion coatings can reduce the corrosion rate of Mg-based materials in PBS at 37°C by up to three orders of magnitude as compared with that of the bare materials. The corrosion rate of the PA-coated AZ31 alloy in PBS is lower than the uncoated alloy until approximately 200 h of immersion time. Both the uncoated and PA-coated AZ31 alloy samples gradually degrade with time, indicating their biodegradable nature. The corrosion rates of the uncoated and PA-coated Mg-based materials determined by different techniques were very similar. In the case of AZ31 alloy, this trend was observed for 336 h. The PA coating on the AZ31 alloy surface reduces the corrosion rate in PBS at relatively long immersion times without altering its biodegradable nature, suggesting its potential application as a temporary endoprosthetic implant material.
Footnotes
Acknowledgements
This work was supported by the Spanish Ministry of Science, Innovation and Universities [RTI2018- 101506-B-C31]. The authors would like to thank Dr. S. Feliu Battle for his valuable comments and suggestions.
Disclosure statement
No potential conflict of interest was reported by the author(s).