
Abstract
The effect of strain-induced martensitic transformation (SIMT) and its reversion (SIMRT) on the microstructure evolution and localised corrosion of 2304 lean duplex stainless steel (LDSS) was investigated. The cold-rolled LDSS was subjected to reverse annealing at 600°C to 900°C for 1800 s. To evaluate the microstructure, scanning (SEM) and transmission electron microscopy (TEM) and electron backscatter diffraction (EBSD) were used as the main techniques. Subsequent electrochemical characterisation included cyclic polarisation and double loop-electrochemical potentiokinetic reactivation test. SIM formation was noticed after cold rolling, and a partial reverse transformation was seen after annealing at 600°C. At 600°C, SIMRT led to decrease in pitting resistance and increase in the degree of sensitisation (DOS). Increasing the annealing temperature favoured localised and intergranular corrosion resistance. The obtained results indicate that reversed austenitic and recrystallised grains have a beneficial effect on desensitisation and corrosion resistance of 2304 LDSS.
Keywords
Introduction
Duplex stainless steels (DSS), characterised by a two-phase microstructure austenite (γ) and ferrite (α), have an attractive combination of mechanical strength and corrosion resistance and are widely applied in the chemical, petrochemical, marine, nuclear, and paper industries [1]. When DSS is exposed to temperatures ranging from 300°C to 1000°C, deleterious phases may precipitate, such as intermetallic phases, nitrides and carbides [2]. The precipitated phases induced Cr- and Mo-depleted zones, leading to a decrease in corrosion resistance of the DSS, because the passive layer stability of DSS depends on the Cr and Mo content [3].
Cr- and Mo-depleted areas can be measured by the degree of sensitisation (DOS) through Double-Loop Electrochemical Potentiokinetic Reactivation (DL-EPR) tests. A high DOS indicates that the material is susceptible to selective corrosion, which is accompanied by a strong reduction of pitting corrosion resistance [3]. Therefore, it is essential to know the sensitisation behaviour of the LDSS to detect and avoid detrimental precipitation.
Besides the occurrence of secondary phases, the possibility of γ transforming into α′-martensite induced by strain (SIM) cannot be ignored [4]. The SIM is related to the stability of the γ, which in turn is linked to the amount of alloy elements solubilised and the deformation mechanisms, involving the stacking fault energy (SFE) [5]. After annealing above A s (martensite reverse transformation initiation temperature), the reverse transformation occurs in which the α′-martensite is reversed to γ (SIMRT) and recrystallisation takes place in deformed austenite [4,5]. During the reverse transformation, deleterious phases may precipitate owing to the faster Cr and C diffusion in the bbc α′-martensite than in the fcc austenite phase [6,7].
According to Tomimura et al. [8] and Kumar et al. [9], austenite reversion (α′ → γ) may be driven by either diffusion-controlled or diffusionless (displacive) mechanisms [8,9]. Diffusional-reversed austenite, forms and develops through atomic diffusion over large distances, therefore, has low dislocation densities [8]. According to Man et al. [6], the new reversed austenite can nucleate at the Cr-depleted zones of the precipitates, reducing or eliminating the Cr-depleted region. In the diffusionless displacive transformation, there is a coordinated movement of atoms (e.g. shear) and the reversed austenite has a high dislocation density and shape of the parent SIM [8,9]. Briant and Ritter [10] study indicates that this high dislocation density of the reversed austenite induced rapid healing. Regarding the ferrite phase in DSS, several precipitation reactions have been reported, such as sigma phase and carbides, besides the diffusion rates of Cr and Mo in ferrite are much faster than in the austenite, increasing the precipitation kinetics [2].
According to Zhou et al. [11], increasing the degree of cold deformation will increase the degree of both residual stress and refined grain size and subsequently the precipitation behaviour of the material will be affected. Furthermore, SIMT provides sites for deleterious phase precipitation, and its reverse transformation can intensify its precipitation [12]. Briant and Ritter [10] reported that SIM in austenitic stainless steels causes rapid sensitisation at temperatures below 600°C, leads to extensive transgranular corrosion, and the increase in the reverse temperature transformation can produce rapid healing. Jinlong et al. [13] works indicate that self-healing in AISI 304 austenitic stainless steel can be effectively accelerated by cold-rolling. According to Shukla et al. [14] after thermal aging of 50% cold work of a manganese austenitic stainless steel the DOS almost reached to the value of DOS of as-received solution annealed sample. Self-healing on LDSS has been reported after relatively long-time annealing. Kauss et al. [3] reported with an X2CrNiN22-2 that the healing effect starts at 20 h and the DOS decrease. Gao et al. [15] found in a hot-rolled LDSS 2101 that healing would take place at 700°C after annealing for about 20 h.
Self-healing, SIM formation and SIMRT have been widely studied in austenitic stainless steels. To the best of our knowledge, however, the experimental report on SIMT and SIMRT on corrosion resistance of DSS has not been published. In this context, this research aims to elucidate the effects of SIM and SIMRT after cold working on microstructure evolution and corrosion resistance of the 2304 LDSS, within the range of 600-900°C for 1800 s.
Materials and methods
Chemical composition of steel 2304 (% weight).

For OM analyses, after cutting, mounting, grinding and polishing, etching was conducted by using Beraha etchant. Leica optical microscope and the respective software were used to acquire the images. The SEM was conducted in an FEI Inspect S50 microscope. Electron back scattered diffraction (EBSD) was also used to identify the SIMT. The samples for SEM were prepared according to a standard metallographic procedure, followed by etching with Beraha etchant and also oxalic acid 15% solution at 15 V for 10 s.
Thin foils used for TEM observation were prepared by single-jet electropolishing in a solution of 5% perchloric acid and 95% methanol at a temperature of approximately −30°C and a voltage of 20 V [18]. The foils were examined using an FEI Tecnai G2-20 system operated at 200 kV. TEM was performed using cold-rolled samples with 60% reduction because the deformation was more intense in this condition. Gatan software was used to index the electron diffraction patterns obtained from TEM.
A Panalytical Empyrean diffractometer was used for phase identification and quantification, in the 2θ range from 30° to 120° with a step scan of 0.02 s−1. Phase quantification was obtained using a direct comparison method to calculate the amount of each phase (α+γ) according to De et al. [19], considering the area under each diffraction peak of the respective phases. The specimens for EBSD were prepared according to a standard metallographic procedure, followed by mechanical polishing with 0.05 μm colloidal silica. The software used to analyse the data collected from EBSD pattern was the Orientation Imaging Microscopy (OIMTM). From the EBSD software, and analysis, kernel average misorientation (KAM) maps were obtained.
Electrochemical measurements were recorded on an Autolab PGSTAT302N potentiostat by the three-electrode system at 22 ± 2°C. An Ag/AgCl (sat.) reference electrode and platinum plate as counter were connected to electrochemical workstation. The samples were cut into 1 cm2 pieces, welded to copper wires, mounted in acrylic resin, ground to 600 grit silicon carbide paper and the contact region between the sample and resin was sealed with araldite epoxy resin. The cyclic potentiodynamic polarisation (CPP) was performed in 3.5 wt-% NaCl solution at a scan rate in the anodic direction of 1 mV s–1 after 1 h of open circuit potential (OCP) stabilisation and was reversed at the apex anodic current of 1 mA cm–2. Then the scan was reversed in the cathodic direction down to the OCP. The DL-EPR test consisted of performing an anodic scan starting from the OCP to a potential of +300 mVAg/AgCl and subsequently reversing the scan to the open circuit potential again. The sweep rate in both directions was 1.0 mV s–1 in a solution containing 0.5 M H2SO4 + 0.125 M NaCl + 0.0025 M KSCN.
Results and discussion
Microstructural characterisation
Figure 1 shows the micrographs of the 2304 LDSS after hot rolling and annealed conditions as-supplied by the steel plant. The images obtained by SEM show the ferrite (lower relief phase – white arrows) and austenite (upper relieve phase – yellow arrows). In the SEM images (Figures 1–3), the contrast between the phases was not so pronounced, so the phase identification can be made through the relief. EDS analysis was also done for clarification. The etchant used, Beraha, preferentially etches the ferrite, emphasising the austenite.
Samples of the 2304 LDSS (a) as-received and (b) cold rolled 60%, SEM.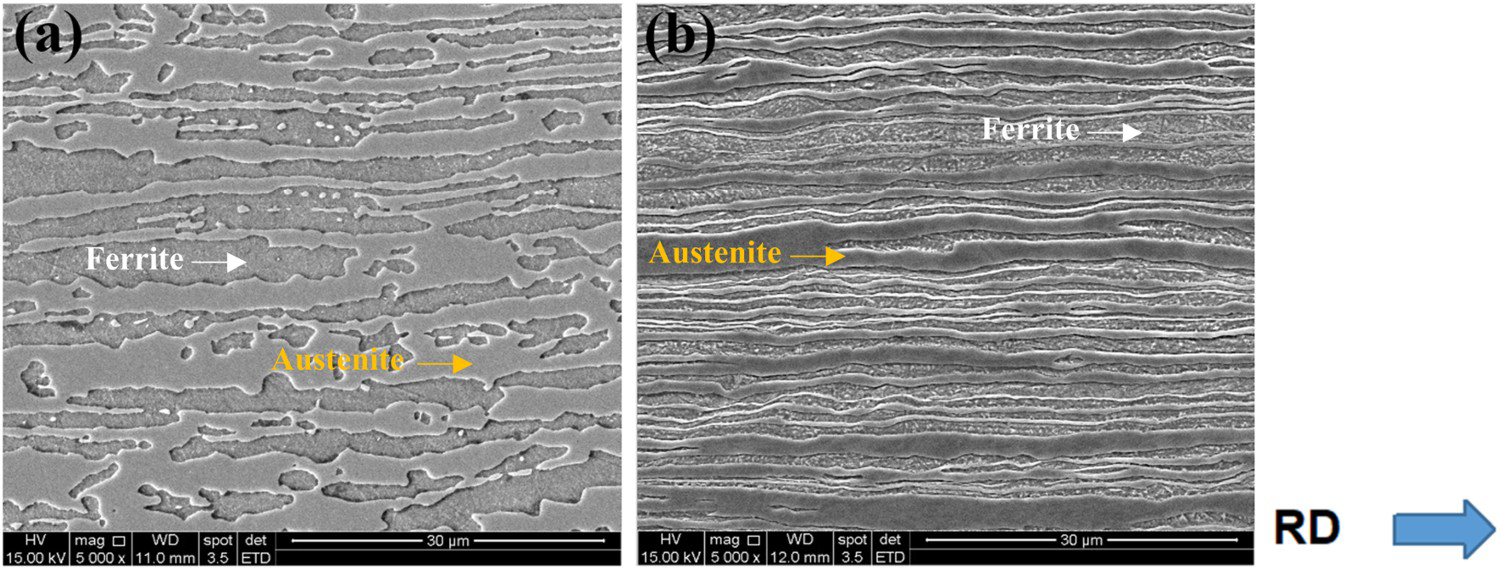
The hot rolling process (Figure 1a) resulted in a microstructure with elongated grains along the rolling direction, RD. Both phases developed a typical microstructure, consisting of alternating lamellae of ferrite and austenite, which is characteristic of DSS. After cold rolling with 60% thickness reduction, it was possible to observe, in Figure 1(b), a significant reduction in lamellas spacing because of cold strain hardening.
Figure 2 shows the microstructure originated from the annealing heat treatment at 600°C, 700°C, 800°C and 900°C for 1800 s, after cold rolling 60%. It is possible to notice that with isothermal annealing the elongated microstructure with alternating lamellae was maintained, with austenite nucleation between the ferritic lamellae. Visually, a slight increase in austenite fraction was observed with increasing annealing temperature. Additionally, breaks in the continuity of the austenite lamellae were observed (Figure 2d), indicating that part of the austenite phase suffers from recovery and recrystallisation. Another austenite fraction comes from reversion process.
Samples of the DSS 2304 duplex steel cold rolled 60% and annealed at (a) 600°C, (b) 700°C, 800°C, (d) 900°C for 1800 s.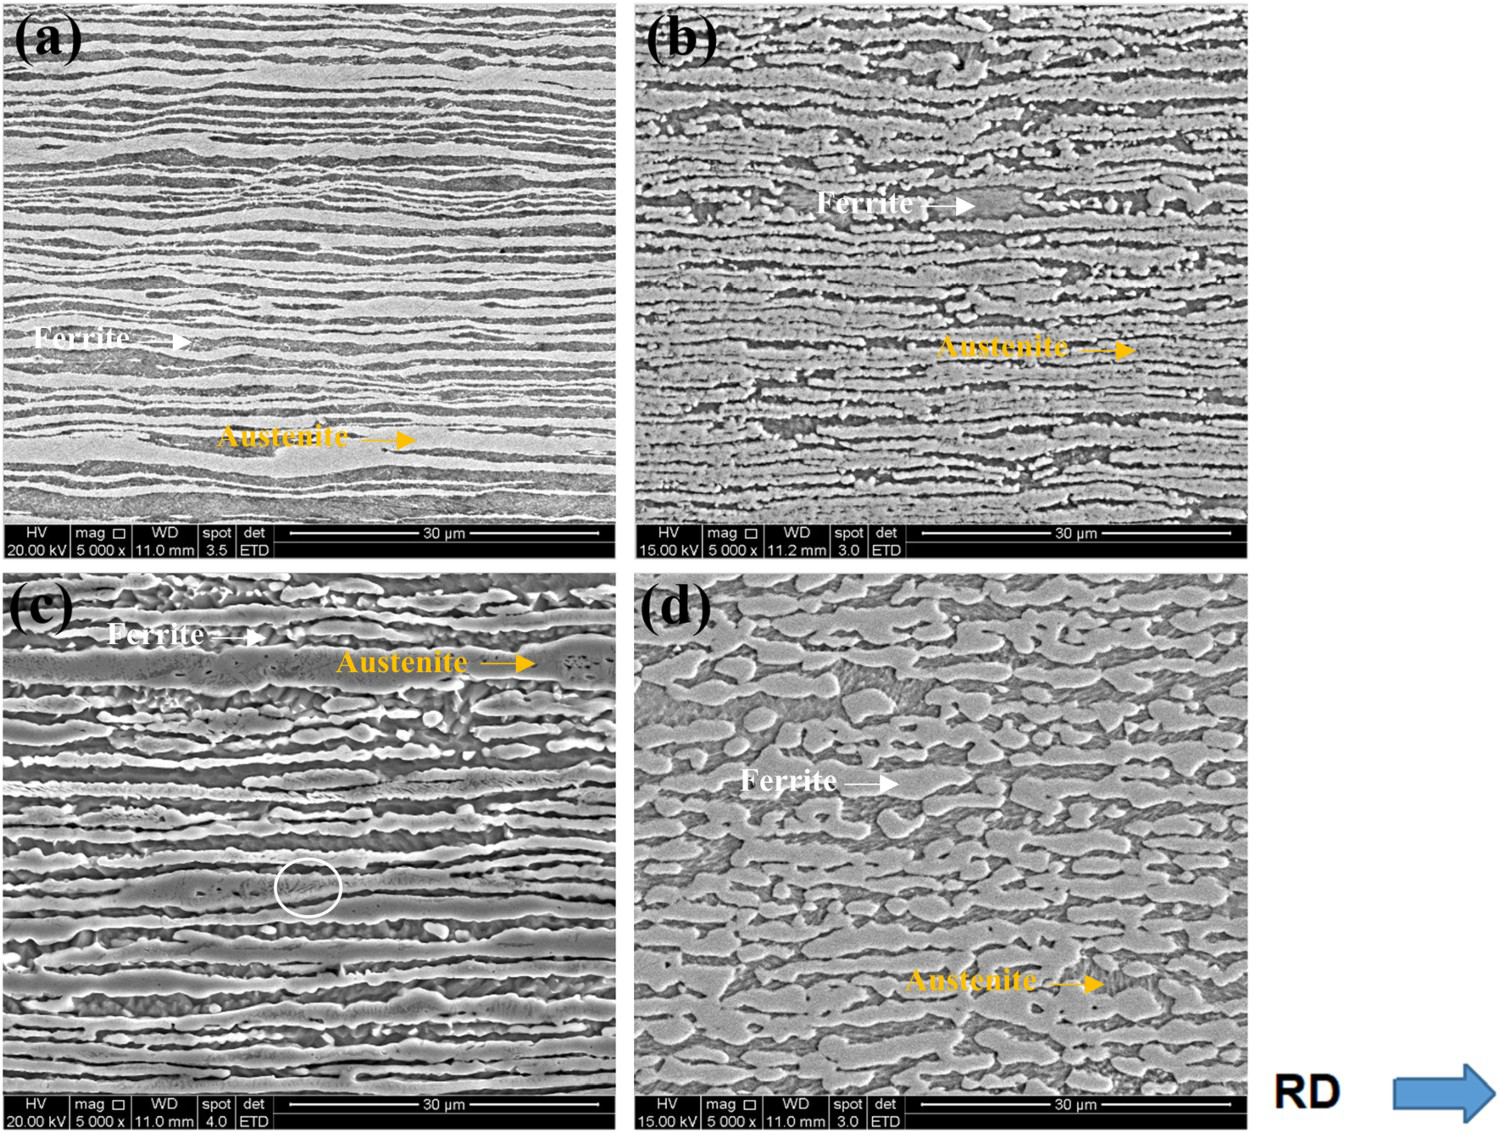
Figure 2(c) shows some features revealed by Beraha etchant, as indicated by white circle. These features may be austenite regions that did not transform into α’-martensite, or regions formed by austenite from α’-martensite reversion, being regions that have different anodic potential within the same austenite grain.
Figure 3 evidence the presence of these wavy lines (blue circles) with an increase of the magnification in the micrographs, characteristics of shear band intersections. After annealing at 600°C, the shear bands are still observed (Figure 3b). These shear bands are indicative of the α'-martensite presence [20].
Samples of the DSS 2304 (a) cold rolled with 60% of reduction; (b) cold rolled 60% and annealed at 600°C for 1800 s.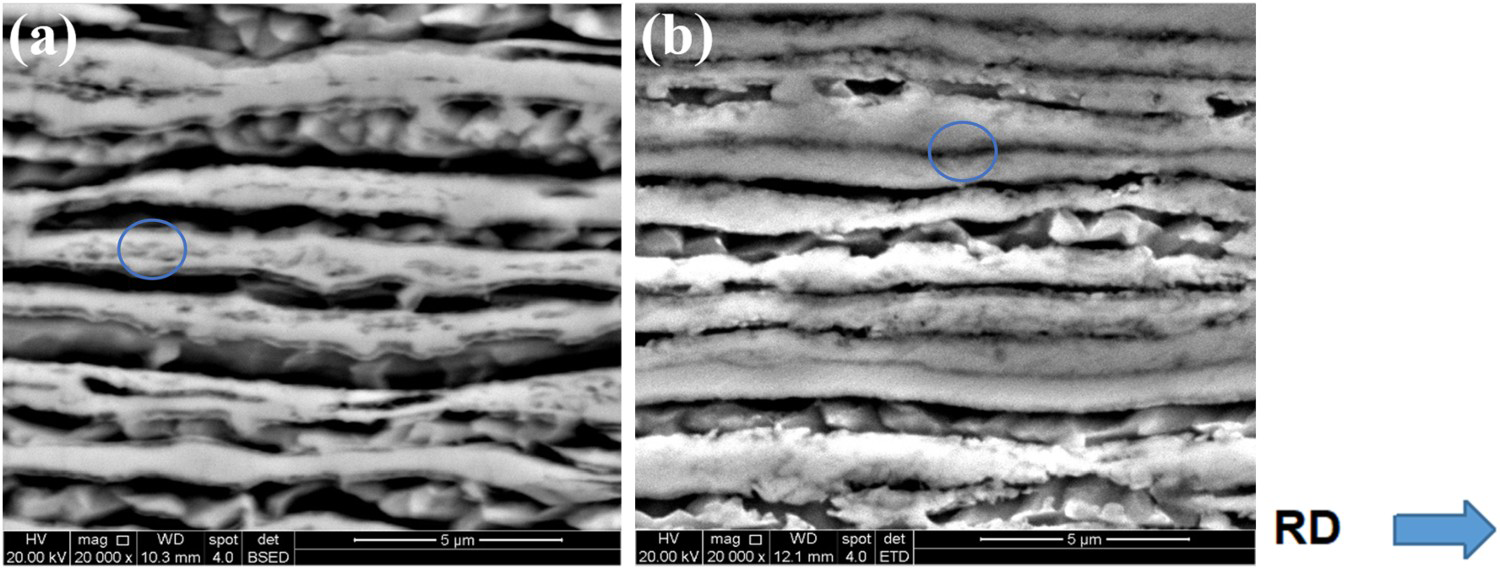
Figure 4 shows the X-ray diffraction patterns (XRD) of the as-received, cold-rolled 60%, and annealed at 600°C, 700°C, 800°C and 900°C for 1800 s specimens. The quantification of the phases of all conditions is presented in Figure 5. XRD patterns describe the presence of ferrite and austenite. SIM formation has occurred for the cold-rolled sample, but its occurrence appears together with the α-phase in the XRD patterns. As expected, the XRD did not allow the identification of α′, but, indirectly, this technique allowed the detection of α’ through the phase quantification. The α'-martensite was identified in which peaks coincide with those of ferrite, which happens due to both phases (α + α′), present a bcc crystalline structure [20].
Diffraction patterns of the 2304 LDSS: as-received, cold rolled 60% and annealed after cold rolling at 600°C, 700°C, 800°C and 900°C. Volume fraction of phases after cold rolling by 60% and then annealed at different temperatures for 1800 s.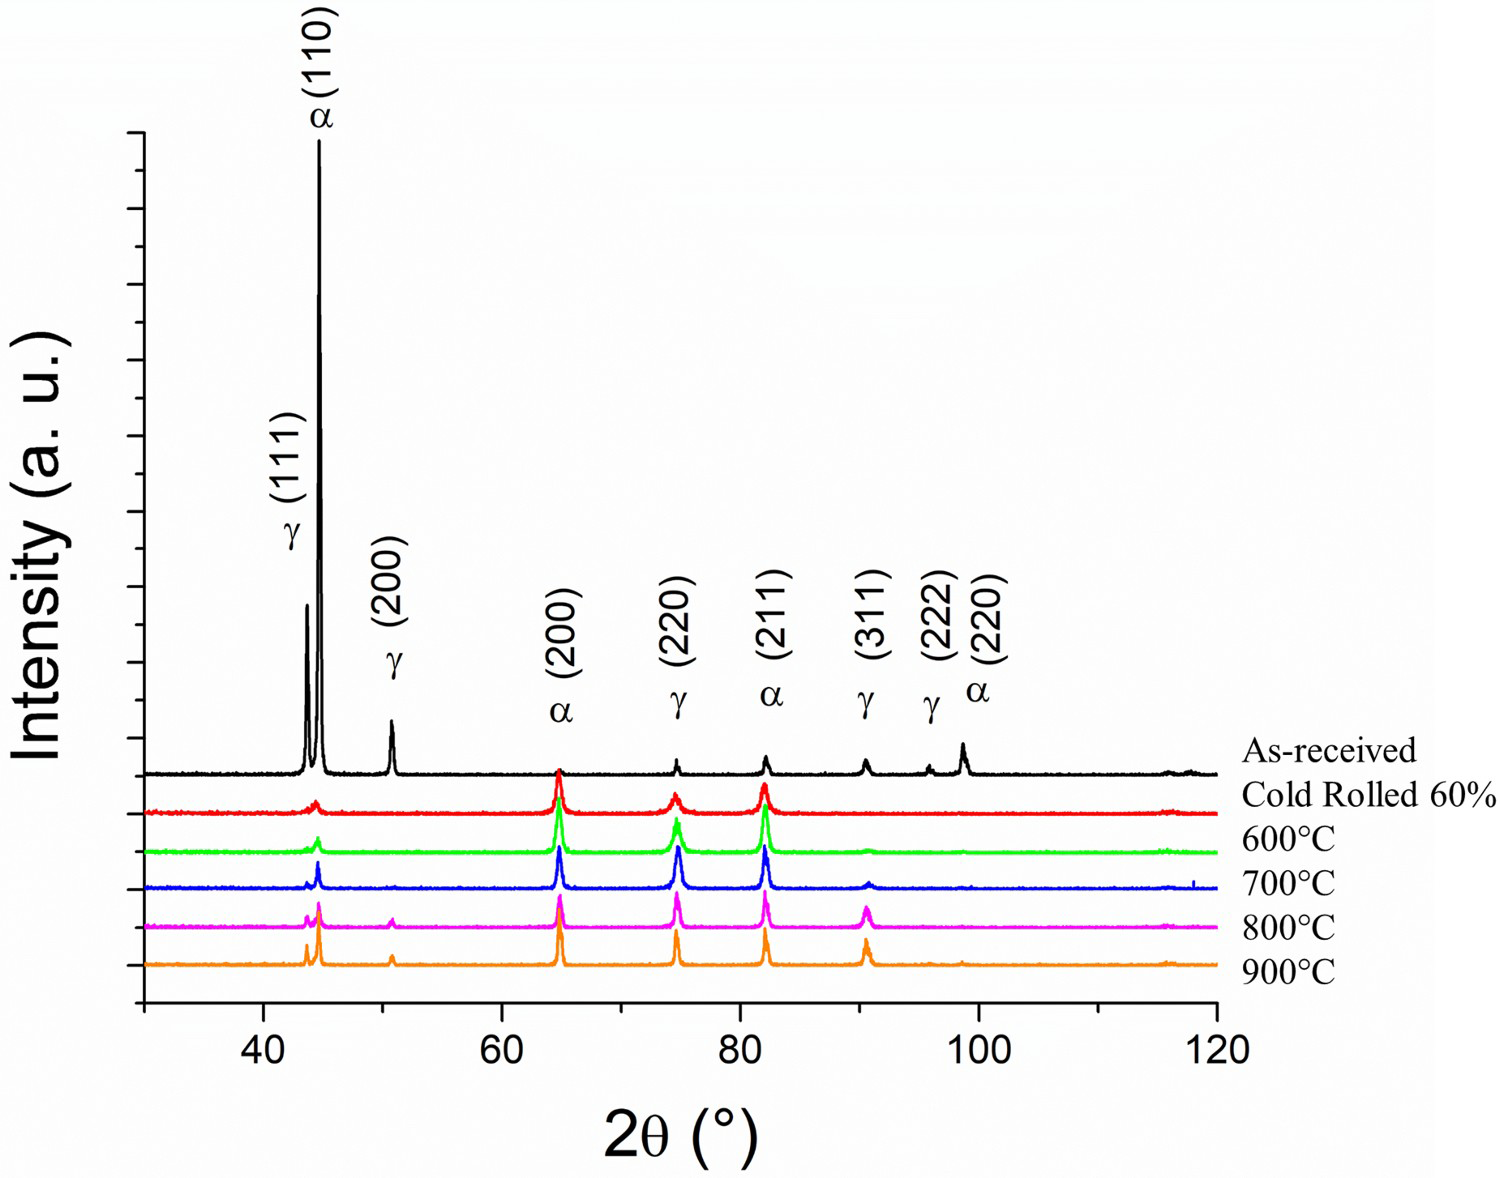
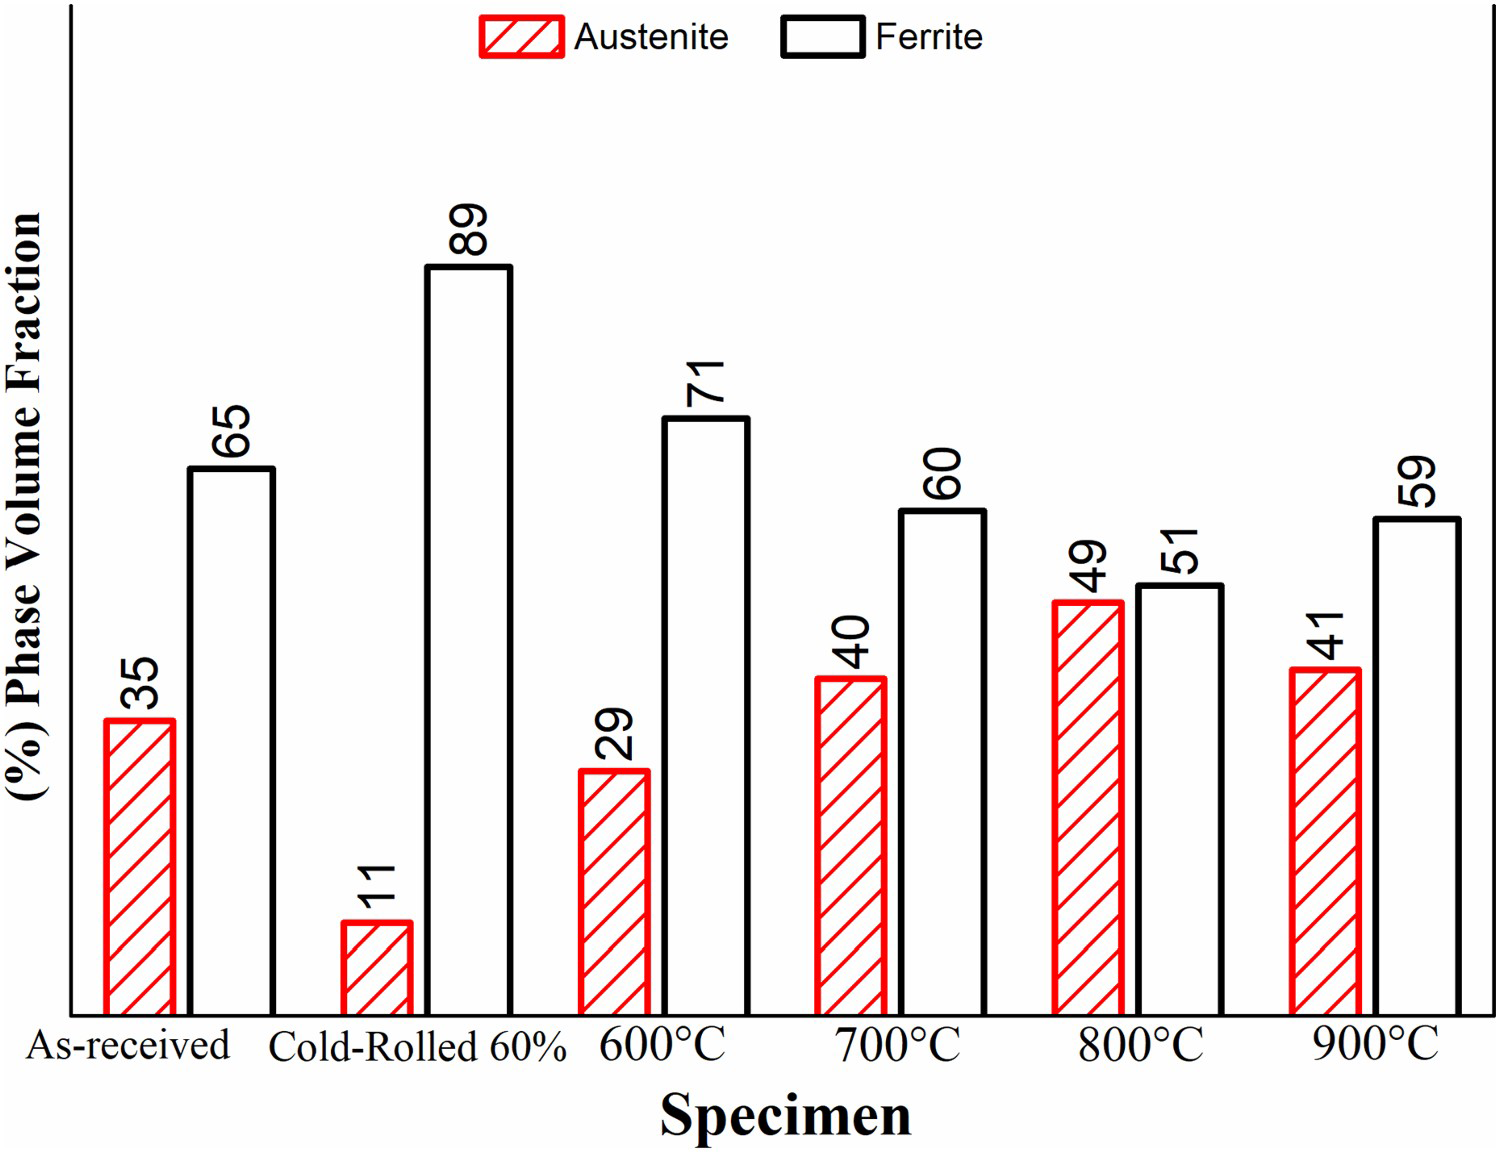
The quantitative data exhibited in Figure 6 showed that the initial sample was formed by 35% of γ and 65% of α. After cold rolling 60%, the γ volume fraction decreases and α increase, comparing the phase volume fraction between the as-received and cold-rolled conditions, it was concluded that the amount of α′ was increased by 24%. After annealing at 600°C for 1800 s, it can be observed a light increase in γ volume fraction. For annealed samples, an increase in the amount of austenite and a reduction in α are noticed as a trend (Figure 5). Furthermore, ϵ-martensite peaks were not found after deformation.
(a) Bright-field TEM micrograph of DSS 2304 cold rolled with 60% reduction, (b) dark-field image of the area in (a), (c) area which SADP was made and SADP, (d) TEM micrograph where α′-martensite at shear bands is exhibited, (e) dense dislocation walls arrays in the ferrite and α′-martensite.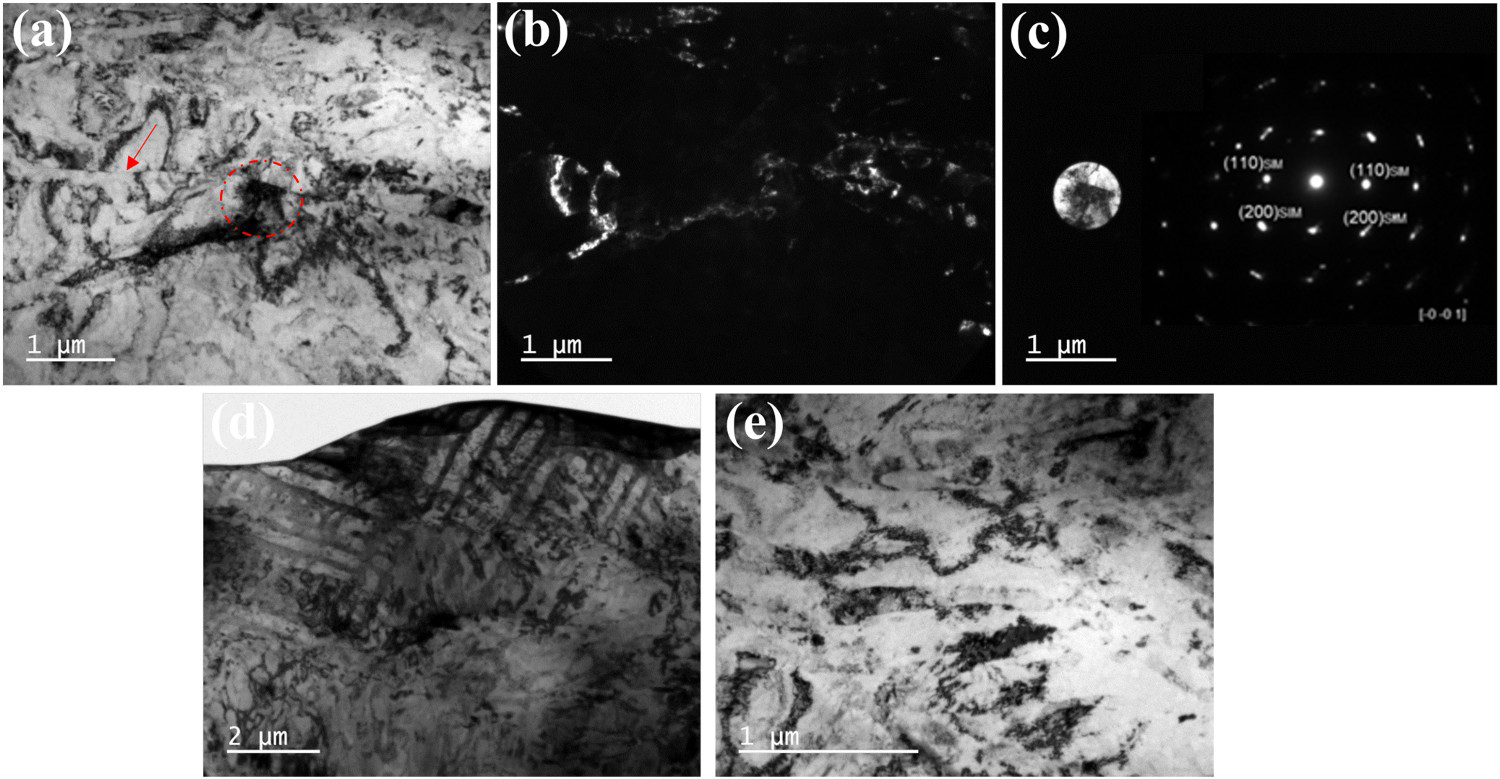
For the 2304 LDSS precipitation kinetics are slow due to the low amount of Mo present in the steel, around 0.28 wt-%. However, after severe cold rolling and α’ formation, the annealed sample may precipitate secondary phases. Due to the small amount of these precipitates, the phase quantification is restricted by the XRD detection limit and could not be detected.
TEM micrographs of samples cold rolled 60% are shown in Figure 6. From Figure 6(a), one can observe the grain boundary dividing the phases α and γ, as indicated by a red arrow. The central region of the image is highlighted (red dotted circle) with a structure that resembles α’, the region in which an SADP was performed, and its diffraction pattern is shown in Figure 6(c). Figure 6(b) shows the same region but with a dark field mode. TEM image confirms that in α’ area has a high density of dislocations. Furthermore, Figure 6(d) shows another bright-field image, region near the grain boundaries, indicating shear bands substructure and α'-martensite island, characteristic substructure of a complex system of the intersection of α′ at shear bands.Figure 6(e) illustrates some dense dislocation walls developed in the ferrite.
The SADP, Figure 6c, exhibited spots displaced from their original position, which is characteristic of a non-diffusional phase transformation, that is, a transformation that occurred by shear [4]. The shear bands are sites of deformation inclined approximately at 35° from the rolling direction. The intersections of these heterogeneity deformations, intersections of the stacking faults and mechanical twins are sites for the developing of SIM embryos [4]. In a study executed by Liu et al. [21] it was reported the formation of the α'-martensite in isolated shear band on a 2101 DSS after the tensile test at −30°C. Also, in their study was mentioned that the martensitic transformation in the 2101 DSS begins initially at the phase boundary between the γ and α. TEM characterisation was evidenced the α'-martensite formed near grain boundaries and intersections of shear bands in Figure 6. The similar structure was found by other authors and identified as α'-martensite [22,23].
Microstructural characterisation by EBSD
Figures 7 and 8 depicted the KAM maps of the samples as-received, cold rolled 60% and annealed at 600°C, 700°C, 800°C and 900°C for 1800 s. The misorientation (KAM) in each phase can be related to cold rolling stored energy. KAM quantifies the average misorientation around a measurement point with respect to a defined set of nearest [24]. KAM was calculated up to the first neighbour with a maximum misorientation angle of 5°. Figure 7(a–d) depicted the as-received sample. It reveals that austenite and ferrite contain grains almost in their entirety with KAM between 0° and 1°. Figure 8 is relative to the cold-rolled sample and annealed samples. At 600°C, more than 70% of the austenite presents the KAM between 4 and 5. The ferrite presents about 47% of KAM between 4 and 5, and about 20% of the ferrite with KAM varies from 0 to 2. This result shows that after cold rolling, the austenite concentrated more strain than ferrite.
EBSD mapping images of LDSS sample as-received condition (a) IPF, (b) IQ, (c) phase map, (d) kernel map and (e) phase volume fraction and IPF legend. IQ + phase map and kernel maps of the specimen cold rolled to 60% and annealed at 600°C, 700°C, 800°C and 900°C for 1800 s.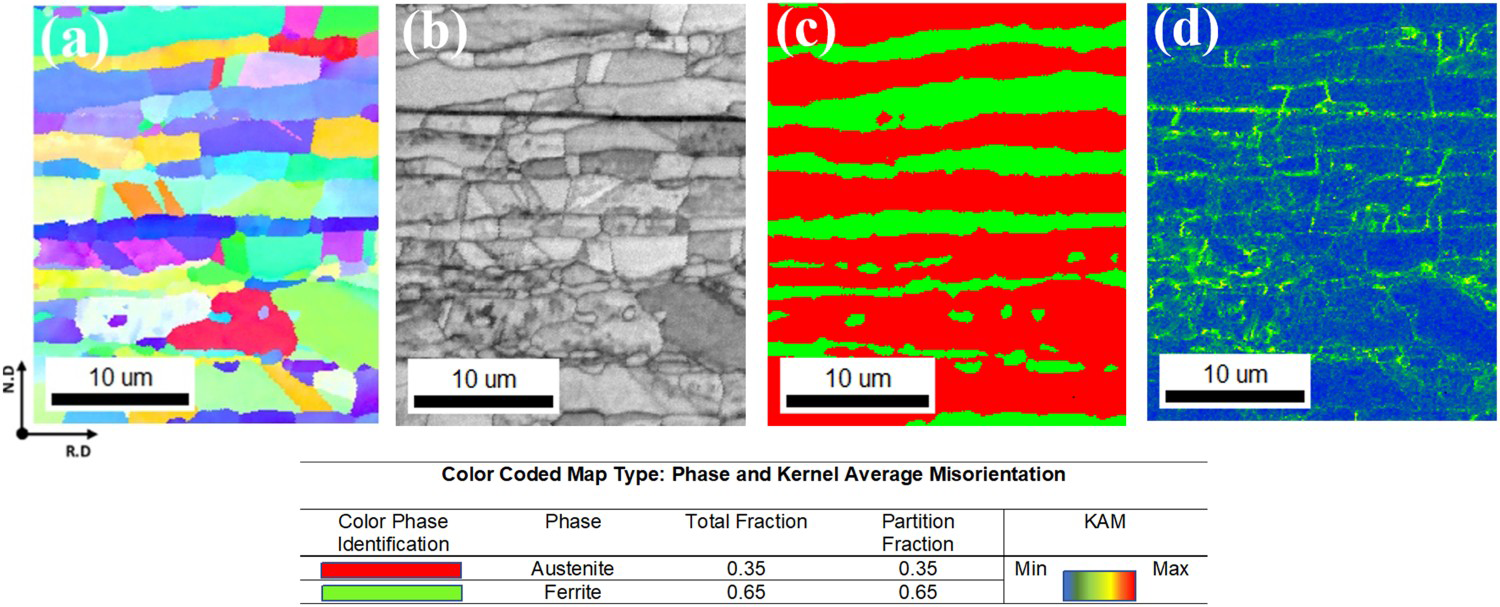
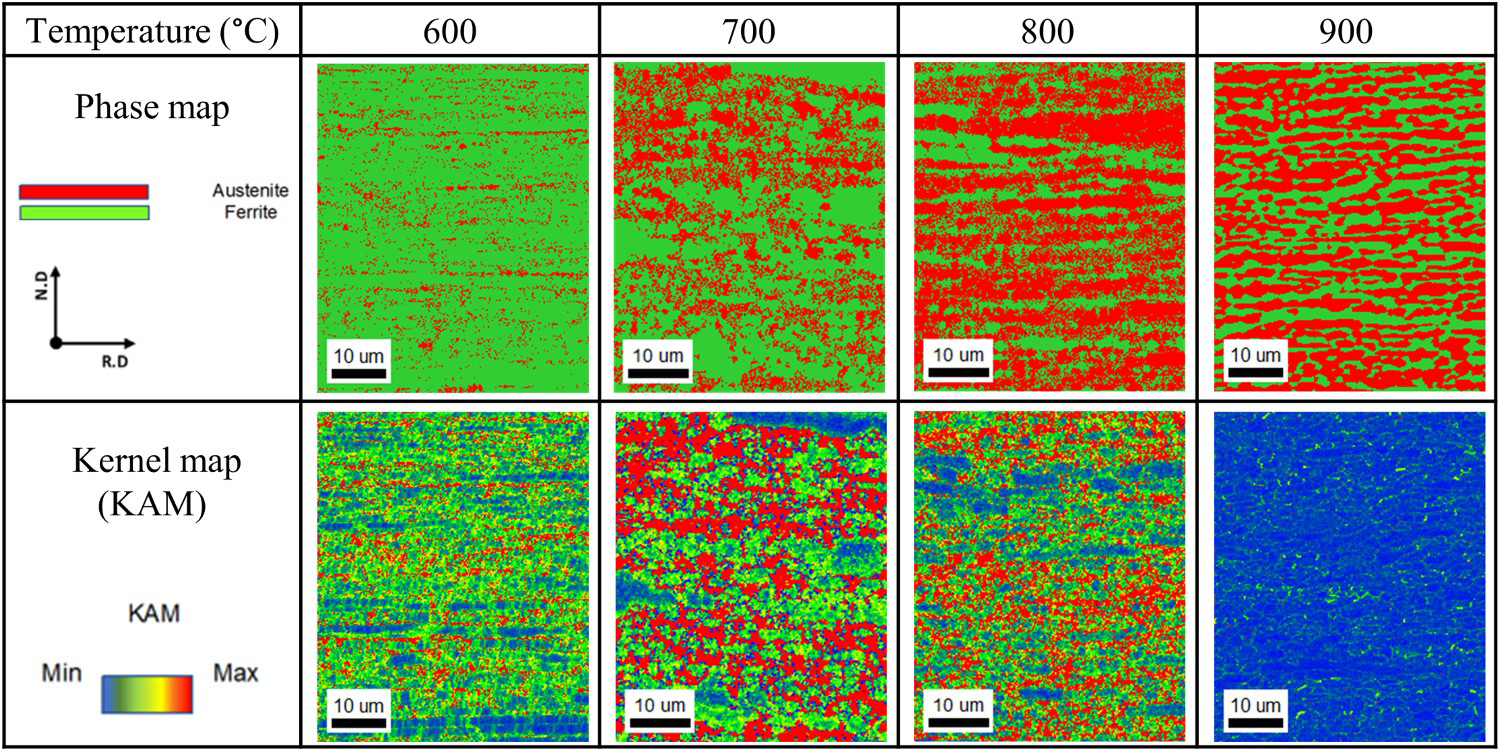
For both recovery and recrystallisation, the lower stored energy during cold working within the ferrite phase was overcompensated by the higher diffusivity and dislocation mobility in the bcc lattice, resulting in an overall recrystallisation process faster in ferrite of the samples annealed at 700°C. Annealing at 800°C, blue regions are also observed, these areas correspond to ferrite recrystallised grains and reversed austenite, together with some recrystallised austenite. Finally, for annealing (Figure 8) at 900°C, KAM map became blue and green, that is, there was no more martensite, and the microstructure is now in recrystallised condition. Some recovered regions still present because of the green areas on the KAM map for the sample annealed at 900°C, this situation is like as-received sample but with much smaller grains.
The misorientation determined by KAM can be related to SIM, since a high density of dislocations, characteristic of SIM, causes a high value of KAM [25]. The KAM relative to the sample of the initial condition, Figure 7a–d, presented low values, concentrating between 0 and 1. This behaviour is characteristic of samples that were not submitted to mechanical deformation. The austenite showed KAM value greater than the ferrite after deformation (Figure 8). It can be inferred that in some regions, not continuous, in the lamellae should have occurred SIMT. Notably regions of high KAM values, 4 and 5, were identified in both austenite and ferrite maps (Figure 8). This behaviour is explained by the low indexing of the image obtained by EBSD after cold rolling. The deformation and high density of dislocations result in poor quality of Kikuchi patterns directly affecting the indexing process in EBSD image formation.
Electrochemical tests
Cyclic potentiodynamic polarisation
Figure 9 shows representative CPP curves obtained for the 2304 DSS samples of the material as-received, cold rolled to 60%, and annealed at 600°C, 700°C, 800°C and 900°C for 1800 s at 22 ± 2°C. All five conditions exhibited spontaneous passivity in 3.5% NaCl test solution. The passive current density increased with increasing potential for the heat-treated samples but remained on the order of 10−6 A cm–2.
CPP Typical CPP curves obtained representatives curves obtained on the samples: as-received, cold rolled 60% and annealed after cold rolling at 600°C, 700°C, 800°C and 900°C, in a solution containing 3.5 wt-% NaCl.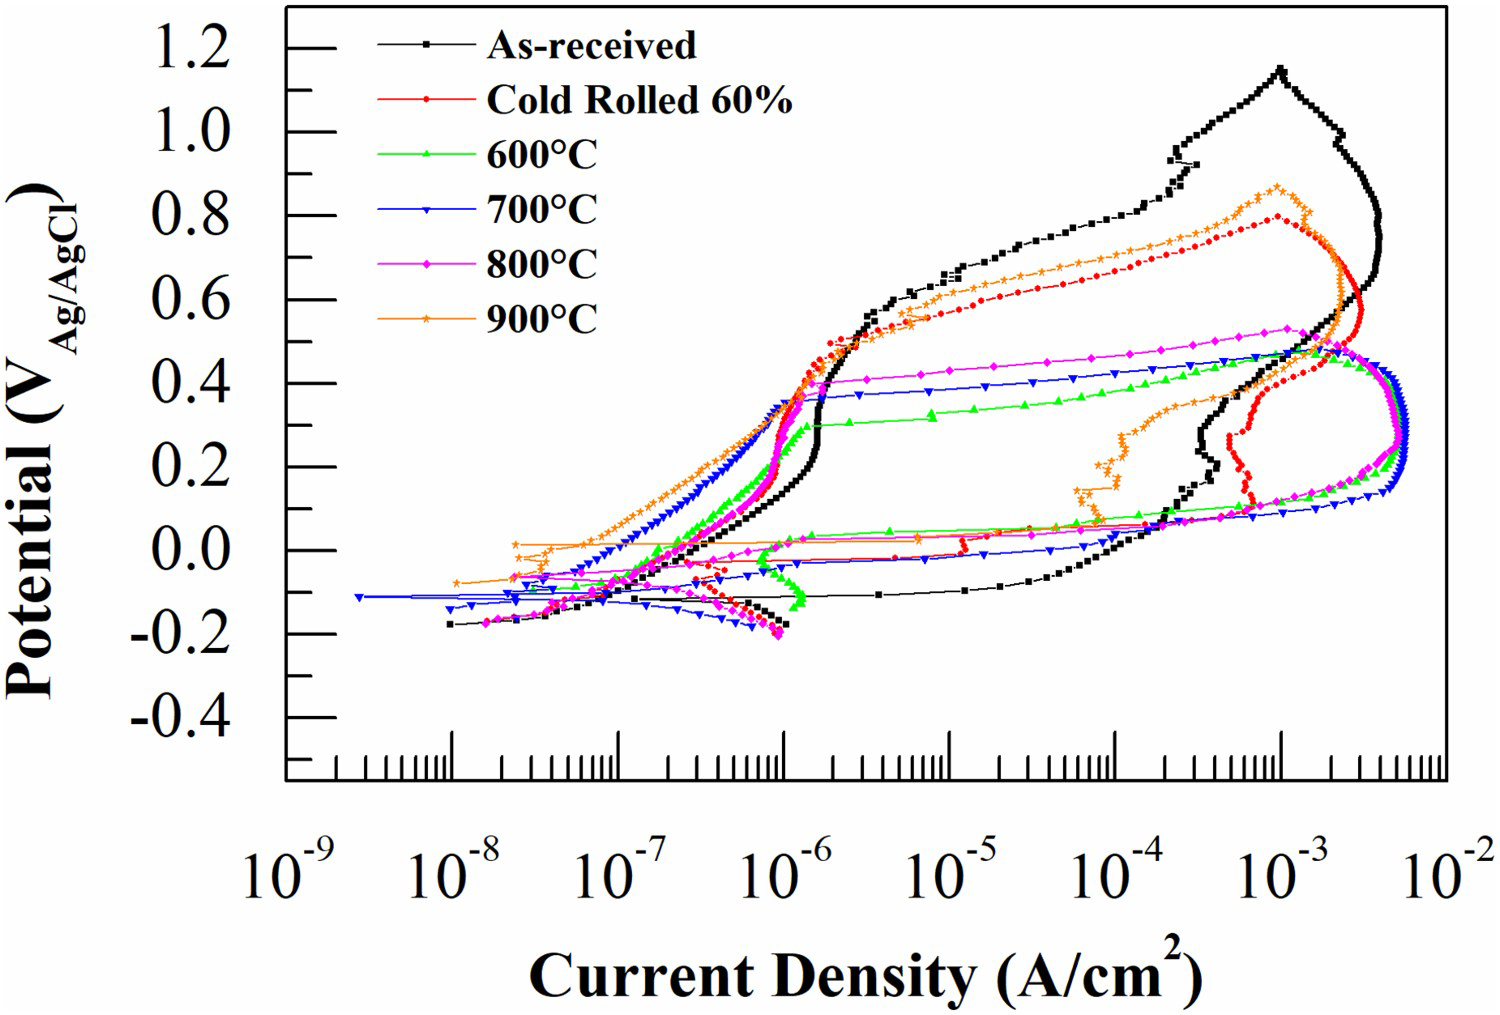
A wide passive region was observed for all samples, suggesting a typical passive behaviour in the solution. Pitting potentials were larger in the 400-700 mV range compared to its corresponding OCP. These observations indicate that the samples showed excellent resistance to the onset of pitting corrosion in this chloride environment. Polarisation displayed for all conditions a positive hysteresis and repassivation potentials close to OCP values in chloride-containing medium for samples annealed at 600°C, 700°C and 800°C. According to Sicupira et al. [26], this indicates that pitting corrosion when initiated, even at potential values close to open circuit potential, can occur for long periods. The reverse scan of the samples AR, CR and annealed at 900°C did not intersect the passive region in the forward scan, but a passive region was still observed after the current drop of repassivation.
An interesting phenomenon was also observed on the as-received, cold rolled 60%, and annealed at 900°C curves during the reverse scan, where two steps of current drop were observed, as indicated by the dashed circle. As stated by Tianshu et al. [27], this phenomenon is related to the repassivation of a relatively small stable pit in the first drop of and the second current drop should be attributed to the repassivation of the largest stable pit. Figure 10 shows pitting corrosion of the as-received sample and stable pitting morphologies of the specimens annealed at 600°C and 900°C. In the as-received sample, pits preferentially occurred in the interface ferrite/austenite and inside the ferrite phase. The distinction between ferrite and austenite was unclear in Figure 10(b,c).
Pitting morphology of the 2304 LDSS specimens: (a) as-received, (b) 600°C and (c) 900°C.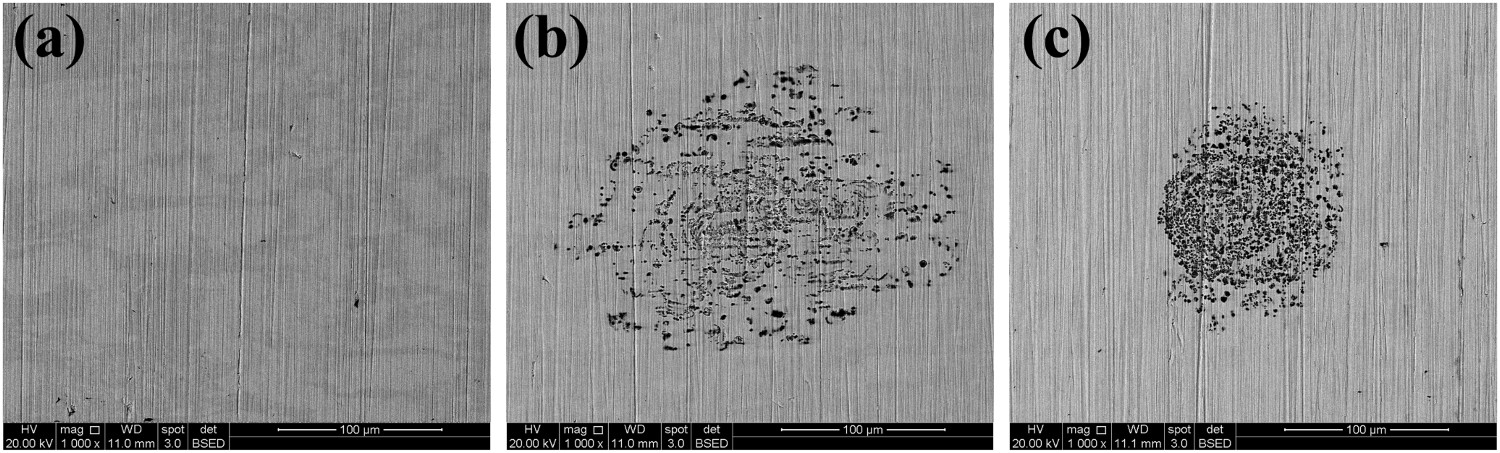
The pitting potential (Epit) of as-received specimens had the highest value at 615 ± 12 mV(Ag/AgCl). There was a clear degradation after cold rolling to 60%, pitting potential dropped to 505 ± 17 mV(Ag/AgCl). After annealing at 600°C and 700°C, there was a significant reduction in pitting potential, as previously seen, at these temperatures SIMRT is not complete. Therefore, the decrease in pitting resistance can be related to the precipitation of deleterious phases during SIMRT. As the annealing temperature increased from 600°C to 700°C, the Epit increased slightly from 315 ± 15 mV(Ag/AgCl) to 340 ± 10 mV(Ag/AgCl). A marked displacement of the pitting potential towards nobler values was observed with the further increase in temperature from 445 ± 33 mV(Ag/AgCl) at 800°C to 515 ± 07 mV at 900°C, which had the best resistance to pitting corrosion between the annealed specimens.
The increase in the pitting potential from 600°C to 800°C can be related to an increase in the austenite volume fraction, as seen in Figure 5. A more detailed examination in Figure 8 indicates that the recovery and recrystallisation phenomena occur early and more intensely in the ferrite regions (blue regions). According to Mondal et al. [28] investigation extensive recovery at 300°C (30-1440 min) did not affect the electrochemical behaviour of cold-rolled super duplex stainless steel, although recrystallisation at 1020°C greatly improves the corrosion resistance. The significant increase in pitting potential at the specimens annealed from 700°C to 800°C can be associated with the reversed austenite and the reduced defect density with increasing temperature (Figure 8). The highest corrosion resistance at 900°C is associated with the recrystallised microstructure and absence of SIM. This result suggests that the increase in reversed austenite and recrystallisation of ferrite and austenite phases enhances the pitting corrosion resistance of the thermomechanical treated 2304 LDSS.
Electrochemical potentiokinetic reactivation via double loop
Figure 11 illustrates DL-EPR curves obtained for specimens as-received, cold rolled 60% and annealed for different temperatures, ranging from 600°C to 900°C. The height of the peak current during reactivation (I r) is significantly smaller than the height of the peak current during activation (I a), resulting in a measurable value of degree pf sensitisation (DOS) for the specimens. From the variation of current density with electrode potential (DL- EPR curve), I r and I a were noted and their percentage ratio (I r/I a × 100) was measured as the degree of sensitisation (DOS). The DL-EPR results are illustrated in Table 2.
Double loop potentiokinetic reactivation curves of the 2304 DSS: (a) as-recieved; (b) cold rolled 60%, (c) 600°C; (d) 700°C; (e) 800°C and (f) 900°C, in 0.5 M H2SO4 + 0.1 M NaCl + 0.002 M KSCN test solution. Data obtained after DL-EPR assays and DOS calculation.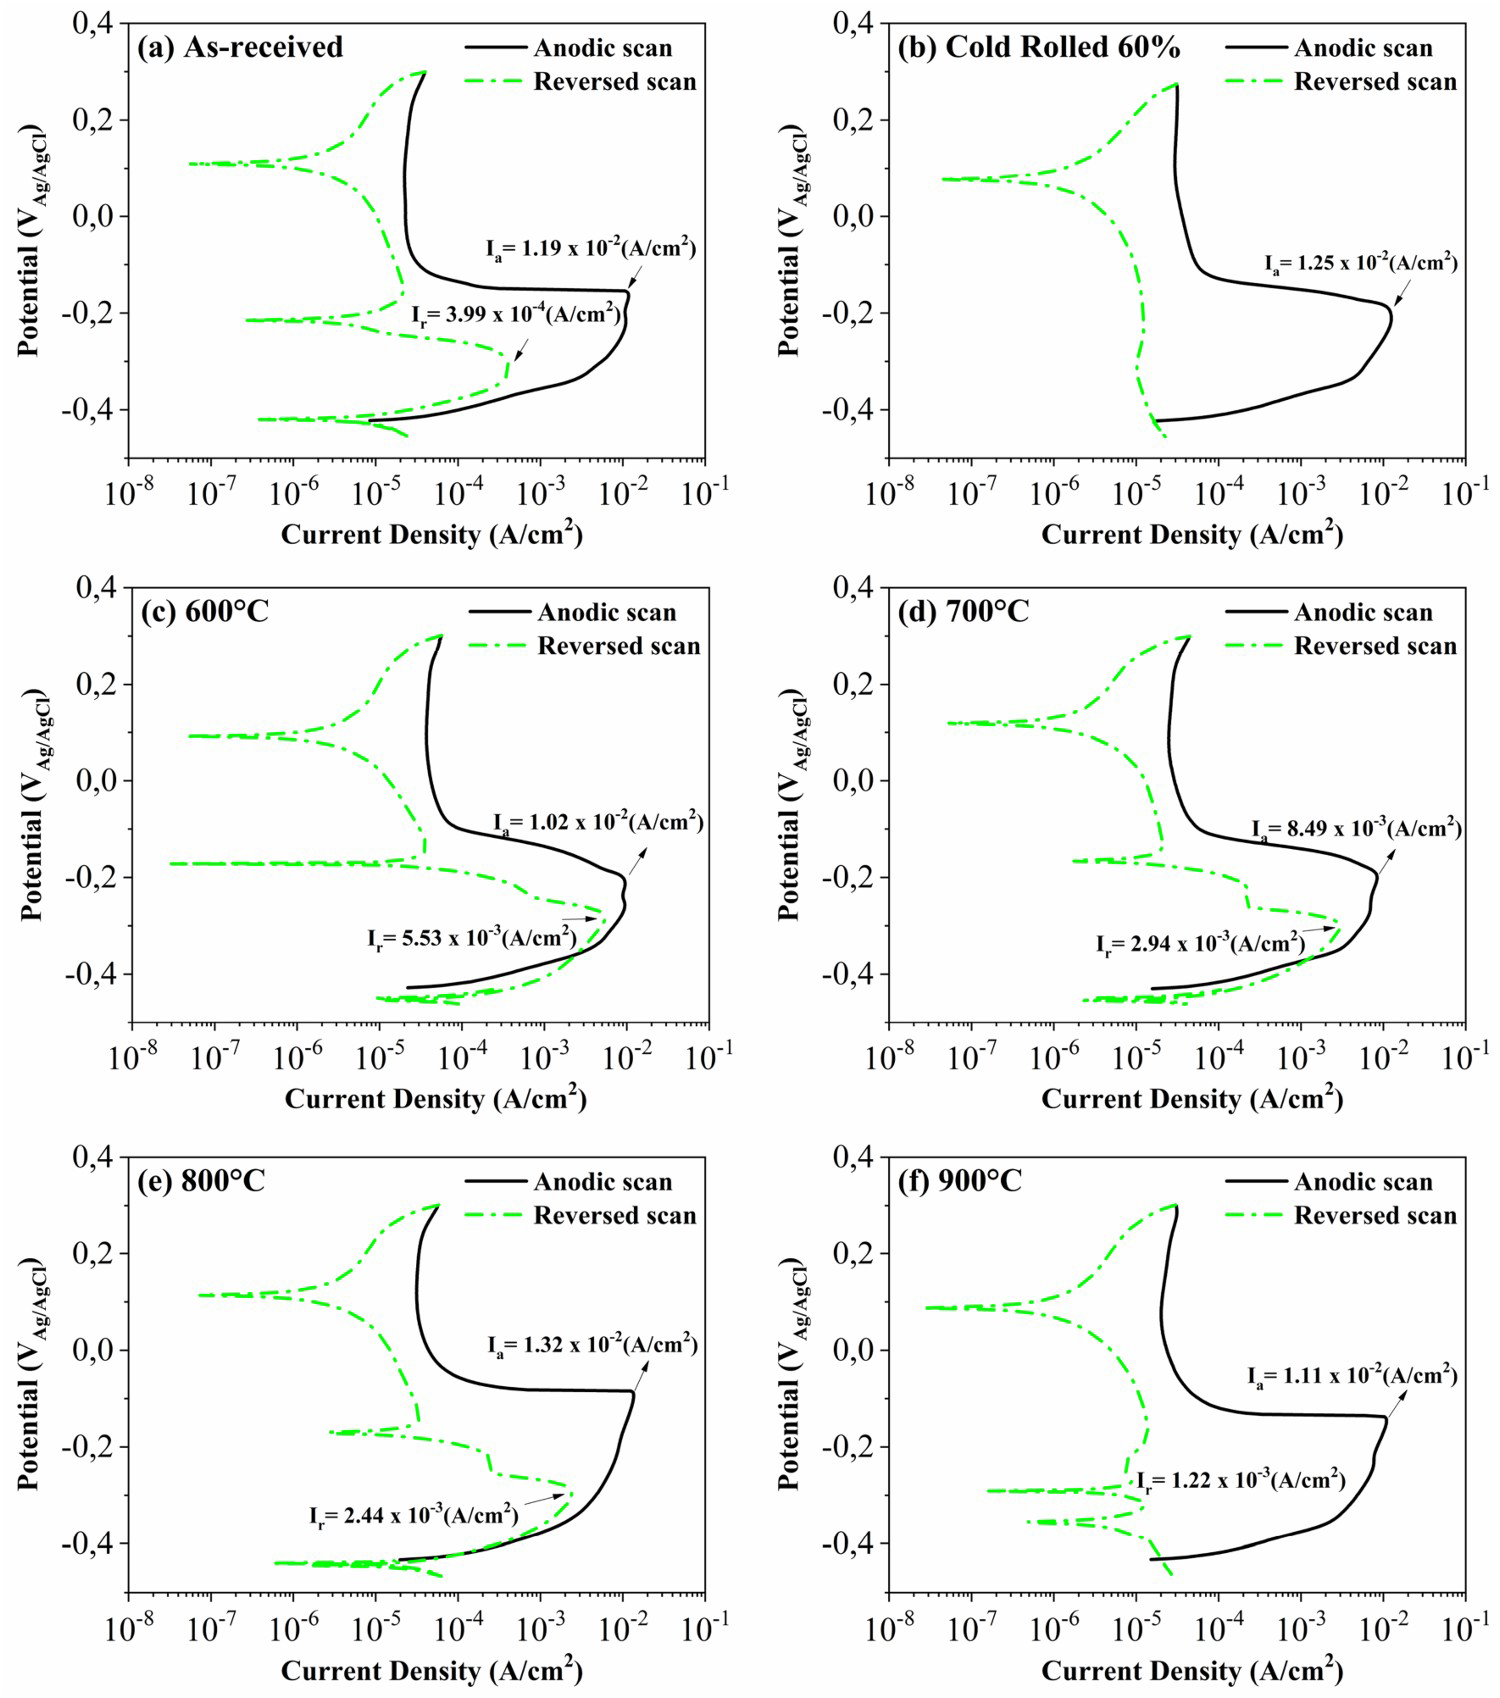
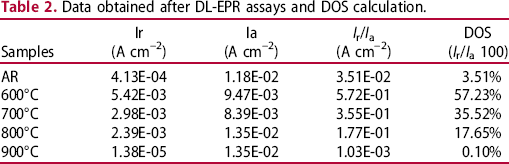
As can be observed in Table 2, there is no significant change in the passive current densities due to thermomechanical treatment, which indicates that the global distribution of alloying elements did not change. Additionally, the anodic current density was maintained between −0.1 mV(Ag/AgCl) and +0.3 mV(Ag/AgCl) potentials, indicating that all samples had a wide passivity range, as stated by Hong et al. [29]. A second current density peak is observed during the activation of samples at a potential close to −0.25 mV(Ag/AgCl). The literature relates the lowest potential peak with the ferrite phase and the highest potential peak with the austenite phase, to the distinct electrochemical behaviour of these phases [30]. It is worthwhile to note that two reactivation current peak values are observed for the sensitised samples annealed at 600°C, 700°C and 800°C. According to Ortiz et al. [31], the smallest peak is associated with pitting corrosion and the largest peak to intergranular corrosion. Zhou et al. [11] stated that the first reactivation peak is related to the dissolution of Cr-depleted zones near precipitates at grain boundaries and the second is attributed to the replenishment of Cr-depleted zones near the precipitates in martensite during the reverse transformation.
The first reactivation current in the reverse scan, which is generally related to the preferential breakdown of the passive film covering the chromium-depleted region, was detected in the as-received sample, leading to a trivial sensitisation as verified by a low DOS value (∼3%) as shown in Table 2. Remarkably, the reactivation current density peak was absent from cold rolled sample. The reactivation current density and the resulting degree of sensitisation rise sharply after annealing at 600°C. The high dislocation density could provide several favourable sites for precipitation nucleation, the presence of shear bands and α'-martensite, as observed, respectively, in Figure 3 and 6, as well as the increasing dislocation density would promote the nucleation and growth of secondary phases, leading the precipitation along the grain boundaries and the formation of Cr-depleted zone. The decrease in DOS with increased annealing temperature and finally the drop of the sensitisation at 900°C (Table 2) is due healing of Cr-depleted zones.
The self-healing is effectively accelerated by cold rolling, which can be interpreted by more diffusion paths in the cold rolled materials for quicker Cr diffusion from the matrix to Cr-depletion zones. However, secondary phase precipitation can also be accelerated by cold rolling. Jinlong et al. [12] studies demonstrate with austenitic stainless steel that high dislocation density could provide several favourable sites for carbide nucleation. Nonetheless, the self-healing process exceeded sensitisation process at the annealed temperatures for the 2304 LDSS in this present investigation. Therefore, the DOS decreased with increasing sensitisation time at this temperature. Similar results were reported by Zanotto et al [30] during the annealing of an as-supplied LDX 2101 annealed at 650-850°C for 60 min led to decrease in DOS, due to the redistribution of chromium toward the depleted zones.
As annealing temperature increases, reversed martensite increases. Man et al. [6] demonstrate the reversed austenite tends to nucleate at the Cr-depleted regions that are enriched with the austenite-stabilised element Ni and distributes along the grain boundaries. This phenomenon confirms that the formation of reversed austenite can reduce the nucleation of intergranular corrosion by eliminating the Cr-depleted region. Compared with bulk chromium diffusion, self-healing process of reversed austenite can occur at lower temperature and a shorter time.
Moreover, grain refining after cold working and annealing also plays an important role in self-healing. According to Mondal et al. [6] increased grain boundary density is expected to promote the diffusion of Cr bulk diffusion, thereby leading to the formation of stable passive film. After SIMT the driving force of the phase transformation is much larger than that of recrystallisation, it is easier to nucleate. The grain size of austenite obtained by reverse transformation is smaller than those obtained by recrystallisation. Therefore, the availability of easy paths for Cr diffusion after intense grain refining by recrystallisation after cold deformation and due to nucleation of reversed austenite can result in quicker healing.
Figure 12 illustrates the microstructure of the LDSS 2304 after etching with oxalic acid 15% solution at 15 V for 10 s. These micrographs are important for characterising the steel condition in terms of substructure deformation features and precipitation. This electrolytic attack enables selective etching of Cr-rich phases and delineation of ferrite and austenite phases [32].
Samples of the LDSS 2304 (a) as-received; cold rolled 60% and annealed at: (b) 600°C, (c) 700°C, (d) 800°C and (e) 900°C for 1800 s. Etched with oxalic acid 15% solution at 15 V(cc) for 10 s.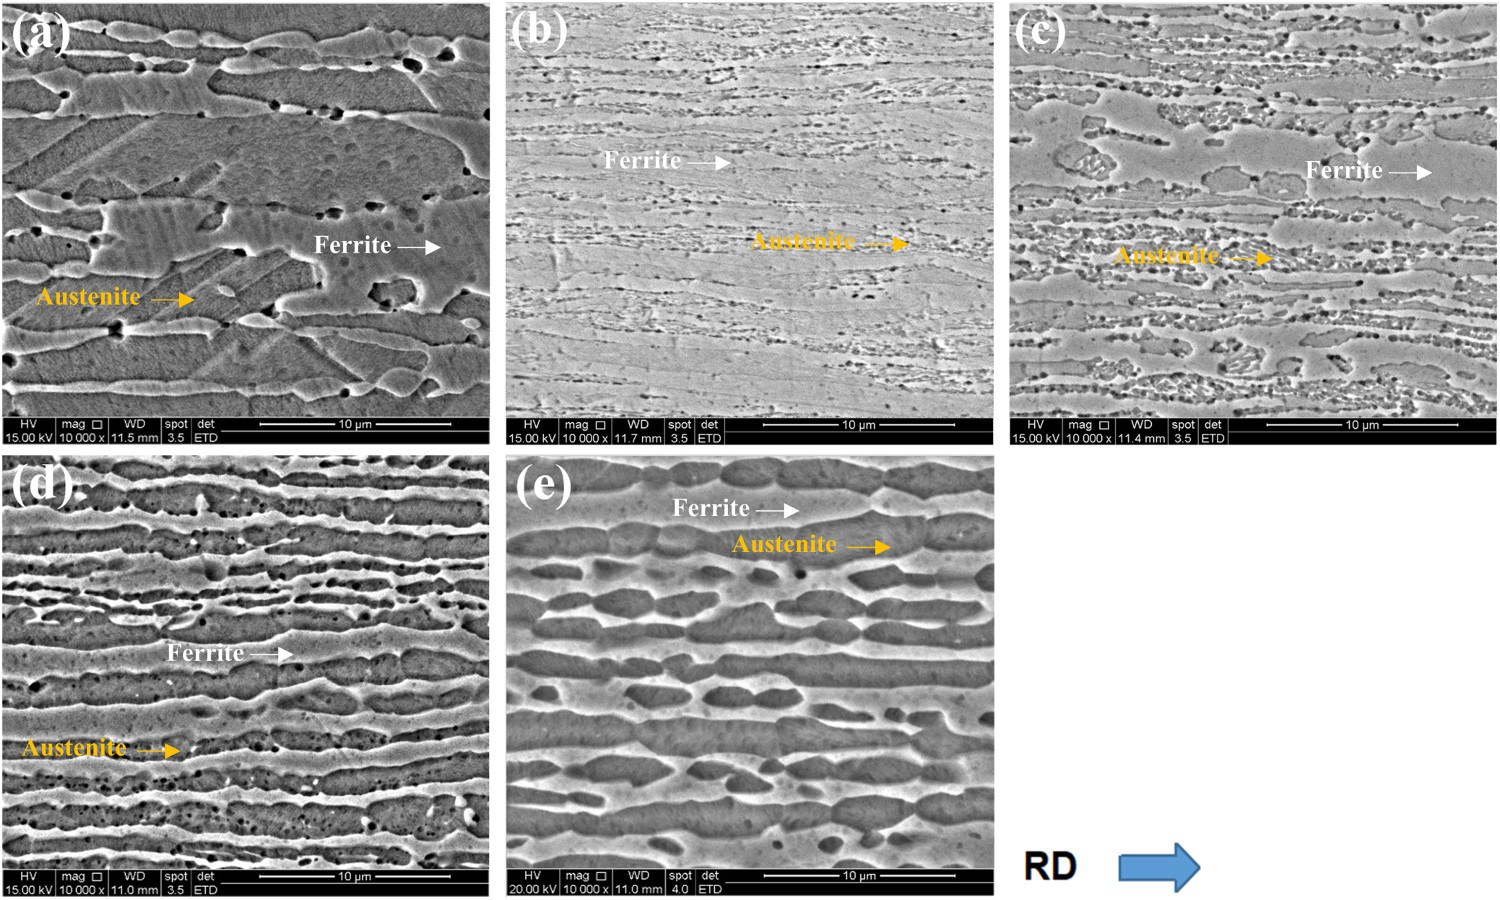
Figure 12(a) shows the detection of Cr-depleted zones at the ferrite-austenite interface, annealing twins and triple points after oxalic acid etch, as shown, which indicate the formation of Cr-rich precipitates depleted the vicinity in Cr during their formation. After oxalic acid etch of the sample annealed at 600°C and 700°C, selective corrosion occurred consuming almost all austenitic lamellae, as can be seen in Figure 12 (b, c). Localised Cr-dissolution was still present at the ferrite/austenite interface, yet severe corrosion took place inside the austenite lamellae, leaving some austenite regions not attacked. These regions are believed to be austenite that did not transform into α'-martensite or α'-martensite that did not revert to austenite at this temperature. These features were not observed at 800°C in which the reverse transformation was in an advanced stage.
At 800°C (Figure 12d) the Cr-dissolution took place inside the austenite grains and at the austenite/ferrite interface. According to Kauss et al. [3], slower diffusion rates of C and N in the austenite compared to ferrite prevent precipitation at the austenite-austenite grain boundaries. The observed pits inside the austenite lamellae support the idea that Cr-rich precipitates nucleated due to martensite reversion. Furthermore, shear bands inside austenite lamellae also could act as a precipitation nucleation site. Briant and Ritter [10] study indicated that SIMRT leads to intergranular and transgranular corrosion, nonetheless, after annealing the specimens without SIM formation, only intergranular corrosion was observed. Therefore, the transgranular corrosion was associated with intergranular precipitation after SIMRT. After the recrystallisation of both ferrite and austenite phases at 900°C (Figure 8), the alloy was not sensitised, and no Cr-dissolution was observed (Figure 12e).
The DL-EPR test results showed the same trend as the results obtained in the cyclic polarisation tests and agrees with microstructural observations after oxalic acid etch. In summary, deformation will lead to changes in microstructural properties, and sensitisation is a diffusion-assisted process. Sensitisation after cold rolling is influenced by aging temperature and time, as well as other factors, such as strain level, α'-martensite, recrystallisation and reversed austenite. Ferrite and austenite recrystallisation along with formation of reversed austenite has a beneficial effect on the intergranular corrosion of the LDSS reducing the nucleation sites and preventing the formation of Cr-depleted zones.
Conclusion
The effect of strain-induced martensitic transformation (SIMT) and its reversion (SIMRT) on the microstructure evolution and localised, selective corrosion of 2304 lean duplex stainless steel (LDSS) was investigated and the following conclusions could be withdrawn.
Diffraction analyses show different intensities for austenite and ferrite after cold rolling. This result was associated with SIM formation. A volume fraction of 24% was obtained for α′martensite after 60% cold rolling. After cold working, shear bands have been observed inside austenite lamellae in deformed microstructure. TEM examination revealed that shear band intersections and regions nearby grain boundaries act as nucleation sites for α’-martensite. Areas with high intensity in KAM maps revealed a high volume fraction of cold deformed austenite and ferrite, as well as SIM formation. However, these regions decrease sharply with the increase in annealing temperature, SIMRT. The samples presented a good corrosion resistance localised in an environment containing chloride ions. The hot-rolled sample had the highest E pit. After cold rolling and annealing at 600°C, this potential was significantly reduced due to secondary phase precipitation after SIMTR. The pitting potential increased with increasing annealing temperature, which was attributed to reversed austenite and recrystallisation. No secondary phases were detected by XRD for all conditions. However, the samples as-received and annealed at 600, 700 and 800°C were susceptible to intergranular corrosion in the 0.5 M H2SO4 + 0.1 M NaCl + 0.002 M KSCN solution, indicating the formation of fine precipitations. Increasing reverse annealing temperature decreased DOS value. These experimental results confirmed that the reversed austenite had a favourable effect on the desensitisation of the 2304 LDSS via the following two ways. First, the formation of reversed austenite at the Cr-depleted regions reduced the number of nucleation sites for intergranular corrosion. Second, grain refining after cold work favoured the self-healing process of Cr-depleted areas.
Footnotes
Acknowledgements
The authors are grateful to CAPES-PROEX, FAPEMIG and CNPq for research fellowships made available to students and for their financial support. Thanks are expressed to the UFMG Microscopy Center for providing good scientific support. We also thank the company Aperam South America SA for the supply of duplex stainless steel samples.
Disclosure statement
No potential conflict of interest was reported by the author(s).