






Abstract
In this study, the effects of pre-deformation on mechanical properties and stress corrosion cracking behaviour of 7075 alloy was investigated with SSRT and electrochemical polarization. The 10% pre-deformation substantially improves the SCC resistance of the 7075 alloys. The strain induced dislocations act as diffusion shortcuts and result in enhanced precipitation and early appearance of GBPs in the naturally aged 7075-T3. For artificial aging, pre-deformation causes rapid over-aging as larger precipitates are found in both matrix and GBs of the 7075-T8. The substitution of Cu for Zn in the GBPs and the larger GBPs acting as hydrogen traps are possible explanations for the improved SCC resistance of 7075-T8. Further improvements in SCC resistance can be found in the RRA treated 7075 alloys, while a more ductile behaviour can be seen in the pre-deformed 7075 alloy. Additionally, results of electrochemical testing are in high correlation with the SSRT results.
Keywords
Introduction
7075 Al–Zn–Mg–(Cu) aluminium alloy is widely used in industrial applications due to its high strength-to-weight ratio and toughness achieved by precipitation hardening. However, the high susceptibility of 7075 alloy to SCC at peak aged condition limits the application of 7075 alloy in corrosive environments, and continues to remain a great concern [1 5]. Among various corrosion mechanisms, SCC is particularly hazardous. A typical SCC can be hard to detect from the surface, but the cracks can penetrate deep into the material and cause catastrophic and sudden failures [6]. T7 over-aging and retrogression and re-aging (RRA) treatment [7] was developed subsequently to improve the SCC resistance of 7075 alloy. Even so, the decline in mechanical strength after T7 over-aging and the restriction of RRA treatment to thin component still limit the application advantage of 7075 alloy [1].
The SCC of 7075 alloy has been studied worldwide for decades. Many possible features affecting the SCC behaviour have been discussed, including grain boundary precipitates (GBP) [2,8 15], precipitate free zones (PFZ) [16 18], matrix precipitates [19], dislocations and slip mode [20 22]. In general, the SCC behaviour of 7075 alloy has been found to be closely related with the grain boundary (GB) microstructure. Currently, the most accepted theory of the SCC of 7075 alloy is the combination of anodic dissolution and hydrogen-induced cracking (HIC) [23]. The main role of anodic dissolution is to create surface defects or crack tips, in the meantime, leads to hydrogen discharge from the nearby matrix. The discharged hydrogen is suggested to accumulate at the crack tip and therefore introduces embrittlement which accelerates crack propagation [23].
Literatures have shown that the anodic dissolution of the Mg and Zn rich η phase GBPs is responsible for the continuous dissolution of the GBs of 7075 alloy [2]. The naturally aged 7075-T4 is known to hold high susceptibility to IGSCC, as the susceptibility gradually decreases with increasing artificial aging [1 3]. T7 over-aging treatment sacrifices the material strength by 10-15% for better SCC resistance [24]. The growth in size and spacing of the GBPs and the substitution of Cu for Zn in the GBPs during over-aging have been suggested to hinder the continuous anodic dissolution along the GB [1,2,18,25]. The larger voids created by the dissolution of larger precipitates have also been reported to act as hydrogen traps and reduce the sensitivity of the GB to HIC [21,26,27]. The RRA treatment on the other hand, acquires the overaged GB microstructure via a short period of high temperature (160∼240°C) retrogression treatment followed by re-aging [25,28,29]. RRA treatment requires precise control of temperature and time, and thicker components normally require longer retrogression time at a lower temperature. However, the effectiveness of low temperature retrogression to create overaged GB microstructure is often limited by slower diffusion [25].
A post-quenching pre-deformation process has been shown to create strain-induced dislocations which can act as diffusion shortcuts for the nucleation and growth of the precipitates [30,31]. In previous study, the precipitation of both naturally and artificially aged 6061 alloys was encouraged by the pre-deformation process. Slightly overaged microstructure has been found in the 10% pre-deformed 6061-T8 under the same aging parameters as the peak aged 6061-T6 [31]. Pre-deformation process has also been found to cause a dramatic change in the corrosion behaviour of the naturally aged 6061 alloy, turning the deep and localised pitting into general corrosion [31]. Theoretically, the strain-induced dislocations produced by pre-deformation could also act as diffusion shortcuts in 7075 alloy, and may accelerate the over-aging speed during aging and retrogression. In other words, it may be possible to increase the SCC resistance of the artificially aged 7075 alloys by introducing pre-deformation. However, studies in these areas have seldom been seen.
Slow strain rate testing (SSRT) and electrochemical testing are both commonly used methods for evaluating the SCC and IGC susceptibility of various aluminium alloys in corrosive environment. Schnatterer et al. [1] determine the SCC resistance of 7075-T4, 7075 T6 and 7075-T7 in pH3 NaCl solution using SSRT with the strain rate of 4.167 × 10⁻⁷ s−1. Hou et al. [31] studied the IGC susceptibility of 6061 alloy under various heat treatment conditions in de-aerated NaCl solution using potentiostatic polarisation. One major difference between SSRT and electrochemical testing is the involving of a separate electrode. Platinum and graphite are commonly used counter electrodes in an electrochemical cell. The noble and un-consumable counter electrode acts as anode and cathode while the working electrode is under cathodic and anodic reaction, respectively, which allows the corrosion current to travel through the potentiostat for precise measurement. However, according to the literature [23], the occurrence of the SCC of 7075 alloy requires the assist of accumulated hydrogen which comes from the cathodic reaction from the nearby matrix. The involvement of the counter electrode may extract the cathodic reaction and hydrogen away from the 7075 alloy matrix, and turn the stress-related SCC into pure IGC which is only metallurgical related. Unfortunately, little research has been seen in correlating the corrosion behaviour of 7075 alloy under electrochemical testing and SSRT.
In this presented study, the pre-deformation process was introduced into the natural aging, artificial peak aging and low temperature RRA treatments of commercial 7075 alloy. Slow strain rate testing and electrochemical polarisation were employed to investigate the effects of pre-deformation on the mechanical properties and SCC resistance of the differently treated 7075 alloys. TEM observation of the GB area microstructure, SEM fracture surface analysis and Vickers microhardness evaluation were used for material characterisation. The testing results are discussed according to various aspects to provide a clearer view on how the pre-deformation process affects the SCC behaviour of naturally aged, peak aged, and RRA-treated 7075 alloys. Correlations between different corrosion testing methods are also discussed.
Materials and methods
Specimen preparation and heat treatment conditions
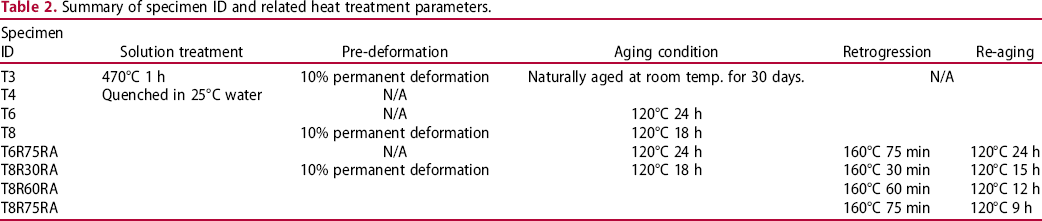
Commercial 7075 alloy bars were received under T6 temper with a diameter of 13 mm. Chemical compositions of 7075 alloy are shown in Table 1. The received bars were first lathed into tensile specimens with dimensions as shown in Figure 1. Solution heat treatment at 470°C for 1 h with 25°C water quenching was carried out for all tensile specimens for experimental consistency. The pre-deformation process was conducted on some as-quenched specimens by stretching them on a tensile testing machine to 10% permanent deformation. Natural aging was then conducted by leaving the specimens in room temperature for 30 days to reach stable hardness. Artificial peak aging was conducted by heat treating the specimens at 120°C for 24 and 18 h for the non-pre-deformed and pre-deformed specimens, respectively. The heat treatment parameters are summarised in Table 2. T3, T4, T6, and T8 are the basic temper designations. T3 and T4 stand for the naturally aged 7075 alloy specimen with and without pre-deformation, respectively. T8 and T6 on the other hand, stand for the artificially peak aged specimen with and without pre-deformation, respectively. RRA treatment consists of retrogress process and re-aging process. The temperature of the artificially peak aged specimens was first raised to 160°C within 10 min in a furnace with heat ventilation, and then retrogressed at 160°C followed by water quenching and re-aging at 120°C. The specimen nomenclature and detailed heat treatment parameters are summarised in Table 2. Vickers microhardness testing was conducted at a load of 9.8 N and the results were used to confirm that suitable peak-aging, retrogression and re-aging parameters were used.
Schematic drawing of specimen preparation of 7075 alloy bar (before pre-deformation). Chemical composition of 7075 alloy applied in this study (wt-%). Summary of specimen ID and related heat treatment parameters.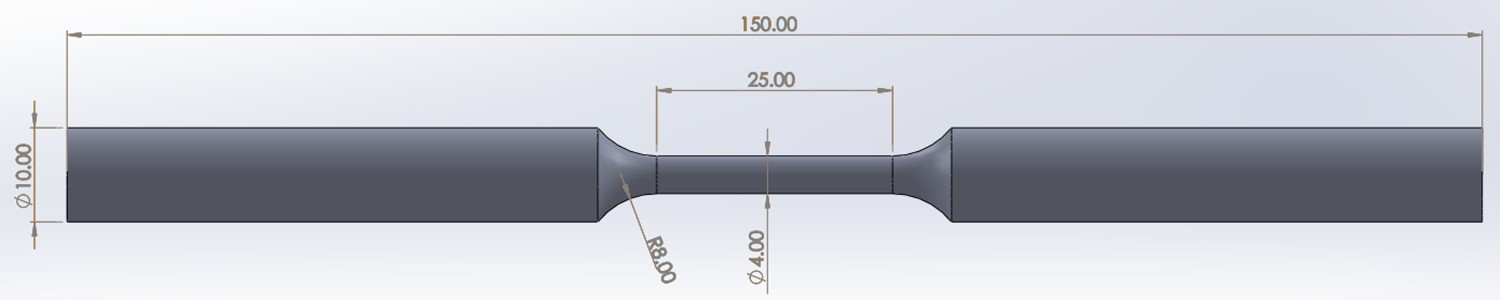

Slow strain rate testing (SSRT)
The dimensions of the lathed SSRT specimen are illustrated in Figure 1. Pre-deformation will cause dimension change in the middle part of the specimen, so the diameter and gauge length were measured for each individual specimen before testing. In general, the diameter/gauge length of the non-pre-deformed and pre-deformed SSRT specimens are 4 mm/25 mm, and 3.85 mm/27.5 mm, respectively. All specimens were polished with SiC papers up to #2000 grit before testing. Tests were performed at room temperature on a tensile testing machine. A PTFE-made corrosion chamber was attached to the specimens during testing so they can be tested in corrosive environments. Specimens with the same heat treatment condition were tensile tested in atmospheric condition and in aqueous solution with 3.5 wt-% NaCl, which was adjusted to pH 1 by adding hydrochloric acid. Displacement control was used in the SSRT and the displacement rate was set at a speed of 0.015 mm min–1 for all tests. The SCC susceptibility index I SCC was determined for strain-to-rupture (STR) using the following equation:

After specimen rupture, the exposed surface was first examined thoroughly for the existence of SCC cracks. The cross-section approximately 5 mm away from the fracture surface was cut and metallographically prepared and observed to evaluate the corrosion propagating mechanism during SSRT. Fracture surfaces were also examined by scanning electron microscopy (SEM). The SSRT was repeated at least three times to ensure reproducibility.
Electrochemical polarisation
Potentiodynamic and potentiostatic polarisation were performed in deaerated 3.5 wt-% NaCl solution on a VersaSTAT4 electrochemical workstation. Testing solution was purged with Ar gas for at least 1 h with a minimum flow rate of 1 L min–1 before testing. An Ag/AgCl reference electrode and a Pt counter electrode were used in a testing cell with working electrode exposure area of 1 cm2. Specimens used in the electrochemical testing are exactly the same dimensions as the SSRT specimens. They were also polished with SiC papers up to #2000 grit, then attached to the testing cell as a working electrode, with only the reduced section exposed to the testing solution. Specimens were then stretched to their maximum elastic stress before testing, and the displacement was held steadily throughout the tests. A 3 min cathodic cleaning at −1.2 V verses RE followed by OCP measurement was done after specimen exposure. As soon as steady OCP value is reached, potentiodynamic polarisation was carried out from 50 mV below OCP to −550 mV vs. RE with a scanning rate of 0.5 mV sec–1. Potentiodynamic polarisation of each specimen was repeated at least twice to ensure experimental consistency.
Potentiostatic polarisation at −725, −700, −675 and −650 mV vs. RE was then performed as accelerated corrosion tests. Specimens were first potentiodynamically scanned to the destined potential with the same parameter as shown above, and then potentiostatically held for 12 h. The output current density during potentiostatic scan was recorded to determine the severity of the corrosion. The cross-sections of the potentiostatically scanned specimens were examined under OM. Potentiostatic polarisation was repeated at least twice to ensure the current transient is reproducible.
Microstructure characterisation
Thin foil TEM specimens of T3, T4, T6, T8, and RRA-treated 7075 alloy specimens were prepared with a diamond cutter and twin-jet-electro-polished at −30°C in a 3:7 solution of nitric acid and methanol. Transmission electron microscopy was performed using JEM 2100 operating at 200 kV. Bright field images of the grain boundary areas of these 7075 alloy specimens were taken up to 1 MX magnification.
Results and discussion
Effects of pre-deformation process on GB and microstructure
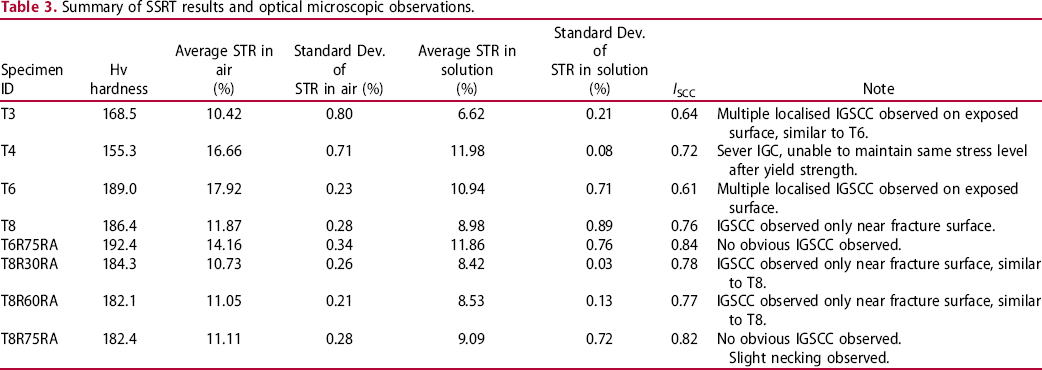
Summary of SSRT results and optical microscopic observations.
Natural aging (T3 and T4)
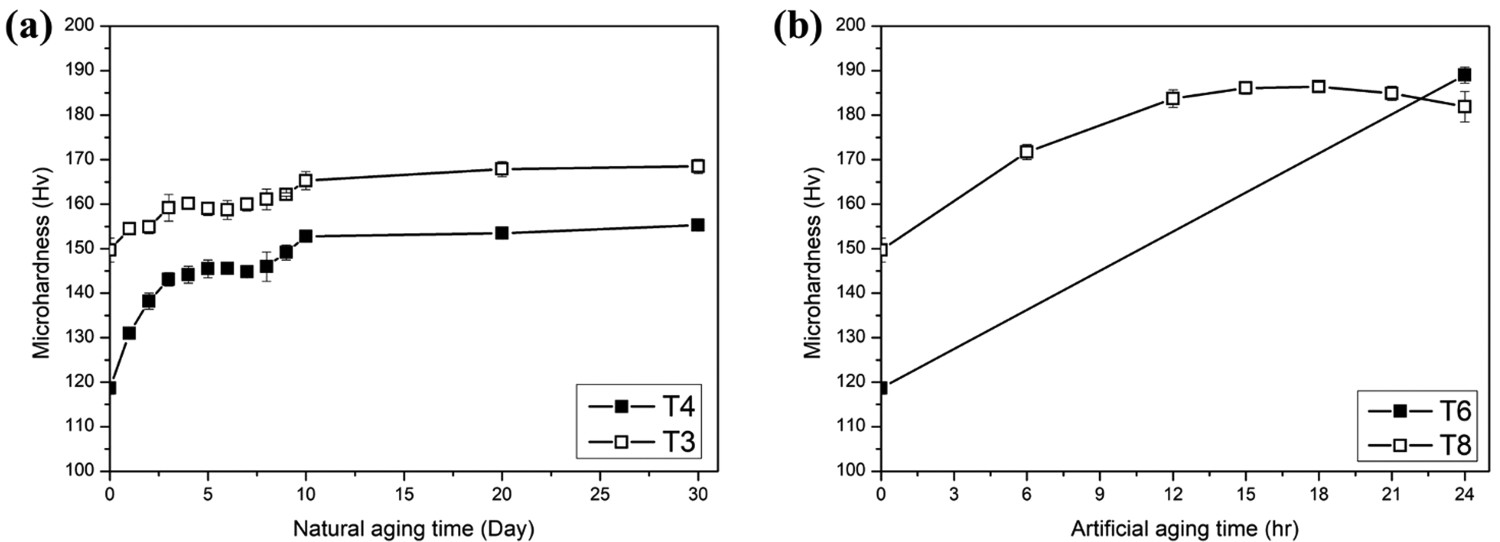
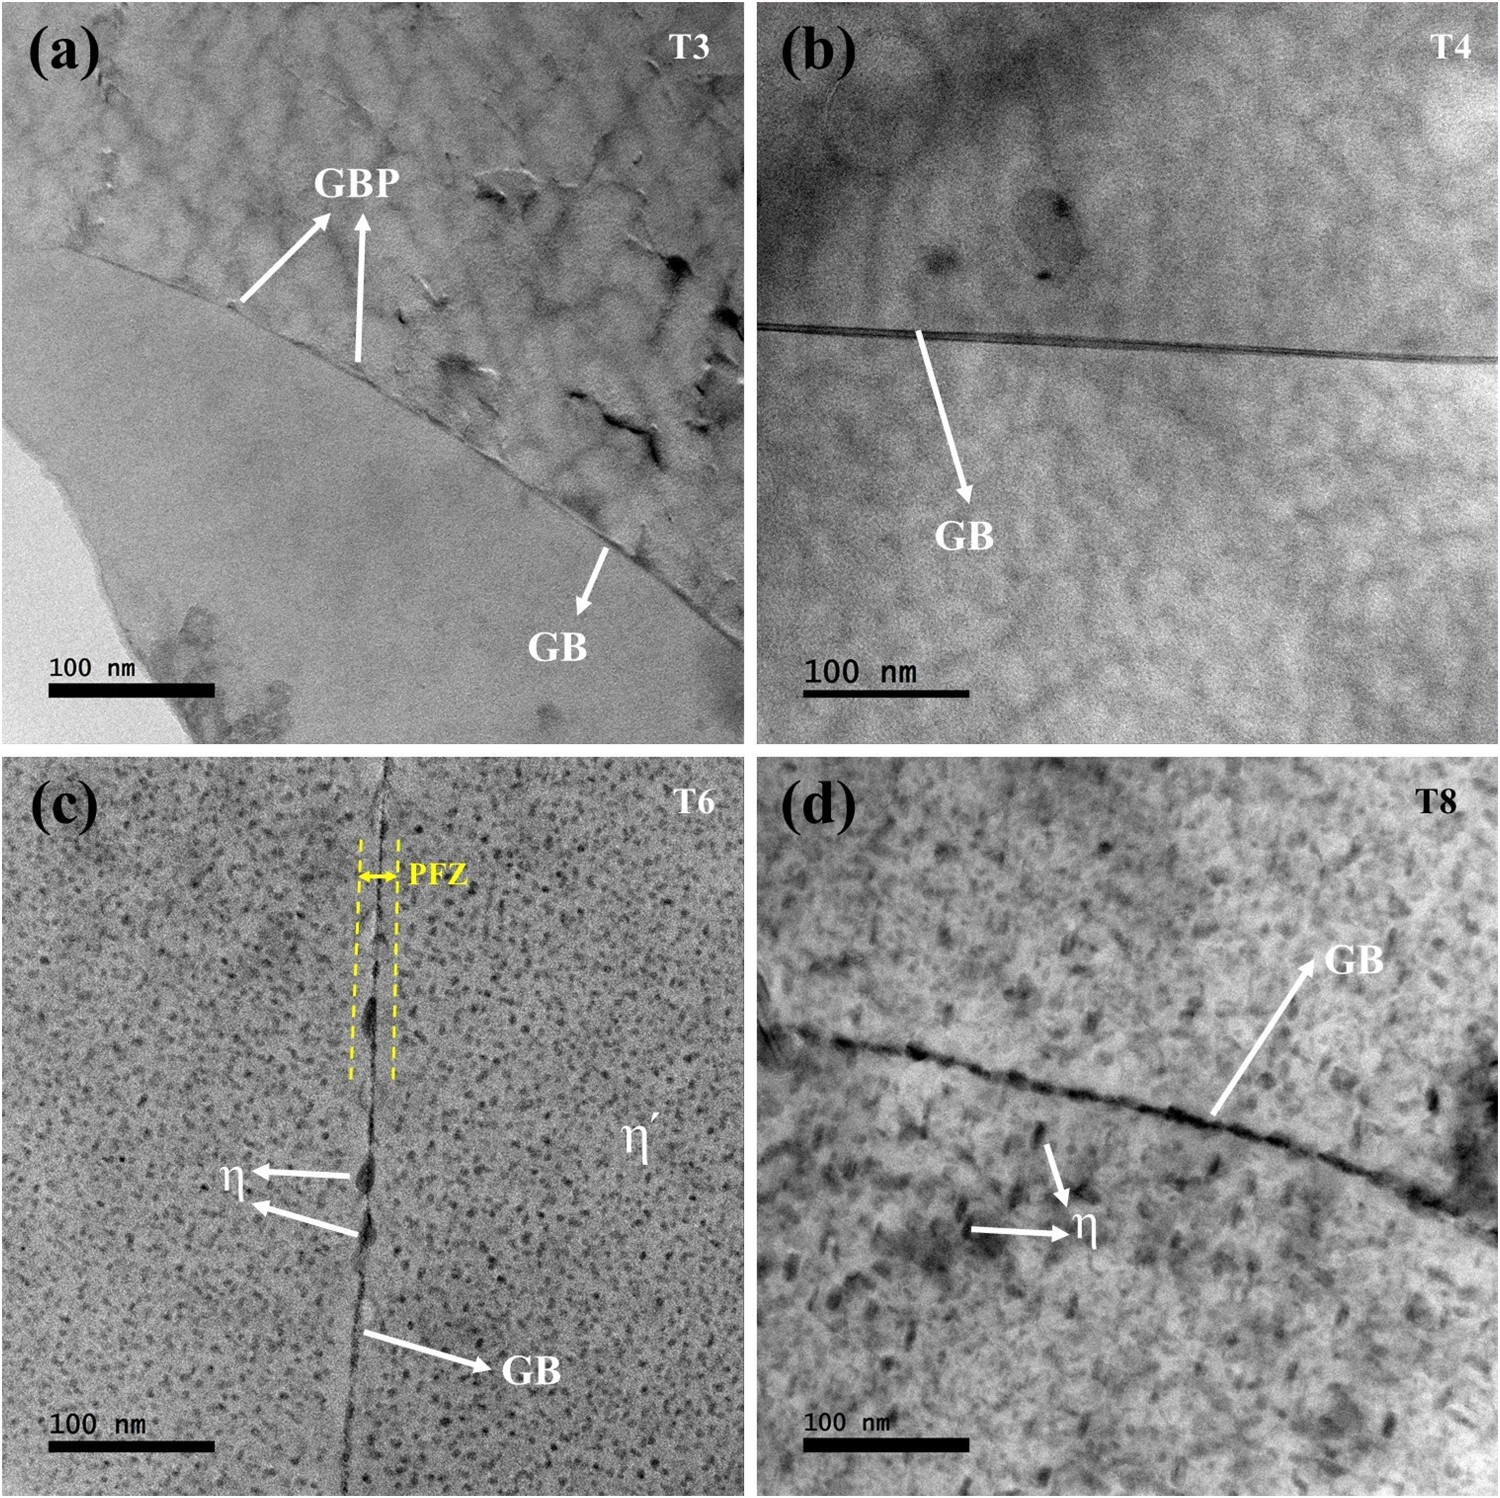
The evolution of microhardness of the T3, T4, T6 and T8 treated 7075 alloy specimens and their final GB microstructure TEM images are presented in Figures 2 and 3, respectively. As shown in Figure 2(a), the 10% pre-deformation raised the as-quenched hardness for approximately 30 Hv. Although the hardness of both T3 and T4 specimens increases gradually during the initial 10 days of natural aging, the difference in hardness between T3 and T4 specimens is reduced to approximately 15 Hv. Slight increase of hardness is still detectable up to one month of natural aging time. The precipitation sequence of Al-Zn-Mg alloy is generally known to be:
Microhardness variations of 7075 alloys under (a) natural aging and (b) artificial aging. Bright field GB area TEM micrographs of 7075 alloys under (a) T3 (b) T4 (c) T6 and (d) T8 temper conditions.
Artificial peak aging (T6 and T8)
For the artificially aged 7075 alloy, the precipitation is significantly quickened by the pre-deformation process. According to Figure 2(b), under the aging temperature of 120°C, the pre-deformed T8 specimen only requires 18 h to reach peak hardness, while 24 h of aging time is normally needed for the T6 specimen. It has been suggested that η′ is the dominant hardening phase in peak aged 7075 alloy, as the equilibrium η phase dominates the overaged 7075 alloy [24]. The image of T6 specimen shown in Figure 3(c) agrees with most literature findings by demonstrating a typical peak aged microstructure, which consists of densely distributed η′ less than 10 nm in diameter and GB η approximately 20 nm in size. A precipitate free zone (PFZ) more than 20 nm in width is also observed. On the other hand, η′ and η precipitate may coexist in the matrix of the T8 specimens. The size of the precipitates is considerably larger than that of the T6 specimen, as shown in Figure 3(d). Similar situation of overaged microstructure existing in the material at peak aged hardness due to pre-deformation has been reported in previous study regarding 6061 alloy [31]. The dislocations introduced by pre-deformation create diffusion shortcuts for the nucleation and growth of more stable precipitates [30,33] and cause rapid over-aging. The maximum hardness values achieved by the T6 and T8 heat treatments also correlate with the microstructural findings, for the peak aged hardness of the T8 specimen being slightly lower than that of the T6 specimen. The GB microstructure of the peak aged 7075 alloy is also strongly affected by pre-deformation. While the GB of the T6 specimen is occupied mostly with small and continuous GBPs with occasionally some bigger and separated η precipitates, the GB of the T8 specimen is decorated with η phases larger in average size and spacing. It is worth noticing that the pre-deformation also decreases the width of PFZ in the peak aged 7075 alloy. The PFZ in the T6 specimen can be clearly observed and the width is approximately 10 nm on each side of the GB, while the PFZ in the T8 specimen is rather vague and difficult to identify.
Retrogression and re-aging (T6RRA and T8RRA)
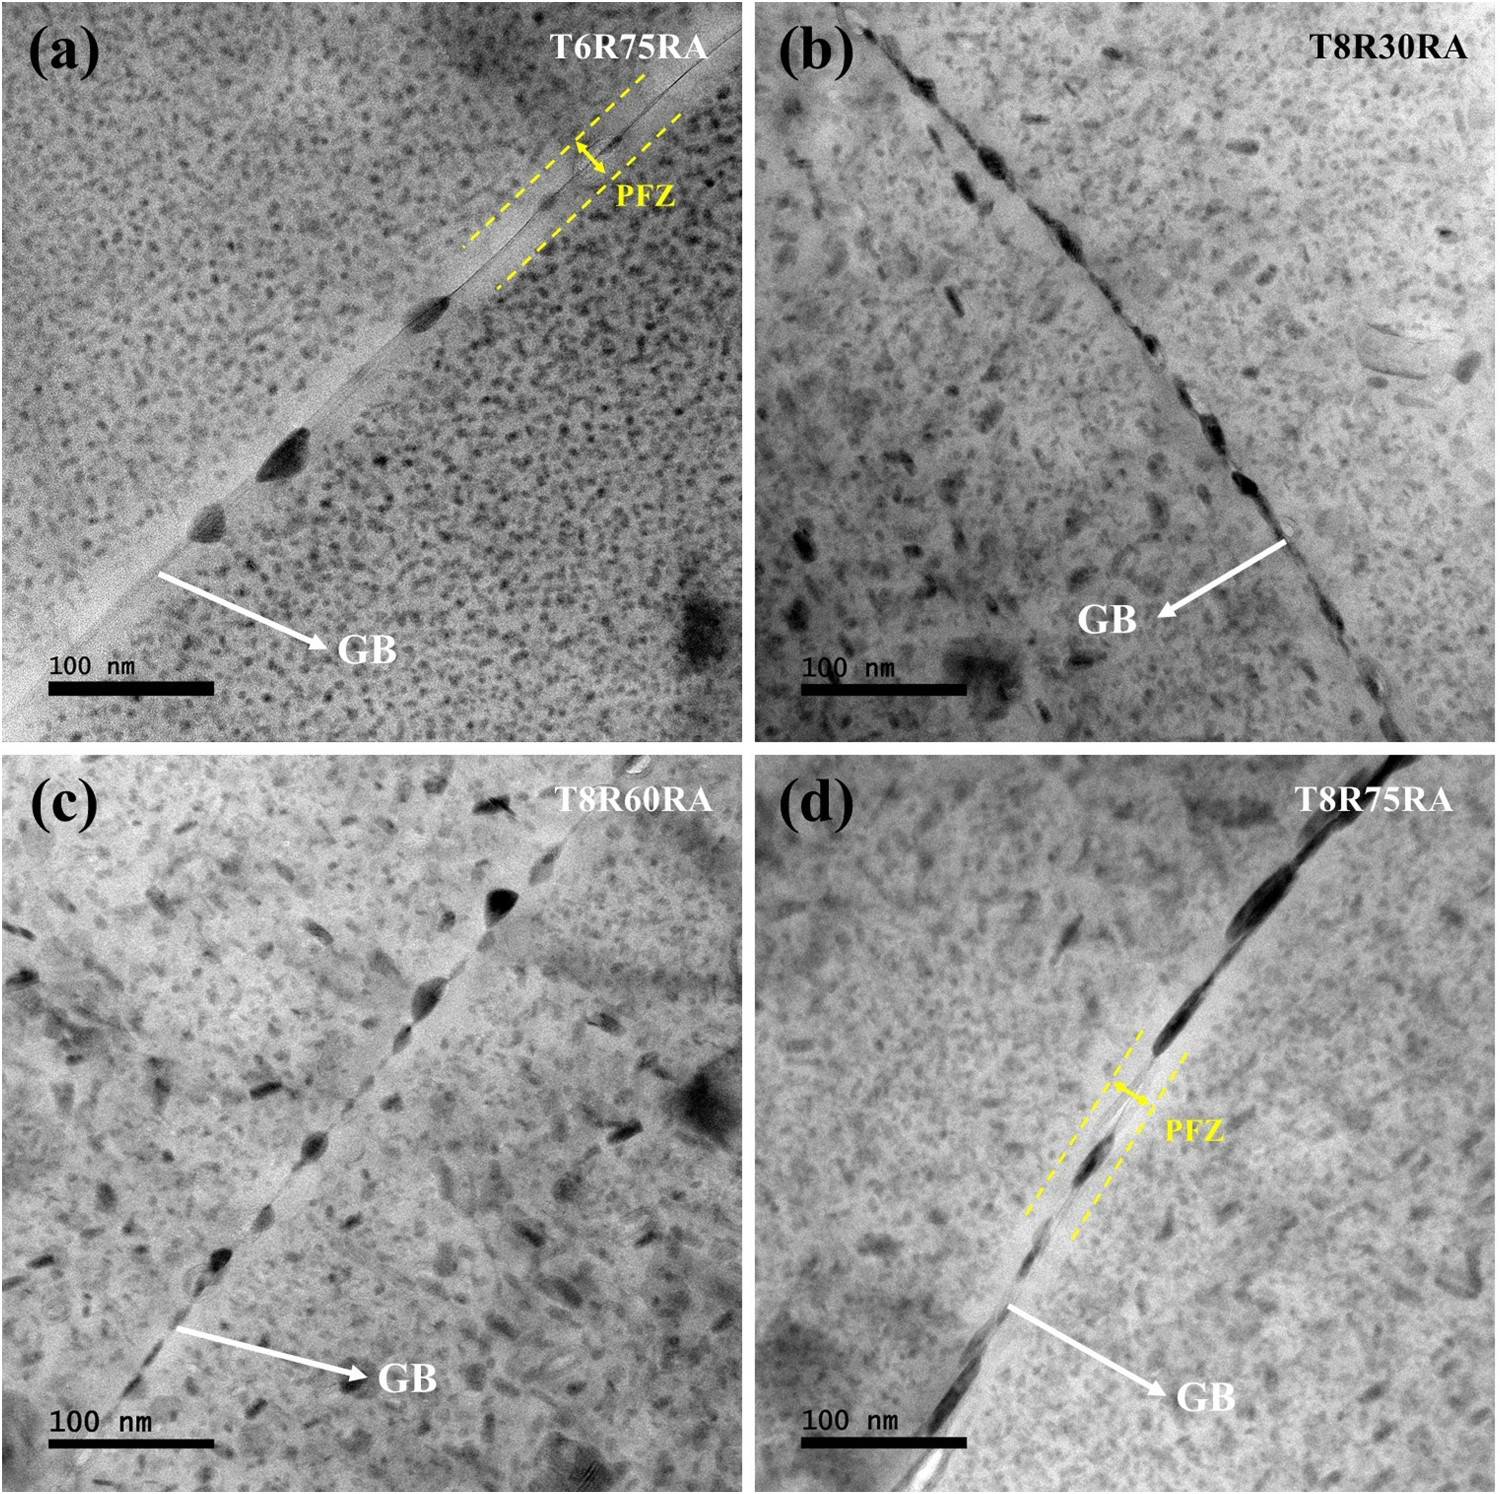
Figures 4 and 5 demonstrate the microhardness evolutions and GB area TEM images of the RRA-treated 7075 alloys, respectively. The 160°C retrogression treatment is subjected to the already artificially peak aged T6 and T8 specimens. During retrogression, the initial drop in hardness is caused by rapid dissolution of metastable precipitates. Meanwhile, the formation of equilibrium η phase then causes slight increase in hardness before complete over-aging takes over. In Figure 4(a), pre-deformation again shows its effect on creating diffusion shortcuts by causing a more noticeable hardness drop in the retrogressed T8 specimen. Ural [34] has suggested two optimised terminal times for retrogression treatment. One is when the lowest hardness value is reached during the initial hardness drop and the other is when the peak hardness is achieved before complete over-aging [34]. Hence, 30, 60 and 75 min of retrogression was tried in this study for the pre-deformed T8 specimen. Figure 4(b) shows the hardness change of the retrogressed specimens during re-aging treatment. The hardness of the retrogressed T6 specimen increases to higher than 190 Hv during the 24-hour re-aging under 120°C. On the other hand, the hardness increase of the retrogressed T8 specimens is less noticeable due to the early appearance of larger and more stable precipitates in the matrix during artificial peak aging before RRA treatment. The stable precipitates are less likely to be dissolved during retrogression, and may even continue to grow larger and consume alloying elements which are intended to be dissolved into the matrix. As a result, the reduction in alloying content limits the hardness increase of the retrogressed T8 specimens during re-aging. The re-aging times required for the 30, 60 and 75 min retrogressed T8 specimens to reach peak hardness are 15, 12 and 9 h, respectively. The decrease in re-aging time for peak hardness with increasing retrogression time can be expected since the consumption of alloying elements will increase under prolonged retrogression. In Figure 5, the matrix precipitates of the RRA-treated T6 and T8 specimens remain similar to their original peak aged condition, while significant changes can be found along the GB after the RRA treatment. Increased precipitate size and spacing compared with those of the T6 specimen as well as clear PFZs can be found in the T6R75RA specimen, as shown in Figure 5(a). The effects of RRA treatment on the pre-deformed 7075 alloy on the other hand, are clearly demonstrated in Figure 5(b–d). As the retrogression time increases, the GBPs gradually grow larger in size and spacing. The width of PFZ also increases with increasing retrogression time. In the end, considering both GB and matrix, the T8R75RA specimen demonstrates the most overaged microstructure.
Microhardness variations of peak aged 7075 alloys during (a) 160°C retrogression and subsequent (b) re-aging treatment. Bright field GB area TEM micrographs of (a) T6R75RA (b) T8R30RA (c) T8R60RA and (d) T8R75RA specimens.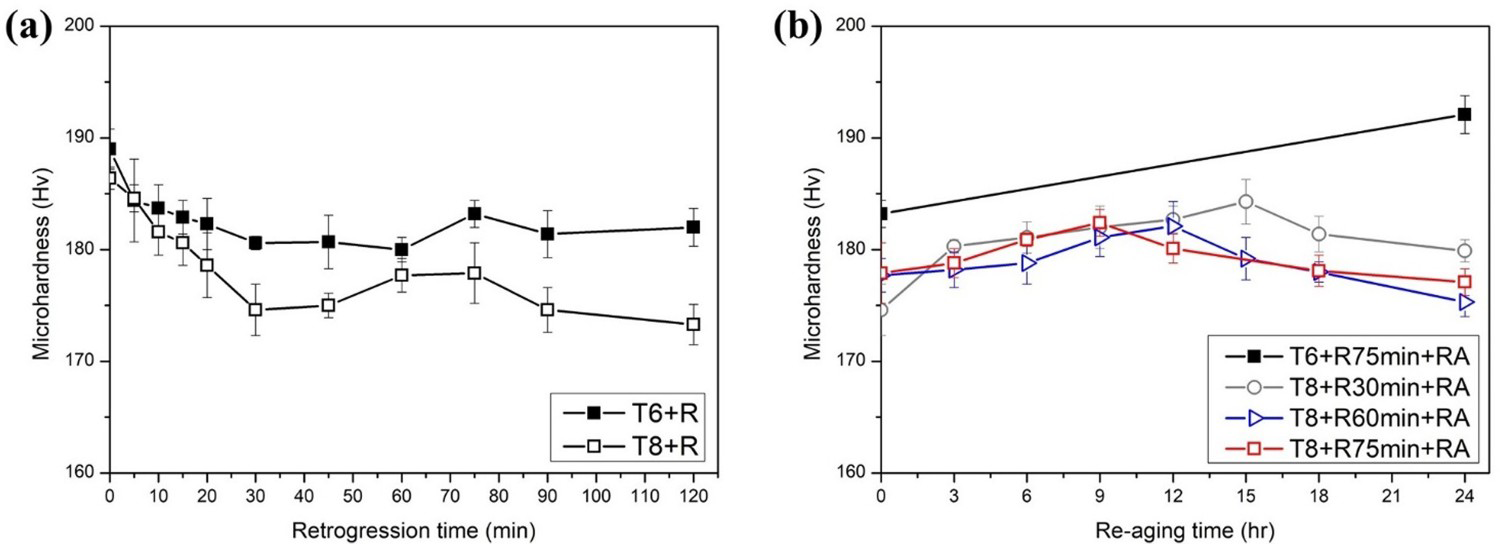
Effects of pre-deformation on SCC behaviour of naturally aged 7075 alloy
Slow strain rate testing requires precise control and coordination between the strain rate and the aggressiveness of the solution, otherwise either pure mechanical fracture or pure corrosion failure will dominate the breakdown of the specimens. The 3.5 wt-% NaCl solution at pH 1 used in this study has been successfully performed in the SSRT of 7150 alloy [15], and the displacement rate was set based on several experimental attempts.
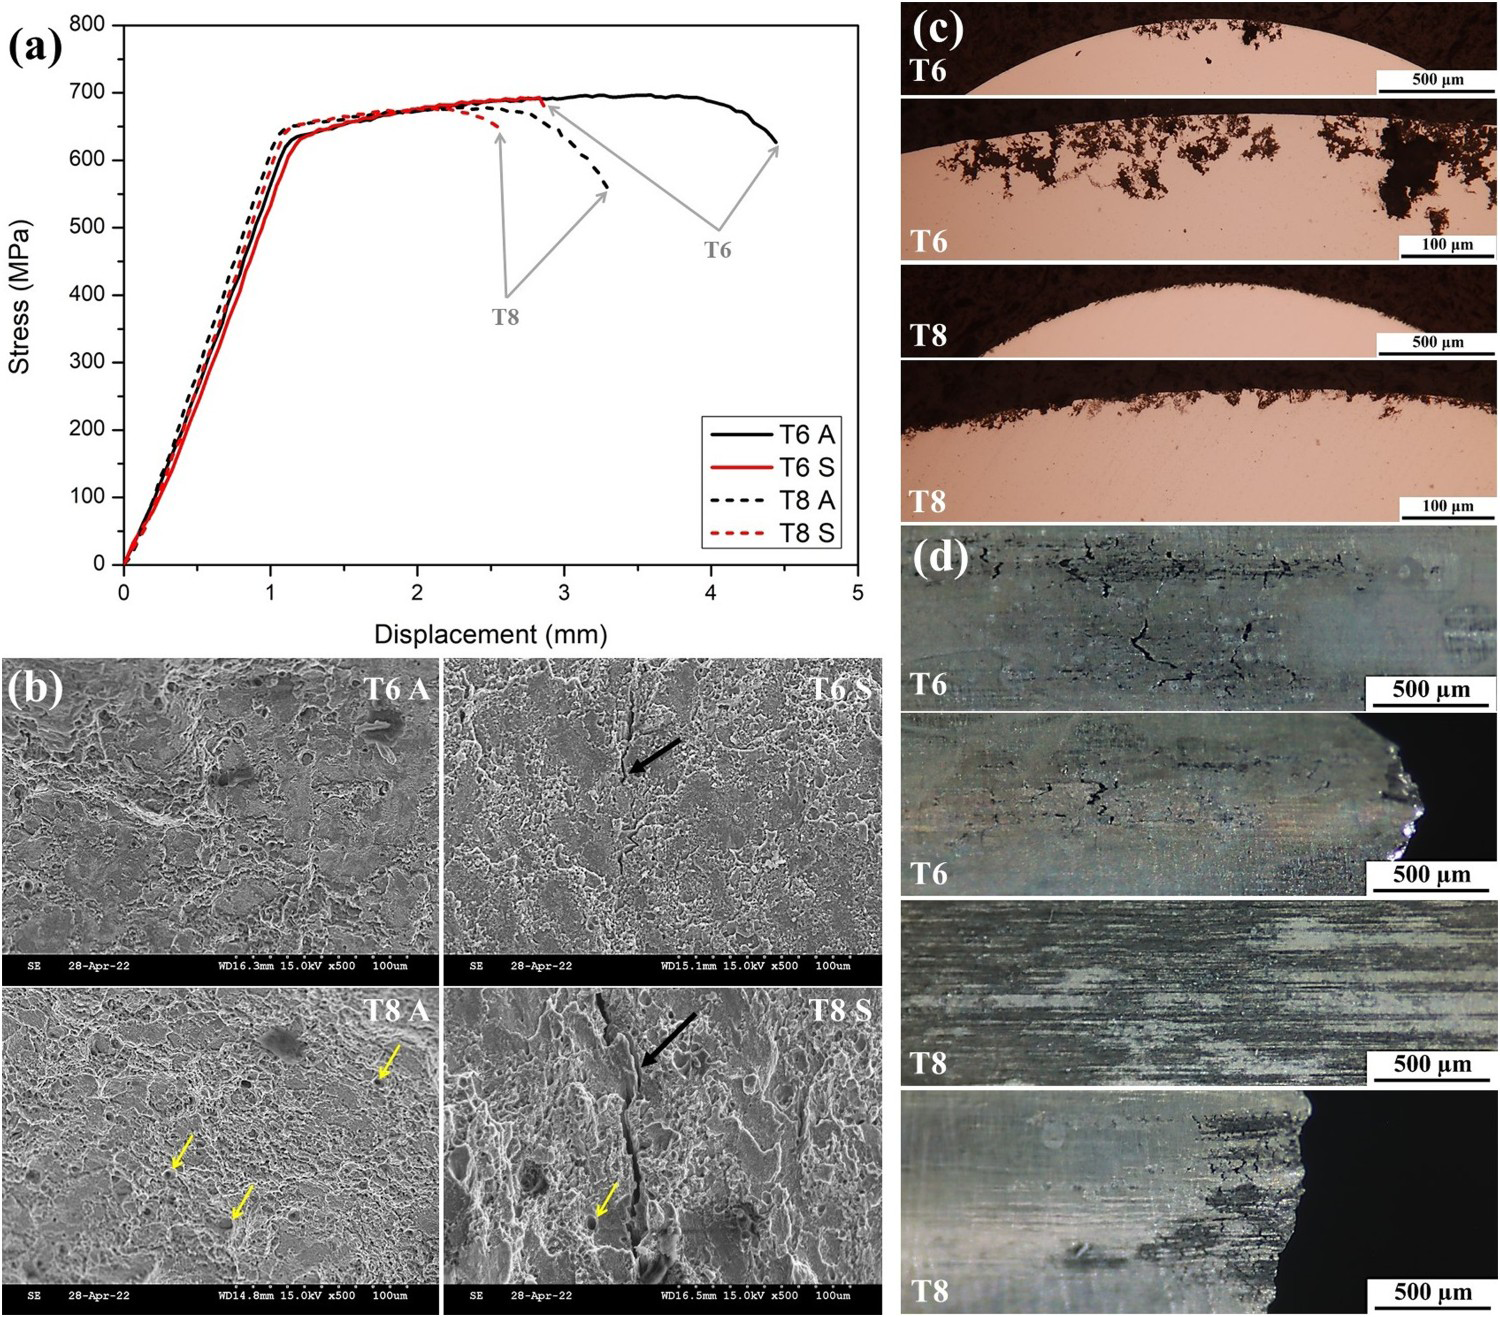
The stress–strain curves, fracture surfaces, cross sections and exposed surfaces of the naturally aged 7075 alloy specimens are depicted in Figure 6. The stress corrosion cracking susceptibility index I scc values (Table 3) point out the remaining life-span of the specimens tested in corrosive solution. However, despite with the I SCC value of 0.72, the T4 specimen suffers from severe IGC attack and is unable to maintain the same level of stress obtained in atmospheric condition after the yielding point, as shown in Figure 6(a). Hence, the T4 specimen is considered as the least corrosion-resistant specimen in this study. Naturally aged 7075 alloys are already known to exhibit high SCC susceptibility [1 3]. Severe IGC can be observed in the T4 specimen from both cross-section and exposed surface, as shown in Figure 6(c,d). In some areas, the IGC attack even results in the separation of entire grains and the formation of large pits.
(a) Stress–strain curves, (b) fracture surface, (c) cross sections and (d) exposed surfaces of the SSR tested naturally aged 7075 alloys.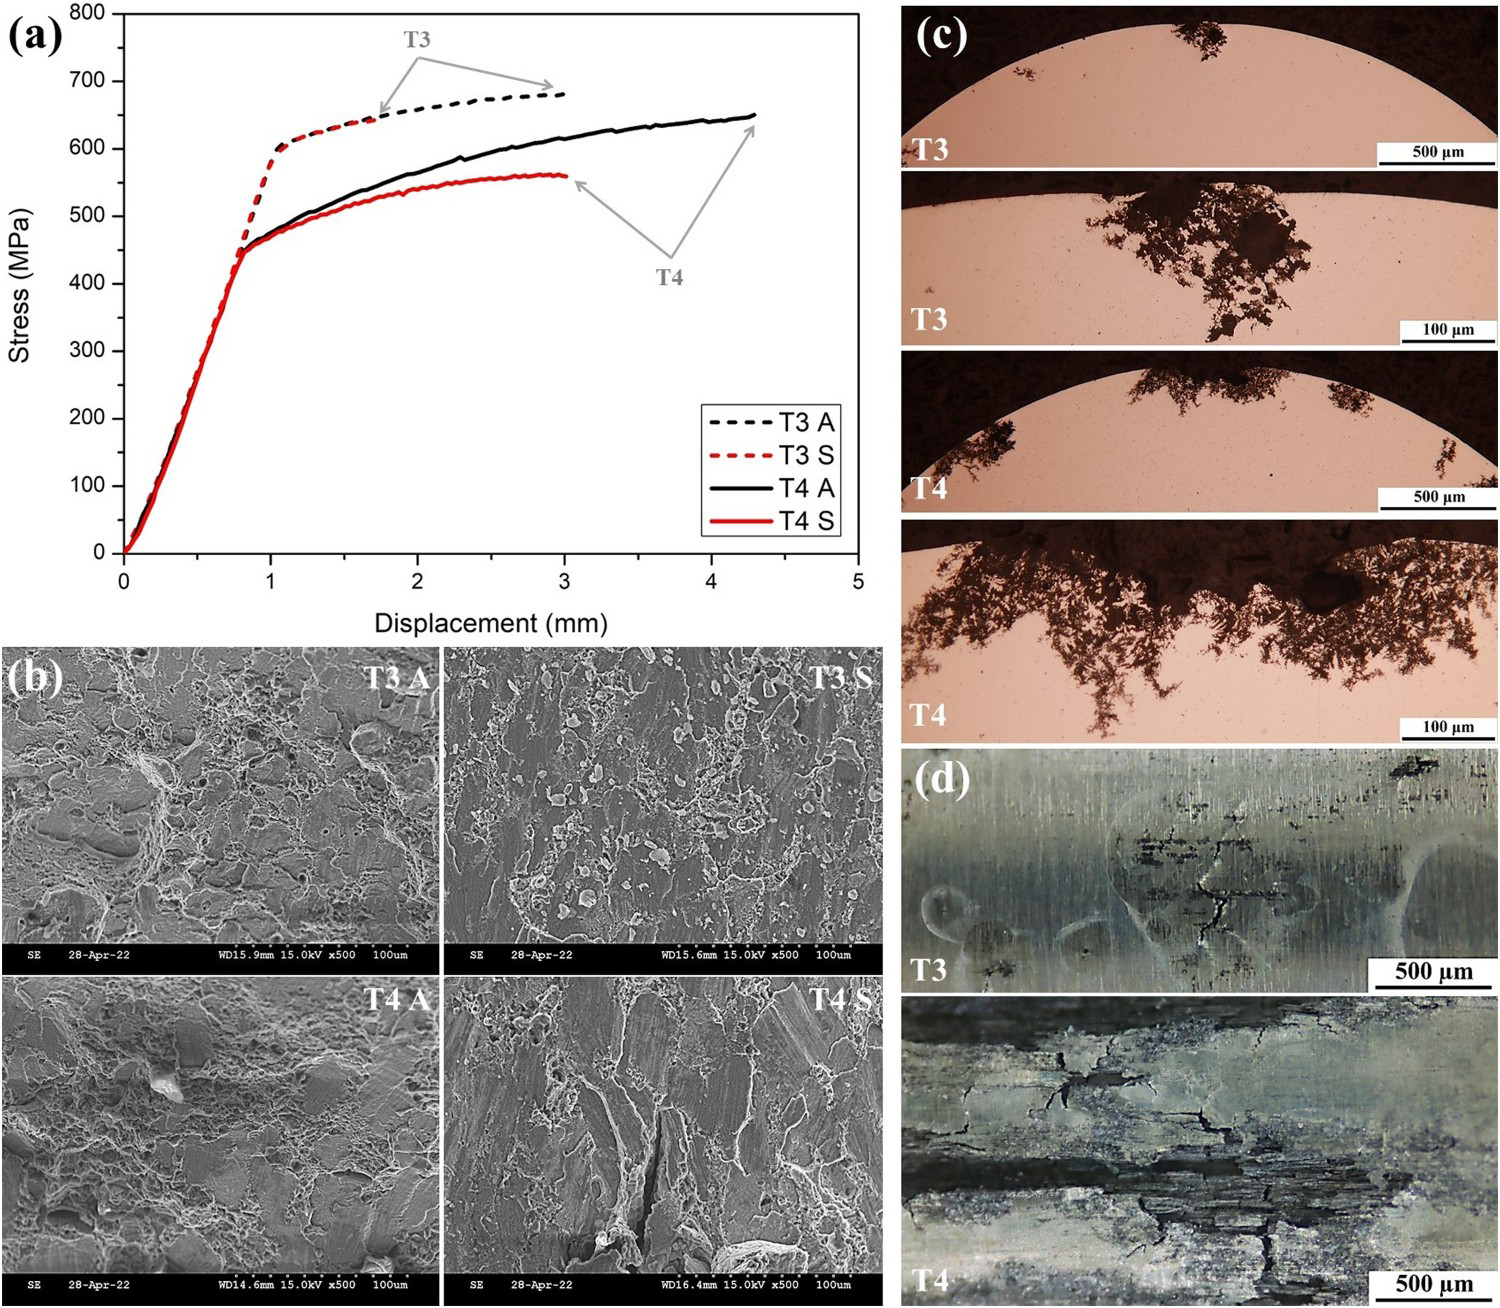
On the other hand, the corrosion in the T3 specimen is significantly less severe compared to the T4 specimen in Figure 6(c,d). The stress level of the solution-tested T3 specimen was able to keep up with the stress–strain curve in air before fracture, as shown in Figure 6(a). From the exposed surface shown in Figure 3(d), the IGC found on the T3 specimen is localised to smaller areas compared to the wide spread IGC found on the T4 specimen. The exposed surface morphology of the T3 specimen behaves similar as the corrosion found on the artificially aged T6 specimen (Figure 8(d)) which will be demonstrated in the next section. However, even though the stress level of the solution-tested T3 specimen was able to keep up with the stress–strain curve in air, the localised IGC still makes the T3 specimen vulnerable to SCC during SSRT. Hence, the T3 specimen is still associated with the I SCC value of only 0.64. As shown in Figure 6(b), both of the solution-tested T3 and T4 specimens exhibit cleavage fracture surfaces and more brittle characteristic compared to the ones tested in air, despite the fact that little necking and dimples were found in the naturally aged specimens tested in air.
Possible explanations for the slightly improved corrosion resistance of the pre-deformed T3 specimen are shown in Figure 7. The pre-deformation process has been shown to create strain-induced dislocations which can act as diffusion shortcuts for the nucleation and growth of stable precipitates in 6XXX series alloy [30]. The enhanced precipitation caused by pre-deformation has also been noticed to alters the corrosion behaviour of the naturally aged 6061-T3 in previous study [31]. Since the precipitation of 7075 alloy under natural aging is more prominent than the 6XXX series alloy, and visible GBPs can already be found in the non-pre-deformed 7075-T4 [2], similar effects of enhanced precipitation is also found in the pre-deformed and naturally aged 7075 alloy in this study. Under high magnification TEM observation up to 1MX as shown in Figure 8(a,b), precipitations in both matrix and GB appears to be more prominent in the pre-deformed T3 specimen. Under the same magnification, the GB of the T3 specimen demonstrates a wider shadowed area which can be suggested to be continuous GBPs. The small and homogeneously distributed shadows in the matrix in Figure 7(b) are presumed to be GP zones. Dislocations and visible GBPs can only be observed in the T3 specimen, as shown in Figure 7(c,d). It can be suggested that the pre-deformation process produces considerable misorientation sites and dislocations which act as precipitation sites and diffusion shortcuts [31]. The enhanced precipitation leads to the early appearance of GBPs and wider GBs in naturally aged 7075-T3. The wider GBs with more visible GBPs marginally reduces the rate of continuous anodic dissolution along the GB, therefore slightly increasing the corrosion resistance of the GBs of naturally aged 7075-T3 compared to the non-pre-deformed 7075-T4. However, the naturally aged GBPs remain small and continuous, which makes the pre-deformed 7075-T3 specimen still highly sensitive to SCC during SSRT.
High magnification bright field GB area TEM micrographs of 7075 alloys. (a) T4, (b) T3, (c)(d) dislocations and GBPs found in the T3 specimen. (a) Stress–strain curves, (b) fracture surface, (c) cross sections and (d) exposed surfaces of the SSR tested artificially peak aged 7075 alloys.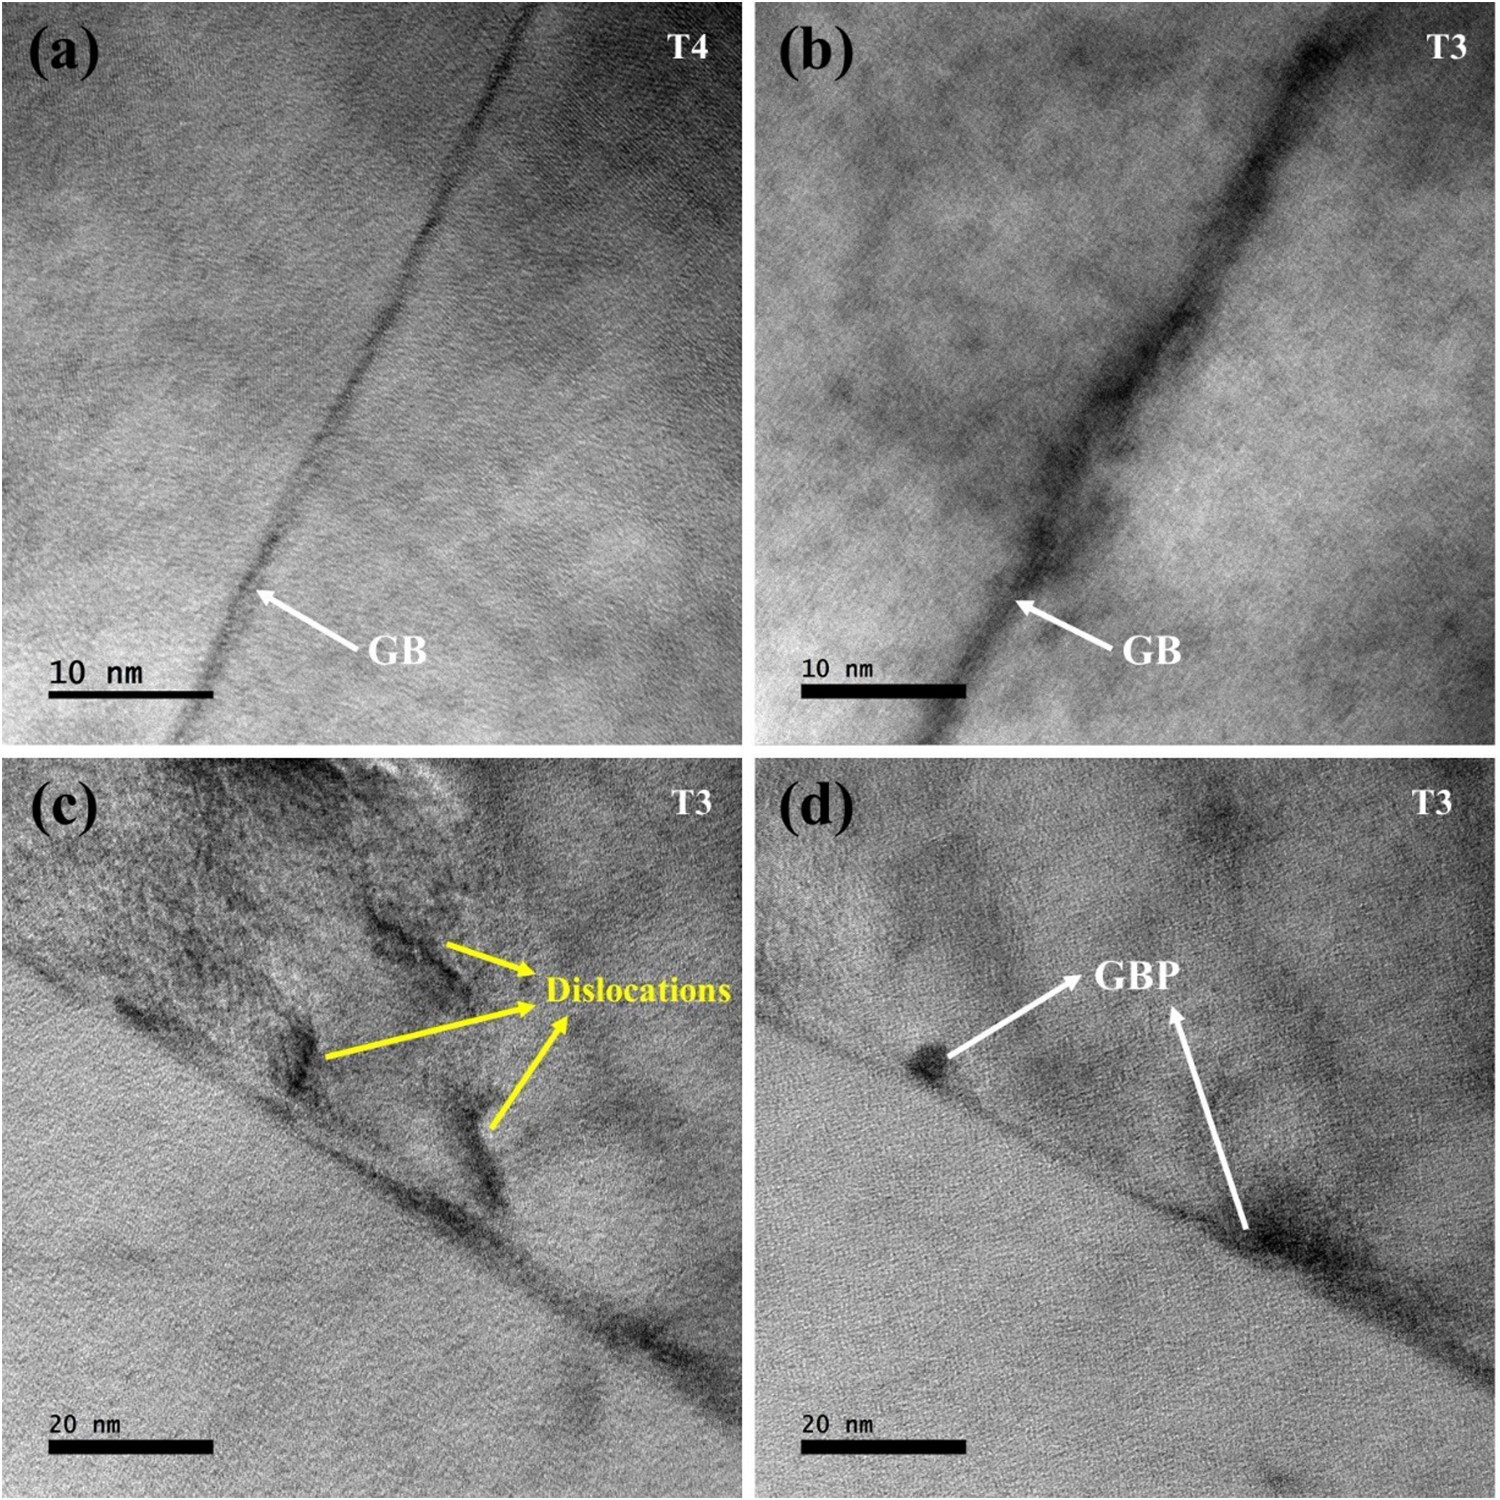
Effects of pre-deformation on SCC behaviour of artificially peak aged 7075 alloy
The SSRT results of the artificially peak aged specimens are depicted in Figure 8. The T8 specimen exhibits a higher yield strength but a lower ultimate tensile strength than the T6 specimen. In atmospheric condition, the STR of the T8 specimen (11.87%) is significantly lower than that of the T6 specimen (17.92%) due to pre-deformation. In corrosive environment, the positive influence of pre-deformation on corrosion behaviour can be clearly observed. The I SCC values of T6 and T8 specimens are 0.61 and 0.76, respectively, indicating improved SCC resistance of the pre-deformed T8 specimen. Moreover, pre-deformation also causes a change in the corrosion mechanism, as shown in Figures 8(c,d). The corrosion found on the T6 specimen is a mixture of IGC and matrix pitting. Multiple IGC cracks can be clearly seen on the exposed surface of the T6 specimen. In contrast, general distributed corrosion pits can be found on both cross section and exposed surface of the T8 specimen, and intergranular cracks are only found in areas close to the fracture site of the T8 specimen. Just like the naturally aged specimens, the corrosive solution caused the ductile to brittle transition on the fracture surface morphology of the SSRT-tested T6 specimen, as shown in Figure 8(b). The fracture surface of the solution-tested T6 specimen appears to be planar and brittle, with secondary cracks found (black arrow). Secondary cracks also exist on the fracture surface of the T8 specimen. But surprisingly, dimples (yellow arrows) are found on both T8 specimens tested in air and in solution, which suggests less ductile to brittle transition and lower sensitivity to SCC. According to literature findings and TEM microstructures shown in Figure 3(c,d), the improved SCC resistance of the T8 specimen can be attributed to the following possible reasons. (1) The rapid over-aging caused by pre-deformation leads to the earlier substitution of Cu for Zn in the GBPs [2], which slows down the anodic dissolution of the GB. (2) Even though the GBPs of the T8 specimen are continuous, the larger η phases can act as hydrogen traps after anodic dissolution [21,26,27] and reduce the sensitivity of the T8 specimen to HIC. (3) The narrow and vague PFZs of the T8 specimen reduce the potential difference between the grain matrix and GBPs, hence weakening the micro-galvanic coupling for continuous anodic dissolution.
Effects of pre-deformation on low temperature RRA-treated 7075 alloy
The SSRT results of the RRA-treated specimens are illustrated in Figure 9. To avoid confusion, only the results of T6R75RA and T8R75RA with better overall performance are shown. The yield strength and ultimate tensile strength of the RRA-treated T8 specimen are both lower than the RRA-treated T6 specimen, which agrees with microhardness findings and the overaged microstructures shown in Figure 4(b) and Figure 5(b–d). In the atmospheric condition, the STR of the T6R75RA and the T8R75RA specimens tested in air are 14.16% and 11.11%, respectively. Decreased ductility can be found in the RRA-treated 7075 alloys compared to their peak aged conditions, especially for the non-pre-deformed T6R75RA specimen. For specimens tested in solution, further increase in STR can be found on the T6R75RA specimen (11.86%) compared to the T6 specimen (10.94%). The I scc value of the T6R75RA specimen increased considerably up to 0.84 partially due to the declined STR in the atmospheric condition. The performance of the pre-deformed specimens on the other hand, is strongly affected by the retrogression time. The STR of the T8R30RA and T8R60RA specimen are 8.42% and 8.53%, respectively, and their I scc values are 0.78 and 0.77, respectively, which is only similar to the behaviour of T8 specimen. During retrogression, the GB is under the transformation sequence from the morphology shown in Figure 3(d) toward the microstructure shown in Figure 5(d). The GBPs gradually grow larger in size and wider in spacing, as the mean time the PFZs become clearer and wider with longer retrogression time. If the retrogression is terminated before the mature overaged GB microstructure is reached, the widening PFZs accompanied with partially continuous GBPs may still lead to high SCC sensitivity. Fortunately, with adequate retrogression time of 75 min, improvement in SCC resistance can be found in the pre-deformed specimen. The STR of the solution-tested T8R75RA specimen increases to 9.09%, and the I scc value reaches 0.82, which is close to 0.84 of the T6R75RA specimen. Only small corrosion pits can be observed from the exposed surfaces and cross sections of the RRA-treated specimens, as shown in Figure 9(c,d).
(a) Stress–strain curves, (b) fracture surface, (c) cross sections and (d) exposed surfaces of the SSR tested RRA-treated 7075 alloys.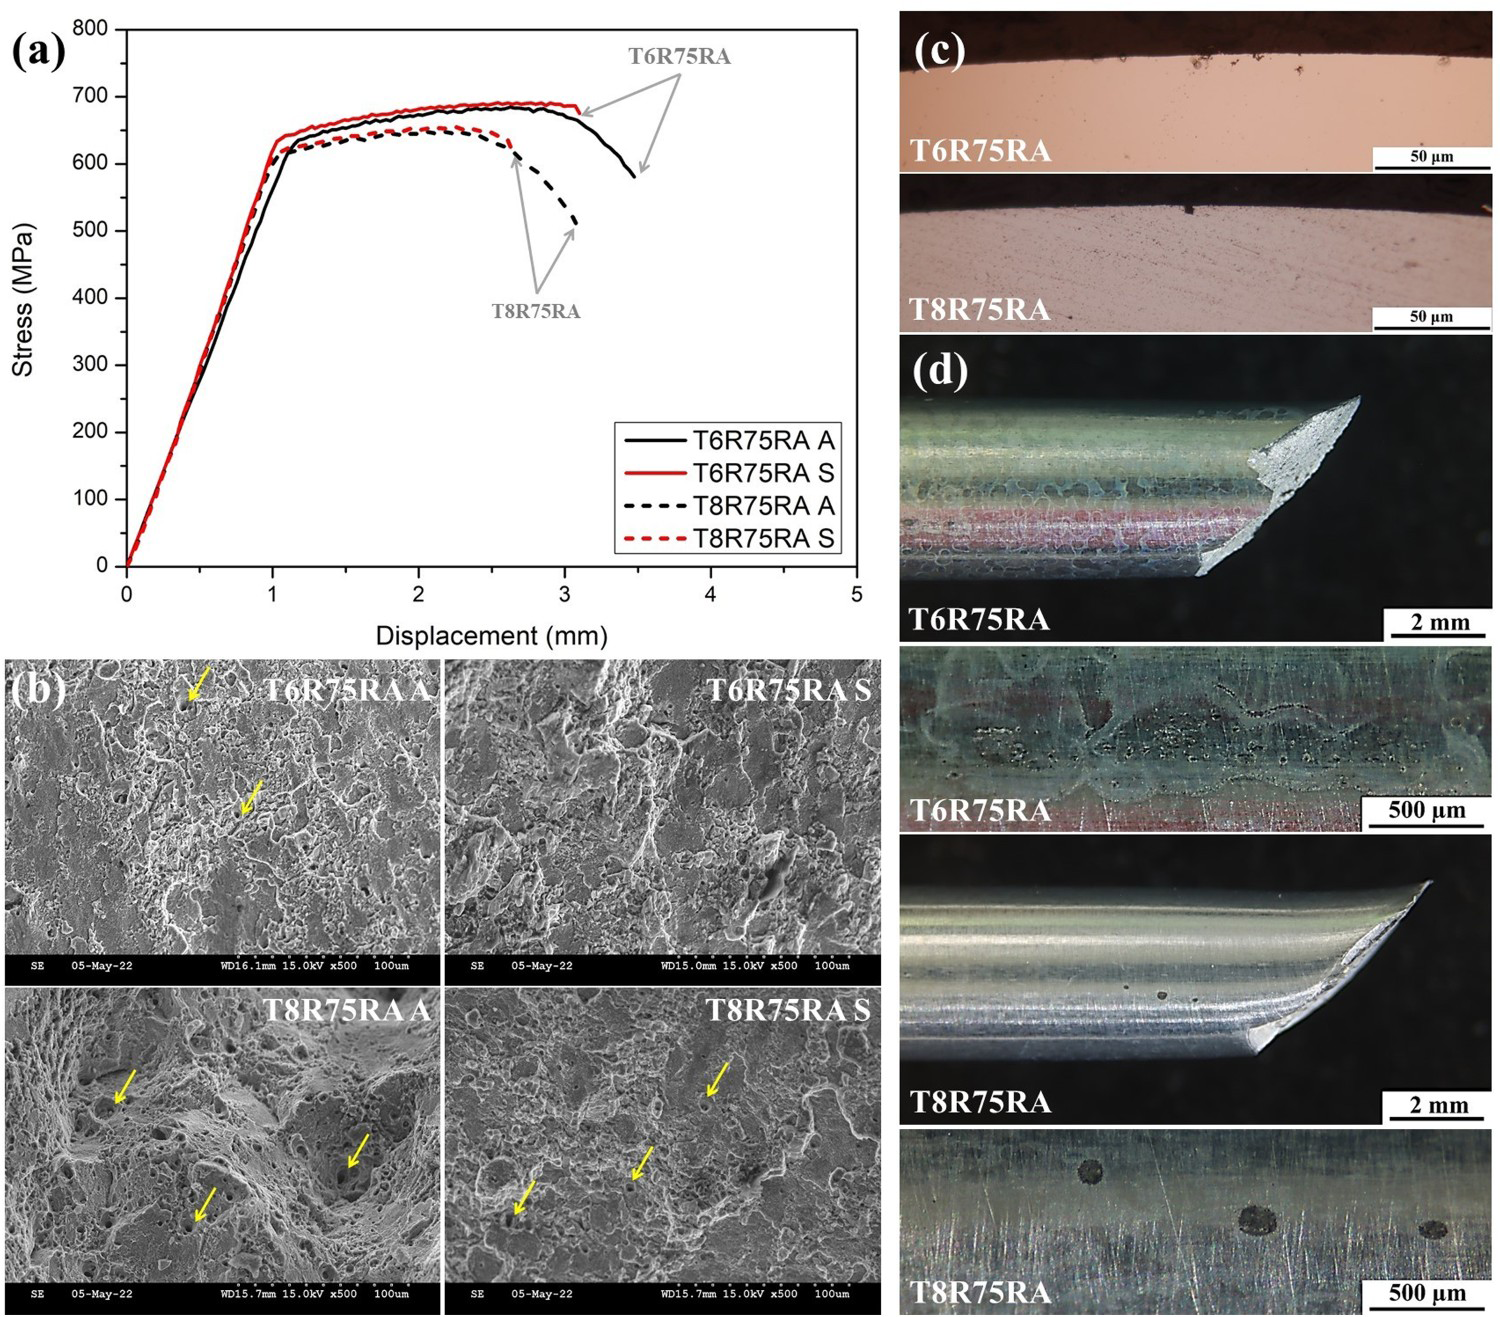
From Figure 9(b), the fracture surface of the pre-deformed T8R75RA specimen does not seem to alter significantly when tested in aggressive solution, as dimples (yellow arrows) exist on specimens tested in both air and solution. Additionally, during SSRT under pH 1 solution environment, obvious necking only occurs for the T8R75RA specimen. This indicates that the rapid over-aging caused by pre-deformation results in a more ductile behaviour of RRA-treated 7075 alloys in corrosive environment. On the other hand, the fracture surface of the T6R75RA specimen still appears to be more brittle compared to that of the T8R75RA specimen.
Overall, SSRT under pH 1 solution is punishing for the 7075 alloy [15]. In this study, the SSRT successfully differentiates the SCC susceptibility between the naturally aged, artificially peak aged and RRA-treated 7075 alloys. The SSRT also nicely distinguishes the improvement of SCC resistance of the pre-deformed and artificially peak aged 7075 alloy (T8) compared to the standard 7075-T6. However, there might be controversies concerning the fairness of comparing a pre-deformed specimen with an ordinary one by SSRT only. Furthermore, additional evidences are still required to fully understand the differences in corrosion behaviour and corrosion severity between the pre-deformed and ordinary specimens under equivalent heat treatment conditions. Hence, potentiodynamic and potentiostatic polarisation methods were conducted as quantified and accelerated immersion corrosion tests, with results shown in the following paragraphs. Correlations between the results gathered from SSRT and electrochemical polarisation are also discussed.
Potentiodynamic polarisation and breakdown potential
The potentiodynamic polarisation curves of the 7075 alloy specimens are shown in Figure 10. The 3.5 wt-% NaCl testing solution was kept at pH 7 and deaerated with Ar in order to separate the breakdown potential from corrosion potential (E corr). It has been reported that in deaerated solution, the breakdown potential (E br) where the rapid increase in corrosion current begins, remains steady as a reproducible feature [35]. The E br value obtained in deaerated solution also roughly coincides with the E corr value in aerated solution [36]. In previous study regarding the 6061 alloy [31], the E br values obtained in potentiodynamic scan successfully correlates with the overall corrosion resistance of the materials under various heat treatment conditions. For 7075 alloys as shown in Figure 10, the artificially aged and RRA-treated 7075 alloys demonstrate two breakdown potentials which have been reported in literatures [37,38]. The first and lower E br1 represents the initiation of unstable breakdown as the second and higher E br2 represents the stable localised corrosion [37,38]. The naturally aged 7075 alloys on the other hand demonstrate no such phenomena, for only E br1 can be found for the T3 and T4 specimens. Considering the first and lower E br1, the artificially peak aged T6 and T8 7075 alloys demonstrate higher E br1 values than the naturally aged T3 and T4 7075 alloys. The RRA treatment raised the E br1 value of 7075 alloy even further. These results match perfectly with the SSRT results since the SCC susceptibility of 7075 alloy is known to decrease with increasing artificial aging. The RRA-treated specimens also demonstrate a slightly higher E br2 values than the T6 and T8 specimens. The approximate values of the E br1 and E br2 of the 7075 alloy specimens are also listed in Figure 10.
Potentiodynamic polarisation curves of 7075 alloys under different temper conditions in deaerated 3.5% NaCl solution at a scan rate of 0.5 mV sec–1.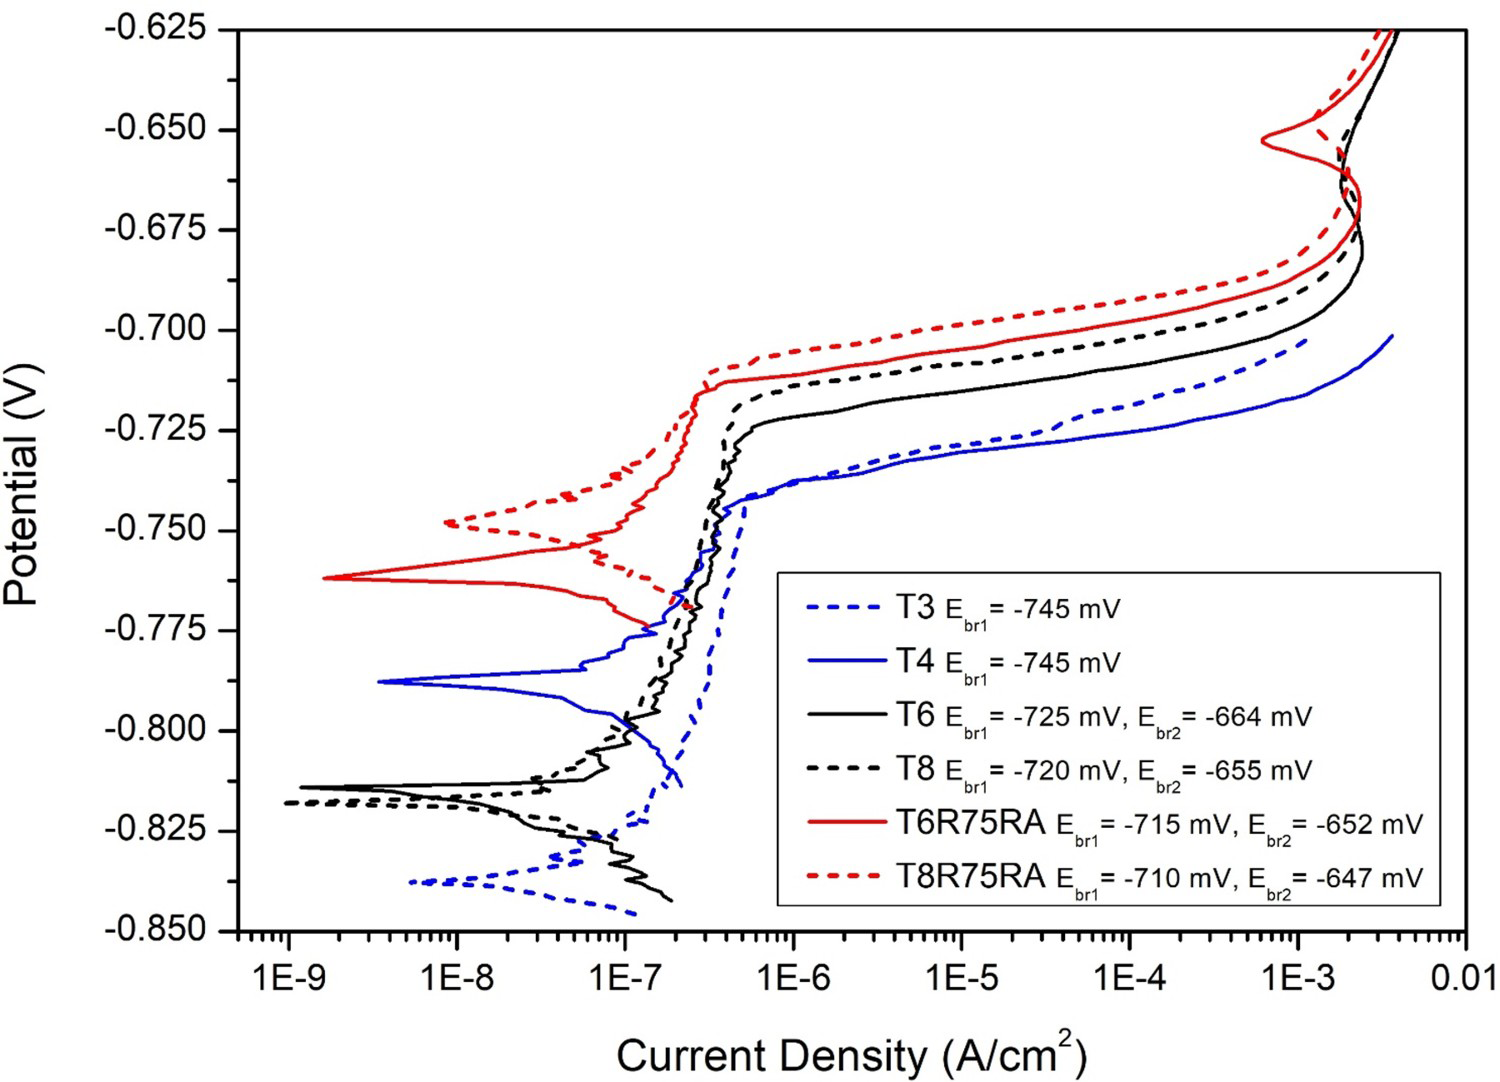
When considering the pre-deformed and ordinary specimens under similar aging conditions, no obvious change in E br1 value can be found for the naturally aged specimens. Although the current increase after breakdown seems to be more rapid for the T4 specimen. On the other hand, the pre-deformation noticeably raised the E br1 and E br2 values of the artificially aged and RRA-treated 7075 alloys by approximately 5∼10 mV compared to that of the non-pre-deformed specimens. In potentiodynamic polarisation, higher E br value generally indicates higher resistance to corrosion, which is caused by the delayed breakdown of certain protective film or retarded dissolution of certain phases [39]. However, a rapid potentiodynamic polarisation scan is inadequate to reveal the long-term corrosion severity as well as differentiating the corrosion mechanisms. Hence, the results from potentiostatic polarisation at various potentials are demonstrated in the next section.
Results from potentiostatic polarisation and correlation with SSRT
Potentiostatic polarisation scans at −725, −700, −675 and −650 mV vs. RE were conducted for 12 h in deaerated 3.5% NaCl solution. Scanning potentials were chosen based on the E br values gathered from potentiodynamic tests. The gradually increasing scanning potentials were chosen to simulate tougher corrosive environment. Observations from potentiostatic polarisation and metallographic examinations are summarised in Table 4 and Figure 11.
Transient curves of corrosion current density and cross-sectional OM images of 7075 alloy specimens potentiostatically polarised at (a)(b) −725 mV, (c)(d) −700 mV, (e)(f) −675 mV and (g)(h) −650 mV vs. RE for 12 h. Summary of potentiostatic polarisation scans and optical microscopic observations. Note: All potentiostatic scanning were conducted for 43 200 s (12 h).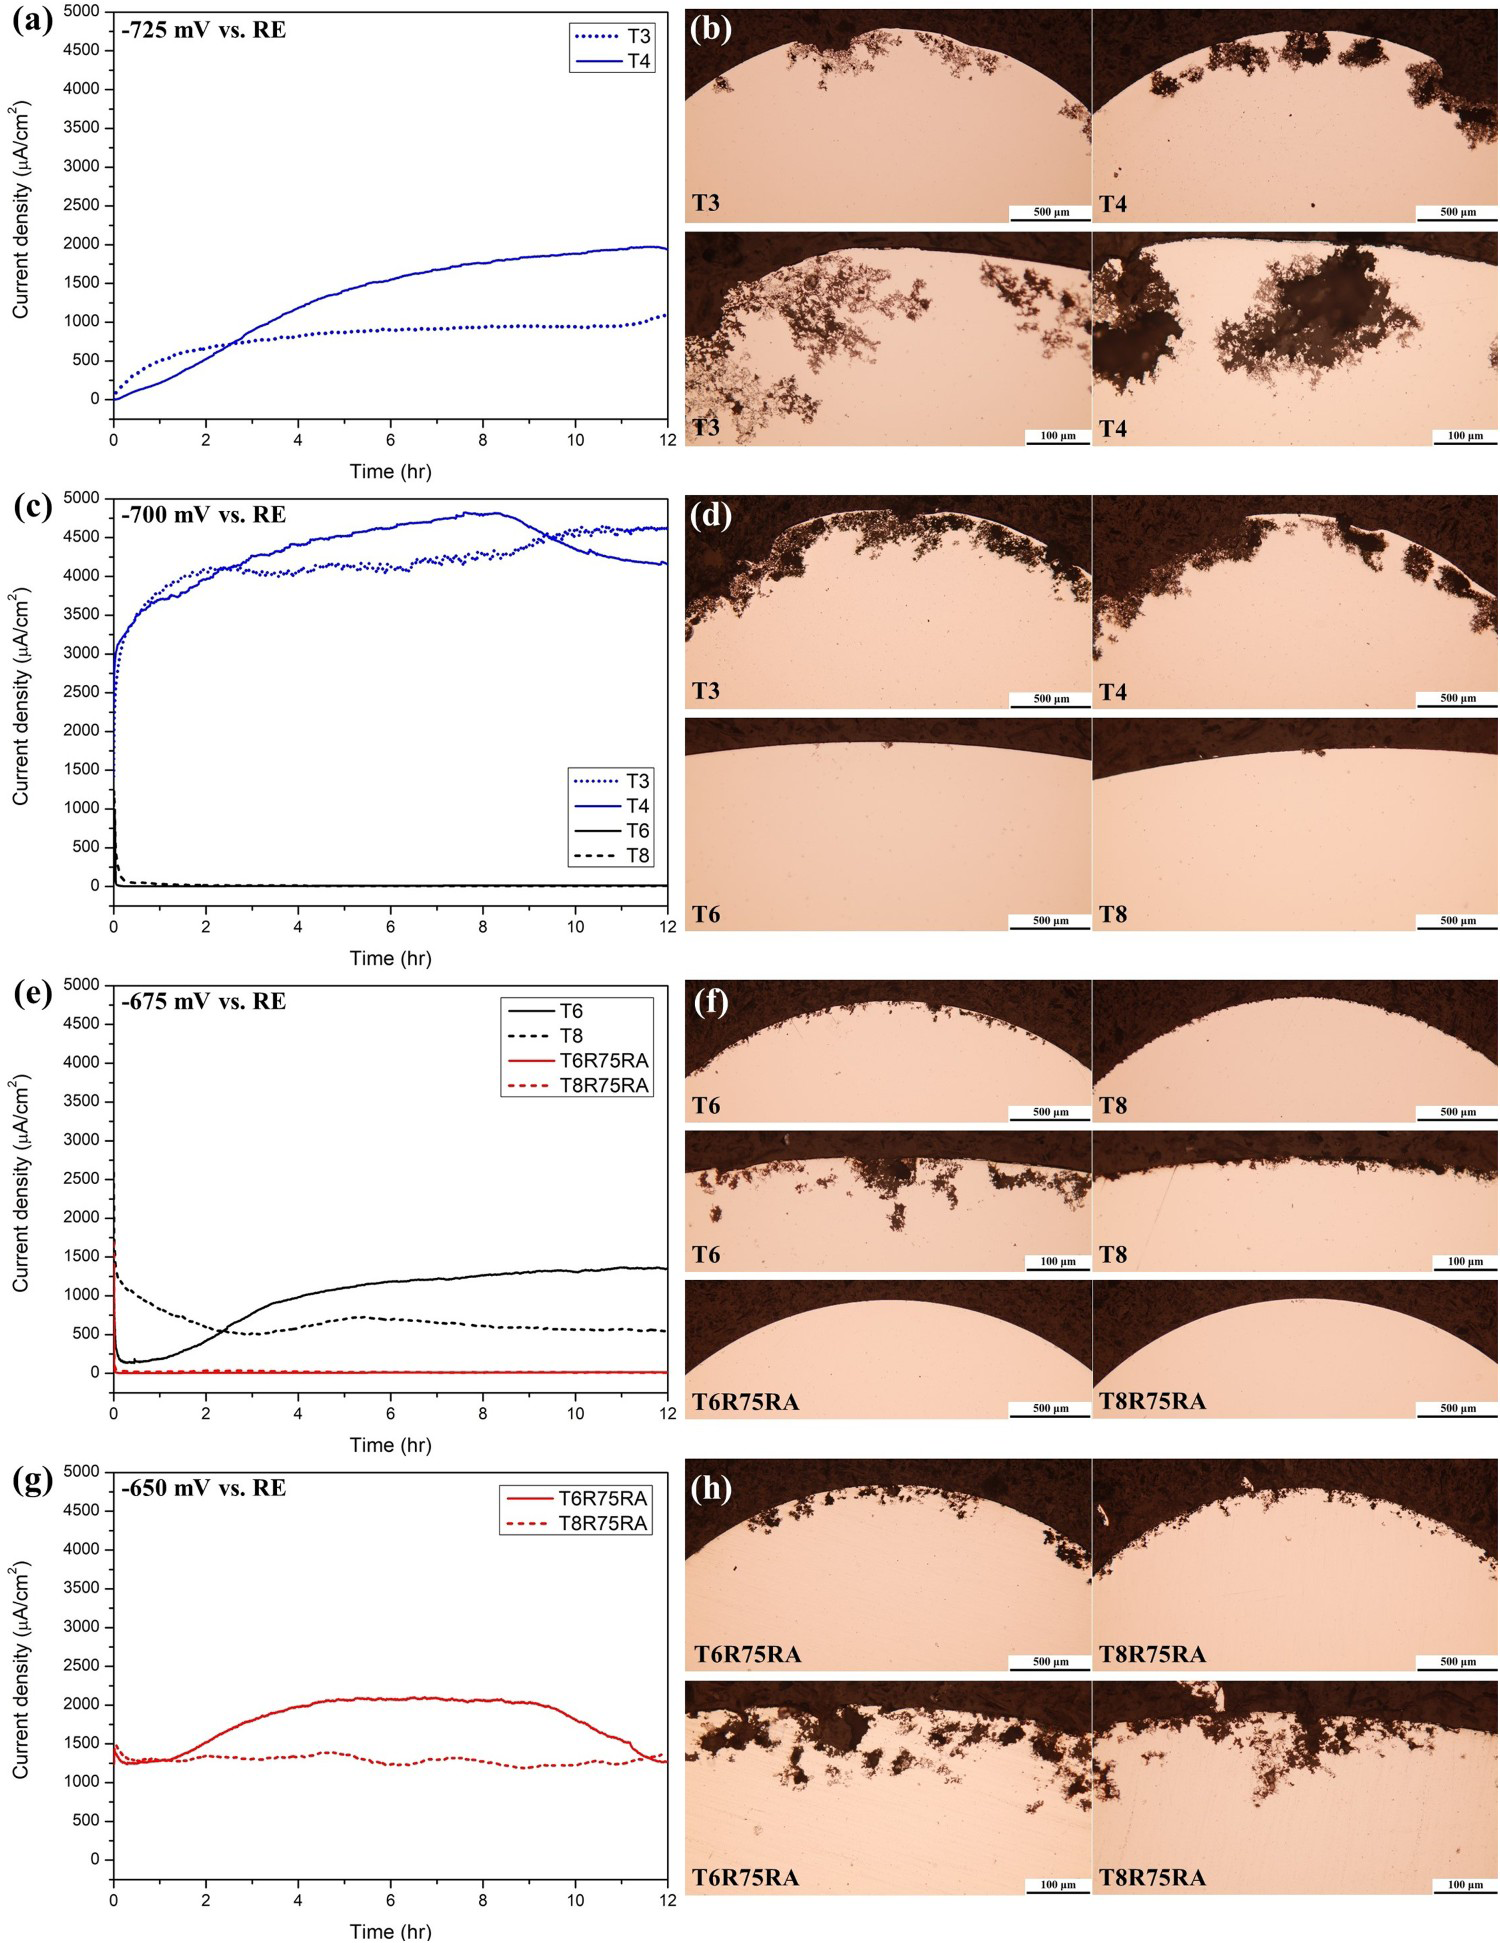
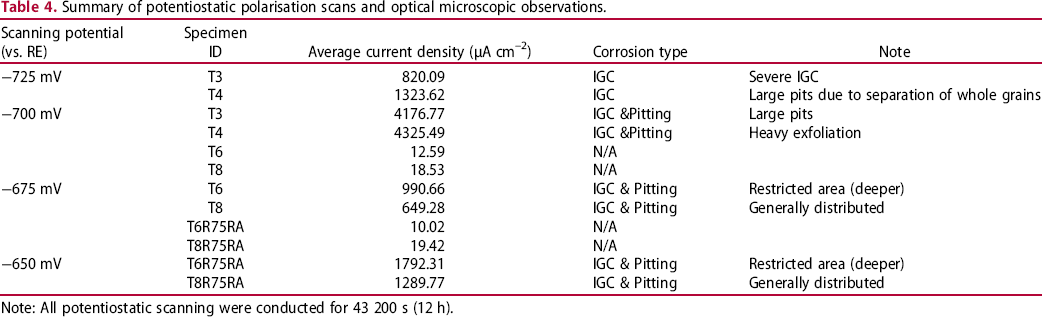
During the potentiostatic test conducted in this study, whenever scanning potential was set below or slightly above the E br1 value of the tested specimen, the corrosion current was found to drop rapidly to a low value (below 20 µA cm–2) as soon as the potentiodynamic test ended and the potentiostatic test began. Hence, only the current transients of the naturally aged specimens are shown in Figure 11(a), since scanning potential of −725 mV is still below the E br1 values of the other specimens. For the first few hours under −725 mV, the T3 specimen demonstrates a higher corrosion current density than the T4 specimen. But the corrosion current of T4 specimen surpasses the T3 specimen and keeps on increasing throughout the rest of the test, while the corrosion current of the T3 specimen remains relatively steady below 1 mA cm–2. The average current density of the T3 and T4 specimens during the 12-hour scanning under −725 mV are 820.09 and 1323.62 µA cm–2, respectively. From the cross-sectional OM images shown in Figure 11(b), large voids can be found in the T4 specimen, which is caused by the separation of whole grains due to severe IGC. On the other hand, even though the T3 specimen also suffers from serious IGC attack, the complete separation of grains doesn't seem obvious. This suggests that the pre-deformation process is able to slightly improve the corrosion resistance of the naturally aged 7075 alloy. The aforementioned results have also been found during the SSRT experiment (Figure 6) while the solution-tested T3 specimen is able to reach the same stress level achieved in atmospheric condition after yield strength and the T4 specimen is not, which indicates good agreement between the two testing methods.
The corrosion of the naturally aged 7075 alloy specimens becomes even more destructive as the scanning potential is increased up to −700 mV, as shown in Figure 11(c,d). At −700 mV, little difference in average corrosion density can be told between the T3 (4176.77 µA cm–2) and T4 (4325.49 µA cm–2) specimens. On the other hand, the corrosion current of the T6 and T8 specimens decreases rapidly under potentiostatic scanning at −700 mV. Only small corrosion pits can be found on the cross sections of the T6 and T8 specimens at this potential.
Detectable corrosion occurs in the T6 and T8 specimens under the scanning potential of −675 mV as the potential gets closer to the E br2 values of the T6 and T8 specimens, as shown in Figure 11(e,f). At the same potential, the corrosion current of the RRA-treated specimens quickly drops and is almost corrosion free. In Figure 11(e,f), the average current density of the pre-deformed T8 specimen (649.28 µA cm–2) compared to the T6 specimen (990.66 µA cm–2) and the cross-sectional images both suggest significant improvement in corrosion resistance caused by the pre-deformation process. While deeper and localised corrosion pits can be found on the T6 specimen, the pre-deformed T8 specimen demonstrates a more evenly distributed corrosion mechanism, which is shallower and similar to general corrosion. The corrosion morphologies found in the cross-sectional images of the −675 mV scanned T6 and T8 specimens in Figure 11(f) are almost identical to the ones generated by SSRT, as shown in Figure 8(c). Hence it can be concluded that for artificially peak aged 7075 alloys, the results gathered from electrochemical measurement and SSRT are in very high agreement.
Finally, obvious corrosion appears in the RRA-treated 7075 alloys under the scanning potential of −650 mV which is just around the E br2 values of the RRA-treated specimens, as shown in Figure 11(g,h). The improvement in corrosion resistance due to the pre-deformation is still evident for the RRA-treated specimens. The average current density of the pre-deformed T8R75RA specimen (1289.77 µA cm–2) is significantly lower than that of the T6R75RA specimen (1792.31 µA cm–2). Traces of the generally distributed corrosion from the T8 specimen also exist in the T8R75RA specimen in Figure 11(h). However, as shown in Figure 9(c), little corrosion can be found from the cross-sectional images from the SSRT-tested RRA specimens. This suggests that the RRA-treated specimens are able to withstand the abuse of the pH 1 testing solution during the SSRT. For the RRA-treated specimens, SCC kicked in during the final necking process of the tensile test. This is expected since the challenging corrosive solution may penetrate into the material defects emerging around the necking area and leads to hydrogen discharge and material embrittlement. Hence, the longer the specimen can survive in the corrosive solution during the necking process of SSRT can also represents better SCC resistance. In the pH 1 solution used in this study, noticeable necking only occurred in the T8R75RA specimen, which can also be recognised as an indicator for the improved SCC resistance.
Overall, the results gathered from electrochemical testing are in high agreements with those gathered from SSRT. Both methods are capable of differentiating the corrosion resistance between the naturally aged, artificially peak aged and RRA-treated 7075 alloys. The influence of pre-deformation process can also be clearly detected by both testing methods. While hydrogen embrittlement plays an important role in SSRT and affects the STR significantly, the constant displacement loaded potentiostatic polarisation emphasises more on the anodic dissolution at the GBs, and can provide quantitative data regarding the corrosion severity.
Conclusion
The present work aims to study the effects of pre-deformation on mechanical properties and SCC behaviour of 7075 alloy under different temper conditions using SSRT and electrochemical polarisation. GB-related microstructures were observed to correlate with the results of corrosion testing. The experimental findings can be concluded as follows:
The 10% pre-deformation process slightly improves the corrosion resistance of naturally aged 7075 alloy. The strain-induced dislocations produced by pre-deformation act as diffusion shortcuts and enhance the precipitation under natural aging condition. Small, densely spaced and continuous GBPs appears in the GB of the pre-deformed and naturally aged 7075-T3 alloy. Consequently, the corrosion resistance of the 7075-T3 is slightly better than that of the 7075-T4. However, 7075-T3 still exhibits high susceptibility to SCC due to the continuous and small GBPs. For the artificially peak aged 7075 alloy, the pre-deformed 7075-T8 performs significantly better than the 7075-T6 during SSRT as well as electrochemical measurements. While deep and localised corrosion pits exist on the T6 specimen, the pre-deformed T8 specimen demonstrates an evenly distributed corrosion mechanism, similar to general corrosion. The strain-induced dislocations produced by pre-deformation results in rapid over-aging and early appearance of stable precipitates in both matrix and GBs of the 7075-T8. The substitution of Cu for Zn in the GBPs due to rapid over-aging, the larger GBPs acting as hydrogen traps and the narrower PFZs are possible explanations for the improved SCC resistance of 7075-T8. During low temperature RRA treatment, same retrogression time is needed for the pre-deformed and non-pre-deformed 7075 alloys to obtain a more overaged GB microstructure. For the pre-deformed 7075 alloy, the rapid over-aging in the matrix limits the precipitation and hardness increase during re-aging treatment. Fortunately, the overaged microstructure of the pre-deformed 7075 alloy results in a more ductile behaviour during SSRT after RRA treatment. The pre-deformed and RRA-treated 7075 alloy also exhibits the highest corrosion resistance in potentiostatic polarisation and possesses the highest E br1 and E br2 values in the potentiodynamic polarisation. Overall, the results gathered from electrochemical testing are in high agreements with those gathered from SSRT. Both methods are capable of differentiating the corrosion resistance of 7075 alloys under several heat treatment conditions. While hydrogen embrittlement plays an important role in SSRT an affects the STR significantly, the constant displacement loaded potentiostatic polarisation emphasises more on the anodic dissolution at the GBs, and can provide quantitative data regarding the corrosion severity.
Footnotes
Acknowledgements
The authors thank the Microscopy Center at Chang Gung University for technical assistance. Investigation, Li Yuan Hu, Chia Wei Chang, Cheng Yueh Shih and Ching Chang Yang; Supervision, Kuang Hua Hou; Writing – original draft, Li Yuan Hu; Writing – review and editing, Li Yuan Hu, Kuang Hua Hou.
Disclosure statement
No potential conflict of interest was reported by the author(s).