
Abstract
An optimised electrochemical technique, linear sweep voltammetry (LSV) in KOH solution (LSV-KOH) was confronted with the double loop electrochemical Potentiokinetic reactivation (DL-EPR) to verify which is the best technique to quantify deleterious phases (DP) in a UNS S32750 super duplex stainless steel. DL-EPR presented an error in determination of deleterious phases in the range of 6.9-100%. LSV-KOH show a better accuracy in quantification of deleterious phases volume fractions, the error range for LSV-KOH was 2.4-26.2%. When the morphology of sigma changes from lamellar to divorced, was observed modifications on LSV-KOH voltammograms. In specimens where lamellar morphology is present, the voltammograms show two peaks curve. Meanwhile, in specimens where occurred also divorced precipitation of sigma the voltammograms changes to a 3 peaks curve. This feature is due to the dissolution of sigma phase boundaries which has different compositions according to the form of sigma precipitation.
Introduction
Duplex (DSS) and superduplex (SDSS) stainless steels are alloys composed of a dual-phase microstructure. The best properties of those alloys are obtained with equal proportions of ferrite (δ) and austenite (γ) phases. The addition of alloying elements such as Cr and Mo contributes to a material with high mechanical strength and corrosion resistance [1 5]. Those characteristics make the DSS and SDSS great choices for industrial applications such as chemicals and petrochemicals plants [6,7]. However, deleterious phase precipitation may occur when those alloys are submitted to welding processes, hot working, or heat treatments. A decrease in material performance occurs due to the deleterious phases, such as sigma and chi phases, sometimes resulting in equipment failure [8,9]. Deleterious phase precipitation can generate sensitisation, a nanometric Cr-depleted area in grain boundaries [8,10 14].
Sigma (σ) phase is one of the most studied deleterious phases that can be present on DSS and SDSS [12,13,15 33]. Temperature Time Transformation (TTT) diagrams show that this phase is usually formed in the 800-950°C temperature range [34 36]. Sigma phase precipitation can occur in δ/δ and δ/γ boundaries, and growth consuming the δ-phase, according to equation δ → σ + γ2 in a lamellar or divorced eutectoid decomposition of ferrite [17,20–23,37 42]. According to Chen et al [23] the divorced eutectoid decomposition of ferrite that forms more coarse particles of sigma occurs more intensely in temperatures above 900°C due to a high diffusivity of the elements in higher temperatures. The secondary austenite (γ2) also is forming in this process or independently in δ/δ interfaces [20,22,32,39,43,44].
The manufacturing process changes the microstructure of these alloys, influencing their properties. The materials are exposed to many variables such as forces and temperatures during manufacture [45]. Cold work is defined by the plastic forming done below the recrystallisation temperature. Similarly, hot work is plastic forming done above the recrystallisation temperature [46]. When the steels are exposed to high temperatures, the phenomenon called grain growth may happen [47]. Grain Growth usually is comprehended as the increase in average grain size in single-phase materials or the increase in matrix grain size in a material with precipitates or second-phases [48,49]. Therefore, it is common to meet coarse grains in hot-worked materials and fine grains in cold-worked materials.
The grain size can strongly influence the deleterious phases precipitation behaviour. Pardal et al [20 22] studied the effect of grain size on deleterious phases precipitation in a UNS S32750 SDSS with two different grain sizes 24-29 µm (fine-grained) and 132-138 µm (coarse-grained). A reduction in the kinetics of deleterious phases precipitation was observed with the increase in grain size. Once deleterious phases nucleation is initiated at δ/δ and δ/γ interfaces, faster kinetic of precipitation was attributed to the fact that steels with the fine-grained had more sites for nucleation. Also, coarser particles of sigma and secondary austenite phases were observed in the fine-grained SDSS, which can indicate a prevalence of divorced eutectoid decomposition of ferrite.
One of the ways to evaluate the presence of deleterious phases in stainless steel is by electrochemical techniques. The double-loop electrochemical potentiokinetic reactivation (DL-EPR) is one of the most recurrent tests to evaluate deleterious phase precipitation. This test determines the degree of sensitisation (DOS), which measures Cr-depleted zones intensity. DL-EPR test was developed and optimised to analyse austenitic stainless steel [50,51]. Subsequently, it was adapted and applied in other stainless steels like martensitic[52 54], ferritic[55,56] and duplex [57 67].
ISO 12732 [64] suggests an electrolytic solution containing HCl 3.0 mol L−1 for DL-EPR tests in DSS and SDSS. To optimise the technique's results and make them more coherent, some researchers applied modifications, normally using H2SO4 and KSCN in a higher concentration than the original for austenitic stainless steels and adding NaCl [37,57,58,68,69]. In other works, the researchers used an electrolytic solution composed of H2SO4 and HCl [70–73]. Owing to the variation of compounds in the solution reported in the literature and the wide range of concentrations used, we can verify no consensus on the optimal conditions for the test.
Meanwhile, some studies used transpassive dissolution of elements such as Cr and Mo, present in more significant fractions in the deleterious phases, to quantify these phases directly [74 76]. Haskel et al [75] evaluated aged specimens of UNS S31803 DSS using a linear sweep voltammetry (LSV) technique in a KOH solution as an electrolyte. Wang et al [76] studied Laves phases in a martensitic stainless steel using LSV technique and KOH solution. In more recent work [77], LSV test parameters (initial potential, scan rate and KOH concentration) were optimised by Doehlert matrix design. The optimised test parameters were the KOH concentration of 3.55 mol L−1, scan rate of 3.42 mV s−1 and initial potential of −0.818 V. Using these parameters, the LSV-KOH showed an excellent linear correlation between the volumetric fraction of deleterious phases (sigma and chi) precipitated and charged density in a UNS S32750 SDSS with coarse grain.
The main aim of this paper was to compare the efficiency of LSV-KOH and DL-EPR techniques in the analysis of SDSS microstructural changes. This work investigated the identification of deleterious phases presence, the accuracy of quantitative analysis of deleterious phases volume fractions, and the morphology of deleterious phase precipitation. It also investigated the effects of grain size on LSV-KOH parameters.
Experimental
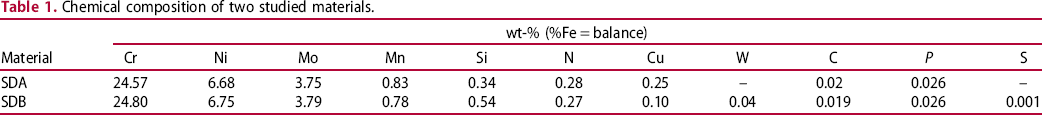
Chemical composition of two studied materials.
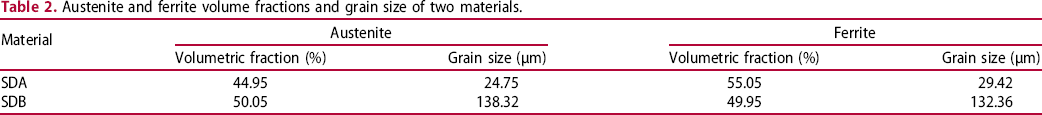
Austenite and ferrite volume fractions and grain size of two materials.
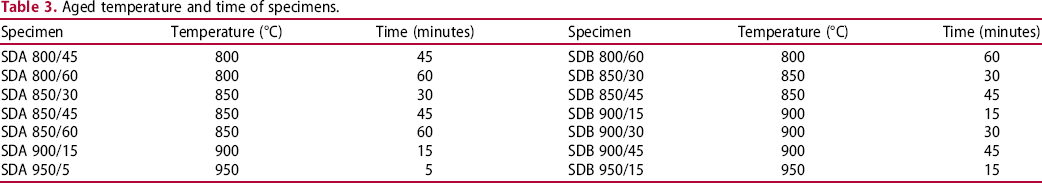
Aged temperature and time of specimens.
The microstructure analysis was made by quantitative metallography using light optical microscopy (LOM). The samples were metallographically prepared by grinding, polishing, and chemical or electrochemical etching. An electrochemical etching with 15% KOH solution applying 3 V for 12 s was used to investigate the deleterious phase precipitation after heat treatment. In as-received samples, chemical etching with Beraha's reagent (100 mL H2O + 20 mL HCl + 0.3-0.6 g K2S2O5) was used. The volume fractions of each phase were determined by digital image processing using Image Tools free software [78]. Figure 1S (electronic supplementary data file) shows an example of a LOM image which was used for deleterious phases volume fraction quantification. The original image (Figure 1Sa) is treated and converted into an 8-bit image, grey scale format. Austenite becomes light grey, ferrite dark grey and sigma/chi are the black areas, then a threshold is set to convert the image into a binary version (black or white), turning grey areas into white as shown in Figure 1Sb. Finally, the software calculates the fraction of the black area. The average volume fraction of DP (or austenite/ferrite in the case of the as-received) was calculated by the analysis of 20 images for each specimen.
The LSV-KOH and DL-EPR electrochemical tests were conducted using two multichannel potentiostats, a Metrohm Autolab PGSTAT204 and an Ivium-n-Stat. The electrochemical tests were conducted using a three-electrode conventional electrochemical cell, a platinum rod as a counter electrode, an Ag/AgCl electrode (with a 3.0 mol L−1 solution of potassium chloride) as a reference electrode, and the sample as the working electrode. Before the experiments, the specimens were ground sequentially with 100, 220, 400 and 600 emery paper, cleaned in an ultrasonic bath for 5 min, degreased with alcohol, and dried.
The parameters used in the LSV-KOH test are the same ones that were optimised in previous work [77]. During this last work, a multivariate experimental design, Doehlert matrix, was employed in order to optimise the three parameters involved in the LSV-KOH test: KOH solution concentration, initial potential and scan rate. The analytical response that was optimised was R2 when DP volume fraction (LOM) is plotted against the Peak 1 half charge density (this peak is correlated to deleterious phases dissolution). The half peak charge density is obtained by integrating the voltammogram from the potential, which current density is zero, to the potential which the first peak has a maximum current density. Figure 2S (electronic supplementary data file) shows an example of the region that was integrated to obtain the half peak charge density. In this example, the voltammogram was integrated from 0.3 V (0.0 Current density) to 0.12 V (Peak 1 maximum current density). The fraction of DP present in the specimen does not shift Peak's 1 potential significantly.
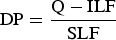
The KOH solution concentration was 3.55 mol L−1. The test started with a pre-treatment, (Ei = −0.818 V; t = 60 s). Then, the anodic sweep was initiated at a scan rate of 3.42 mV s−1 and continued until the current density reached 1 mA cm−2. From these optimised factors was obtained a linear regression (R2 = 0.998) with a slope of 0.067 (SLF) and an intercept of 6.37 (ILF). The deleterious phase volume fraction using the LSV-KOH test was then determined by Equation (1). The determination of the equation can be seen in previous work [77].
The DL-EPR tests were performed to evaluate the degree of sensitisation (DOS) due to the precipitation of deleterious phases. These tests were conducted in 2.00 M H2SO4 + 0.01 M KSCN + 0.50 M NaCl solution at room temperature. This electrolytic solution had been previously applied in other works to study the precipitation of deleterious phases in duplex stainless steels [37,57]. The test starts with stabilising the open circuit potential (EOCP) for 30 min. Then, from the EOCP, the potential was swept in the anodic direction with a scan rate of 1.0 mV s–1 until +0.7 Vvs EOCP. Then, the scan was reversed in the same scan rate in the cathodic direction until it reached the EOCP. The degree of sensitisation (DOS) was evaluated using the Qr/Qa ratio. Where Qa is charge density of the peak formed in anodic scan and Qr is the charge density of the peak formed in the cathodic scan.
Results and discussion
Figure 1 shows the microstructure of SDA and SDB steels in as-received conditions. These images have the same magnification, which clarifies the difference between the grain size of the two analysed steel. Table 2 shows the average grain size of each sample. The SDA specimen has a finer grain than the SDB.
Microstructure of As-received SDA and SDB specimens.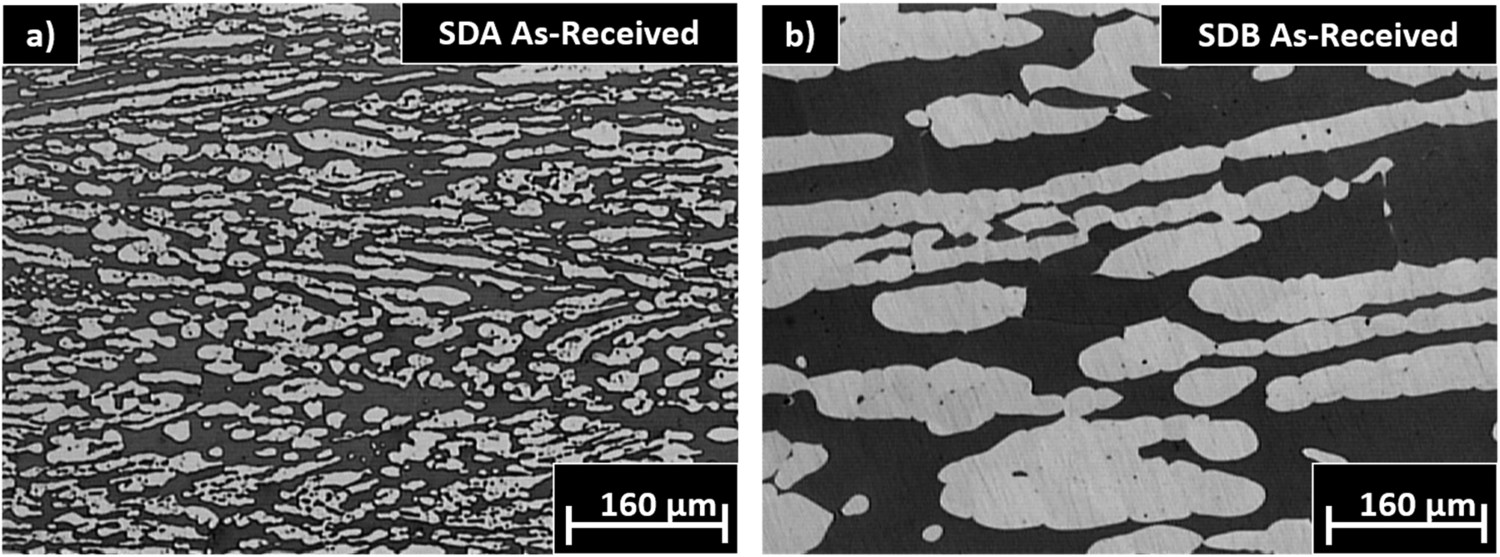
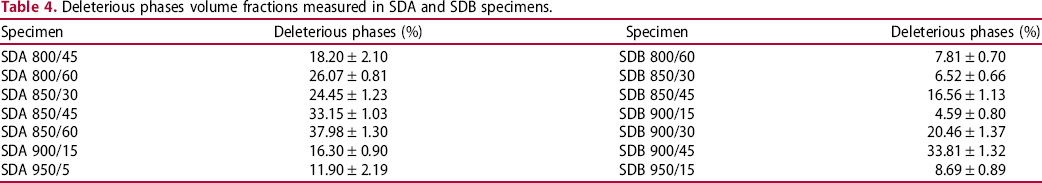
Deleterious phases volume fractions measured in SDA and SDB specimens.
Two typical curves of a DL-EPR test for SDSS are presented in Figure 2. The voltammogram shows a high current reactivation peak for SDA 850/45 specimen (Figure 2(a)), indicating a high sensitisation process. Already, for specimen SDB 900/15 (Figure 2(b)), the voltammogram did not present a reactivation peak, indicating that not occur sensitisation process. Despite the SDB 900/15 specimen having a significant amount of deleterious phase.
DL-EPR curves of specimens: (a) SDA 850/45 and (b) 900/15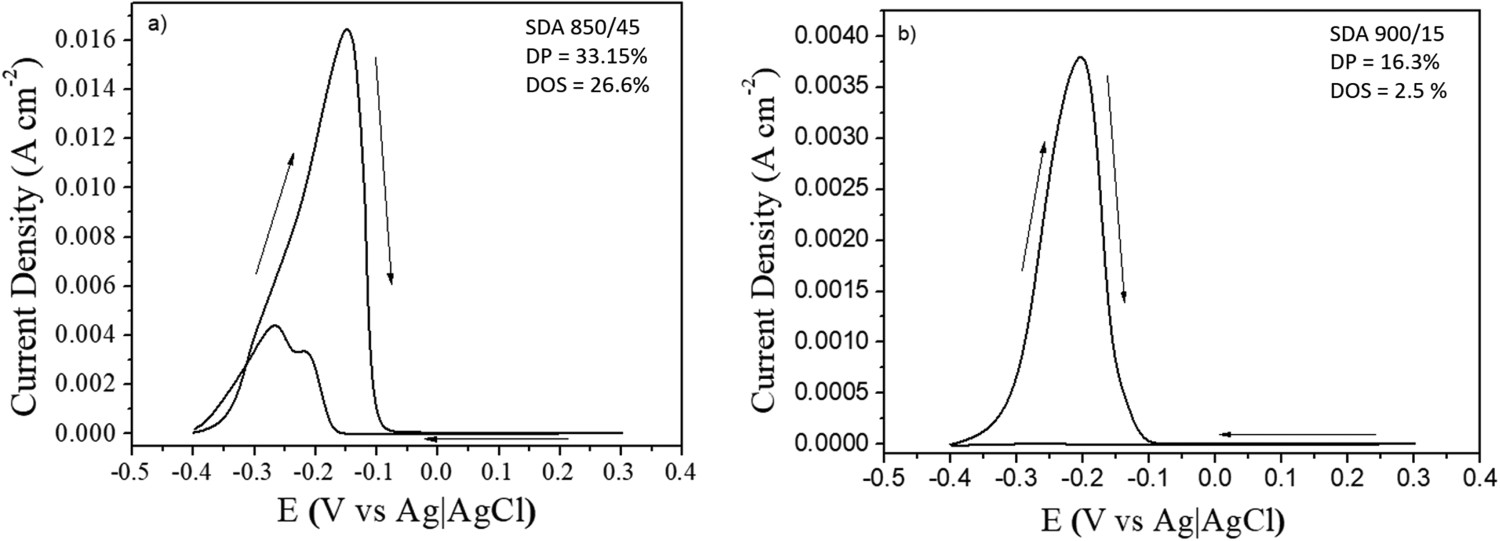
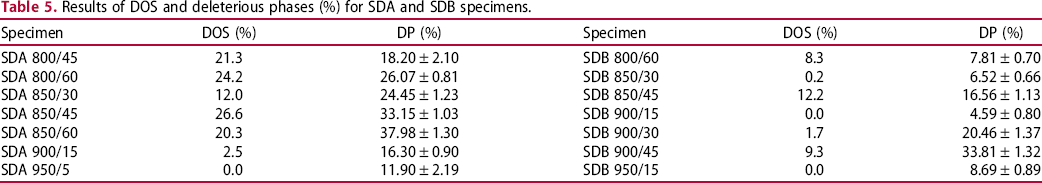
Results of DOS and deleterious phases (%) for SDA and SDB specimens.
As mentioned earlier, several attempts to optimise the DL-EPR test conditions like electrolyte, scan rate, and temperature were made over the years [57,61,70]. One point that became very clear, is that apparently it is not possible to develop a DL-EPR unique protocol to analyse all classes of duplex stainless steels.
Some researchers obtained better results for the UNS S32750 SDSS when increasing the electrolytic solution test temperature [37,73]. In the previous work Pardal et al [37] show that by increasing DL-EPR test temperature to 40°C the results are more befitting with deleterious phase measured in quantitative metallography. However, the increasing test temperature is unfeasible for the in situ measurements.
Despite the problems presented by the DL-EPR test, there is an electrochemical technique capable of directly analysing the deleterious phases, especially the sigma phase. When we perform linear sweep voltammetry (LSV-KOH), mainly in an alkaline medium [74,75,77,79], deleterious phases have a preferential dissolution. This preference occurs due to the transpassive dissolution of the Cr and Mo, elements present in more quantity in the deleterious phases. Our group optimised this technique to obtain a linear response between the deleterious phases volume fraction and the charge density obtained in the voltammogram in our previous work [77]. This work proved that it is possible to detect and quantify small amounts of sigma and chi phases using LSV-KOH. Thus, with the optimised LSV-KOH test is possible to analyse the amounts of deleterious phases present in a heat-treated specimen of UNS S32750 SDSS. LSV-KOH is more accurate than DL-EPR, which measures the sensitisation process and doesn't measure the deleterious phases.
Figure 3 presents the typical voltammograms obtained in the LSV-KOH test. Figure 3(a) represents the as-received SDA specimen voltammogram. As we can see, this curve has only one transpassivation peak (P1). This specimen does not have deleterious phases, as shown in Figure 1. Figure 3(b,c) represent the LSV-KOH result for specimens after heat treatment, with deleterious phase presence. The voltammograms for SDA 800/45, SDA 850/30, SDA 800/60, SDA 850/45 and SDA 850/60 are presented in Figure 3S (see electronic supplementary data file). Unlike the as-received condition, the SDA 950/5 voltammogram shows two peaks (P1 and P2) and SDA 900/15 three peaks (P1, P2 and P3). Therefore, it is possible to distinguish whether the deleterious phase is present or not from the number of transpassivation peak. The LSV-KOH is a simple method for the qualitative identification of deleterious phases.
Examples of LSV-KOH voltammograms for specimens: (a) as-received; (b) SDA 950/5; (c) SDA 900/15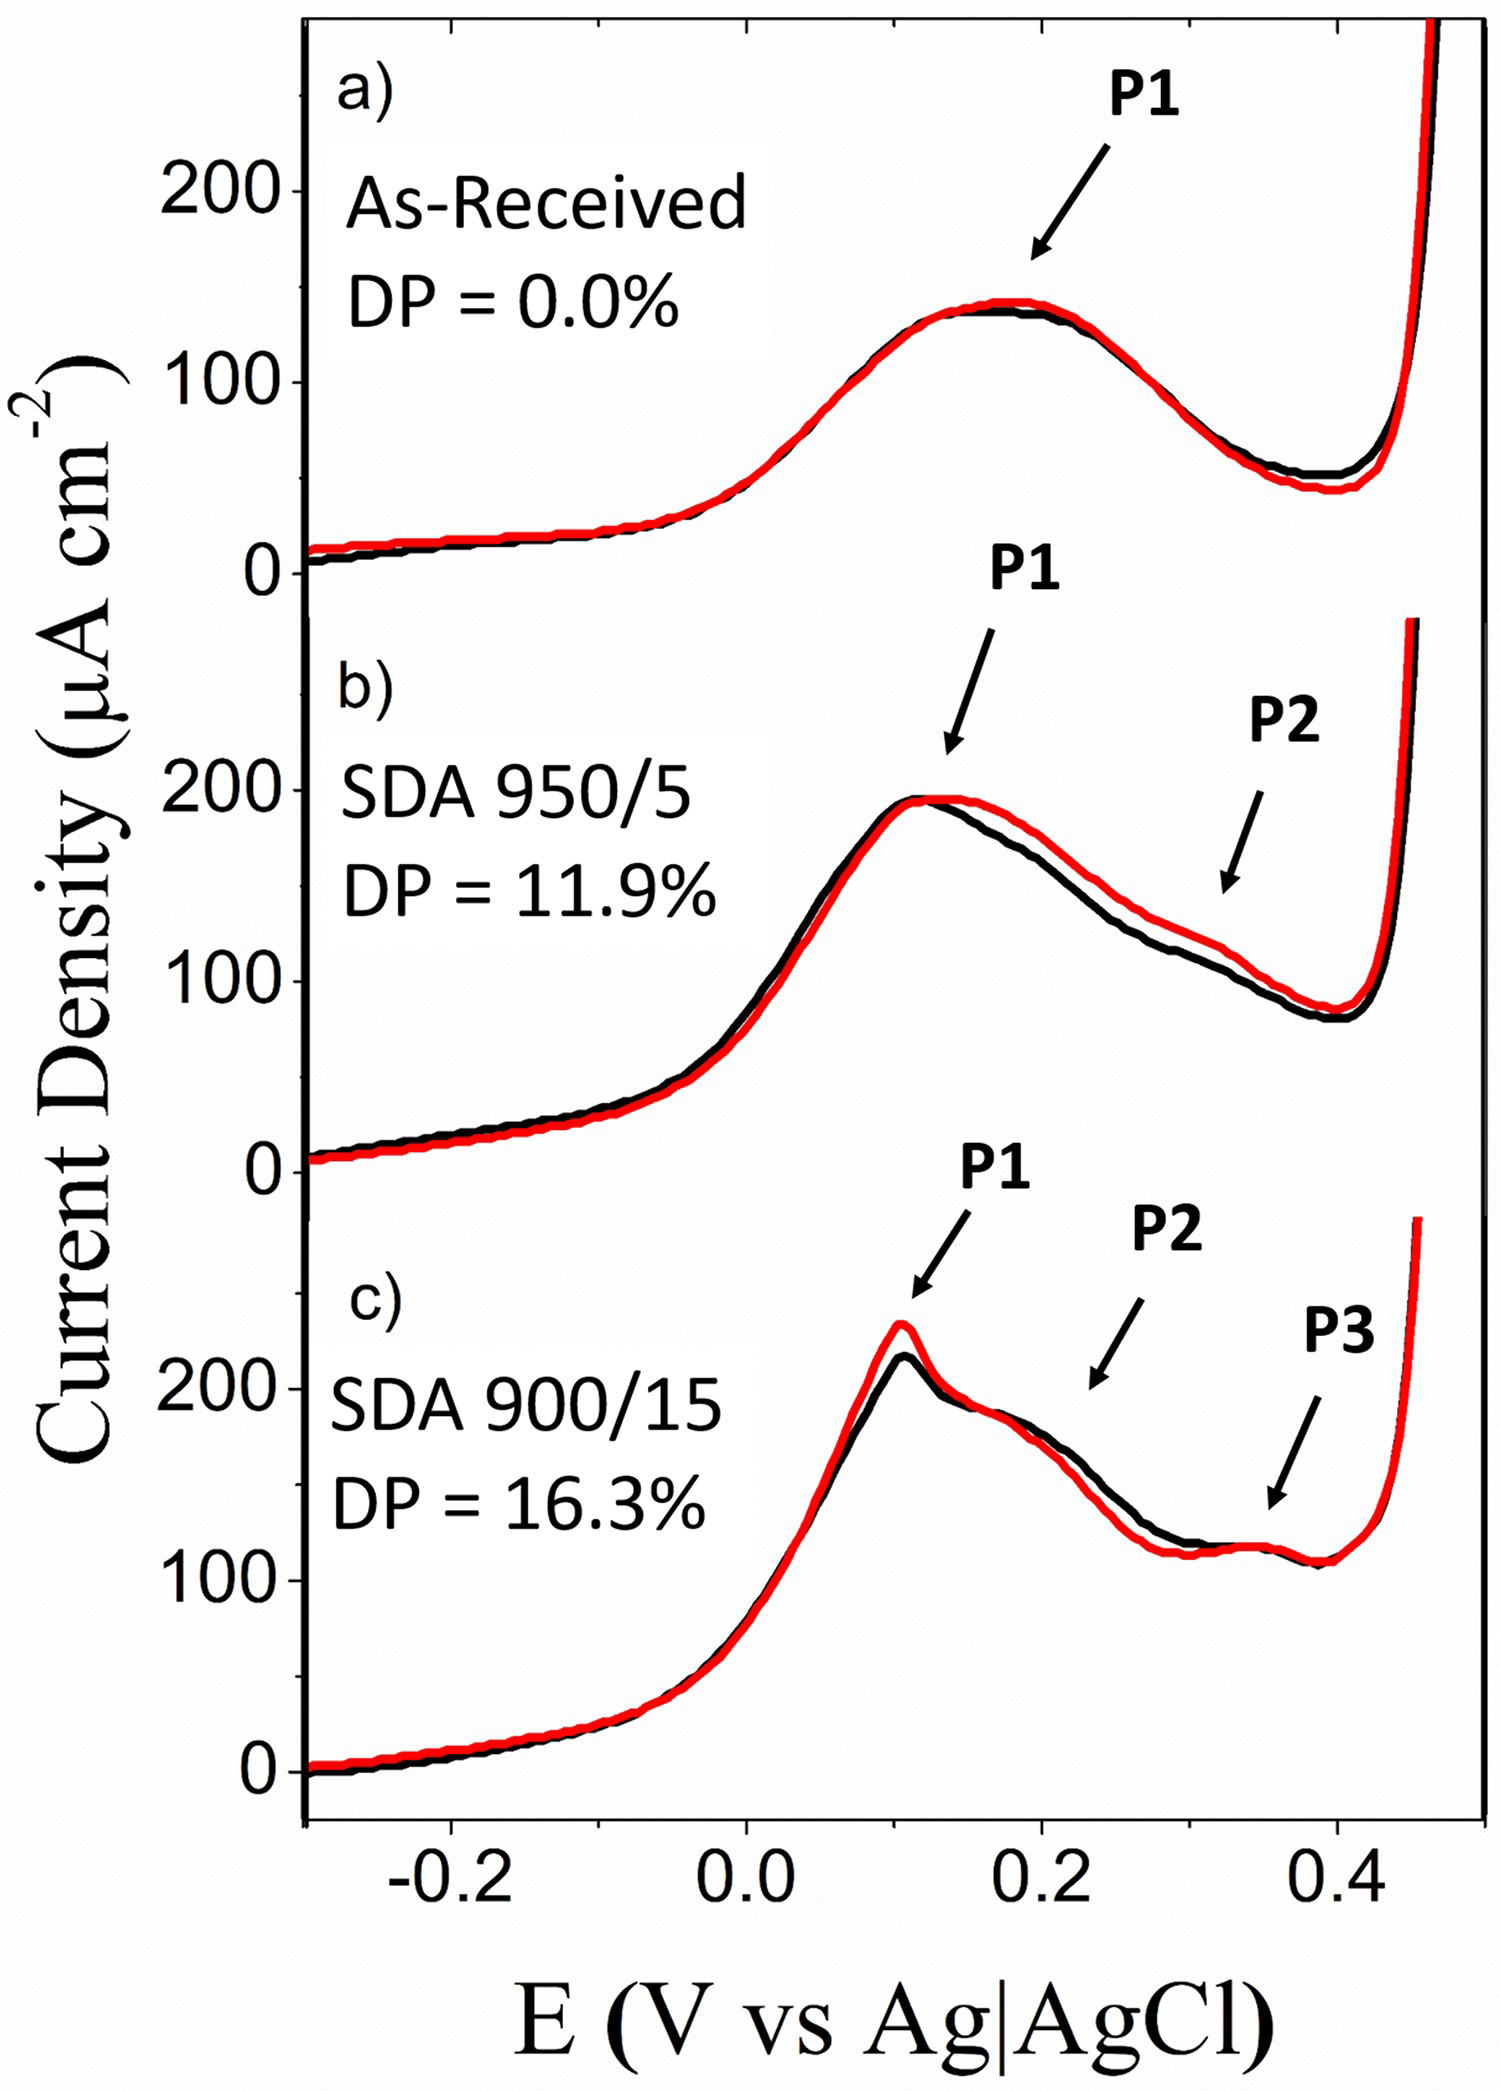
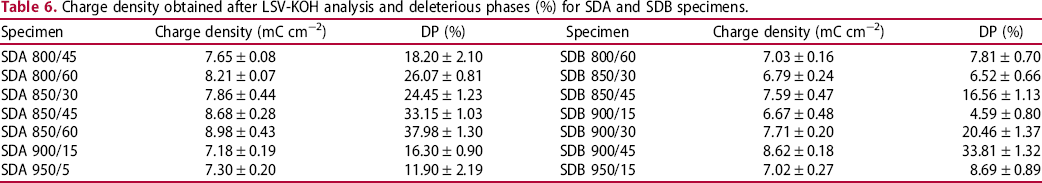
Charge density obtained after LSV-KOH analysis and deleterious phases (%) for SDA and SDB specimens.
The previous work employed the SDB specimens to optimise the LSV-KOH test [77]. Figure 4S (see electronic supplementary data file) shows the linear regression obtained after optimisation. Figure 4 shows the same curve with the addition of other SDB and SDA specimens. It's clear that have no significant change in curve slope and intercept. Thereby, the LSV-KOH can quantify deleterious phases volume fraction in SDA specimens.
Charge density vs. DP with linear regression of SDA and SDB specimens.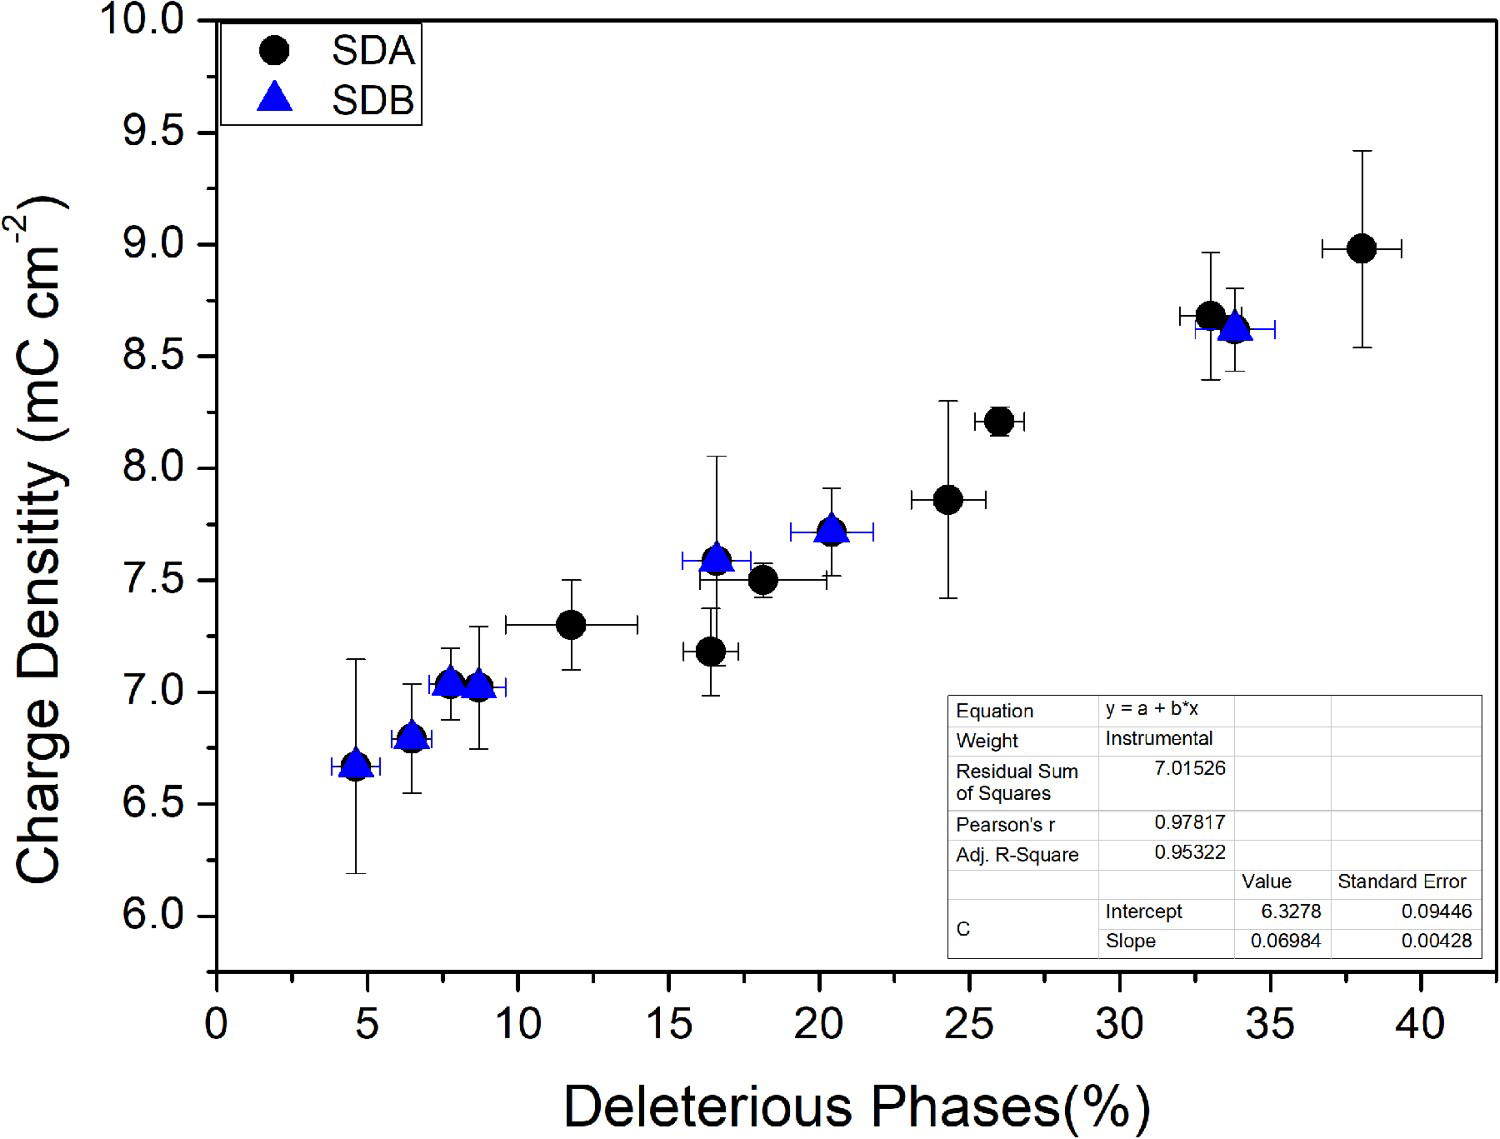
Figure 5 compares the values of volume fractions of the deleterious phase determined by quantitative metallography, LSV-KOH, and DL-EPR for SDA specimens. Table 1S (see electronic supplementary data file) summarises these results numerically. The LSV-KOH values were obtained by applying Equation (1), using ILF as 6.37 and SLF as 0.067. The DL-EPR values are the DOS values presented in Table 5. And the quantitative metallography values were obtained by Image Tools software and shown in Table 4. In Figure 5 it is observed that the LSV-KOH can obtain values much closer to those obtained in the LOM than those obtained in the DL-EPR.
Comparison between LOM, LSV-KOH and DL-EPR.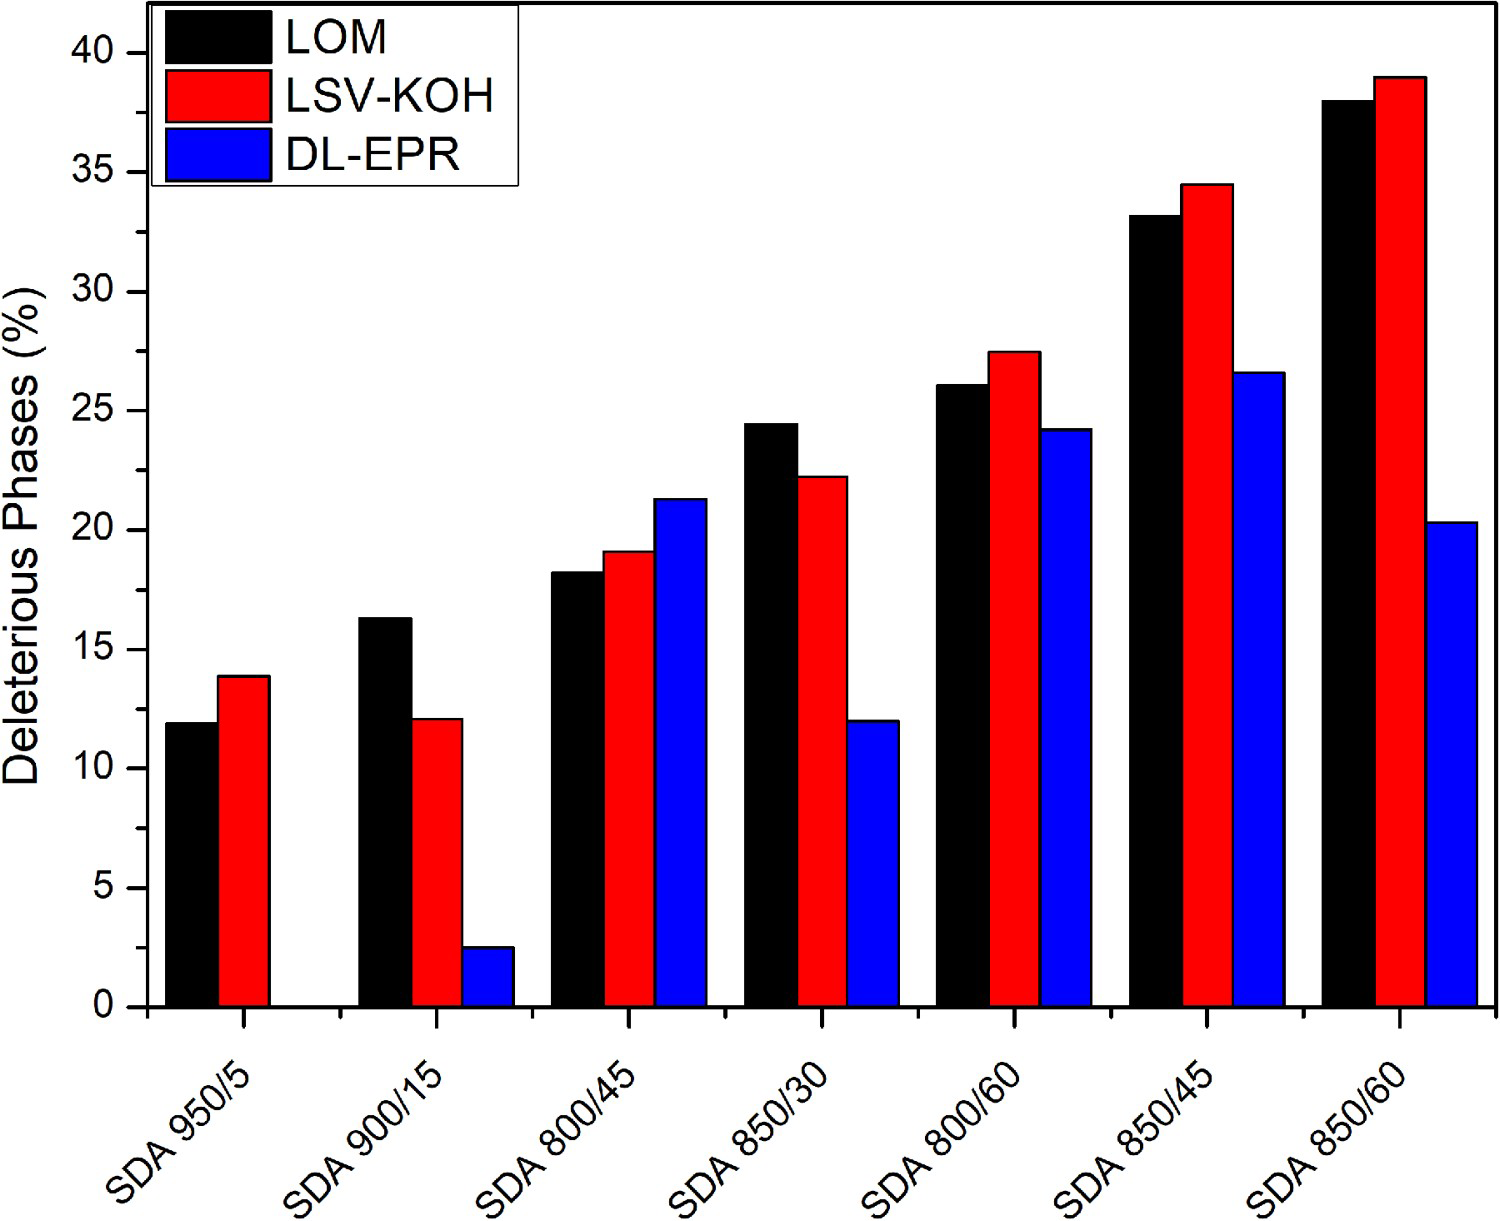
Error of the LSV-KOH and DL-EPR analyses in relation to the real value of DP.
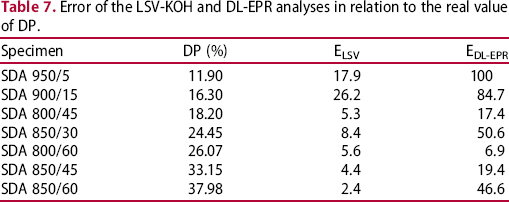
The deleterious phases values obtained in LSV-KOH presented minor errors than those obtained in DL-EPR. As expected, this indicates that the LSV-KOH technique is more applicable to quantify the deleterious phase in duplex stainless steels, even in materials with different grain sizes. A point to highlight is the specimen SDA 950/5, which evidences the impossibility of using DL-EPR tests to identify deleterious phases. As observed in the literature, for the SDSS grade studied in this work, a healing process occurs when the heat treatment is done at 950°C [37,80] which justifies the error of 100% in DL-EPR tests for this specimen. The DL-EPR identifies the sensitisation, but this specimen had a desensitisation process due to healing. The detection of deleterious phase in specimens that the DL-EPR cannot detect is one more advantage of the LSV-KOH.
In fact, until here, the DL-EPR is the most used electrochemical test to assess sensitisation and the presence of deleterious phases in stainless steels. With one experiment, we obtain the value of deleterious phase volume fraction present in the specimen, theoretically without the need for a reference curve. This simple methodology could be an advantage for the DL-EPR test compared to the LSV-KOH test. However, many optimisations for the quantitative and even qualitative applications are necessary for each stainless steel class and grade [61,70–73,81]. Some authors consider acceptable conditions that produce less than 10% DOS in a deleterious phase free specimen.[61,72,81] and this criterion can lead to mistakes regarding the presence of a deleterious phase. In addition, for more accuracy, it is imperative to apply a reference curve of DOS values using standard specimens [82].
De Assis et al [61] and Muri et al [82] observed a good relationship between the deleterious phase volume fraction and DOS values. Nevertheless, this relationship was not linear. In this work, we do not obtain uniformity in the DOS results even between samples of the same material (with differences in heat treatment temperature and grain size). Different from what was observed in the LSV-KOH (Figure 4).
This work indicates a methodology that uses the optimised LSV to analyse the deleterious phase in duplex stainless steels. If the specimen presents a single transpassivation peak, it can be concluded that the sample does not have a deleterious phase. In this case, a reference curve is not necessary. Deleterious phase presence was identified when the specimens had two or three transpassivation peaks. In these cases, it is necessary to construct a reference curve with standard specimens for quantitative analysis. But, unlike what happens in the DL-EPR, the LSV-KOH parameters were optimised to have a linear response between the charge density of Peak 1.
This peak is present in all specimens and is correlated to Cr and Mo transpassive dissolution [74,83 88]. Since δ, γ and σ have different Cr content, this could lead to a disproportional attack of KOH in these phases, and this behaviour is the key to quantification. For example, Grutzner and Schuller [89] worked with monophasic steels containing only one of those phases (δ, γ or σ). They perform electrochemical tests in NaOH 10N and observed a similar behaviour that was observed in the present paper. They found that ferrite (δ), austenite (γ), and sigma (σ) have distinct charge density contributions in Cr transpassive dissolution, in order: γ < δ < σ. In fact, this behaviour is observed in KOH etching widely used quantitative metallography, where sigma phase is substantially more affected followed by ferrite and austenite, respectively. Once these phases are present in most of the SDA and SDB specimens, Peak 1 has a certain contribution from ferrite (δ), austenite (γ) and sigma (σ). However, due to differences in chromium concentrations sigma phase has the major contribution. This way, as the ferrite decomposes into sigma, peak 1 tends to grow. Thus, it is possible to employ Peak 1 half charge density as a quantitative measure of sigma phase content in specimens.
Presence of two or three peaks for SDA and SDB specimens.
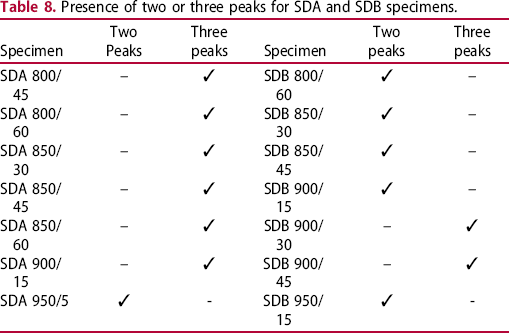
The appearance of one or two additional peaks can be related to many factors, such as phases chemical composition, deleterious phases fractions, preferential oxides formation on the surface, deleterious phases morphology, etc. However, evidence was found that this behaviour can be preferentially associated to deleterious phases morphology.
As mentioned earlier, the sigma phase can precipitate associated with secondary austenite (δ → σ + γ2) in lamellar or in blocks (divorced) shapes [17,20–23]. Initially, sigma phase nucleation occurs in δ/γ and δ/δ interfaces. In this stage, precipitation kinetics is fast due to the elements’ proximity that will preferentially form the sigma phase. This precipitation can be associated to lamellar shape.
In the second stage, the kinetics of sigma phase precipitation is controlled by diffusion of Cr and Mo from more distant regions. In this stage, sigma grows slowly but can reach more coarse grains, growing inside the ferritic phase [90–93]. In this stage, block-like morphology was preferential, resulting in a decreased sigma phase boundary density compared with the first stage.
The moment that this transition occurs is governed by temperature and grain size. Temperature increases the diffusivity of Cr and Mo, providing a coarsening of sigma in early aging times. In fine-grained materials, like SDA specimens, it is expected that the precipitation inside the ferrite grain and the formation of larger blocks of sigma start at lower temperatures and times. Thus, temperature, grain size and aging time will govern the sigma phase preferential morphology [17,20–23,37 39,91,94].
The morphology of the sigma phase can influence some properties of SDSS, such as corrosion resistance [95,96]. Hosseini et al [96] showed that lamellar shape promotes a corrosion resistance decrease more prominent than block-like shapes. And according to Michalska and Sozanska [26], the time of aging, which influences the sigma morphology, can induce changes in the chemical composition of the phases present in specimens. These finds indicate that sigma boundary zones formed in the first precipitation stage (lamellar morphology) have different chemical compositions than those formed in the second stage (block-like morphology). The lowest intensity of the diffusional process in the first stage creates zones more depleted in Cr and Mo and rich in Ni [97].
This shows that it is crucial to correlate the precipitation kinetics in the aging specimens to the DP morphology. Figure 6 organises all specimens according to precipitation stage and, consequently, according to sigma morphology. Based on a previous work by Pardal et al [20], the temperature and time at which the higher rate of sigma precipitation is reached for SDA and SDB specimens were determined. In Figure 6, the black line divides the graph into two areas, before and after the maximum precipitation rate. The SDA and SDB specimens were then organised in the graph. We can see that specimens with two peaks are at the black line or positioned on the left side, and specimens with three peaks are at the black line or positioned on the right side.
Comparison between aging time and temperature with maximum precipitation rate.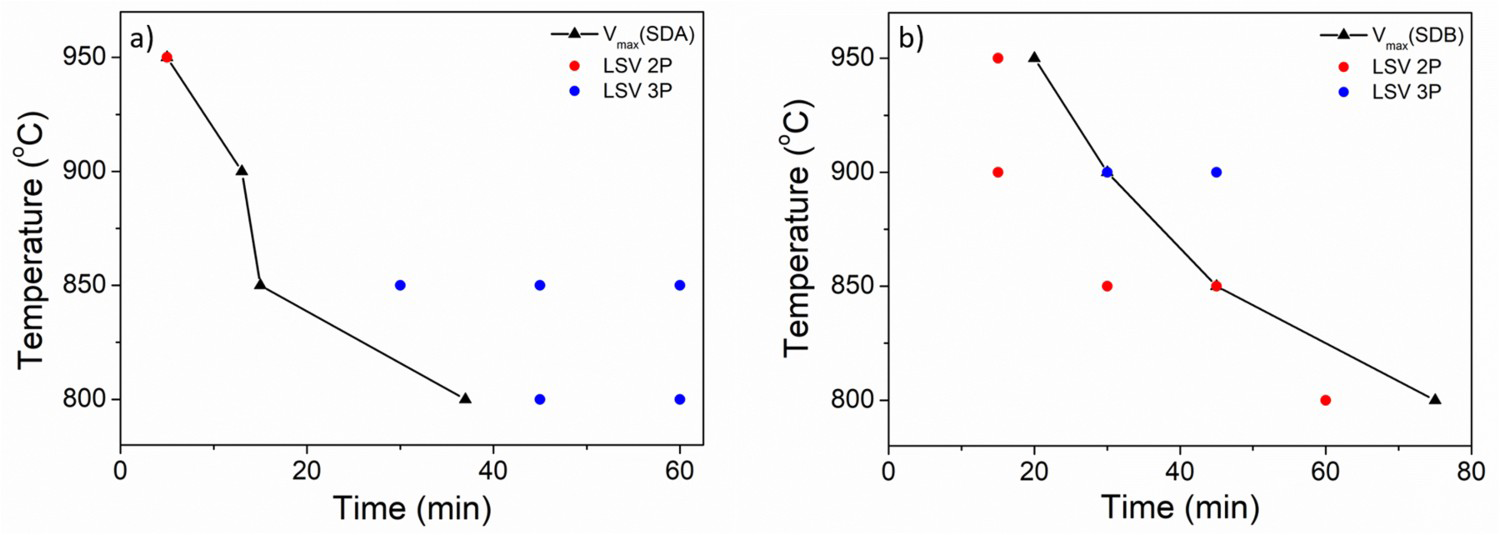
To exemplify, Figure 7 shows the microstructure of some SDA and SDB specimens. For SDA 950/5 (Figure 7(a)) and SDB 900/15 (Figure 7(c)), the precipitation of deleterious phases occurs in lamellar shape and are still focused on δ/δ and δ/γ grain boundaries. For SDA 900/15 (Figure 7(b)) and SDB 900/30 (Figure 7(d)), the sigma phase precipitation begins inside the ferrite grains in lamellar and divorced mechanisms. When the precipitation form changes from lamellar to divorced, large blocks of the sigma phase are observed growing inside the ferrite. In this way, sigma phase boundaries become smaller with a different composition from those generated in the first stage. In these specimens are observed three peaks.
Microstructure of specimens (a) SDA 950/5; (b) SDA 900/15; (c) SDB 900/15; SDB 900/30.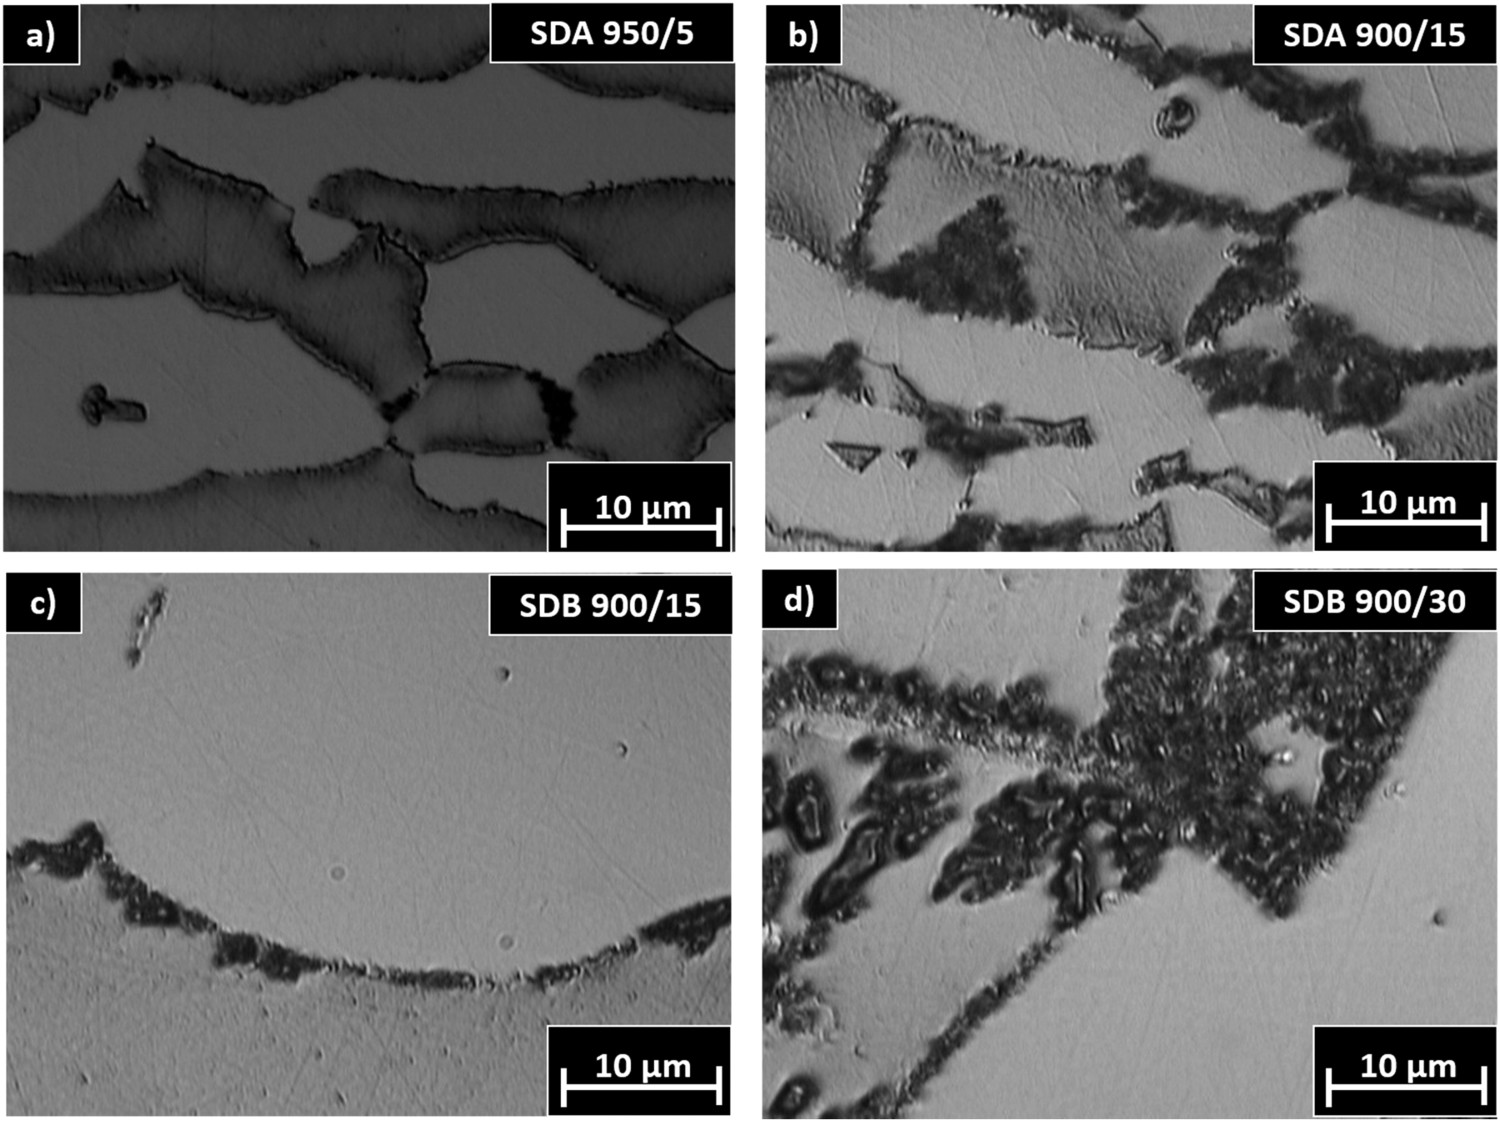
In summary, when sigma formation is in the early stages and finer precipitates (lamellar-like morphology), we observe the presence of two peaks in voltammograms. When the sigma precipitated starts to get larger (block-like morphology), we have voltammograms with 3 peaks due to these large blocks and the fine precipitates that are still present. The second peak near oxygen evolution is associated with Ni (II) to Ni (III) transition [83–86,88], preferentially localised in sigma phase boundaries. It is often related that Ni is not present in passive film [98,99]. Meanwhile, this association can be explained because it has regions with very low Cr and Mo content. And these regions have more contribution from Ni in the passive film. When the sigma phase nucleates, Cr and Mo are concentrated in sigma while Ni is rejected, generating a high Ni region in sigma boundaries leading to secondary austenite formation [90,91,95,100 102]. Peak 3 arises in specimens in the second stage of sigma precipitation, that is, in the moment of coarsening of sigma grains. At this moment, the steel has two types of Cr and Mo depleted areas, the first one which was formed in the earlier stages of precipitation and the second formed in the late stages. The first is more depleted in Cr and Mo and richer in Ni than the second [96,97].
Conclusion
In this study, we can conclude:
LSV technique using KOH as an electrolytic solution was more accurate in deleterious phase quantifying than the classical DL-EPR technique. In SDA (fine-grained), a reduction of associated error in LSV-KOH in relation to DL-EPR was observed. In specimens with the healing process, in which DL-EPR has shown that it cannot detect sensitisation, the LSV-KOH was able to detect and quantify the amount of deleterious phase present, which is the major objective of this work.
In addition, LSV-KOH can give information about the morphology of the precipitates. When the voltammograms present two peaks, the sigma phase is precipitated in a lamellar shape. When three peaks are present, the sigma phase is precipitated in lamellar and block forms. This feature is better observed in fine-grained steel (SDA) since these specimens have a superior deleterious phase kinetics formation than coarse-grained steel (SDB). These one or two additional peaks have a great concordance with observed morphology and are correlated to Ni behaviour in Cr and Mo depleted zones in sigma boundaries.
Author contributions
Footnotes
Acknowledgements
M. T. G. de Sampaio thanks Conselho Nacional de Desenvolvimento Científico e Tecnológico – Brazil (CNPq 141755/2020-2) for the scholarship received and Fundação de Amparo à Pesquisa do Estado do Rio de Janeiro (FAPERJ, E-26/102.971/2012, E-26/111.407/2013 and 26/202.790/2015 and E-26/201.145/2022) for all their financial support. A. R. Pimenta thanks to Fundação de Amparo à Pesquisa do Estado do Rio de Janeiro (FAPERJ, E-26/211.412/2021). The authors acknowledge of the Brazilian research agencies (CAPES, FAPERJ and CNPq) for the financial support. This study was financed in part by the Coordenação de Aperfeiçoamento de Pessoal de Nível Superior – Brasil (CAPES) – Finance Code 001.
Disclosure statement
No potential conflict of interest was reported by the author(s).
Data availability statement
The data that support the findings of this study are available from the corresponding author upon reasonable request.