
Abstract
The intergranular corrosion behaviour of Al-Cu-Li-Sc alloy with different microstructures was systematically investigated in this work. The SKPFM characterisation revealed that the AlCuSc (W) phase has more negative potential compared to the Al matrix and undergoes dealloying in the intergranular corrosion solution. The dealloying rate of the W phase in the corrosive solution is relatively slow, which does not lead to serious pitting characteristics. As denser anodic T1 precipitates formed on low-angle grain boundaries of the partially recrystallised sample will reduce the precipitates on the sub-grain interior, resulting in the low-angle boundary being prone to preferential corrosion and reduced intergranular corrosion resistance. The complete recrystallised sample exhibits corrosion of grain interior and propagates along corroded bands parallel to {111}Al habit planes of T1 precipitates, reducing the expansion rate of corrosion along the grain boundaries. Restraining the IGC along the low-angle grain boundary and inducing crystallographic corrosion to improve the intergranular corrosion resistance.
Introduction
The application demand for structural material is increasing in the aerospace industry, especially for Al-Cu-Li alloys with numerous excellent properties (high specific strength, greater elastic modulus, low fatigue crack propagation rate, fine damage tolerance, and superior formability, etc.), so the development and research of such alloys have seen a growing interest in recent years [1 5]. However, corrosion resistance is one of the main reasons why the application of Al-Cu-Li alloys is limited [6]. Corrosion is also considered to be one of the main risks to the integrity of aviation equipment and can lead to a significant reduction in service life, such as intergranular corrosion, exfoliation corrosion, stress corrosion, and fatigue corrosion. Therefore, the corrosion resistance of Al-Cu-Li alloys has attracted much attention due to the reactivity of the Li element.
Numerous research results [7 11] have shown that the microalloying elements and heat treatment systems can modulate the type, size, number density, and distribution of strengthening phases in Al-Cu-Li alloys. In addition, the formation of various precipitates during the aging process has enabled the Al-Cu-Li alloy to obtain excellent mechanical properties. However, the distribution and structural variations of precipitates (e.g. δ′ (Al3Li), δ (AlLi), and T1 (Al2CuLi), etc.) may dramatically modify the corrosion resistance of Al-Cu-Li alloys [12 17], potentially resulting in corrosion failure during the service environment. The T1 precipitate has more negative potential than that of the Al matrix [13,18 20], and a large number of T1 precipitates are formed in the grain interior, which can reduce the potential difference between the grain interior and the grain boundary. Therefore, the susceptibility to intergranular corrosion can be reduced. Research by Huang et al. [21] showed that the corrosion mode in AA1460 alloy evolved from intergranular to intragranular with aging time. Furthermore, a phenomenological IGC corrosion diagram was produced, linking open circuit potential (OCP) progression to corrosion modes, which the various OCP ranges associated with the corrosion mode identified. As a result, the electrochemical test may be utilised to assess the evolution of corrosion resistance and to evaluate the corrosion parameters of Al-Cu-Li alloys.
Previous studies [22,23] have shown that the propagation of localised corrosion is related to the precipitation of T1 precipitates on {111}Al habitual planes of Al-Cu-Li alloys. The result of Ma et al. [24] showed that the localised corrosion of AA2099-T83 alloy is mainly manifested by selective corrosion of grain boundaries/sub-grain boundaries and grain interior due to T1 precipitates at the grain/sub-grain boundary and the dislocation of grain interior. The researchers [25] observed three corrosion modes in 1445 alloy during artificial aging: IGC (intergranular corrosion), SIGC (IGC along the sub-grain boundary), and SGC (sub-intragranular corrosion). The IGC in the recrystallised alloy is caused by the dissolution of T1 precipitates on high-angle grain boundaries (HAGBs), while the SIGC is caused by the dissolution of S′ precipitates on low-angle grain boundaries (LAGBs). According to the findings of Ott et al. [26], Li element segregation at grain boundaries causes considerable intergranular corrosion susceptibility in the underaged condition of AA2055 alloy. The local potential between grain boundaries and grain interior becomes ‘balanced’ in the peak-aged condition, reducing IGC. However, IGC is promoted when the extensive coexistence of Cu and Mg elements are separated towards grain boundaries in the overaged condition. Therefore, the above works suggest that intergranular corrosion susceptibility is mainly associated with the distribution characteristics of precipitates in Al-Cu-Li alloys. However, the effects of grain structures and precipitation characteristics on the corrosion behaviour of Al-Cu-Li-Sc alloys require further investigation.
In addition, the corrosion behaviour is closely related to the electrochemical inhomogeneity formed between the intermetallic particle and the Al matrix. These coarse intermetallic particles, which exhibit different potentials with respect to that of the Al matrix, act as cathode or anode and then undergo a selective attack in Al alloys. The coarse cathodic intermetallic particle mainly causes corrosion propagation along the periphery of the anodic Al matrix [27–30]. Because cathodic intermetallic particles may readily fall off the surface and leave pitting cavities, they can be more damaging as pit initiators. The result [31] has shown that Li is present in the AlCuFeMn particle, and the high-copper-containing Al-Fe-Mn-Cu-Li particle is electrochemically more active than the low-copper-containing Al-Fe-Mn-Cu-(Li) particle due to the presence of relatively high level of Li in the former. The anodic Al2CuMg particle with a more negative potential than that of the Al matrix. De-alloying of these intermetallic particles involves the selective dissolution of less-noble elements including Al, and Mg to form a noble remnant enriched in Cu. Then, these Cu-rich residues act as local cathodes, inducing corrosion of the surrounding Al matrix [32–35]. Some works [36,37] on the corrosion performance of pure aluminium have shown that severe plastic deformation treatment can improve corrosion resistance by fragmenting cathodic intermetallic particles. In addition, the addition of the Sc element in the Al-Cu-Li alloy may form the W(AlCuSc) phase during the homogenisation process [38]. There are a lot of reports [39 43] about the effect of Sc addition on the mechanical properties of Al-Cu-Li alloys. However, less research has been found about the effect of the W phase on the corrosion behaviour of Al-Cu-Li alloys.
Therefore, research on how to adjust the microstructure to improve the corrosion properties of Sc-containing Al-Cu-Li alloy is still lacking. The Sc-containing Al-Cu-Li alloy in this paper was first conventionally hot-rolled, then the solution and peak aging treated to obtain a microstructure with a high fraction of sub-grains. In addition, the recrystallisation kinetics is increased during the solution process due to the significant increase of grain energy storage and recrystallisation sites after the asymmetric cold rolling of the conventional hot-rolled sheet, which can effectively reduce the fraction of sub-grains. Therefore, this work focuses on the corrosion behaviour of Al-Cu-Li-Sc alloy in intergranular corrosion solution and reveals the relationship between the microstructure and corrosion resistance of peak aging samples with different recrystallisation fractions. The reasons for corrosion behaviour were comprehensively analysed, and it was found that the crystallographic corrosion after the formation of complete recrystallisation in the Al-Cu-Li alloy with a trace amount of Sc element was beneficial to improve corrosion resistance.
Experimental procedures
Material preparation
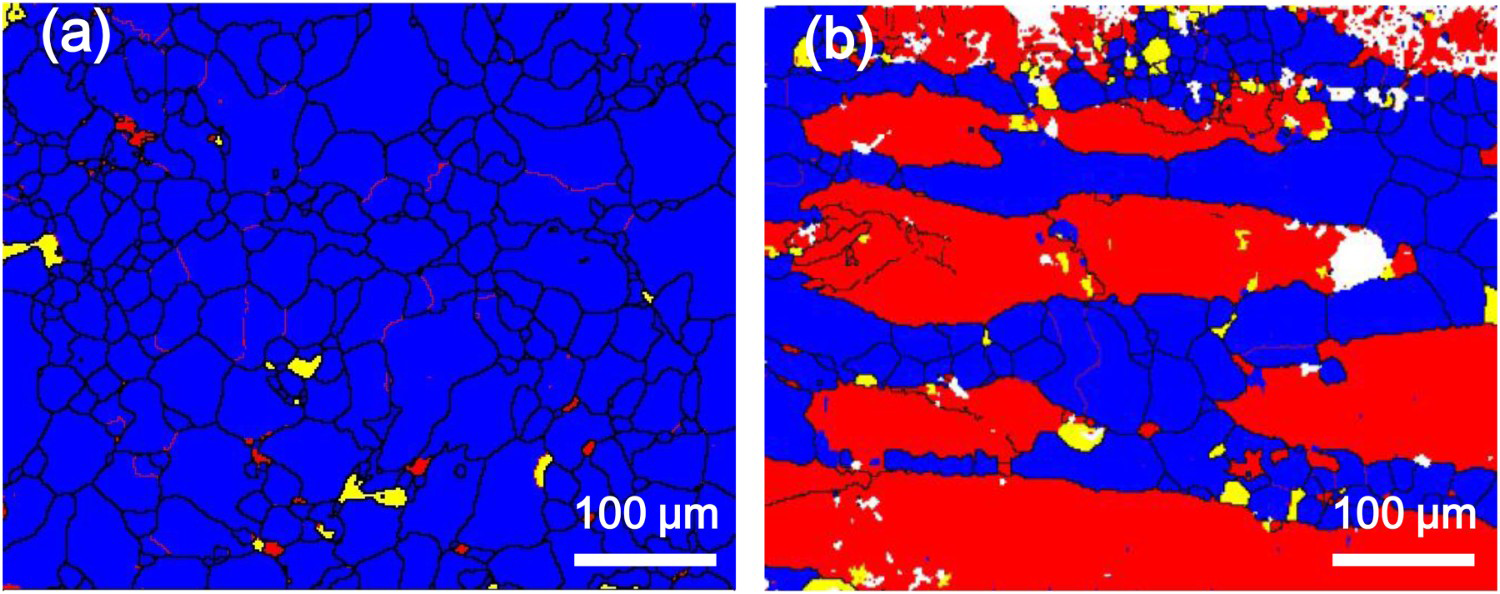
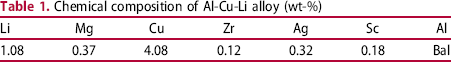
The composition of the Al-Cu-Li-Sc alloy employed in this study is shown in Table 1. Figure 1 shows a schematic diagram of the thermomechanical processes of the experimental alloy. The homogenously annealed ingot at 520°C for 48 h was preheated at 480°C for 2 h before hot rolling, and then the thickness was reduced from 25 to 5 mm by conventional hot rolling. The asymmetric cold rolling process is shown in the previously published article [44]. The asymmetric cold-rolled sheet was reduced by 90% to obtain different microstructures in subsequent heat treatment. The conventional hot-rolled sheet and asymmetric cold-rolled sheet were solution-treated at 520°C for 1 h and quenched, then immediately artificially aged to the peak state at 165°C. Figure 2 shows the distribution of recrystallised grains, sub-grains, and deformed structures of different rolled samples after solution treatment. Blue, yellow, and red denotes recrystallised grains, sub-grains, and deformed grains, respectively. Obviously, the conventional hot-rolled sheet and the asymmetric cold-rolled sheet showed a partially recrystallised structure (PRS) and complete recrystallisation structure (CRS) after solution and aging treatment, respectively. The abbreviations PRS and CRS mentioned below all refer to peak-aged samples.
Schematic diagram for the thermomechanical processes of the experimental alloy. Microstructure of partially recrystallised and complete recrystallised samples: (a) CRS, (b) PRS. Chemical composition of Al-Cu-Li alloy (wt-%)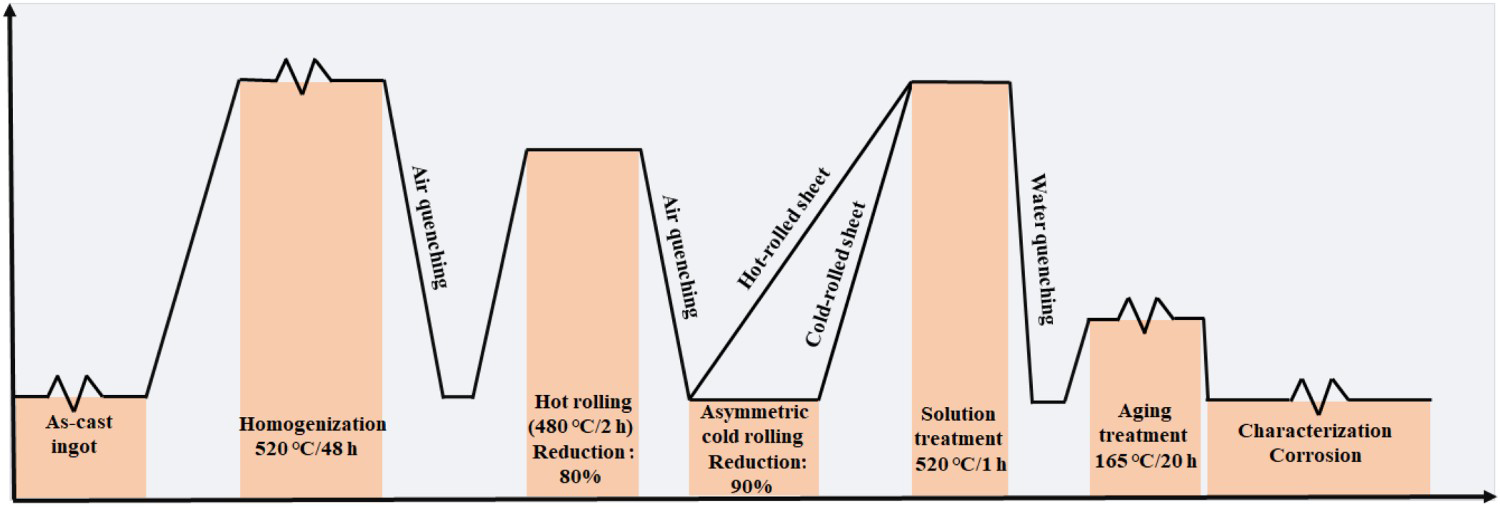
Corrosion experiments
The component of the intergranular corrosion solution was NaCl-57 g, H2O2-10 mL, and distilled water-1 L according to the ASTM G110 and GB/T 7998-2005. The RD (rolling direction)-TD (transverse direction) surface of samples was polished with 80#, 320#, 800#, and 1500# water matte sandpaper, and then with 800# metallographic sandpaper. The main purpose is to reduce the influence of surface roughness on the corrosion process. The sample whose surface was degreasing with ethanol was first washed in NaOH solution (100 g/L) for 10 min, then immediately washed in HNO3 solution (30%) for 5 min to make the surface bright and clean, finally rinsed in distilled water. During the immersion test, only the RD-TD surface of the sample was exposed to the corrosive solution, and the remaining surfaces were sealed with epoxy resin. All samples were immersed in the corrosive solution at a constant temperature of 35(±2)°C for 6 h, then washed with deionised water and dried. The corroded sample was cut perpendicular to the corroded surface, then grinding and polishing were performed according to the metallographic sample preparation method. Then, the changes in corrosion morphology were observed and the corrosion depth was measured through optical microscopy (OM, BX51 M). In addition, a scanning electron microscope (ZEISS EVO MA10) with EDS was used to characterise the development of corrosion behaviour in the intergranular corrosion solution, revealing the dynamic process of corrosion.
The electrochemical test was carried out using the MUL TI AUTOLAB M204 with a three-electrode electrochemical configuration, using a platinum sheet as the counter electrode, a saturated calomel electrode as the reference electrode, and a square sample with an area of 1 cm2 as the working electrode. The test surface of the sample was ground and polished, and then all samples were immersed in 3.5% NaCl solution for 600 s to obtain a steady state before polarisation curves tests. The polarisation curves were measured at a speed of 0.5 mV/S in the range of −0.75 VSCE–0.5 VSCE.
Microstructure characterisations
For the RD -TD surface of two aged samples after grinding and polishing, first, a scanning electron microscope was used to observe the overall distribution of the intermetallic particle, and second, EDS was used to identify the composition of intermetallic particles. The uncorroded sample was electropolished using a solution of 10 vol.-% perchloric acid and 90 vol.-% ethanol at 20 V for 3 s at 25°C after mechanical polishing. Then, the characteristics of grain boundaries were determined by using electron backscatter diffraction (EBSD).
In addition, the corrosion process will introduce a corrosion product film covering the surface of the alloy, which is not conducive to characterisation. Therefore, to observe the surface morphology covered by corrosion products, surface products were gently polished with 0.25 μm diamond polishing paste and washed with deionised water. Finally, mechanical vibratory polishing was performed on two samples after the removal of surface corrosion products to increase the identification of boundaries in corroded regions, which can be displayed in the EBSD map.
To characterise the precipitates on HAGBs/LAGBs, the 3 mm wafer sample was mechanically thinned to less than 80 μm, and then the qualified sample was obtained by the twin-jet polishing method. Electropolishing was conducted using the electrolyte with 30 vol.-% nitric acid and 70 vol.-% ethanol at −25°C to −30°C at 20 V. Finally, Titan G2 60-300 equipment was used to observe the precipitation, and the acceleration voltage is 300 kV.
Surface Volta potential measurement
The surface Volta potential was measured by scanning Kelvin probe force microscope (SKPFM) technique. The surface of the sample was polished and cleaned with alcohol before testing. The probe model SCM-PIT-V2 was used as the reference electrode. Bruker Dimension Icon atomic force microscope (AFM) was used for testing. The experiment was conducted in an atmospheric environment at a scanning frequency of 0.5 Hz. The data were analysed using NanoScope Analysis 1.8.
Results
Intergranular corrosion behaviour
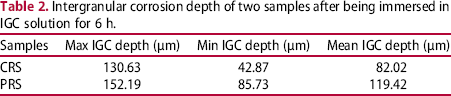
To determine the corrosion propagation, two samples were immersed in the intergranular corrosion solution for 6 h. After mechanical polishing of the cross-section, the corrosion morphology and corrosion penetration depth were obtained by metallographic microscope. Figure 3 shows the typical cross-sectional morphology of two samples after being immersed in the intergranular corrosion solution for 6 h. The results in Figure 3(a,c) show that the corrosion expansion of two samples along the depth direction is significantly different. The severity of corrosion varies with the grain structure, and there is a preferential corrosion path inside the corroded grain. Figure 3(b,d) shows typical features obtained by observing the corroded section under high magnification. In addition to the intergranular corrosion characteristics of the CRS sample, it can be observed that the corrosion characteristics of grain interior occur in some special grains, as shown in Figure 3(b), indicated by the yellow arrows. In the PRS sample, a selective attack of grain boundaries and grain interior was observed on the cross-section of several tens of micrometers under the exposed surface. It can be seen from Figure 3(d) that the PRS sample shows intragranular corrosion characteristics due to low-angle grain boundary corrosion and expansion into the grain, indicated by the white lines. In addition, the intergranular corrosion continues to propagate along the HAGBs after passing through the non-recrystallised region. Interestingly, the intragranular corrosion of the CRS sample is not caused by low-angle grain boundary corrosion. Therefore, it must be related to other factors, which will be further analysed and discussed in the subsequent part. Furthermore, it also can be seen from Table 2 that different grain structures seriously affect the depth of intergranular corrosion. The maximum, minimum and mean corrosion depths of the CRS sample were significantly lower than that of the PRS sample. Therefore, the intergranular corrosion resistance sequence is PRS < CRS.
Typical cross-sectional morphology of two samples after being immersed in IGC solution for 6 h: (a, b) CRS, (c, d) PRS. Intergranular corrosion depth of two samples after being immersed in IGC solution for 6 h.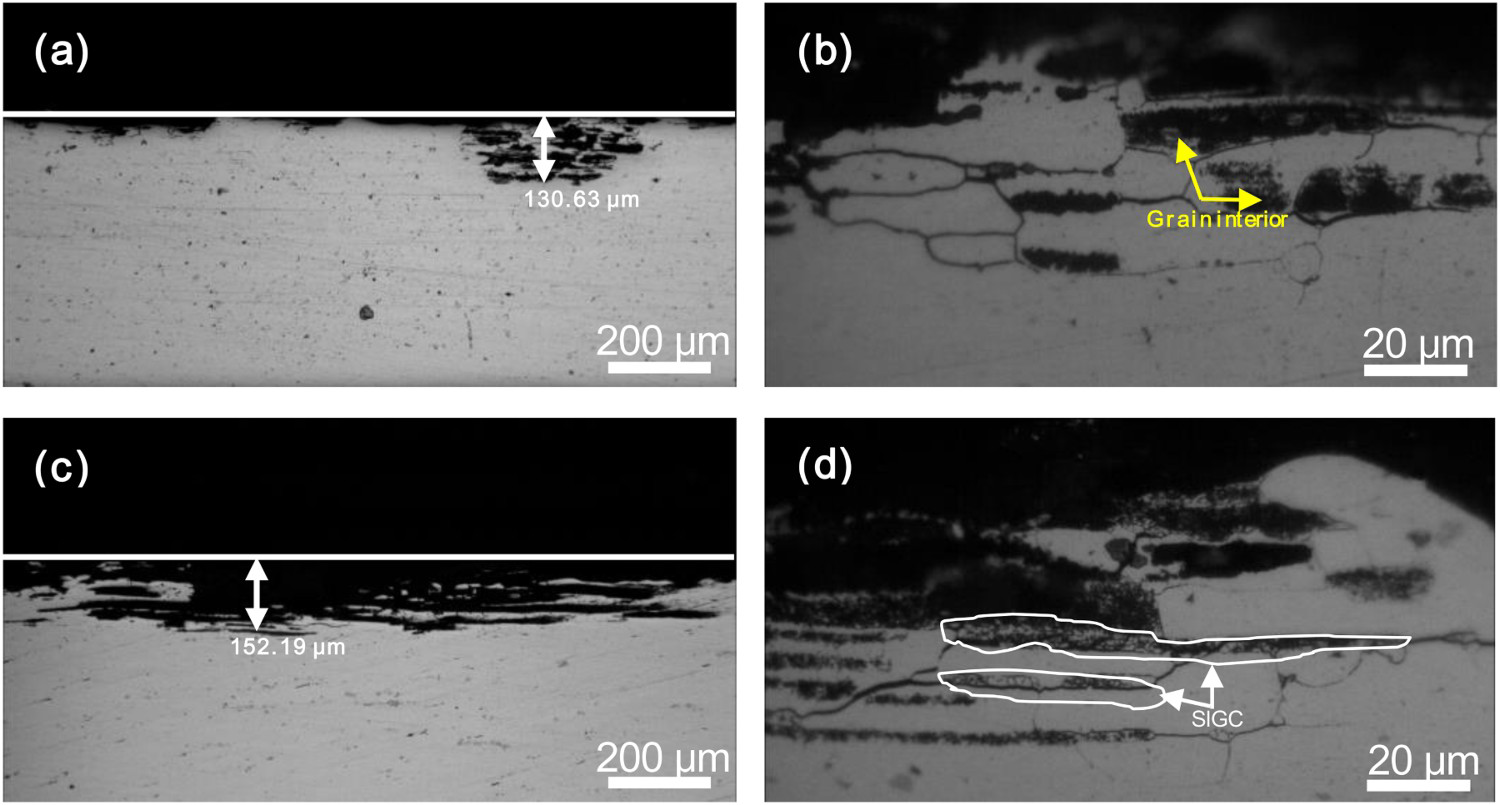
Micro-corrosion characterisation
Corrosion of intermetallic particles
The existence of coarse intermetallic particles in metallic materials often has an important influence on corrosion resistance, so the uncorroded original surface of the studied alloy was characterised by the backscattered electron in SEM, revealing the distribution of intermetallic particles, as shown in Figure 4(a,b). It can be roughly seen that the distribution of coarse intermetallic particles becomes more uniform and finer after solution-treated and quenching of the CRS sample. However, the coarse intermetallic particles in the PRS sample are distributed along the rolling direction and a large number of zones are free of coarse intermetallic particles due to segregation. An additional asymmetric cold rolling is introduced to the premise of the sheet obtained by hot rolling, resulting in a large number of dislocations accumulating around the coarse particles and interacting to break them up. Therefore, the size of coarse intermetallic particles was measured by using the Image-pro plus image processing software, and measurements were made on multiple areas (at least 5 images) to reduce the error. The size distribution histogram of coarse intermetallic particles was obtained by statistical analysis, as shown in Figure 4(d). According to the results of statistical analysis, it can be seen that the size distribution range of the PRS sample is wider than that of the CRS sample. In addition, the proportion of particles (<5 μm) in the CRS sample is higher than that in the PRS sample, which implies that the asymmetric cold rolling process further breaks up coarse particles. The composition of coarse particles was further analysed by EDS, as shown in Figure 4(c). According to the results of EDS, these coarse intermetallic particles are composed of Al, Cu, and Sc elements. So far, little research has been done on the phase composed of Al, Cu, and Sc elements, so the exact structure and composition still require further study. Because this paper does not focus on the structure of this phase, it will not be discussed further. There are several opinions [45 47] that this phase may be Al5-8Cu7-4Sc, Al8-xCu4 + xSc, and AlxCu5-6ScZry≈0.3. Researchers usually refer to the ternary phase containing Al, Cu, and Sc elements as the AlCuSc (W) phase due to structural uncertainty. Therefore, the coarse intermetallic particles exist mainly in the form of the W phase in the studied alloy. The following part will provide an in-depth analysis of the corrosion behaviour of the W phase.
(a) SEM image of CRS sample, (b) SEM image of PRS sample, (c) EDS of intermetallic particles, (d) Intermetallic particles size distribution histogram of two samples.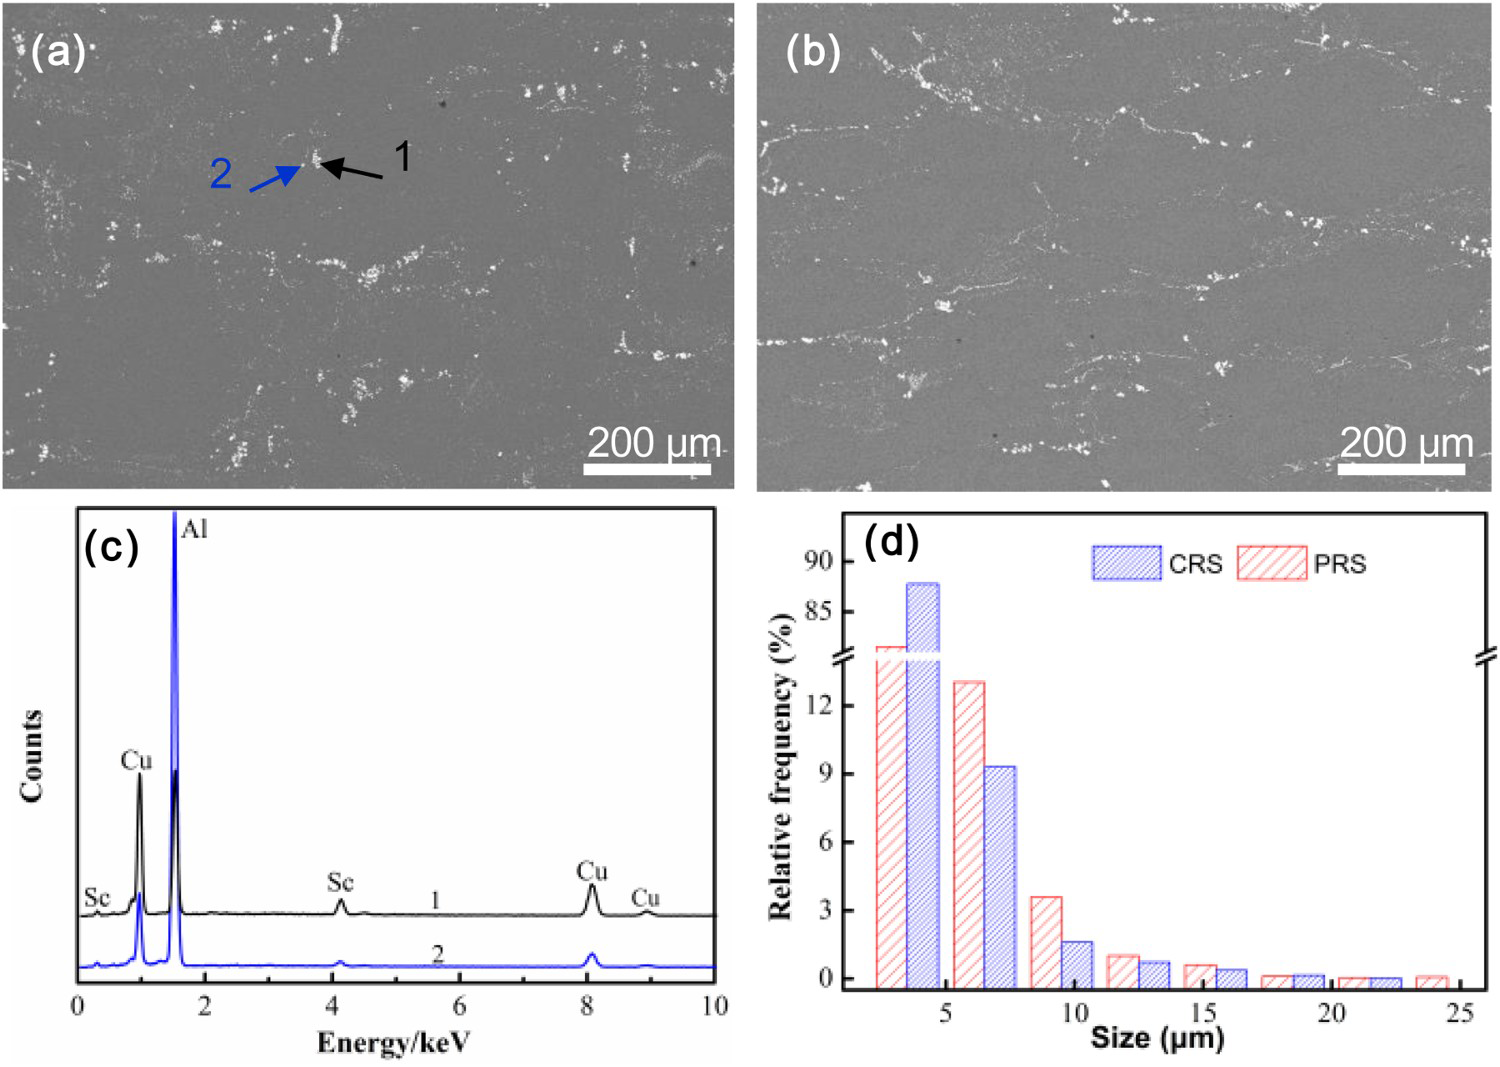
The Volta potential of the metal surface can be measured by the SKPFM technique, and the potential map clearly displays the Volta potential difference of various phases on the surface. The Volta potential difference was shown to fluctuate linearly with the corrosion potential [48,49], implying that the SKPFM technique is a viable approach for studying galvanic coupling between various phases. Therefore, the SKPFM technique [48 50] has been widely used to study the localised corrosion of Al alloys and helps to understand the corrosion behaviour of intermetallic particles. In addition, the unetched bright surface of the studied alloy also was tested by the SKPFM technique, the test area is within the orange-yellow box in Figure 5(b), and the result is shown in Figure 5(a). The Volta potential is positively correlated to the electrochemical potential, inferring that the W phase has more negative potential than that of the Al matrix. Therefore, we speculate that the W phase forms micro-cells with the adjacent Al matrix, in which the Al matrix acts as the cathode and the W phase is the anode. In addition, it is necessary to carry out corrosion tests to further demonstrate this result.
(a) Surface Volt potential of intermetallic particles, (b) SEM image after being immersed in IGC solution for 0 s, (c) SEM image after being immersed in IGC solution for 1800 s, (d, e, f) EDS maps after immersion for 1800 s.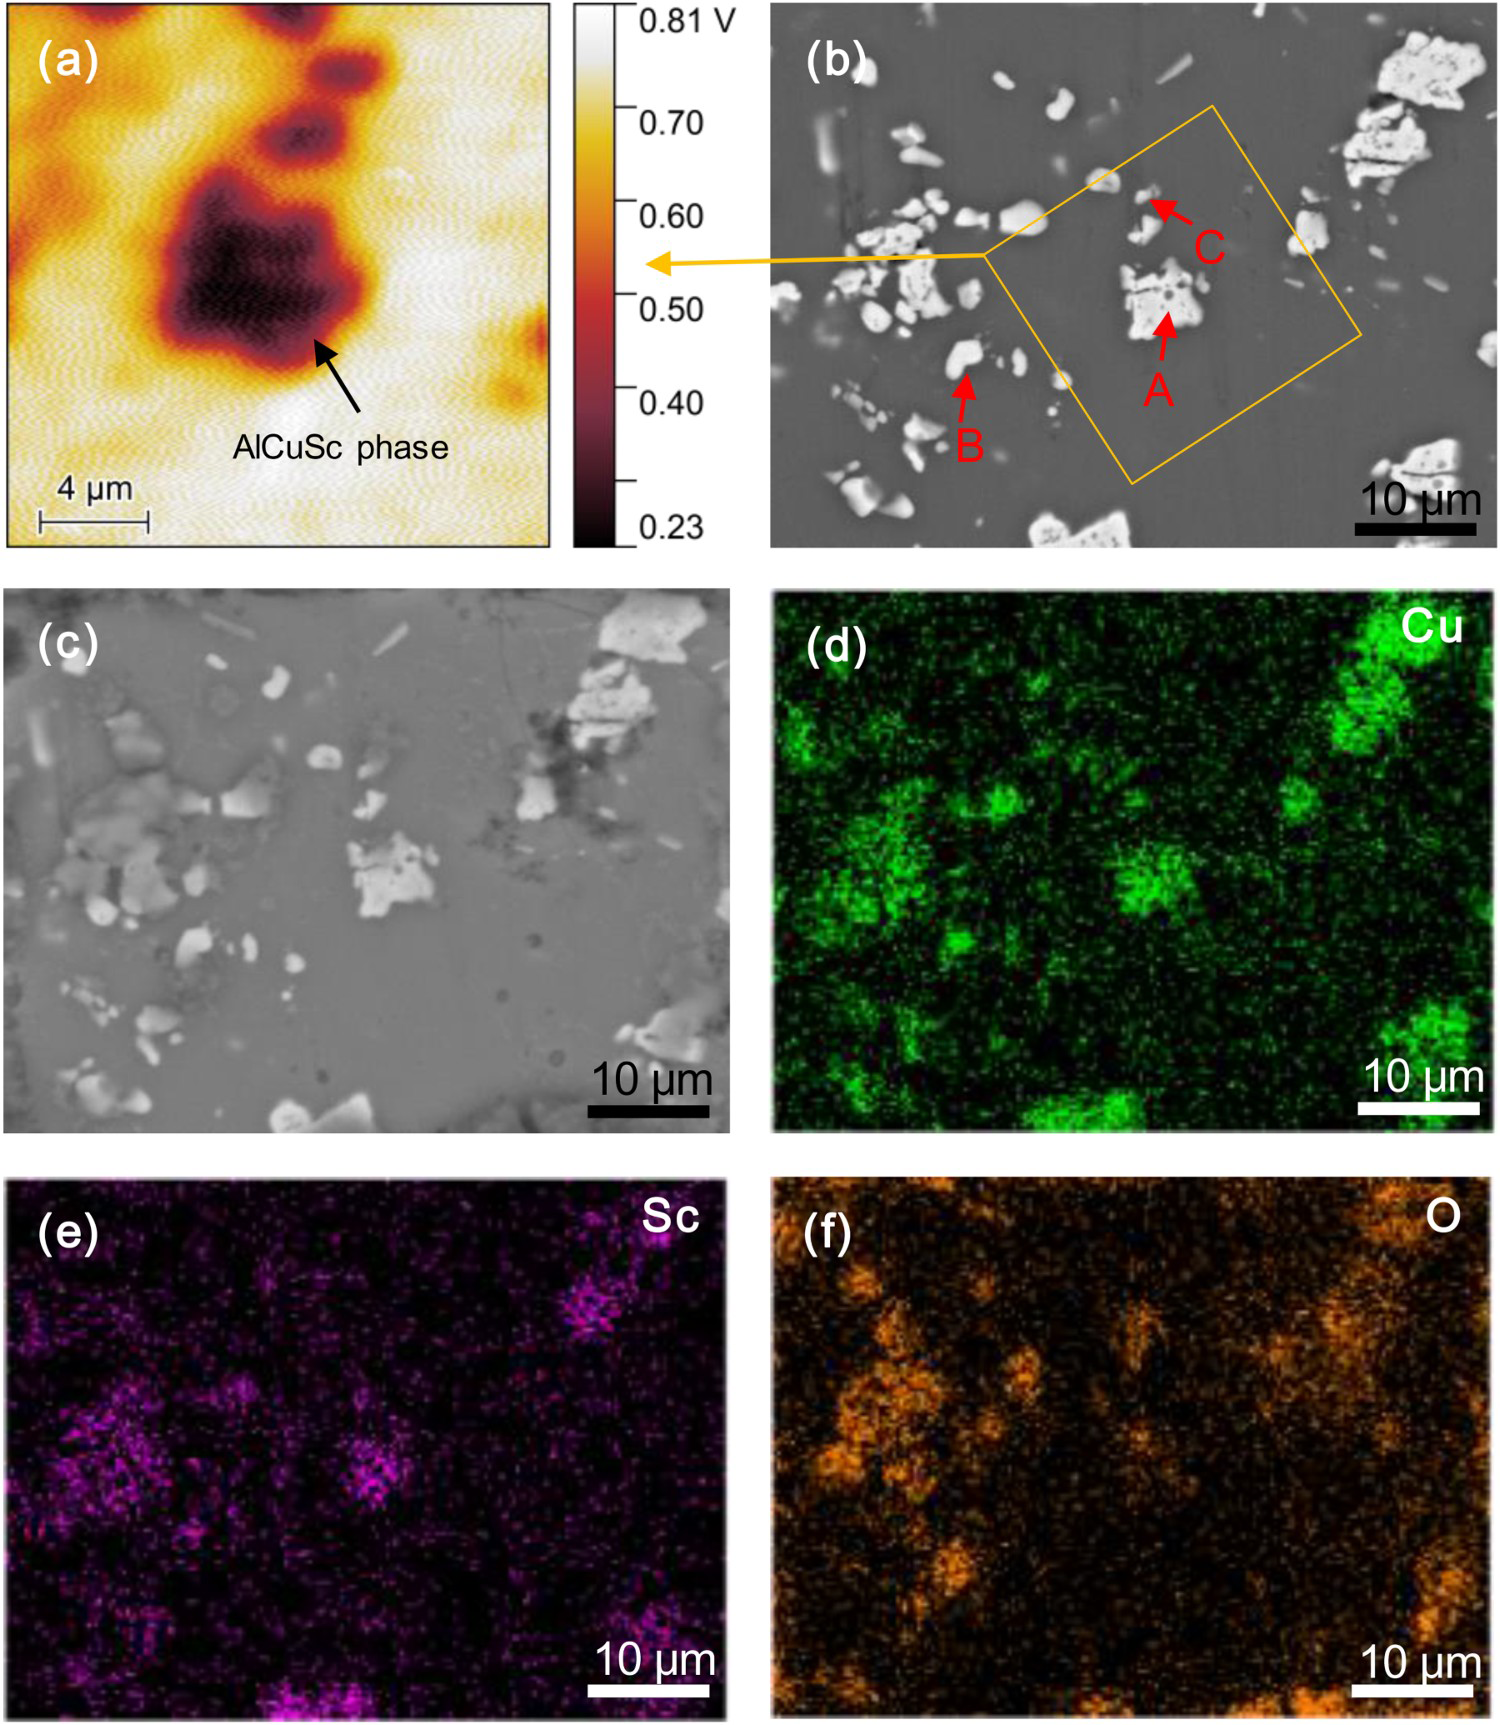
To further demonstrate the corrosion behaviour of the W phase, the sample after being subjected to SKPFM testing was also immersed in the intergranular corrosion solution at different times. Figure 5(b,c) shows the morphologies of the sample after exposure to the intergranular corrosion solution for 0 and 1800 s. It can be seen that with the prolongation of immersion time, the colour of white particles gradually becomes darker, which means that white particles are corroded. In general, cavities and trenches caused by the preferential dissolution of the surrounding anode Al matrix are generally observed at the periphery of cathodic particles during corrosion. In addition, the corrosion of the anode Al matrix around the cathode particles is accompanied by the shedding of these particles. However, these phenomena were not observed for the W phase when the sample was immersed in the intergranular corrosion solution. As a result, we may further conclude that the W phase exhibits anodic characteristics.
EDS maps after the immersion corrosion shown in Figure 5(d–f), it can be seen that the O element is aggregated on the white particles. In addition, the change of element content with different particle sizes during the corrosion process was analysed by EDS. By analysing the energy spectra of three particles (large particle A, medium particle B, small particle C) before and after corrosion, it can be seen that the content of the Al element of three particles decreased with the immersion time, while the content of O element increased, as shown in Figure 6. This phenomenon is mainly attributed to dealloying that occurs in the W phase. Interestingly, the increment of O content in small particle C is significantly faster than that in medium particle B and large particle A. This further suggests that small particles are more likely to act as anodes to protect the Al matrix and make corrosion more superficial. In addition, the dealloying rate of the W phase in the corrosive solution is relatively slow, which does not lead to serious pitting characteristics.
EDS of intermetallic particles of different sizes in the sample after immersion from 0 to 1800 s.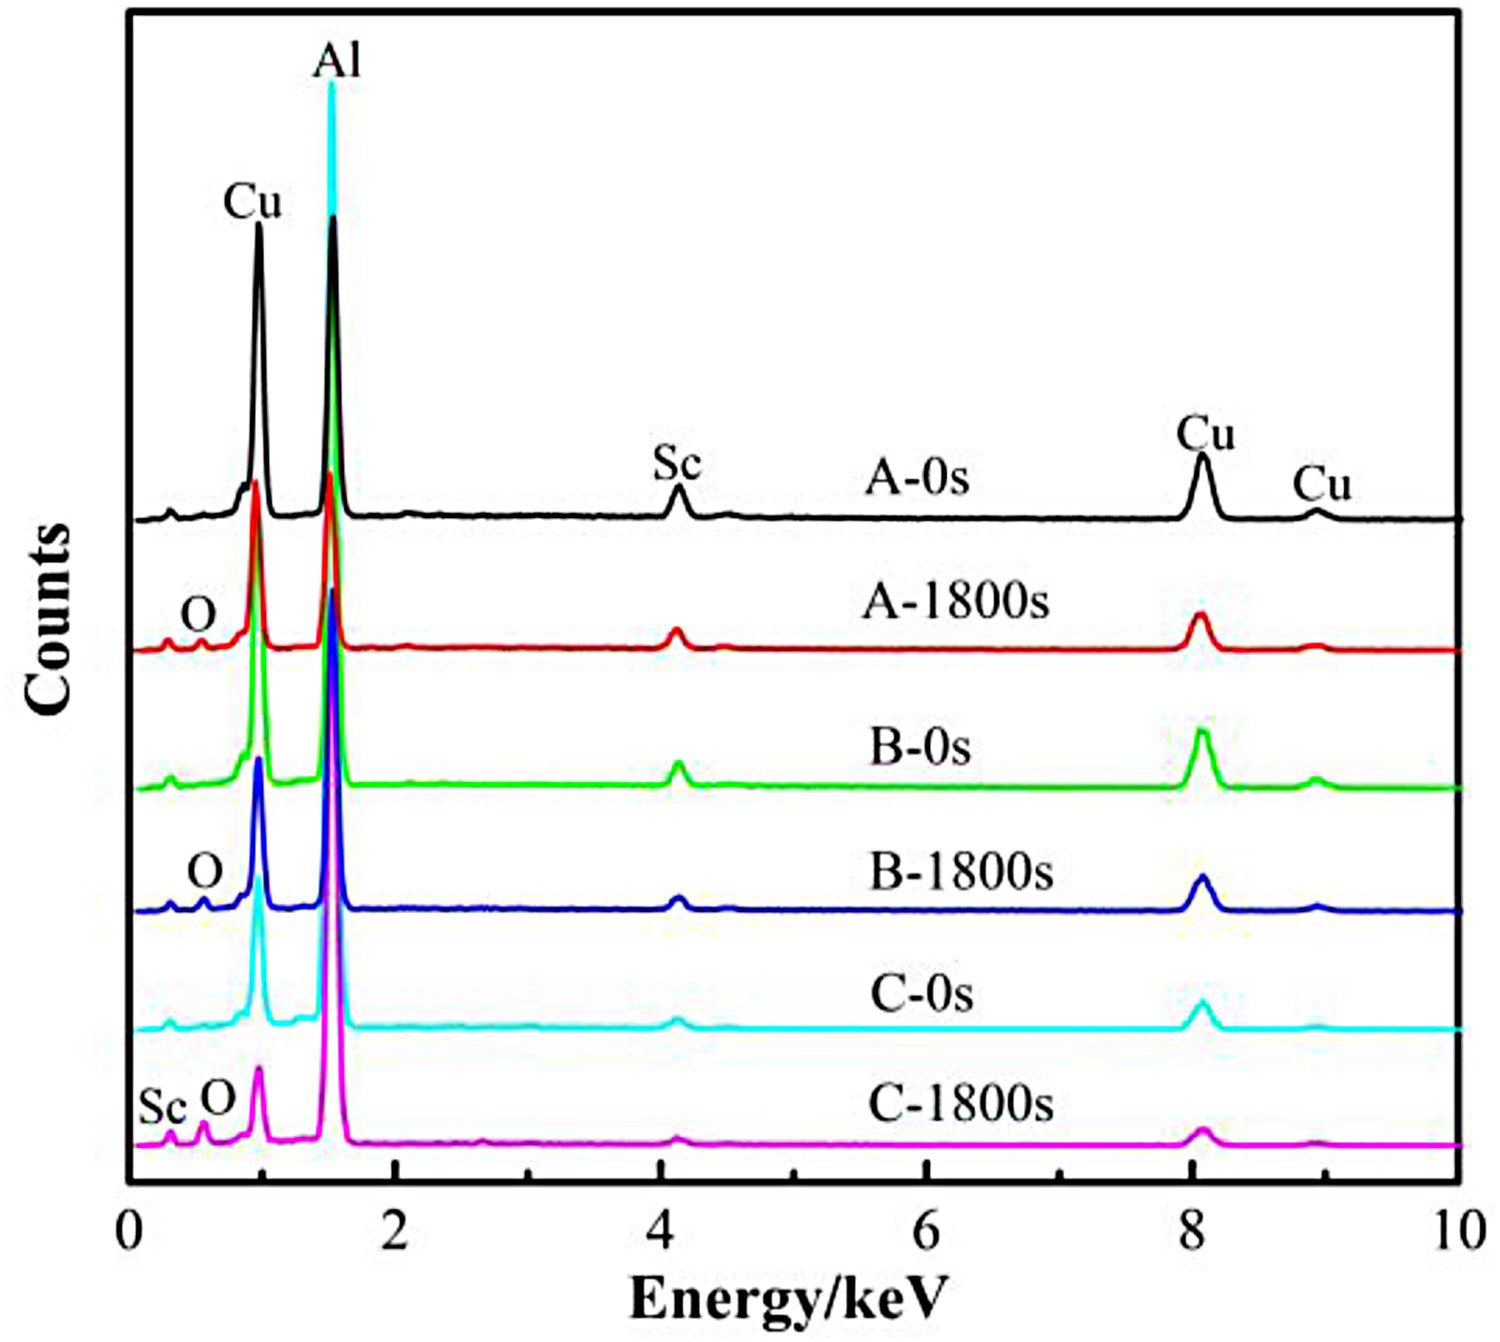
Corrosion of grain boundaries
TSL OIM Analysis 6.5 software was used to analyse the raw EBSD data to obtain the distribution proportion of LAGBs. The grain boundary distribution maps of the two samples are presented in Figure 7(a,b). In these figures, LAGBs (2°−15°) are marked with red lines, and HAGBs (> 15°) are marked with blue lines. It can be seen that almost all grains in the CRS sample are equiaxed. However, most of the grains in the PRS sample are fibrous, and only some part of the grains is equiaxed. In addition, the PRS sample reveals a very high fraction of LAGBs, whereas HAGBs comprise only a small minority. The lengths of LAGBs and HAGBs in the PRS sample were 1.82 ± 0.20 cm and 1.4 ± 0.14 cm, respectively, and the measured area was 500 × 400 μm. While, the lengths of LAGBs and HAGBs in the CRS sample were 0.96 ± 0.12 mm and 1.92 ± 0.16 cm, respectively, and the measured area was 500 × 400 μm. The average sizes of the recrystallised grains of CRS and PRS samples were calculated by using the intercept method to be 26 ± 2 μm, and 20 ± 2 μm, respectively. Compared with the PRS sample, the recrystallised grain size of the CRS sample is reduced, which is related to the increased length of HAGBs.
Grain structures and surface corrosion morphology of two samples: (a, c) CRS, (b, d) PRS.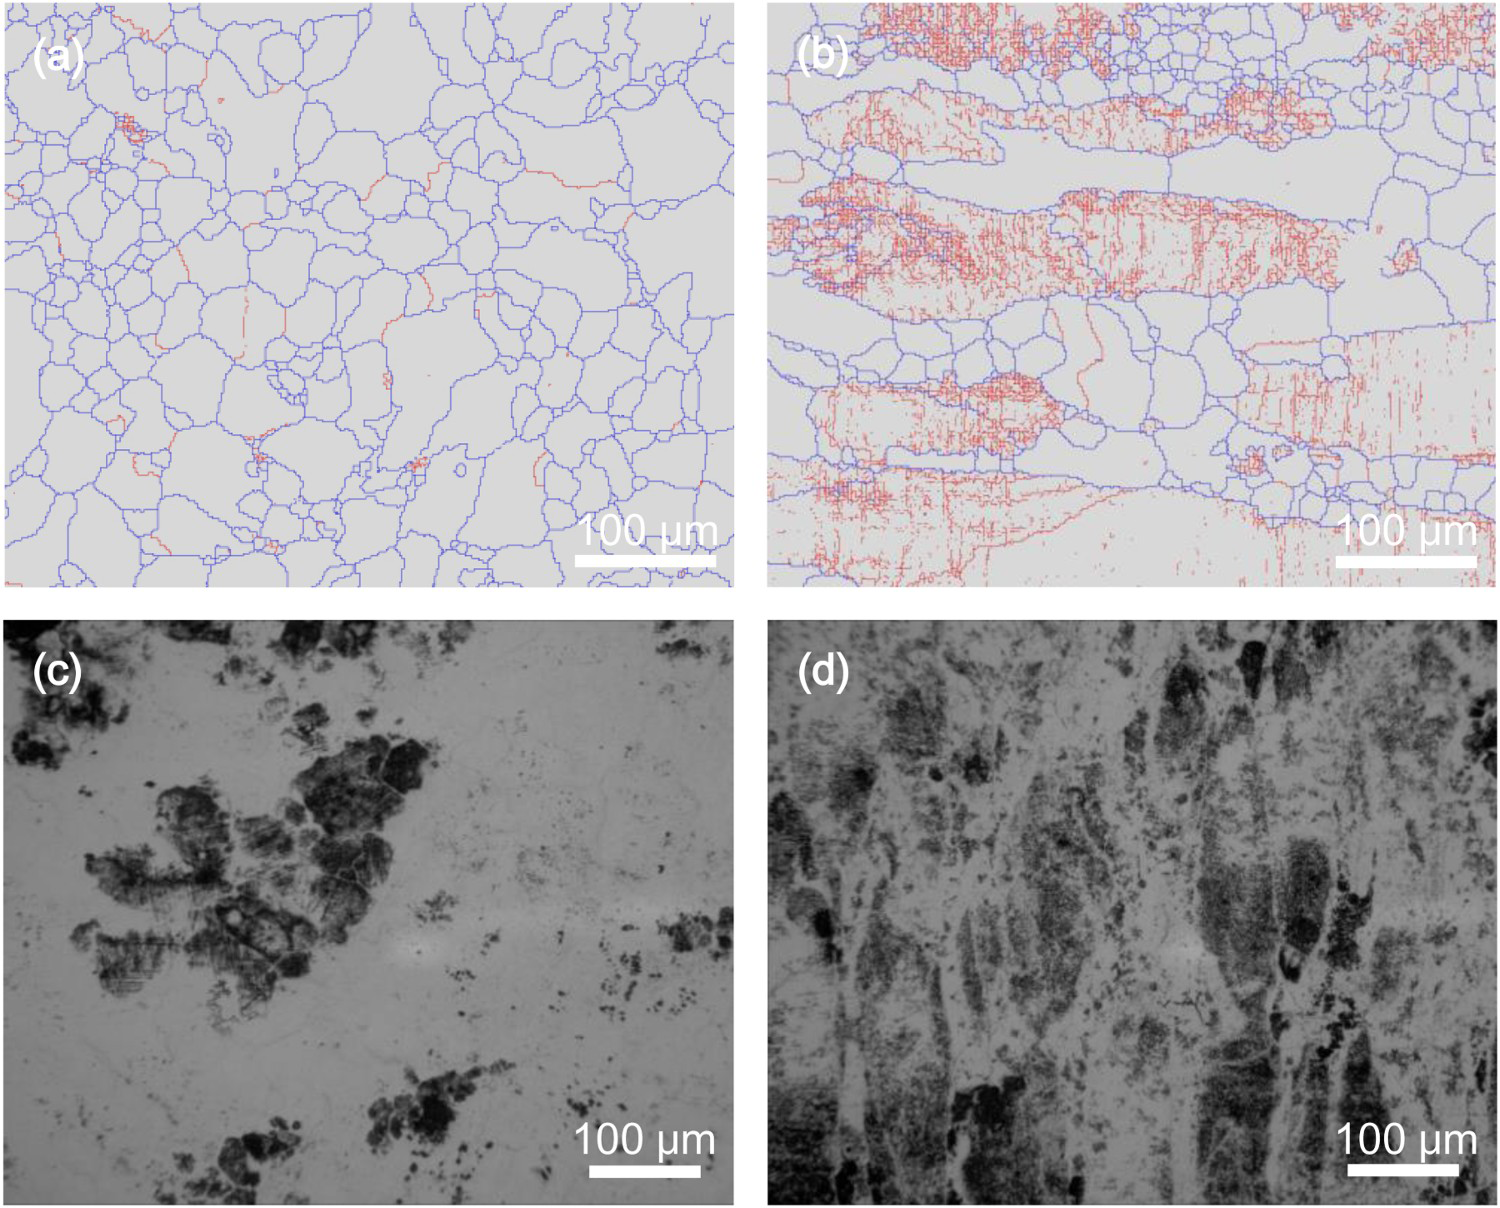
The corrosion behaviour of Al alloys is closely related to the grain structure. Therefore, corrosion products were removed after being immersed in the intergranular corrosion solution for a short time (600 s) for two samples. Using optical microscopy to observe corrosion morphology can effectively prove its relationship with the grain structure. Obviously, the corrosion morphology of the two samples is different after being immersed in the intergranular corrosion solution for 600 s from Figure 7(c,d). The PRS sample has significantly more corroded areas than the CRS sample. In addition, it is preliminarily judged that the intragranular corrosion of the PRS sample is mainly caused by the low-angle grain boundary corrosion. However, corrosion occurred inside some special recrystallised grains of the CRS sample. Furthermore, both CRS and PRS samples exhibited intergranular corrosion characteristics. In other words, the corrosion morphology of Figure 7(c,d) is similar to the grain structure of Figure 7(a,b).
Corrosion of precipitates
The precipitation of grain interior [44] of the peak-aged samples has been discussed in detail in our previous article, and the result shows that the volume fraction of T1 precipitates increases after the asymmetric cold rolling. Figure 8(a,b) shows HAADF-STEM images of typical high-angle grain boundary characteristics of two samples in the peak-aged state. There are no obvious differences in precipitates on HAGBs. It can be seen that the precipitate on HAGBs of the two peak-aged samples exhibits a continuous distribution with a short separation distance. Precipitates on the high-angle grain boundary, which should be T1 or T2 (Al6CuLi3) precipitates [13,51,52]. For the Al-Cu-Li alloy, T1 precipitates are easily precipitated on the low-angle grain boundary during the aging process [19,51,53]. Xu et al. [54] also demonstrated the growth of needle-like T1 precipitates on LAGBs by combining selected-area diffraction spots and dark-field TEM images. It can also be seen from Figure 8(b) that dense T1 precipitates nucleate and grow on LAGBs of the PRS sample. In addition, the T1 precipitate of the sub-grain interior is not uniform. The number density of the T1 precipitate on the sub-grain interior was significantly lower than that of the low-angle grain boundary. The low-angle grain boundary was not been observed in the CRS sample with almost completely recrystallised. Therefore, there are few LAGBs in the sample as nucleation sites for T1 precipitates, so a large amount of T1 precipitates is uniformly distributed within the recrystallised grain.
(a) HAADF-STEM image of the CRS sample, (b) HAADF-STEM image of the PRS sample, (c, e) SEM image and EBSD map of the CRS sample after being immersed in the intergranular corrosion solution for 600 s, (d, f) SEM image and EBSD map of the PRS sample after being immersed in the intergranular corrosion solution for 600 s.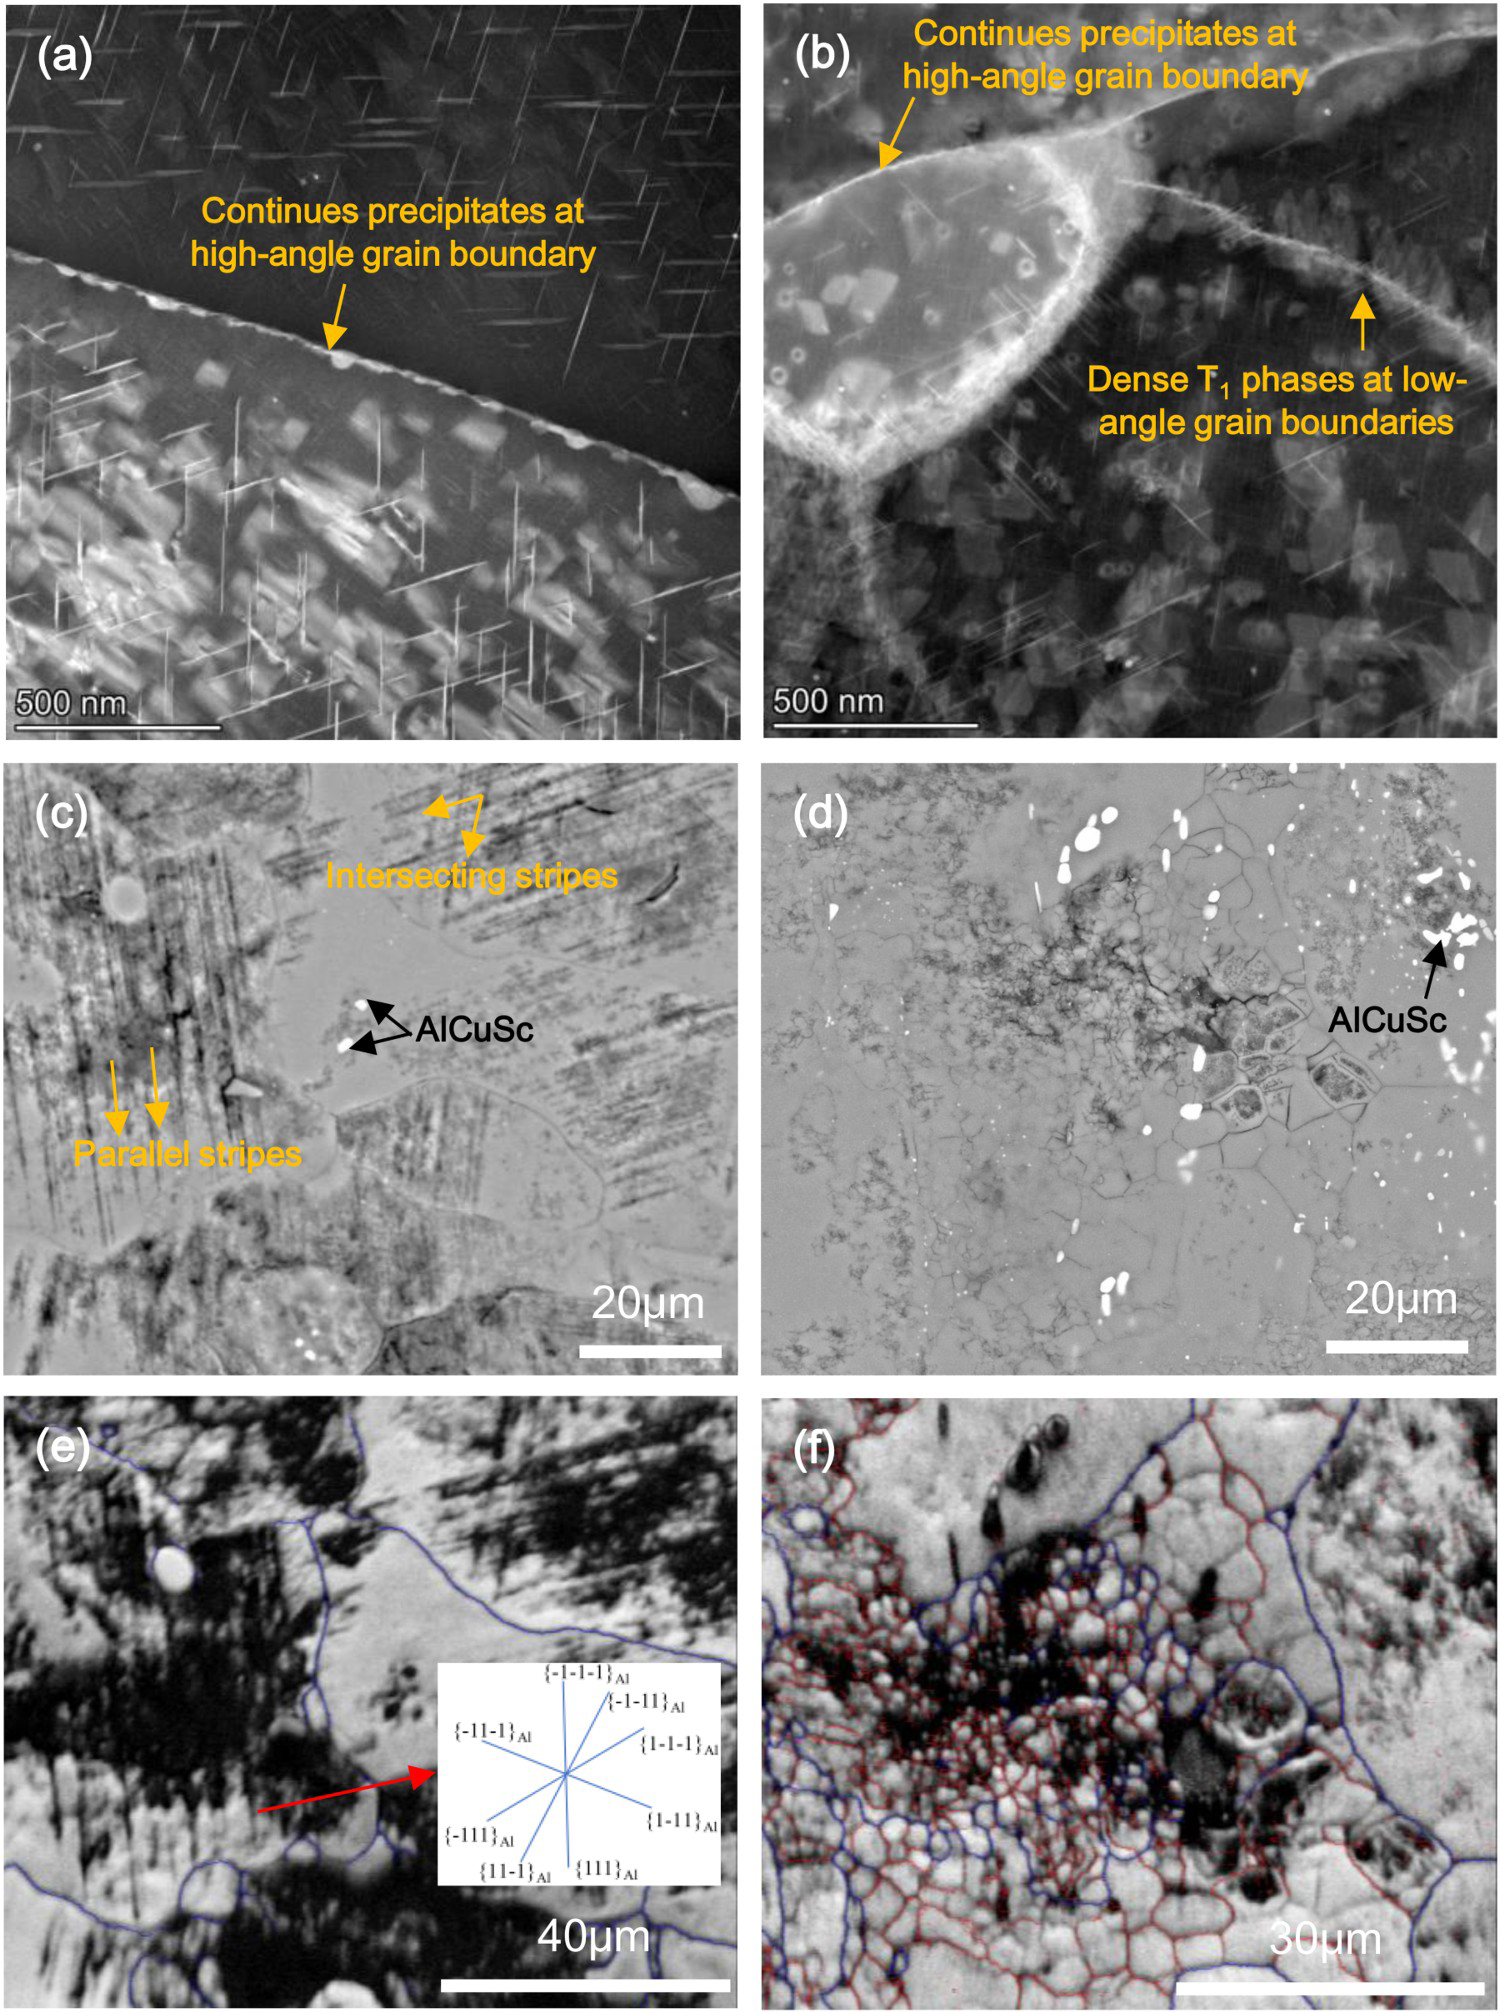
Distinctly different corrosion characteristics were observed on the surface of two samples after the removal of corrosion products. The difference in corrosion morphology of two peak-aged samples may be related to the distribution of precipitates. Therefore, SEM and EBSD were used to characterise the typical corroded regions of the two samples. Figure 8(c,d) shows the typical SEM images of CRS and PRS samples after removing corrosion products. To identify the distribution location of these corrosion morphologies, the mapping of EBSD (band contrast and grain boundaries) at the same location of two samples was performed, as shown in Figure 8(e,f). By comparing the EBSD analysis and the SEM observation of the same corrosion defects, the grain boundary, sub-grain boundary, and intragranular corrosion were confirmed. Interestingly, in addition to the intergranular corrosion observed in the CRS sample, the main observation is that corrosion propagation mainly occurs on the boundary of a series of parallel and intersecting stripes, as shown in Figure 8(c) by yellow arrows. Furthermore, the corrosion zone is located in the grain without crossing the grain boundary. The corresponding plan trace is shown in the inset of Figure 8(e), indicating that corroded bands developed in the direction roughly parallel to the {111}Al plane. The susceptibility and inclinations of these striations suggest that these are aligned parallel to the {111}Al plane, which is the habit plane of T1 precipitates. This is consistent with the research results of Jiang and Donatus [20,22]. The PRS sample has intragranular corrosion, intergranular corrosion and low-angle grain boundary corrosion are also observed in Figure 8(f). Thus, the development of localised corrosion indicates that alloys with LAGBs within un-recrystallised grains are preferentially attacked. The results of EBSD indicate that the precipitates affect the corrosion behaviour of the Al-Cu-Li alloy.
Polarisation curves
The evolution of microstructures will also change the local chemical properties of the Al alloy. The difference in electrochemical behaviour is mainly attributed to the evolution of the microstructure of two samples, and this will be a key factor affecting the electrochemical behaviour of Al-Cu-Li alloys. Figure 9 shows the potentiodynamic polarisation curves of two peak-aged samples with different microstructures in 3.5 wt-% NaCl solution. It can be seen from Figure 9 that the changing trend of potentiodynamic polarisation curves is the same, in spite of the different microstructures. The Tafel zone of the potentiodynamic polarisation curves is fitted to obtain the corrosion potential (Ecorr) and corrosion current density (Icorr), which are used to evaluate the corrosion resistance [55 57]. The Ecorr and Icorr determined by extrapolating the cathode Tafel zone of the polarisation curve are shown in Figure 9. The Ecorr of PRS, and CRS samples are −0.609 VSCE, and −0.597 VSCE, respectively. The Icorr of PRS and CRS samples are 1.32 × 10⁻⁵ A/cm2, and 2.85 × 10⁻⁶ A/cm2, respectively. The Icorr change trend of the two samples is CRS < PRS. In general, the change in corrosion potential represents the corrosion trend of the sample. However, the corrosion potential is a thermodynamic parameter in the electrochemical corrosion process and cannot represent the true corrosion reaction kinetics. According to Faraday's law, Icorr as a kinetic factor can directly reflect the rate of electrochemical corrosion [58,59]. The smaller the Icorr, the lower of the corrosion rate, which is consistent with the changing trend of the intergranular corrosion results in Figure 3.
Polarisation curves of two samples.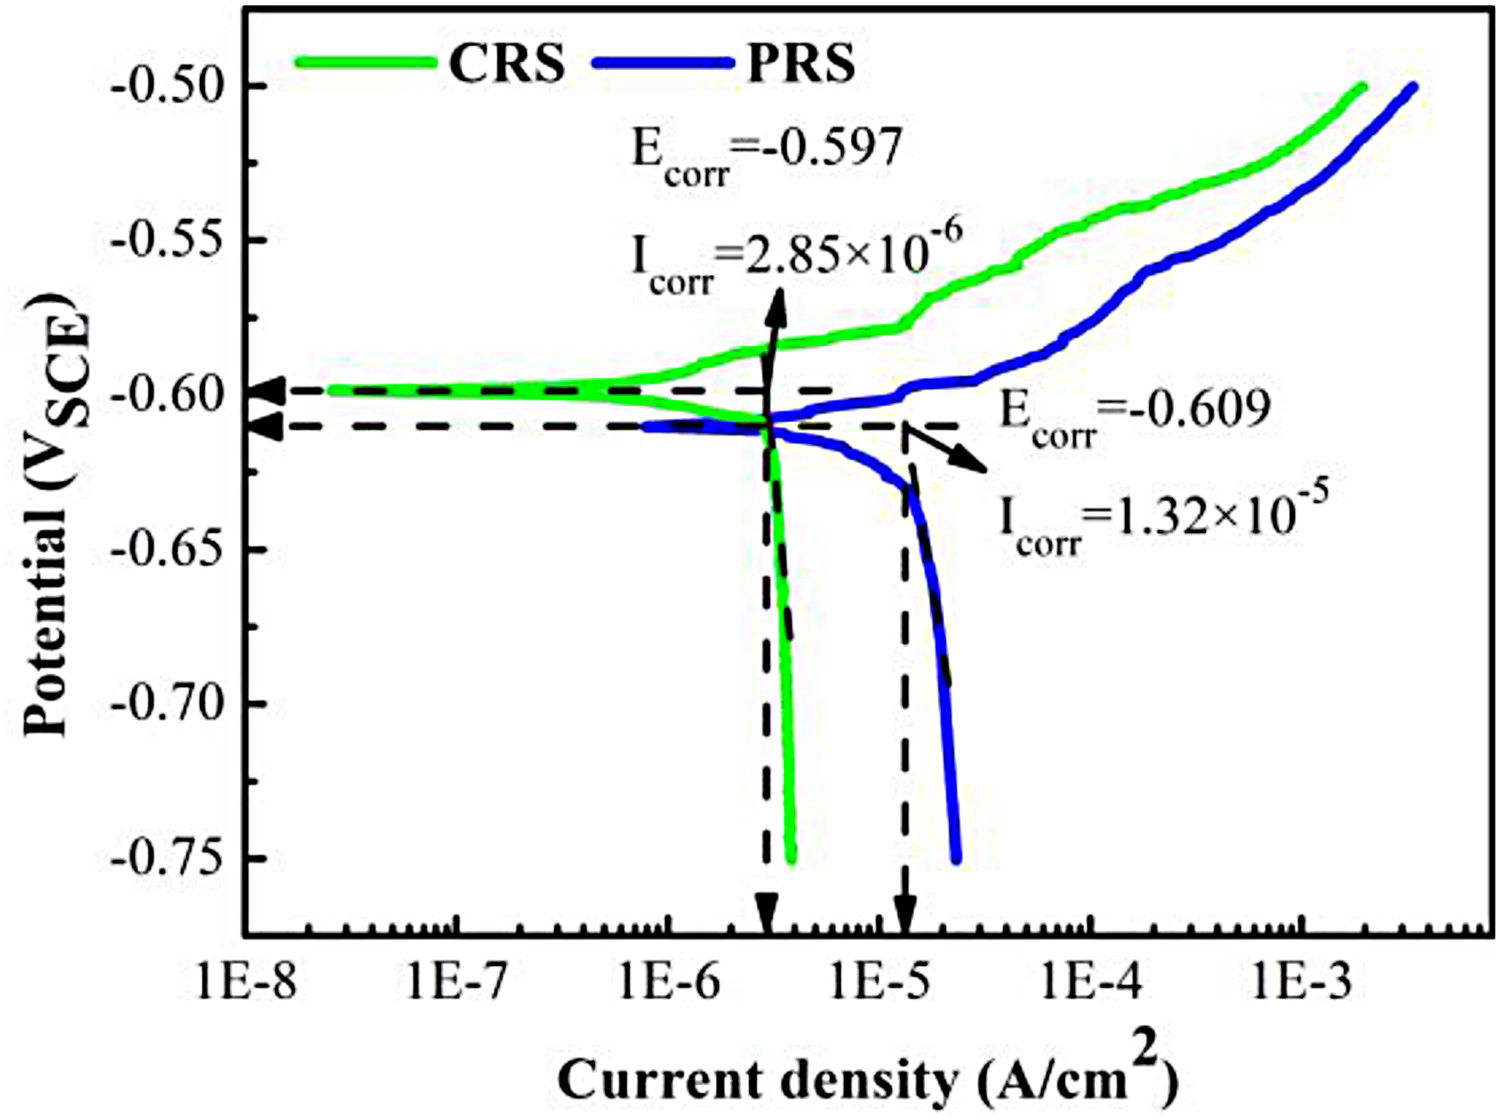
Discussions
It is widely believed that the surface of Al alloy is usually covered with a protective oxide film to enhance its corrosion resistance. However, coarse intermetallic particles with heterogeneous structures make it difficult for the protective oxide layer formed in air or aqueous solution to grow on the surface of the Al alloy. The corrosion morphology observed around coarse intermetallic particles is caused by the preferential dissolution of the surrounding anodic Al matrix. As the time of immersion in the corrosion solution is extended, the preferential corrosion area continuously exposes the Al matrix to the new surface, resulting in a gradual increase in corrosion. Finally, the cathode particles fall off the surface, forming serious pitting characteristics. Similarly, the corrosion behaviour of Al-Cu-Li alloys also is closely related to the electrochemical inhomogeneity caused by coarse intermetallic particles. Interestingly, the W phase has more negative potential than that of the surrounding Al matrix and undergoes dealloying, rather than acting as a cathode causing the dissolution of the surrounding Al matrix as previously described [47]. In addition, the dealloying rate of the W phase in the corrosive solution is relatively slow, which does not lead to serious pitting characteristics on the surface. Therefore, the contact time between the Al matrix under coarse intermetallic particles and the corrosive solution can be delayed, resulting in the Al matrix can be protected to a certain extent. In addition, the finer and uniformly distributed W phase is conducive to corrosion on the surface and reduces the corrosion expansion rate in the depth direction. In summary, the effect of the W phase on the corrosion behaviour of the studied alloy with different recrystallisation fractions in an intergranular corrosion solution is relatively small. Therefore, the differences in corrosion behaviour are mainly related to grain structures and precipitation characteristics, which will be discussed in detail subsequently.
The anodic dissolution of grain boundary precipitates is the major factor of IGC behaviour in Al alloy. In addition, a continuous anode path along the grain boundary will accelerate the propagation of corrosion along the grain boundary, and the selective dissolution of Li-containing precipitates is the major factor of intergranular corrosion in the Al-Cu-Li alloy. Most research results [12,19 21] show that the potential of T1 precipitates is more negative than that of the Al matrix, and the potential of the grain interior further decreases with the increase in the precipitation of the T1 precipitates, causing the potential difference gradually decreases between the grain boundary and the grain interior. At this time, the corrosion potential of the matrix shifted towards the negative direction, causing the potential difference between the grain boundary and the grain interior to be reduced to the level where intergranular corrosion cannot occur, which is beneficial to promote the transformation of intergranular corrosion to intragranular corrosion. Furthermore, the Li element in T1 precipitates is preferentially and selectively dissolved, leading to the enrichment of noble Cu element during the corrosion process [12]. The Cu-rich residue phase on the Al matrix and grain boundaries becomes the cathode relative to the surrounding materials, which causes the surrounding Al matrix to dissolve and promotes corrosion expansion into the grain interior.
According to the results of HAADF-STEM, it can be concluded that the distribution characteristics of precipitates at HAGBs are the same for CRS and PRS samples. The continuously distributed grain boundary precipitates act as a channel for electron transfer during the corrosion process and accelerate the anode dissolution rate. Therefore, the precipitate on the grain boundary acts as a sacrificial anode to promote the occurrence of intergranular corrosion in the corrosive solution, particularly Li-containing precipitates on the grain boundaries will significantly increase the intergranular corrosion sensitivity of the Al-Cu-Li alloy. In addition, the volume fraction of T1 precipitates within the grains of the CRS sample is much higher than that of the PRS sample. As a result, the potential difference between the grain boundary and the grain interior is much lower in the CRS sample than that in the PRS sample. Thus, crystallographic corrosion is formed by preferentially attacking the T1 precipitates inside the grains, which finally manifest as selective corrosion characteristics inside a specific grain orientation. Furthermore, the grain size is also an important factor affecting the corrosion expansion rate of Al alloys. Many studies [60 64] have shown that smaller grain sizes can enhance corrosion resistance. The CRS sample has a smaller recrystallised grain size and a higher distribution fraction of HAGBs per unit area compared with the PRS sample. The depth of attack was less for the CRS sample than that of the PRS sample as a result of the formation of smaller recrystallised grains and an increase in the length of HAGBs, making the IGC path circuitous.
Several studies [65,66] have shown that in Al-Zn-Mg and Al-Mg-Si-Cu alloys, LAGBs are less susceptible to corrosion than HAGBs. However, both HAGBs and LAGBs are decorated by dense T1 precipitates [21] which are anodic relative to the Al matrix at artificial age condition for Al-Cu-Li alloys. In addition, the corrosion in Al-Cu-Li alloys is found to preferentially initiate and propagate in the uncrystallised region in the form of intergranular corrosion [24]. According to Figure 8(b), it can be seen that there are dense T1 precipitates on LAGBs in the PRS sample. In the process of intergranular corrosion, the T1 precipitate on LAGBs preferential dissolves, which promotes the expansion of corrosion to the grain interior and leads to the formation of intragranular corrosion characteristics. More interestingly, parallel and intersecting stripes were hardly observed in the PRS sample containing a high fraction of LAGBs. In addition, as the proportion of LAGBs decreases, the corrosion streaks within the grains increase significantly.
Therefore, the difference in corrosion behaviour has a certain relationship with the fraction of LAGBs and precipitates. Figure 10 shows the schematic diagram of the evolution of the corrosion propagation of the studied alloy as the fraction of LAGBs and precipitates. As the decrease of LAGBs and the increase of precipitates of the grain interior, the corrosion mode changes, that is, IGC + SIGC → IGC + crystallographic corrosion. Both IGC and SIGC corrosion existed in the PRS sample, but the expansion rate of IGC was not inhibited, indicating that denser anodic T1 precipitates formed on LAGBs worsen the intergranular corrosion resistance, mainly due to the low-angle grain boundary providing a favourable channel for corrosion propagation. However, when the crystallographic corrosion occurs in the CRS sample due to the {111}Al plane being exposed to intergranular corrosion solution, the expansion rate of IGC is suppressed, indicating that the appearance of intragranular corrosion can reduce the expansion rate of IGC. In other words, when crystallographic corrosion occurs in Al-Cu-Li alloys, the corrosion resistance can be significantly improved. The effectiveness of improving corrosion resistance by modifying the combination mode of the grain structure and the distribution of precipitates on the researched Al-Cu-Li alloy has been demonstrated. The LAGBs of the partially recrystallised sample under T6 aging condition are more susceptible to corrosion attack mainly due to the inhomogeneous distribution of the precipitates on LAGBs and grain interior. In addition, the introduction of pre-deformation can promote the formation of homogeneously distributed dislocations in the Al matrix, which helps to improve the inhomogeneity of precipitate distribution during aging. This part will be systematically studied and discussed in our further research work. In general, corrosion that occurs inside the grain is less detrimental to the structural material than the formation of IGC.
Schematic illustration of the evolution of the corrosion propagation with the proportion of low-angle grain boundaries and precipitates: (a) IGC + crystallographic corrosion, (b) IGC + SIGC.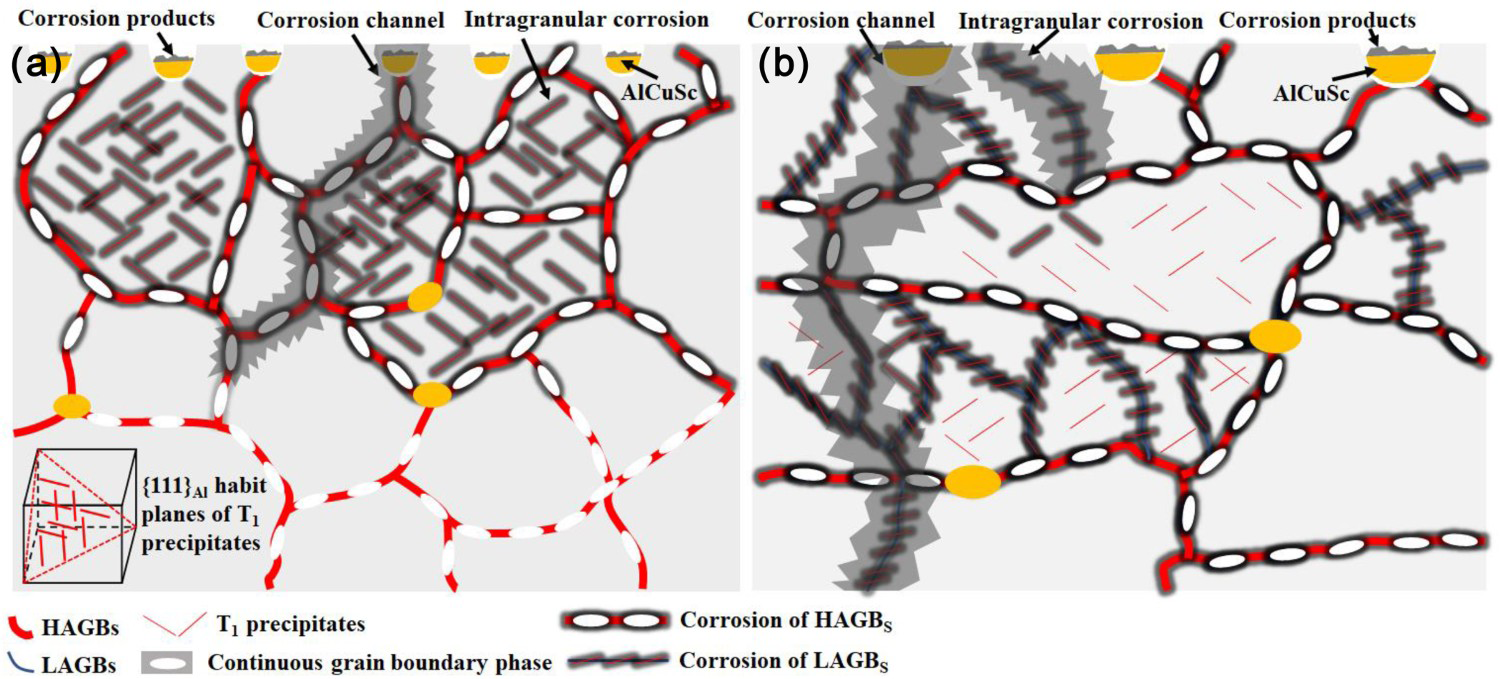
Conclusions
This work mainly discusses the synergetic effect of grain structures and precipitates on the corrosion behaviour of Sc-containing Al-Cu-Li alloy. The following important conclusions can be drawn:
The W(AlCuSc) phase has more negative potential than that of the Al matrix and dealloying occurs during corrosion. In addition, the dealloying rate of the W phase in the corrosive solution is relatively slow, which does not lead to serious pitting characteristics. The intergranular corrosion behaviour of peak-aged samples changed as the grain structure and precipitates. Owing to the decrease of LAGBs and the increase of precipitates of the grain interior, the corrosion mode from intergranular corrosion + sub-intergranular corrosion to intergranular corrosion + crystallographic corrosion. The preferential corrosion of T1 precipitates is the main reason for the low-angle grain boundary corrosion in the partially recrystallised sample, and the corrosion spreads along LAGBs to the grain interior. In addition, the precipitation of a large amount of T1 precipitates of the grain interior is the main reason for the intragranular corrosion characteristics of the completely recrystallised sample. Restraining the sub-intergranular corrosion and inducing crystallographic corrosion leads to lower electrochemical corrosion current and significantly improves the intergranular corrosion resistance. These results demonstrated that the grain structure and the distribution of precipitates together affect the corrosion sensitivity and corrosion growth rate.
Footnotes
Acknowledgements
This work is financed by the Laboratory stability support funding from the National Key Laboratory of Science and Technology for National Key Laboratory of Science and Technology on High-Strength Structural Materials, Central South University. The National Building Project of Application Demonstration Platform on New Materials Products (Project No.TC190H3ZV/2).
Disclosure statement
The authors declare that they have no known competing financial interests or personal relationships that could have appeared to influence the work reported in this paper.
Data availability
The raw/processed data required to reproduce these findings cannot be shared at this time as the data also forms part of an ongoing study.