
Abstract
Magnesium alloys are widely used due to their excellent properties, but their corrosion resistance is limited by their high chemical activity. This paper proposes a one-step hydrothermal method with a relatively short reaction time and simple experimental steps for synthesising magnesium alloy coatings with good corrosion protection properties. The surface morphology, chemical composition and corrosion resistance of the in situ generated coatings were investigated using measurements such as field emission scanning electron microscopy (SEM), adhesion cross-cut tape (ACCT) test, X-ray diffraction (XRD), X-ray Photoelectron Spectroscopy (XPS), electrochemistry and immersion test, the results revealed that the corrosion current density (Icorr) of the coatings decreased by approximately four orders of magnitude and had good corrosion resistance.
Introduction
Magnesium alloys are widely applied in a variety of industries [1,2], including chemistry, microelectronics, aerospace and biomedicine [3] due to their high specific strength, superior electromagnetic shielding, excellent electrical and thermal conductivity and biocompatibility [4]. Magnesium is a chemically active metal that is susceptible to oxidation-based corrosion. In aqueous solutions, they react electrochemically with water to produce corrosion products, leading to surface corrosion. The major factor preventing the use of magnesium alloys in industrial applications is their corrosion resistance issue. To overcome this serious defect, it is necessary to find ways to enhance the corrosion resistance of the surface of magnesium alloys. A common anti-corrosion technique is surface coating protection, which can effectively isolate and delay external contact without altering the chemical composition or microstructure of the magnesium substrate. Therefore, researchers have found various methods to prepare coatings to improve the corrosion resistance of magnesium alloys, such as micro-arc oxidation [5,6], chemical conversion [7], spraying [8 10], organic coating [11] and electrodeposition coating [12,13]. Among the various coating preparation techniques, hydrothermal method has received widespread attention due to its advantages in simplicity, controllability, low cost and good protection effect. Mg(OH)2 is an environmentally friendly inorganic functional material with harmless, biodegradable properties [14]. It has been used for flame retardant, refractory coating, catalyst and other applications [15]. Mg(OH)2 is also applied to the surface modification of magnesium-based materials to enhance the corrosion or degradation resistance, which can effectively provide a solution to the metal corrosion problem and degradable materials, especially medical magnesium alloys [16,17]. Qiu et al. [18] prepared dittmarite/Mg(OH)2 composite (DMC) coatings on AZ31 alloy surface by hydrothermal reaction at 140°C for 6 h and achieved good corrosion resistance of the coatings. Qin et al. [19] prepared a magnesium hydroxide layer on the surface of pure magnesium by a one-step hydrothermal treatment for 5 h, enhancing pure magnesium's corrosion performance. The above hydrothermal method has greatly improved the corrosion resistance of magnesium alloys, but some obvious disadvantages such as long hydrothermal time, complicated fabrication process and the use of expensive or toxic reagents cannot be ignored. So it is highly necessary to develop an experimental method for coating preparation that requires less time, higher efficiency and better corrosion resistance with environment-friendly and cost-effective materials.
In this work, montmorillonite was employed as a raw material to create a magnesium hydroxide anti-corrosion coating utilising a one-step hydrothermal process. When compared to the same composition and methods of coating preparation, the corrosion current of the coating was lowered by almost four orders of magnitude, the reaction time for coating formation was sped up, and a green and affordable material was used.
Experimental
Materials
AZ91D magnesium alloy (Al, 8.5%–9.5%, Zn, 0.45%–0.9%, Mn, 0.17%–0.4%, Si, ≤0.05%, Fe, ≤0.04% and Mg, balance) with dimensions of 20mm × 20mm × 5 mm (purchased from Dongguan Guangyue Metal Materials Co.) The chemical reagents used in the experiments were ethanol (analytical purity) purchased from Tianjin Fuyu Fine Chemical Co. The montmorillonite used in the experiments was purchased from ShanlinShiyu Mineral Products Co. Sodium hydroxide (analytically pure) from Xilong Science Co.
Fabrication of the coating
The surface was polished with 360#, 600#, 1000# and 1500# grit silicon carbide paper, then ultrasonic cleaned with deionised water and ethanol for 5 min to remove surface oil and contaminants. Then, the sample was set aside to dry naturally, montmorillonite was added and stirred with deionised water (20-40 ml) in a magnet for 10 min. Montmorillonite could be added in small amount for many times for its water absorption and expansion capacity. Subsequently, sodium hydroxide (0-0.1 g) was added to the montmorillonite suspension and kept stirring well. PTFE liner was added to the configured solution and together with the treated magnesium alloy sample, they were put in a stainless autoclave, sealed tightly and put into the electric oven at 170°C for 2 h. After the reaction, the sample was cooled to room temperature, taken out, washed with deionised water, and dried naturally. The samples made at different pH and solution concentrations were named 2wt%-7, 4wt%-7, 6wt%-7 and 4wt%-13, respectively, followed by characterisation and electrochemical testing. The experimental procedure is shown in Figure 1.
Procedure of the experiment.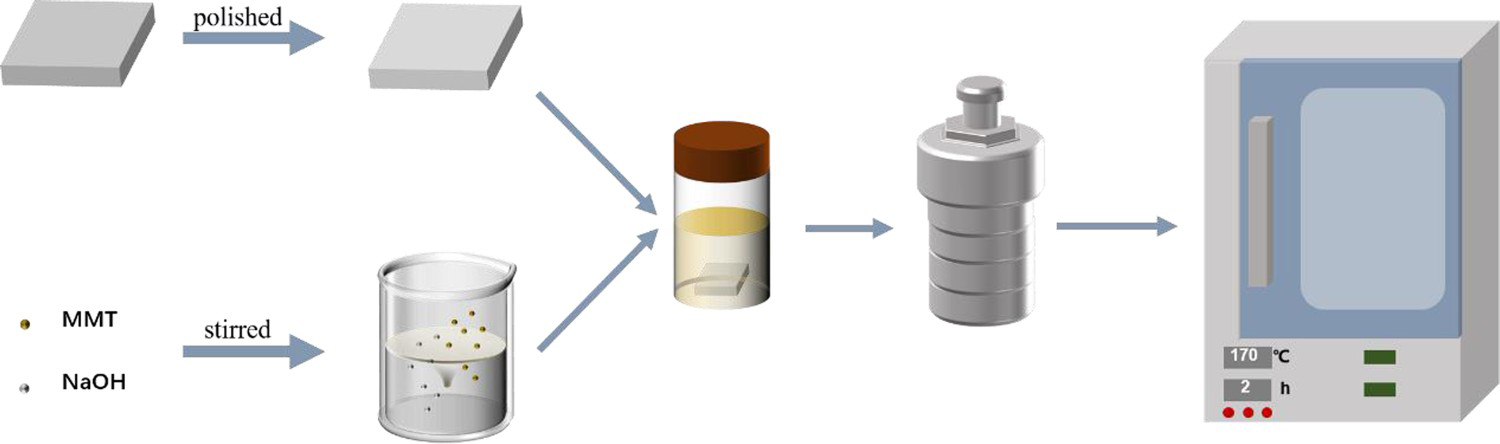
Coating characterisation
The surface and cross-sectional morphology of the samples were characterised using a field emission scanning electron microscope (SEM, KYKY-EM6900, KYKY, Beijing, China). The surface micromorphology obtained by SEM reflects the quality of the sample preparation. The crystal microstructure of the samples was analysed by X-ray diffraction (XRD, D8 Advance, Bruker AXS, Karlsruhe, Germany). X-ray photoelectron spectroscopy was measured and the chemical composition and elemental valence of the samples were analysed (XPS, Escalab 250Xi, Thermo Scientific, Waltham, America).
Electrochemical measurement
Electrochemical corrosion tests were done using a CS2350H electrochemical workstation (WuHan corrtest instruments Corp, Ltd., Wuhan, China) with a conventional three-electrode measurement system, a platinum auxiliary electrode, and an Ag/AgCl (saturated KCl) electrode as the reference electrode. As the working electrode, a test piece with a working area of 1 cm2 was used. Open-circuit potential testing of samples for 30 min before electrochemical testing to reduce the effect of surface instability on the electrochemical test results. The electrochemical test was done at room temperature with a scanning speed of 1 mV s−1 and a potential range of −0.5 V to 1 V. With an AC amplitude of 5 mV, the test range was from 0.01 Hz to 100 000 Hz. The electrochemical test results were fitted to an equivalent circuit model and analysed by software.
Result and discussion
Morphology and microstructure
SEM images of sample surfaces generated at various concentrations and pH values are presented in Figure 2, where Figure 2(a) shows 2wt%-7, Figure 2(c) shows 4wt%-7, Figure 2(e) shows 6wt%-7 and Figure 2(b,d,f) shows the surface coating growth pattern at 4wt%-13. In Figure 2(a), uneven protrusions and pits can be seen, with scattered lamellar structures in the pits visible at local high magnification, whereas in Figure 2(c), there are obvious cracks and protrusions on the surface, and at local magnification, larger and tighter lamellar structures can be seen than in Figure 2(a,c). On the surface of the sample, a big protrusion can be observed, and with high magnification, a dense lamellar structure of petals can be seen, which does not detach in Figure 2(e). A relatively dense covering may be seen in Figure 2(b,d,f). The coating has the same scratches as the substrate's surface, implying that the coating's thickness is quite thin. Because in solution corrosion occurs at the scratches, the particles on the coating's surface grow in the same direction as the scratches, suggesting that the coating was created in situ on the magnesium alloy surface.
SEM images of the samples (a) 2wt%-7, (c) 4wt%-7, (e) 6wt%-7, (b, d, f) 4wt%-13.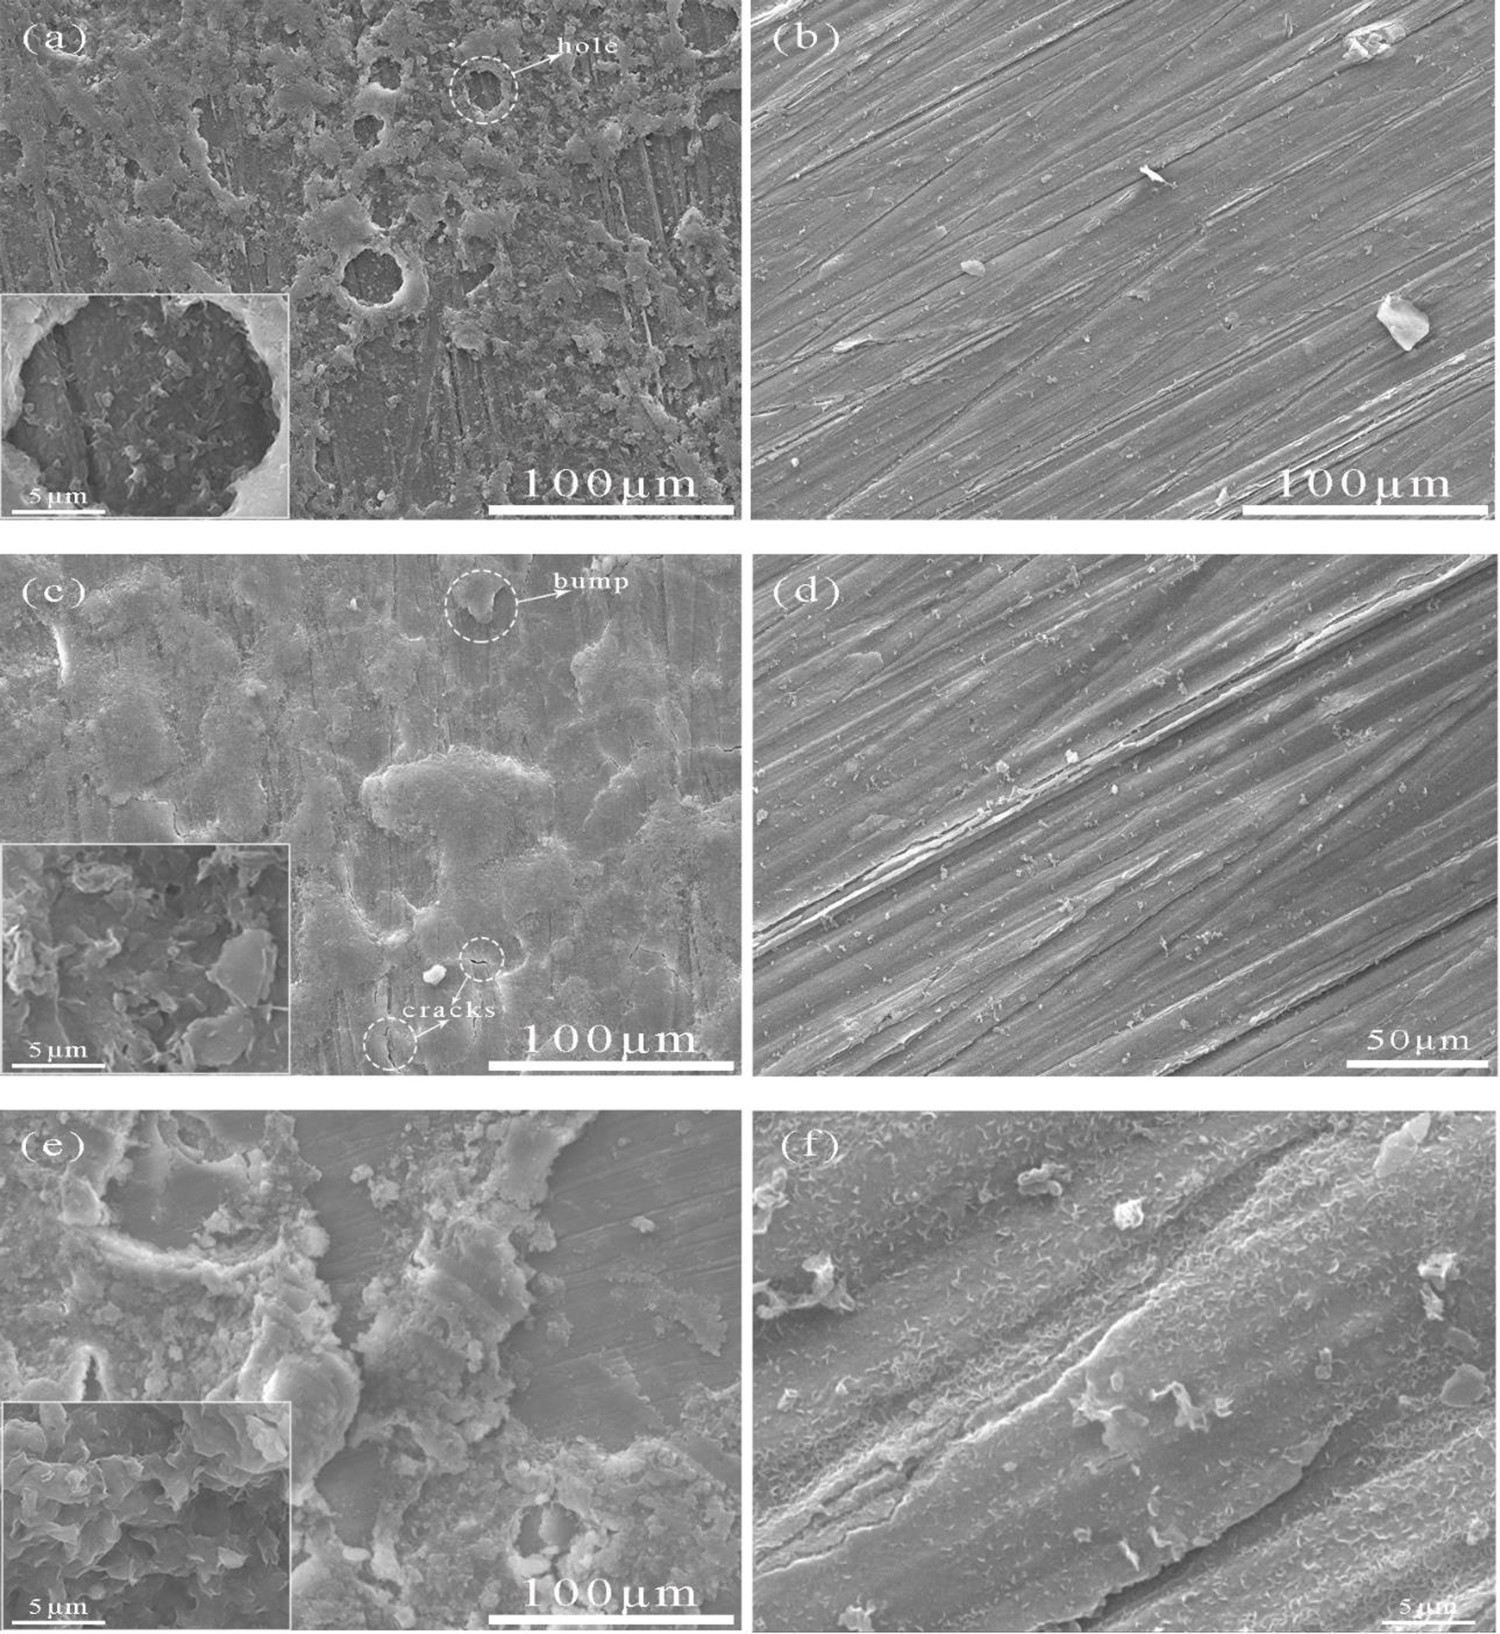
Adhesion cross-cut tape test
The adhesion strength is a basic requirement for corrosion protection and the adhesion cross-cut tape ACCT test [20] was used to check the adhesion of the coating. There are small pieces peeling at the intersection of the cuts and less than 5% of the coating was removed. According to the ASTM-D3359, the adhesion quality was ranked as 4B. It means the in situ film adhered well to the AZ91D magnesium alloy substrate.
XRD analysis
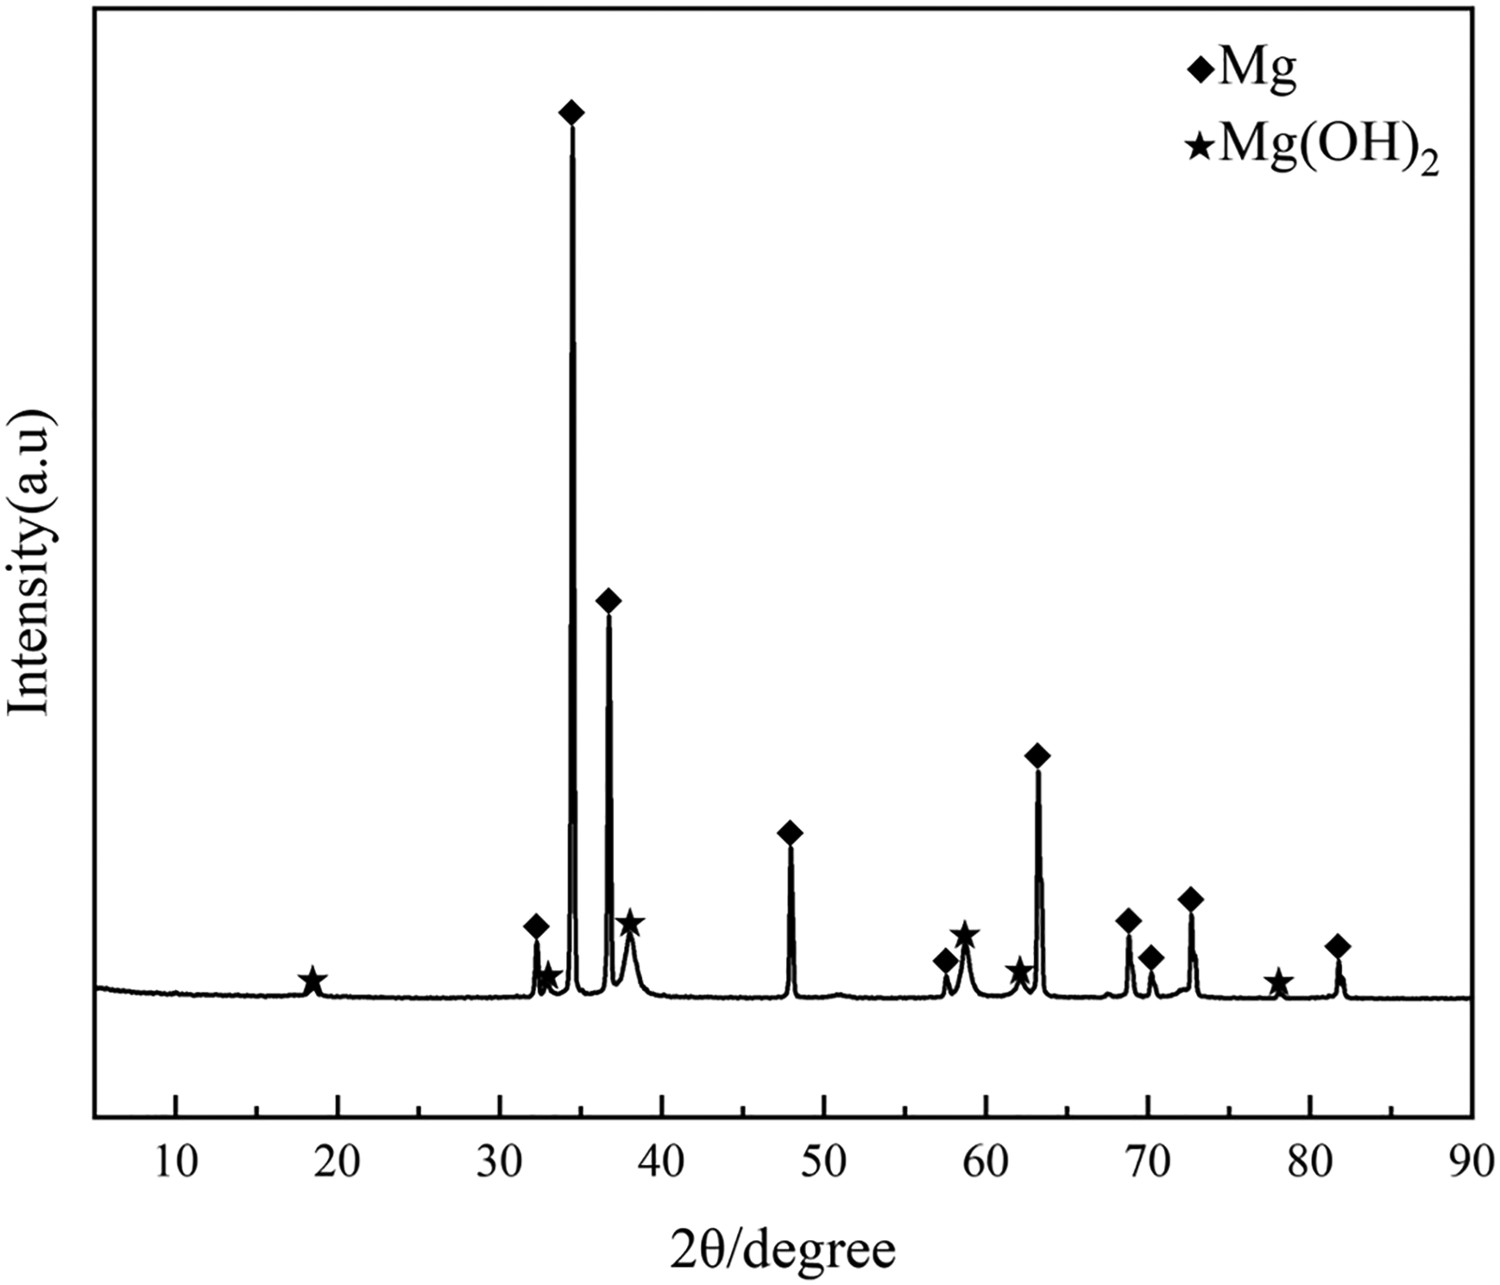
The XRD pattern of the experimental sample shows that the coating consists only of the magnesium phase. It can be observed that diffraction peaks were found at 2θ of 32.1°, 34.4°, 36.8°, 47.9°, 57.5°, 63.2°, 67.5°, 68.8°, 70.2°, 72.6° and 81.8°, which correspond to the crystallographic indices of Mg of (100), (002), (101), (102), (110), (103), (200), (112), (201) and (104), respectively. Diffraction peaks appeared at 2θ of 18.5°, 32.9°, 38.1°, 58.7°, 62.2° and 78. 1°, which after retrieval corresponded to the crystallographic indices of brucite Mg(OH)2 (001), (100), (101), (110), (111) and (202), indicating that Mg(OH)2 was generated on the surface of the coating and was the main component of the coating.
XPS analysis
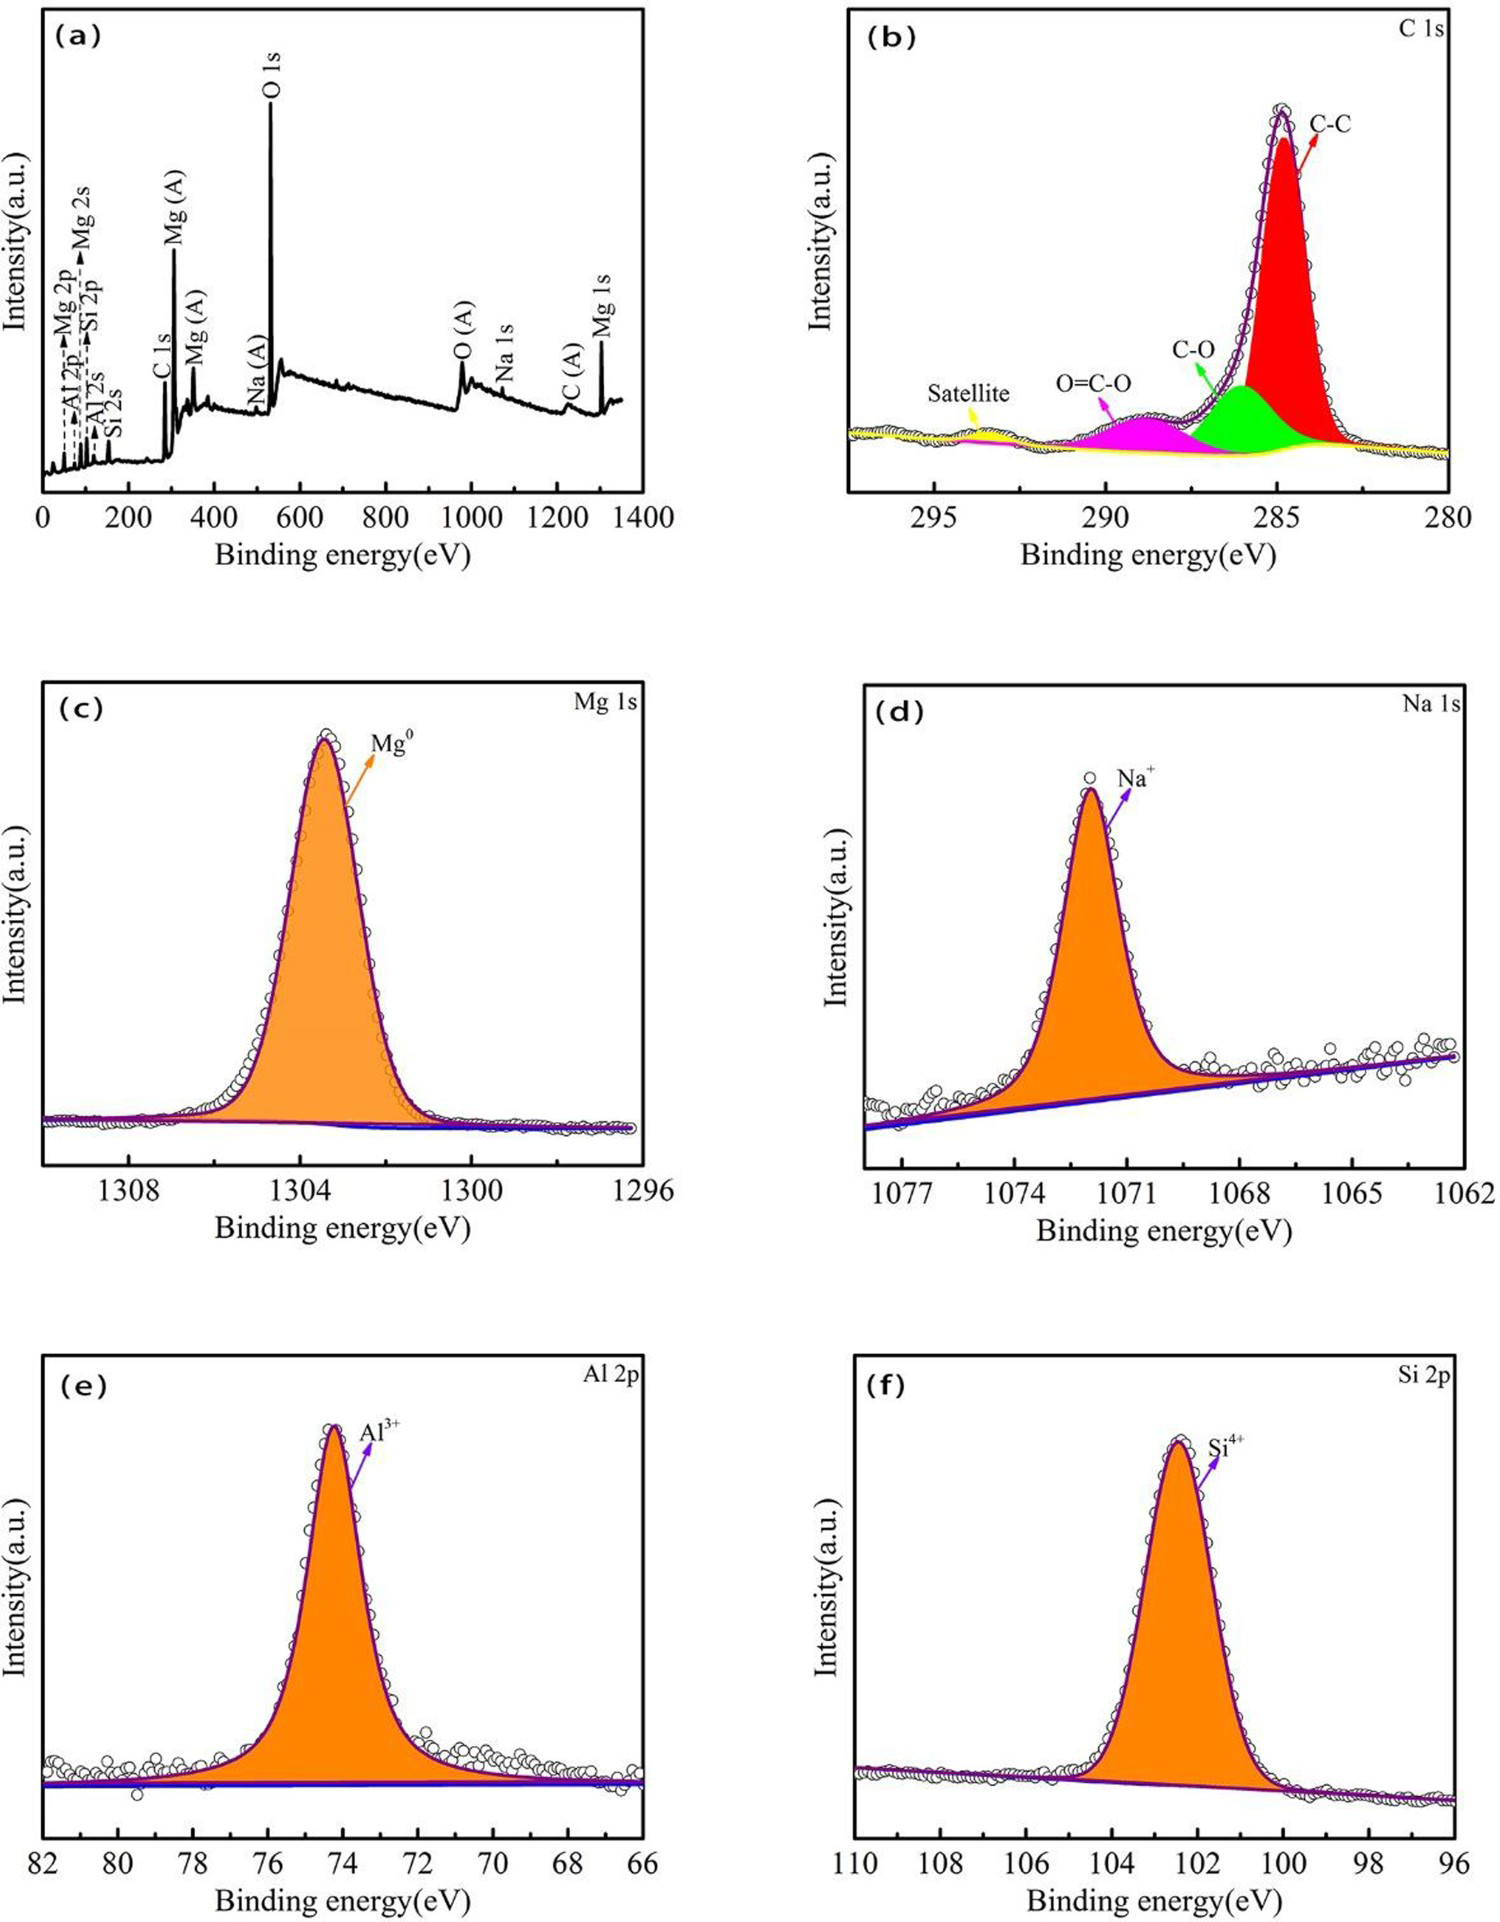
To further determine the coating elements of AZ91D coating, X-ray photoelectron spectroscopy (XPS) tests were carried out on the samples. The test results are shown in Figure 4. Figure 4(a) is the full XPS spectrum of the sample, which reveals the presence of Mg, O, C, Na and Si on the sample's surface. Figure 4(b–f) is narrow spectra of the XPS of the sample surface, showing the characteristic peaks of the elements present on the surface of the sample. In Figure 4(b), a C–C peak can be observed at 284.7 eV, a C–O peak at 286 eV, an O=C–O peak at 288.9 eV and a satellite peak at 293.4 eV. A Mg monomer peak at 1303.2 eV can be observed in Figure 4(c), indicating the presence of Mg monomer in the experimental sample. A Na+ peak at 1071.9 eV can be observed in Figure 3(d). An Al3+ peak at 74.2 eV can be observed in Figure 4(e). A Si4+ peak at 102.4 eV can be observed in Figure 4(f). The presence of Al and Si ions peaks in Figure 4(e,f) may be due to the hydrolysis of montmorillonite in alkaline solutions (Figure 5).
Surface observation of cross-cut tape test on sample. XRD pattern of the sample. XPS characteristic elements of AZ91D magnesium alloy substrate (a) full spectrum, (b) C 1s, (c) Mg 1s, (d) Na 1s, (e) Al 2p (f) Si 2p.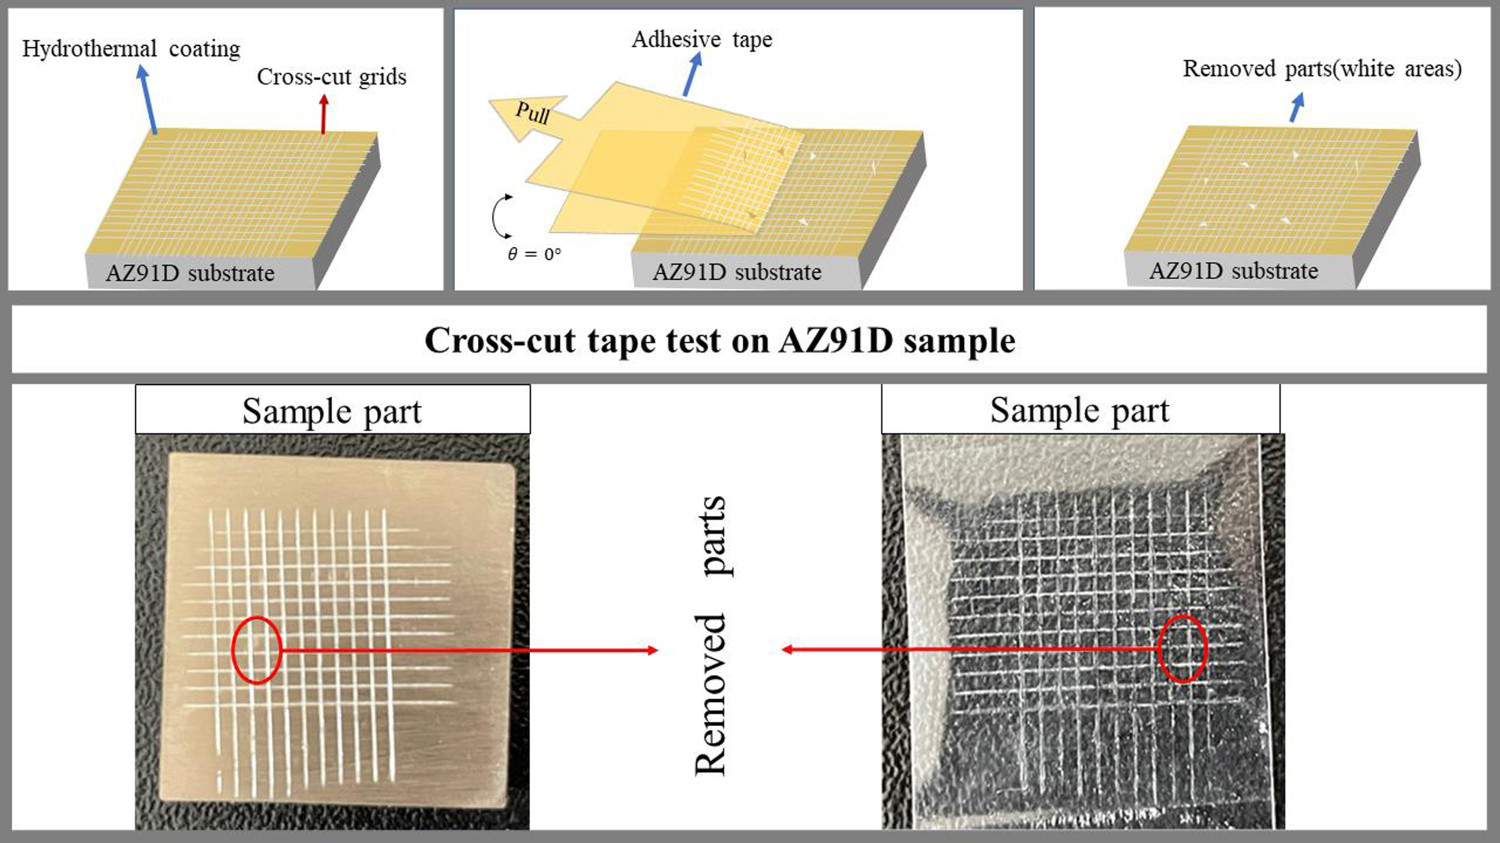
Mechanism of coating formation
The structure of Montmorillonite is a three-layer crystal sheet. The main layer is an O–Al (Mg)–O octahedral metal-oxygen sheet made of metal cation (Al3+ or Mg2+) between two O–Si–O tetrahedral sheets [21]. In such a layered structure, the Si in the centre of the tetrahedra and the cation in the centre of the octahedra are replaced by negatively charged cations with lower valence. Because the interlayer structure has good ion exchange properties, cations and polar molecules can be attracted to the interlayer interaction equilibrium [22,23].
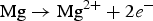
Interactions between interlayer spaces and particle spaces include cation exchange, changing the hydrophobicity, cation bridging, anion exchange and proton transfer, depending on the pH of the environment and the size and electrostatic properties of the molecules involved [24,25]. In addition, montmorillonite has metal atoms, like magnesium and aluminium. These metal atoms can be encased in the montmorillonite and react with other atoms to form the high-performance composition. Montmorillonite will dissolve upon reaction with alkaline solutions [26] and Wang et al. [27] immersed modified montmorillonite coatings in hydrochloric acid and NaOH solutions and found that after 300 h, the weight loss of the coating was greater in the NaOH solution than in the hydrochloric acid solution. This suggests that the layered structure of montmorillonite can effectively slow down the process of H+ and Cl− and improve the corrosion resistance of the coating. During the reaction, an anion from the solution, OH−, enters the montmorillonite interlayer or adsorbed on the laminate to balance the excess positive charge of the metal ions. The elements Mg and Al exchange with the Na+ in solution for the same reason, except that the main montmorillonite laminate binds Mg2+ and Al3+ more than the interlayer anion and exchanges less with the cation Na+. This explains the appearance of Mg2+ and Al3+ diffraction peaks in XPS. At a temperature of 170°C and pH = 13, OH− ions in solution promoted the nucleation of Mg(OH)2 and flakes of Mg hydroxide were deposited on the magnesium alloy substrate [28]. The reaction equation for the formation of magnesium hydroxide is as follows.


Corrosion resistance performance
Electrochemical measurement
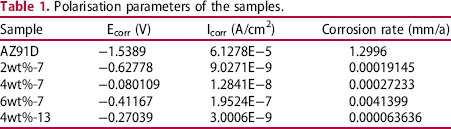
The corrosion resistance of the experimental samples was studied by conducting potentiodynamic polarisation (PDP) test. The corrosion potential (Ecorr) and corrosion current density (Icorr) of the coating were determined by extrapolating the Tafel linear polarisation curves on the anodic and cathodic sides. Figure 4 is the polarisation curves measured in a 3.5 wt% NaCl solution for AZ91D, 2wt%-7, 4wt%-7, 6wt%-7 and 4wt%-13. The corrosion potential and corrosion current characterise the corrosion rate of the sample. In general, the higher the corrosion potential or the lower the corrosion current density, the better the corrosion resistance [29]. Conversely, the higher the corrosion current density value obtained for the coating, the faster it dissolves in the 3.5% NaCl solution and the less corrosion resistance [30].
Polarisation parameters of the samples.
EIS measurement
The electrochemical impedance spectrum is analysed and fitted to this impedance spectrum according to a mathematical model or equivalent circuit model, and the coating properties and the coating damage process such as solution resistance, coating resistance, coating capacitance and interfacial reaction resistance are obtained in different frequency ranges, providing a method to explain the corrosion process. Figure 6 shows the Nyquist curves for the magnesium alloy substrate and test samples in a 3.5 wt% NaCl solution. In general, when the Nyquist plot has a larger capacitive arc, it indicates a lower corrosion rate of the sample, and higher resistance of the sample indicates a stronger barrier to electrons [31]. The graph shows that the capacitive resistance arc of the experimental sample is much larger than that of the AZ91D magnesium alloy substrate.
The potentiodynamic polarisation curves of the samples in a 3.5 wt% NaCl solution.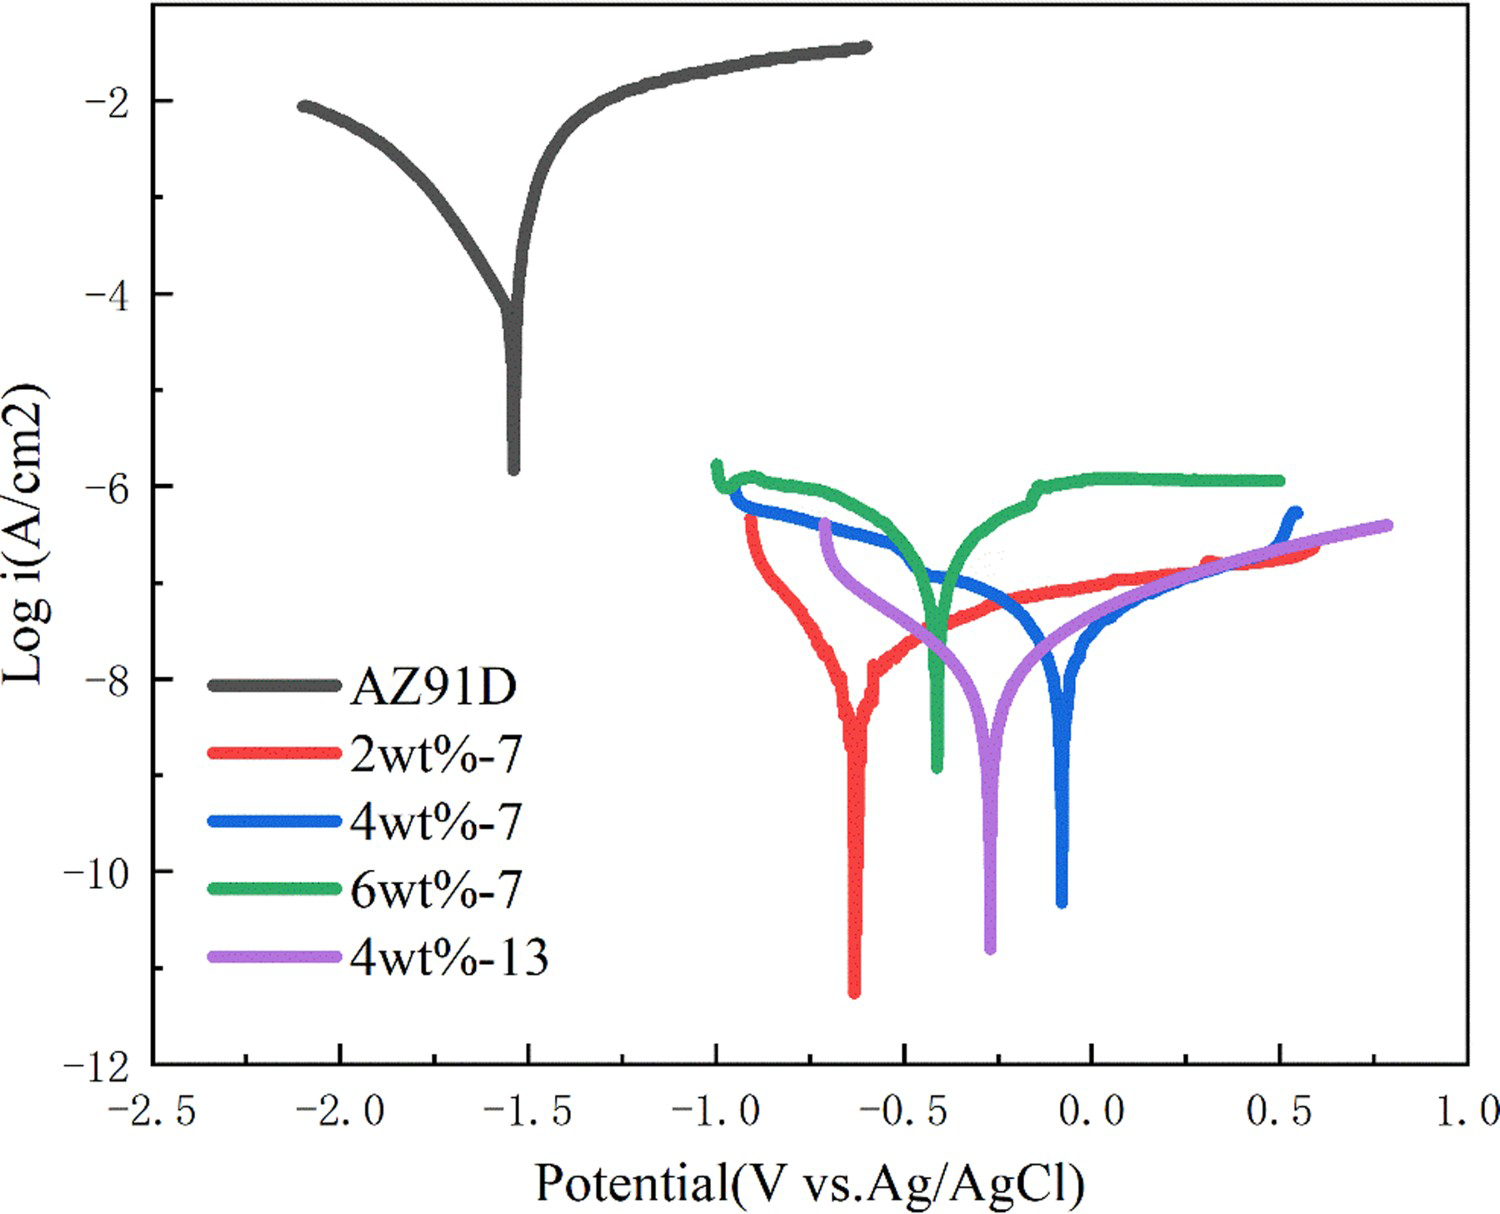
Figure 7 shows the Bode curves for the magnesium alloy substrate and sample in 3.5 wt% NaCl solution. In general, the higher |Z| modulus measured at lower frequencies, the better corrosion resistance of the test sample [32]. During testing, the experimental samples consistently exhibited greater moduli, demonstrating that the coating prepared on the magnesium alloy improved the corrosion resistance. The impedance curves show that the values for the experimental samples are four orders of magnitude higher compared to the magnesium alloy substrate, which is consistent with the results of the measured potentiodynamic polarisation curves, indicating that the experimental samples have better corrosion resistance. The modulus decreases with increasing frequency, representing the progressive corrosion of the magnesium alloy. The impedance curve of the experimental sample starts to gradually decrease with increasing frequency, implying that the magnesium hydroxide on the surface of the sample starts to dissolve, and when the frequency is 100 Hz, the modulus starts to stabilise, probably due to the deposition of a new product film at the corrosion site.
Nyquist curves of the magnesium and sample.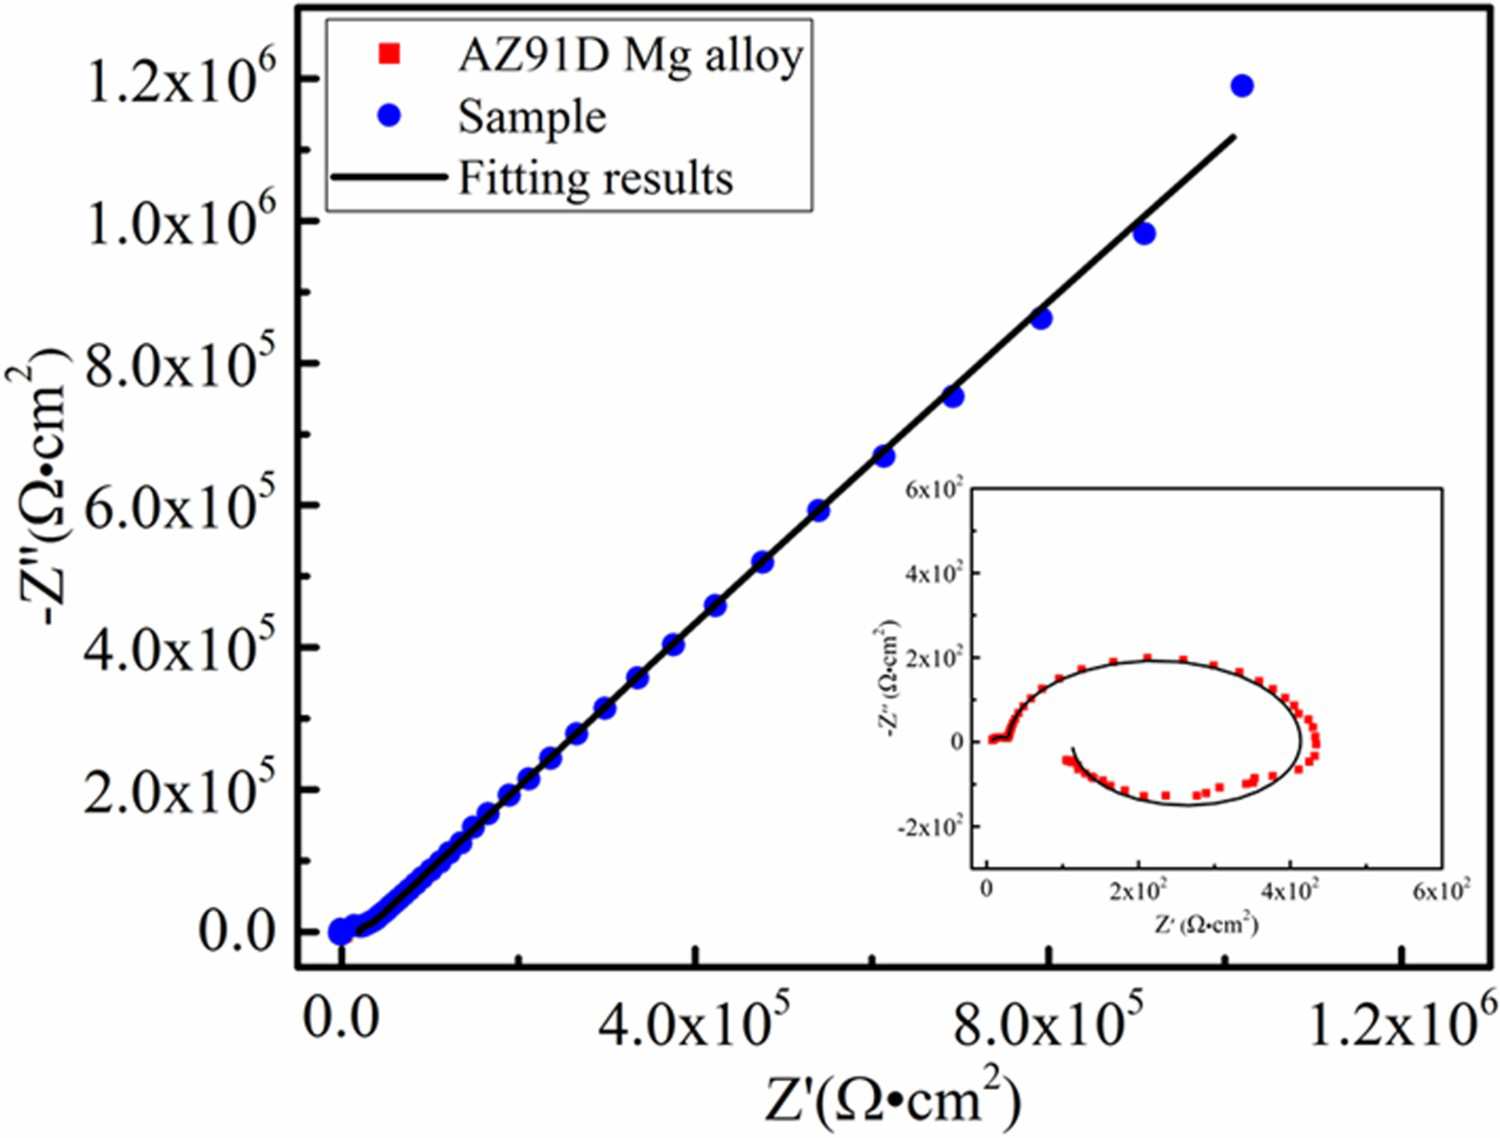
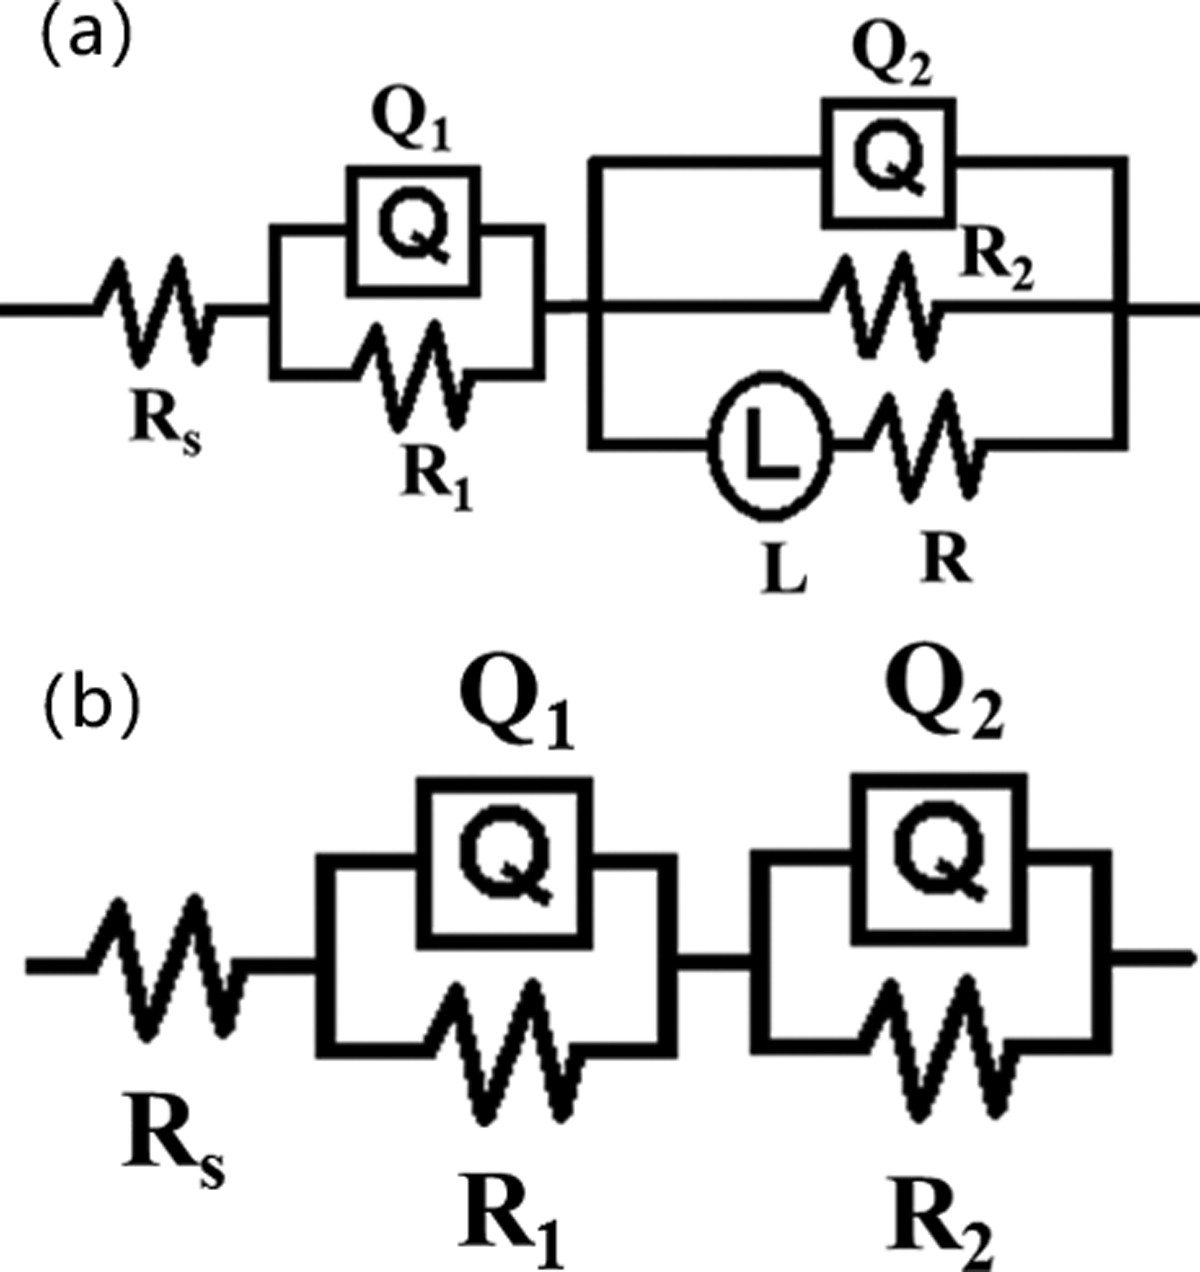
The electrolyte solution penetrates the substrate as a result of coating defects, starting corrosion. To analyse the EIS data, the equivalent circuit models of the magnesium alloy substrate and the experimental samples are shown in Figure 8. In the circuits, R S represents the solution resistance, R 1 and Q 1 are the interlayer resistance and capacitance. R 2 and Q 2 correspond to the Mg(OH)2 coating resistance and capacitance. Figure 8(b) shows the equivalent circuit for the coating, showing that the electrolyte solution penetrates evenly into the coating system and the corrosion cells at the interface are uniformly distributed. As time increases, the corrosion product film resistance and charge transfer resistance gradually decrease and the corrosion rate increases (Figure 9).
Bode curves of the magnesium and sample. Equivalent circuit model of the (a) magnesium alloy, (b) sample.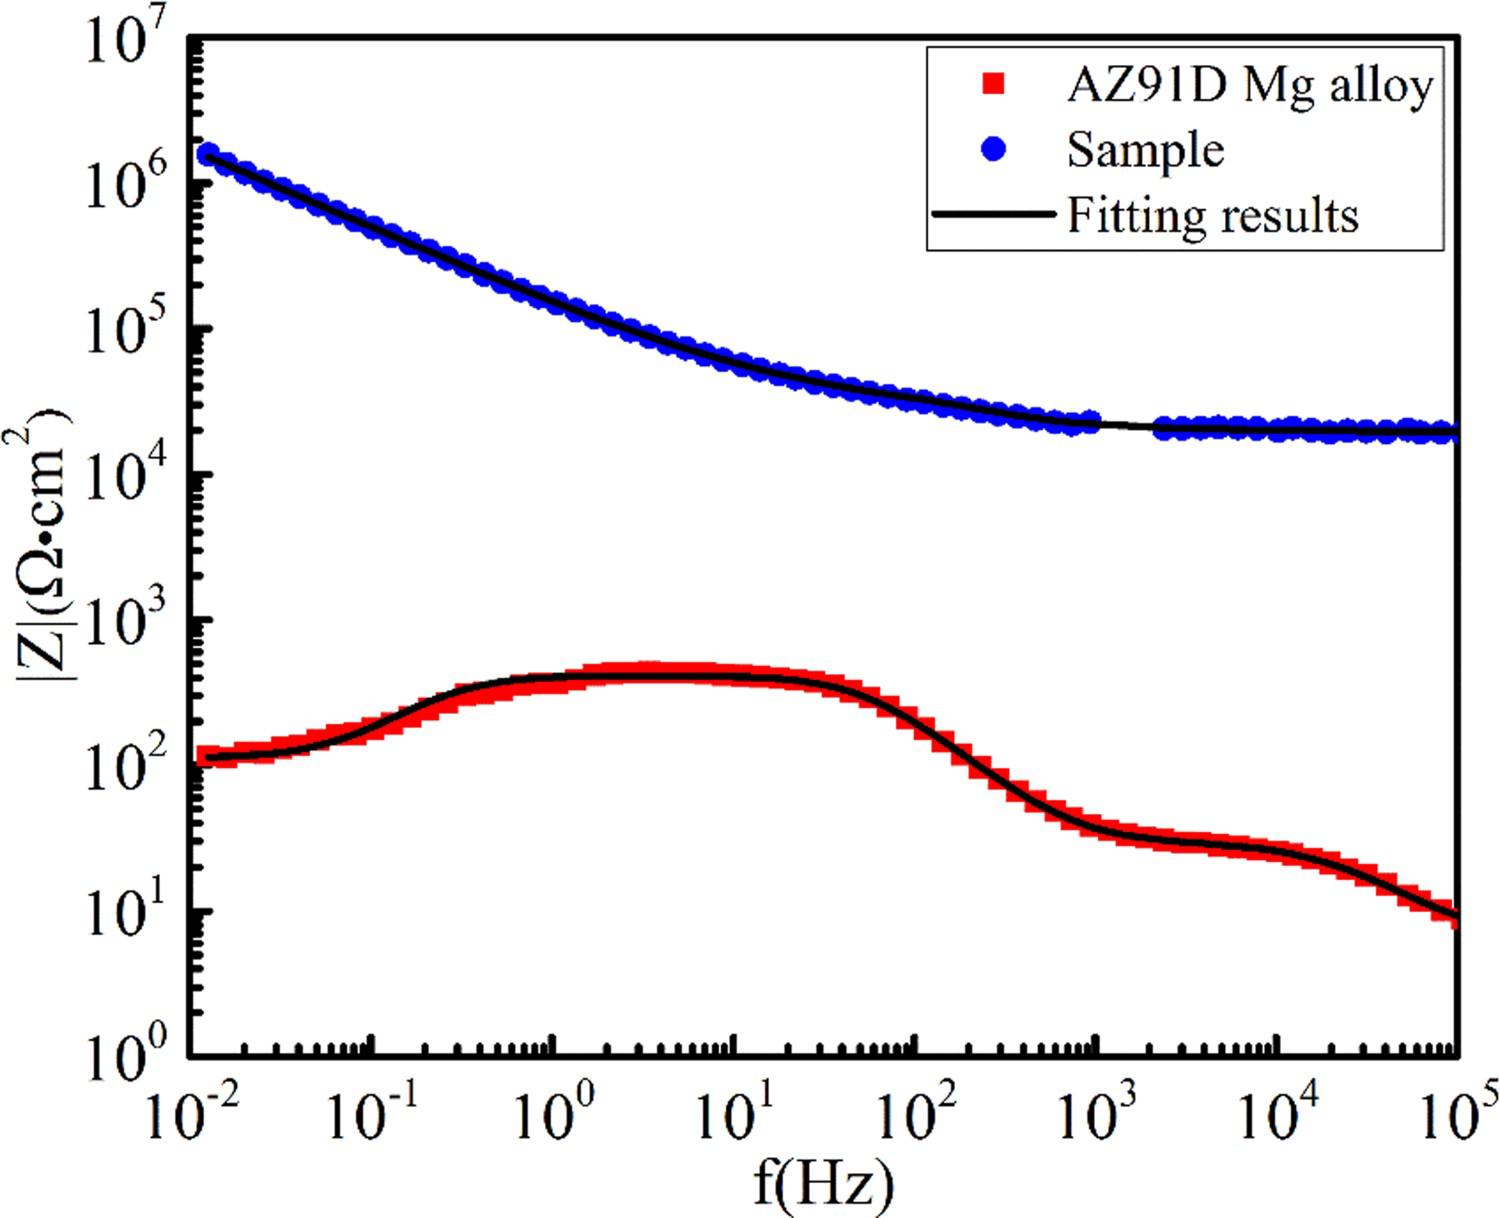
Immersion test
According to ASTM-G31-72, an immersion test was performed to the AZ91D substrate and sample at room temperature. The immersion samples were cleaned with deionised water before the test and dry naturally, then weighed their initial weight w0. A base created through 3D printing was used to ensure that the magnesium alloy was entirely submerged before the substrate and samples were each fully submerged in a 5 wt% NaCl solution. The experimental process is depicted in Figure 10. The corroded specimens for the immersion test were cleaned each 24 h immersed with distilled water and dried. Then immersed in a chromate acid (200 g l−1 CrO3 + 10 g l−1 AgNO3) at room temperature for 5-10 min to remove the products of corrosion [33].
Procedure of the immersion test.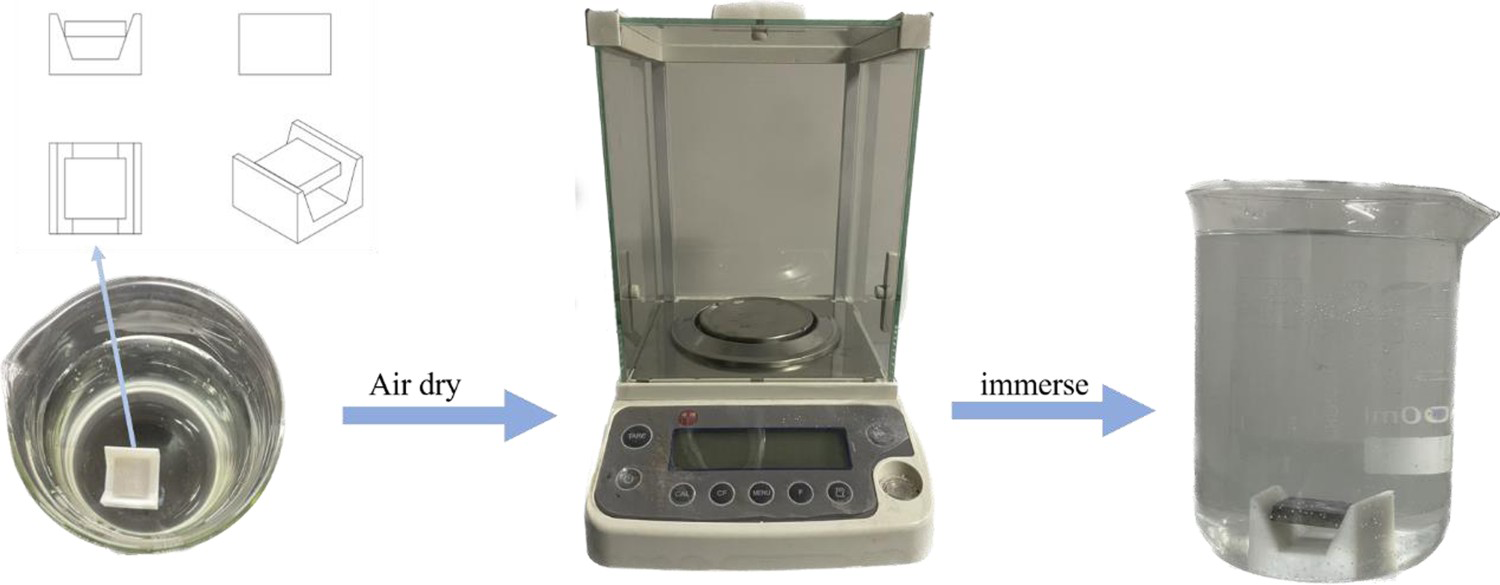
The surfaces of AZ91D substrate and anti-corrosion sample are shown in Figure 11. When the substrate immersed in 5 wt% NaCl, dense bubbles appeared on the surface. After 24 h of immersion, the surface metal layer peeled off, leaving pitting holes and a few cracks behind. As immersion time grew, the surface became steadily rougher, cracks and pitting depth increased, and the solution became turbid. When the sample immersed in 5 wt% NaCl, the bubbles were obviously less than substrate. After 48 h, the defect on the surface started to expand and a few cracks started to emerge on the surface. After 168 h of immersion, the solution remained transparent.
Surfaces of AZ91D substrate and anti-corrosion sample immersed in 5 wt% NaCl.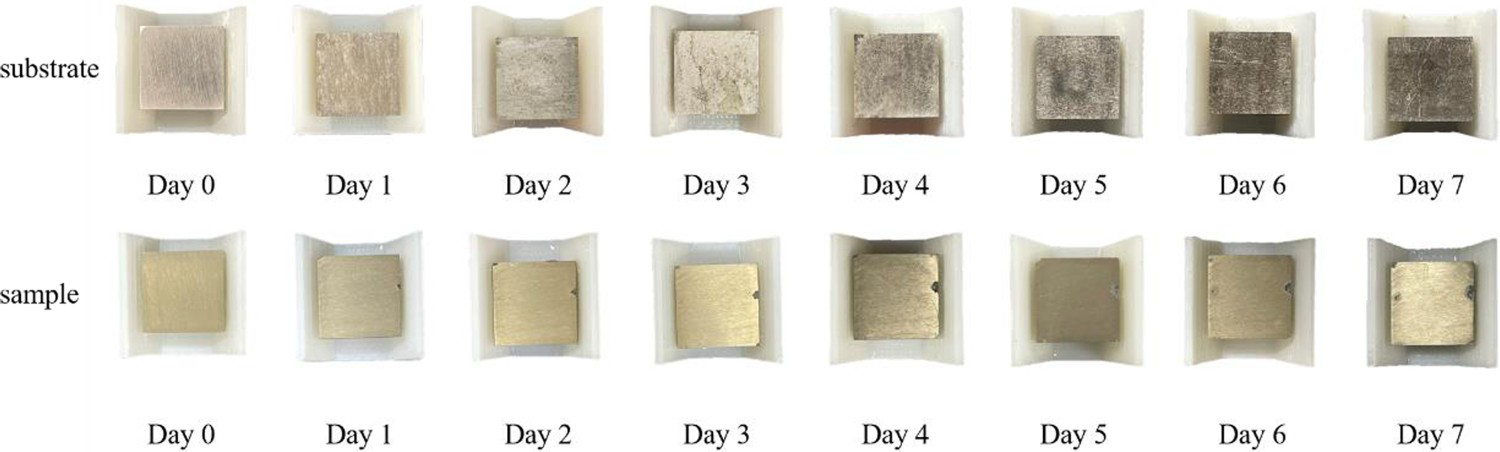
In Figure 12, compared the weight loss Δw of the substrate and sample. The corrosion rate of the sample is much smaller than substrate. The coating is relatively dense and will not be as loose as the corrosion product to result a large number of Cl− ions crossing the coating and leading to pitting corrosion of the magnesium alloy [34]. In addition to efficiently preventing the admission of most chloride ions, the Mg(OH)2 formed in coating preparation and during corrosion inhibit the entry of water molecules [35].
Lost weight of AZ91D magnesium and sample.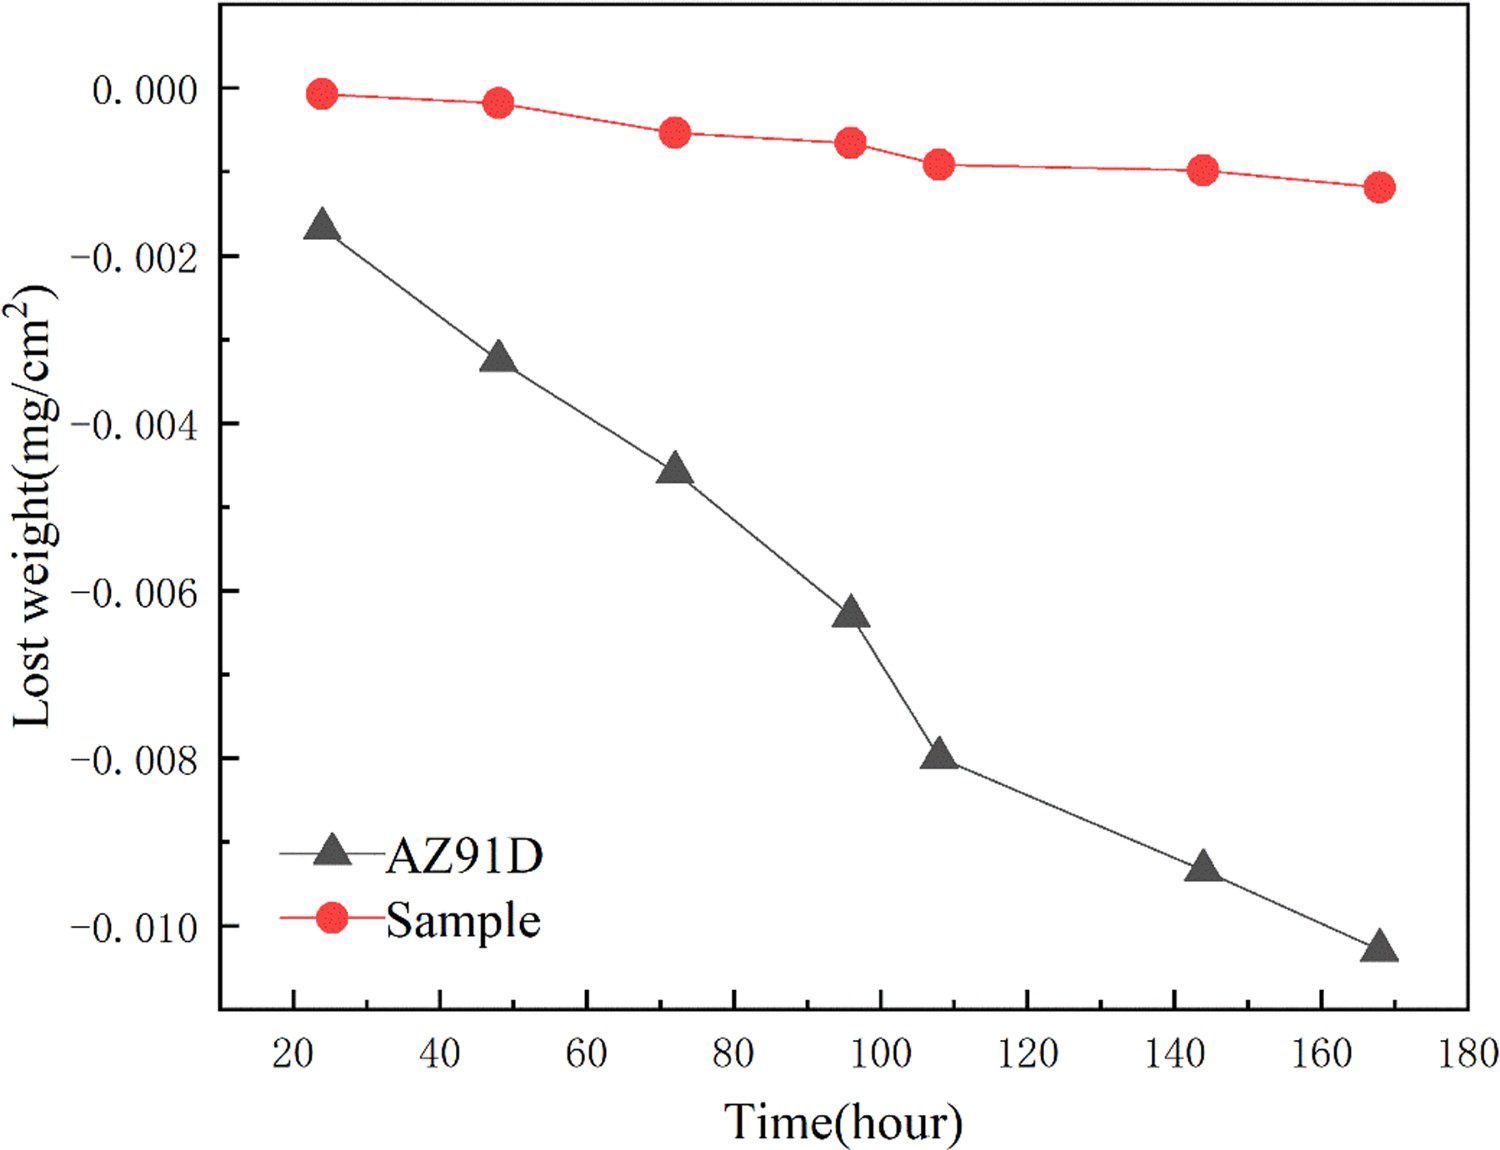
Conclusion
In this experiment, a hydrothermal one-step approach was used to successfully produce an anti-corrosion coating on the surface of AZ91D magnesium alloy. Compared with the substrate, the corrosion current was reduced by approximately four orders of magnitude. The corrosion tests were compared with samples of different pH and solution concentrations, and it shows that samples made at 170°C for 2 h and solution concentration of 4 wt%, pH close to 13, with a significant decrease in corrosion rate in a 3.5 wt% NaCl solution, exhibited the best corrosion resistance. The experimental procedure is simple and environmentally friendly with affordable chemical reagents and rather quick reaction time. These prove the feasibility and significance of reference and promotion of the preparation method.
Footnotes
Disclosure statement
No potential conflict of interest was reported by the author(s).