
Abstract
According to the literature data graphene oxide cannot be easily used as an anti-corrosion barrier on metals and alloys, especially on carbon steel. This article shows that the oxidised form of graphene can improve the electrochemical corrosion parameters of carbon steel, if necessary modifications on the surface structure and wettability of steel are made prior to the coating step. In this study, the effects of surface roughness and hydrophilicity of carbon steel on the anti-corrosion performance of the electrophoretically deposited graphene oxide were investigated by potentiodynamic polarization and electrochemical impedance spectroscopy. The results showed that increasing the roughness and hydrophilicity of the bare steel surface promotes the mechanical interlocking/adhesion between the graphene oxide and steel and this improves the protective performance of the deposited graphene oxide barrier on steel.
Keywords
Introduction
Graphene's hydrophilic and conductive properties have attracted great attention of corrosion specialists. Since 2010, researchers have tried to investigate the anti-corrosion properties of this material through either its direct deposition on metallic substrates using chemical vapour deposition (CVD) [1] and electrochemical deposition methods [2] or by combining it with different polymeric compounds in the form of composite coatings [3].
Recently some researchers have developed a new idea to apply graphene as a pigment in paint, hoping that it could provide an ultra-strong and non-corrosive coating for a wide range of industrial applications [4]. Therefore, graphene paint seems to have a good chance to become a truly revolutionary product for industries that deal with any kind of protection either from air, weather elements, or corrosive chemicals.
However, application of graphene as a corrosion protection material has some serious limitations, mainly due to the nobler potential of carbon in comparison to most metals and alloys [5] and the poor quality of the graphene coatings that are usually made [6,7].
Although according to the existing literature data, pure graphene coatings with good qualities are achievable through growing graphene layers (single or multiple) by CVD [8 12]; only a limited number of metals and alloys such as platinum, cadmium, titanium, and gold can withstand the high temperature of the CVD furnace (up to 900°C). Therefore, other materials such as duplex stainless steel and carbon steel cannot be coated by CVD [13,14]. The alternative coating methods however, such as spraying [15], electrophoretic deposition (anodic and cathodic) [16], and electrochemical reduction [17] that technically can be used to coat graphene layers on steel, copper, and other metals and alloys generally suffer from the poor quality and low coverage of the coatings.
From the electrochemical point of view, the nobler potential of carbon compared to most metals and alloys in the galvanic series, and its high electrical conductivity, means that carbon in contact with metallic materials acts as cathode and therefore, induces the oxidation and corrosion of the coated metallic substrates [18,19], even when carbon is applied on metallic surfaces in combination with electrically non-conductive polymeric compounds (graphene embedded composite coatings) [20 22].
Based on these two drawbacks, some scientists have made the implication that graphene cannot act as an effective anti-oxidation/corrosion barrier on metals and alloys especially over long timescales [18].
Recently reduced GO (rGO) has been used by corrosion researchers to provide a protective barrier on metals and alloys. In general, rGO is prepared by one of these four methods: (i) electrochemical reduction of GO coating; for example, by cyclic voltammetry [23], (ii) chemical reduction of GO coating; mainly by NaBH4 and KOH [24 26], (iii) heat treatment of GO [27,28] and (iv) chemical reduction of GO before deposition (cathodic electrophoretic deposition) [16,29 35].
The results published by Park and his co-worker [6] show that application of rGO on mild carbon steel, not only does not improve the electrochemical corrosion parameters of steel, but also shifts the corrosion potential (E corr) of the coated steel towards more negative potentials.
In another study performed by Kirkland et al. [12], the authors coated copper and nickel by pure graphene using CVD and concluded that graphene can effectively reduce the corrosion rates of both copper and nickel. However, their results show that in the case of copper, graphene only reduces the rate of the cathodic partial electrochemical reaction on the metal and similar to the work of Park and his colleague, here also graphene-coated copper has a more negative E corr compared to the bare copper sample.
In the studies performed by Schriver et al. [18] and Dong et al. [36] also we can see that although deposition of pure graphene on copper by CVD has some short-term beneficial effects on reducing the oxidation and corrosion rates, on a long-term scale, graphene causes even more severe corrosion of copper.
According to Lee and Berman [37], the existence of microcracks and defects in the non-uniform graphene coatings, promotes the corrosion of metal. These authors believe that the edges of the graphene flakes can trap the chloride ions and act as active sites for oxidation and dissolution of metals.
As another example, Jo et al. [38] coated copper with pure graphene using CVD and analysed the long-term oxidation behaviour of the coated copper in air. These authors concluded that the formed micro defects/cracks in the graphene coating have a positive and a negative effect on the oxidation process of copper in air. In the model proposed by Jo et al. [38]; depending on the defect density of the graphene coating; the micro defects can either promote the diffusion of the formed cation vacancies from the oxide layer into the bulk metal, or suppress the diffusion of the cation vacancies through the formation of a CuO layer.
Several other researchers also have reported the problematic behaviour of graphene coatings on metals and alloys [5,39 45].
These scattered and contradictory data reveal that more detailed research needs to be conducted on the protection mechanism of graphene on different types of metals and alloys, especially on carbon steel.
In this study, the electrochemical corrosion behaviour of carbon steel coupons with different surface structures (texture, roughness) was investigated in presence of chloride ions with and without being coated with multilayers of GO. The GO coatings were applied on the steel coupons by anodic electrophoretic deposition. The purpose of this study was to introduce a method in which the oxidised form of graphene can be used on metals and alloys as an anti-corrosion barrier to improve their electrochemical corrosion parameters, without the need of using rGO.
Experimental
Materials and methods
The electrophoretic deposition tests were performed in a two electrode setup using a DC power supply (Model MS-3010D). In this setup the cathode electrode (−) was a platinum plate (L = 3 cm × W = 2 cm × T = 0.0002 cm) and the anode (+) was a carbon steel coupon (L = 1 cm × W = 1 cm × T = 0.3 cm). The distance between the anode and cathode was fixed at 2 cm and the GO suspension was stirred at a constant speed during the deposition tests.
The fresh GO suspensions with the concentration of 1 mg/ml were used for the anodic electrophoretic deposition. The GO suspensions with uniform dispersion of the graphene platelets were prepared in deionised water through sonication of the suspensions in an ultrasonic bath for 30 min.
For coating the steel coupons with GO, different voltages (3 V up to 30 V) with different deposition times (2 min up to 20 min) were applied. The coated coupons then were dried in an oven at 60°C.
The electrochemical corrosion measurements were performed using a Princeton (PARSTAT-2273) potentiostat in a three electrode setup at room temperature, with a carbon steel coupon as working electrode, a saturated calomel reference electrode (SCE), and a platinum counter electrode.
The carbon steel coupons used in this study had the following chemical composition (in wt-%): C 0.15, Si 0.24, Mn 1.47, P 0.01, S 0.01, V 0.06, Ti 0.0013, and Cr 0.21.
After preparation of the steel coupons, each coupon was first welded to a copper wire and then positioned into a plastic sample holder containing epoxy resin. This way only one side of the surface of each coupon was exposed to the solution during the electrophoretic deposition and electrochemical corrosion measurements.
For the corrosion measurements, the steel coupons were immersed into a 0.1 M sodium chloride solution (Fluka) and after monitoring the open circuit potential (OCP) values of the working electrodes, their potentiodynamic polarization curves and electrochemical impedance spectroscopy (EIS) plots (Nyquist) were recorded.
The potentiodynamic polarization curves were recorded in the potential range from −0.25 V to −0.4 V, 60 min after the immersion of the steel coupons into the solution.
The EIS plots were recorded immediately after the end of each potentiodynamic polarization measurement, in the frequency range from 10 kHz to 0.001 Hz with an amplitude of 5 mV.
The mechanical grinding of the steel coupons was performed using silicon carbide (SiC) papers with different grits (# 2000, # 1200, # 800, # 400, and # 150). To prepare the mirror-like polished steel coupons, the coupons were first ground with 400, 800, 1200, 2000, and 4000 grit SiC papers, respectively, and then polished with a polishing cloth (MicroCloth, Buehler) using a 0.50 μm water-based diamond paste.
After polishing/grinding, the coupons were washed with distilled water and acetone and rinsed ultrasonically in ethanol for 5 min.
Chemical etching of the steel coupons was performed by immersing the coupons in a 20 ml HF + 20 ml H2O2 for 4 min.
Scanning electron microscopy (SEM), atomic force microscopy (AFM), laser processing, FTIR spectrometry, contact angle, and X-ray diffraction (XRD) measurements
For the microscopic surface analysis of the etched and laser-textured steel coupons a ZEISS (EVO MA15) SEM was used.
The 3D surface maps of the ground and etched steel coupons were taken by a Nano ManVS AFM.
The laser texturing of the steel coupons was performed by a picosecond processing system in ambient air. Three different patterns with parallel/crossed grooves and dimples (micro pits) were applied to the steel coupons.
The applied laser parameters for each pattern were as follows: (i) parallel straight grooves pattern:
power 9 W, scanning speed 3000 mm/s, frequency 1000 kHz, scanning time 250 times; (ii) crossed grooves pattern: power 9 W, scanning speed: 3000 mm/s, frequency 1000 kHz, scanning time 250 times; and (iii) dimples pattern: power 9 W, scanning speed: 100 mm/s, frequency 400 kHz, scanning time 18 times. After laser texturing the steel coupons were cleaned ultrasonically with ethanol and then dried in air.
The FTIR spectra of the GO and GO coatings were recorded using a Nicolet iS50 spectrometer.
The water contact angles of the bare steel surfaces (polished, ground, and laser textured) and GO/rGO coatings, deposited on a # 2000 ground steel coupon were determined by a Dataphysics DCAT20 optical goniometer.
The XRD analysis of the coatings was performed in the 2ϴ (°) range from 0° to 45° by an 18 KW/D/max2550VB/PC rotating anode X-ray diffractometer, using a Cu Kα (450 mA) radiation, operated at 40 kV and 100 mA, with the scan rate of 15°/min and step size of 0.02°.
Results and discussion
Electrophoretic deposition of GO and electrochemical corrosion parameters of coated steels
Literature data shows that besides water [46], other solutions/media also can be used to disperse graphene platelets in the form of a suspension. Some of these media are NH3HCO3 [46], ethanol [47], Mg(NO3)2 [48], LiClO4 [49], DMF + Mg (NO3)2 [50,51], CaCl2 [35], and NaOH [52].
In this study, the GO suspensions with the approximate size distribution of 117 nm (32.9%), 149 nm (44.6%), 189 nm (22.5%), and average platelet size of about 150 nm were prepared in distilled water and the steel coupons were coated by applying different voltages with different deposition times. The electrochemical corrosion parameters of the coated coupons then were measured by potentiodynamic polarization and EIS.
The prepared GO suspensions in this study had a good stability over time. However, our experiences revealed that applying the DC voltage during the anodic electrophoretic deposition process in distilled water causes the GO suspension to precipitate faster.
Figure 1 illustrated the effect of the applied DC voltage on the precipitation rate of the freshly prepared GO suspensions in water. The applied voltage in this figure was 6 V. Here the charged GO suspensions show that as the duration of the voltage application gets longer, the ratio of the precipitated GO particles to the suspended particles increases. Finally, after charging the suspension with 6 V voltage for 10 h, almost whole the GO precipitates.
Photograph of a 3 weeks old uncharged and freshly prepared and charged GO suspensions.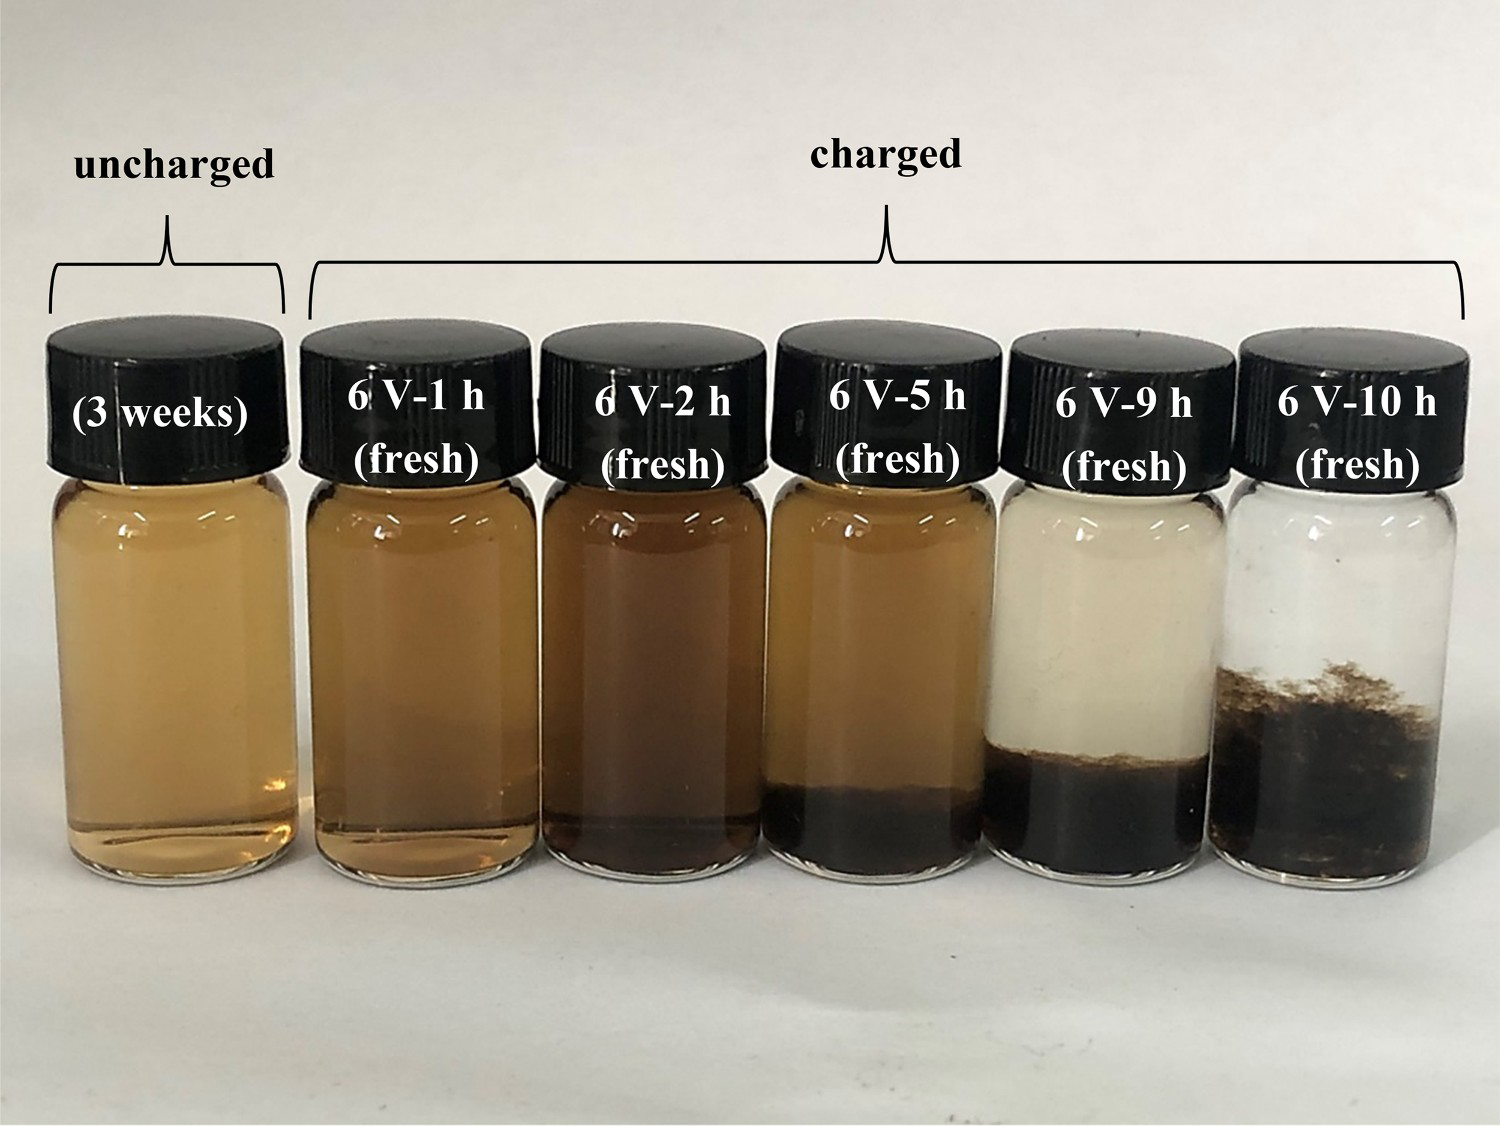
Experimental matrix of the electrophoretic deposition of GO on carbon steels with the electrochemical corrosion parameters of steels.
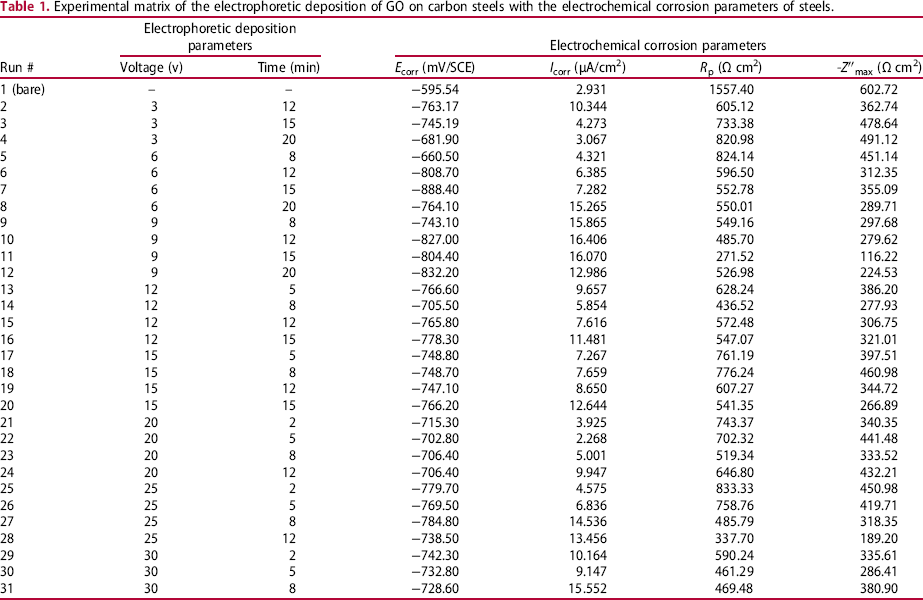
However, in this study for the rest of the measurements, the electrophoretic deposition parameters of Experiment 5 in Table 1, with the most positive E corr (−660.50 mV/SCE), one of the lowest corrosion current density (I corr) values (4.321 μA/cm2) among the coated coupons, and with the polarization resistance (R p) and imaginary impedance (-Z″) values of 824.14 Ω cm2 and 451.14 Ω cm2 respectively, were taken as the optimum deposition parameters (voltage: 6 V, time: 8 min).
Effect of heat treatment (rGO)
The chemical composition of the prepared GO coatings was analysed by XRD and FTIR spectroscopy. The recorded spectra can be seen in Figure 2. In the XRD patterns it can be seen that heat treatment has converted the (001) GO to (002) rGO by reducing the d-spacing value and removal of the functionalities of GO. In the first two XRD spectra of this figure (Figure 2(a)) the sharp peaks of the deposited (001) GO (without heat treatment) and graphite; as well as the broad peak of (002) rGO can be observed in ∼6.7°, ∼26.6°, and 22.3°, respectively.
XRD spectra of (a) graphite and the GO deposit without heat treatment, (b) after 0.5 h heat treatment at 150°C, (c) after 5 h heat treatment at 150°C, (d) after 10 h heat treatment at 150°C, and (e) FTIR spectra of the GO and rGO coatings, recorded without and with 10 h heat treatment of GO at 150°C.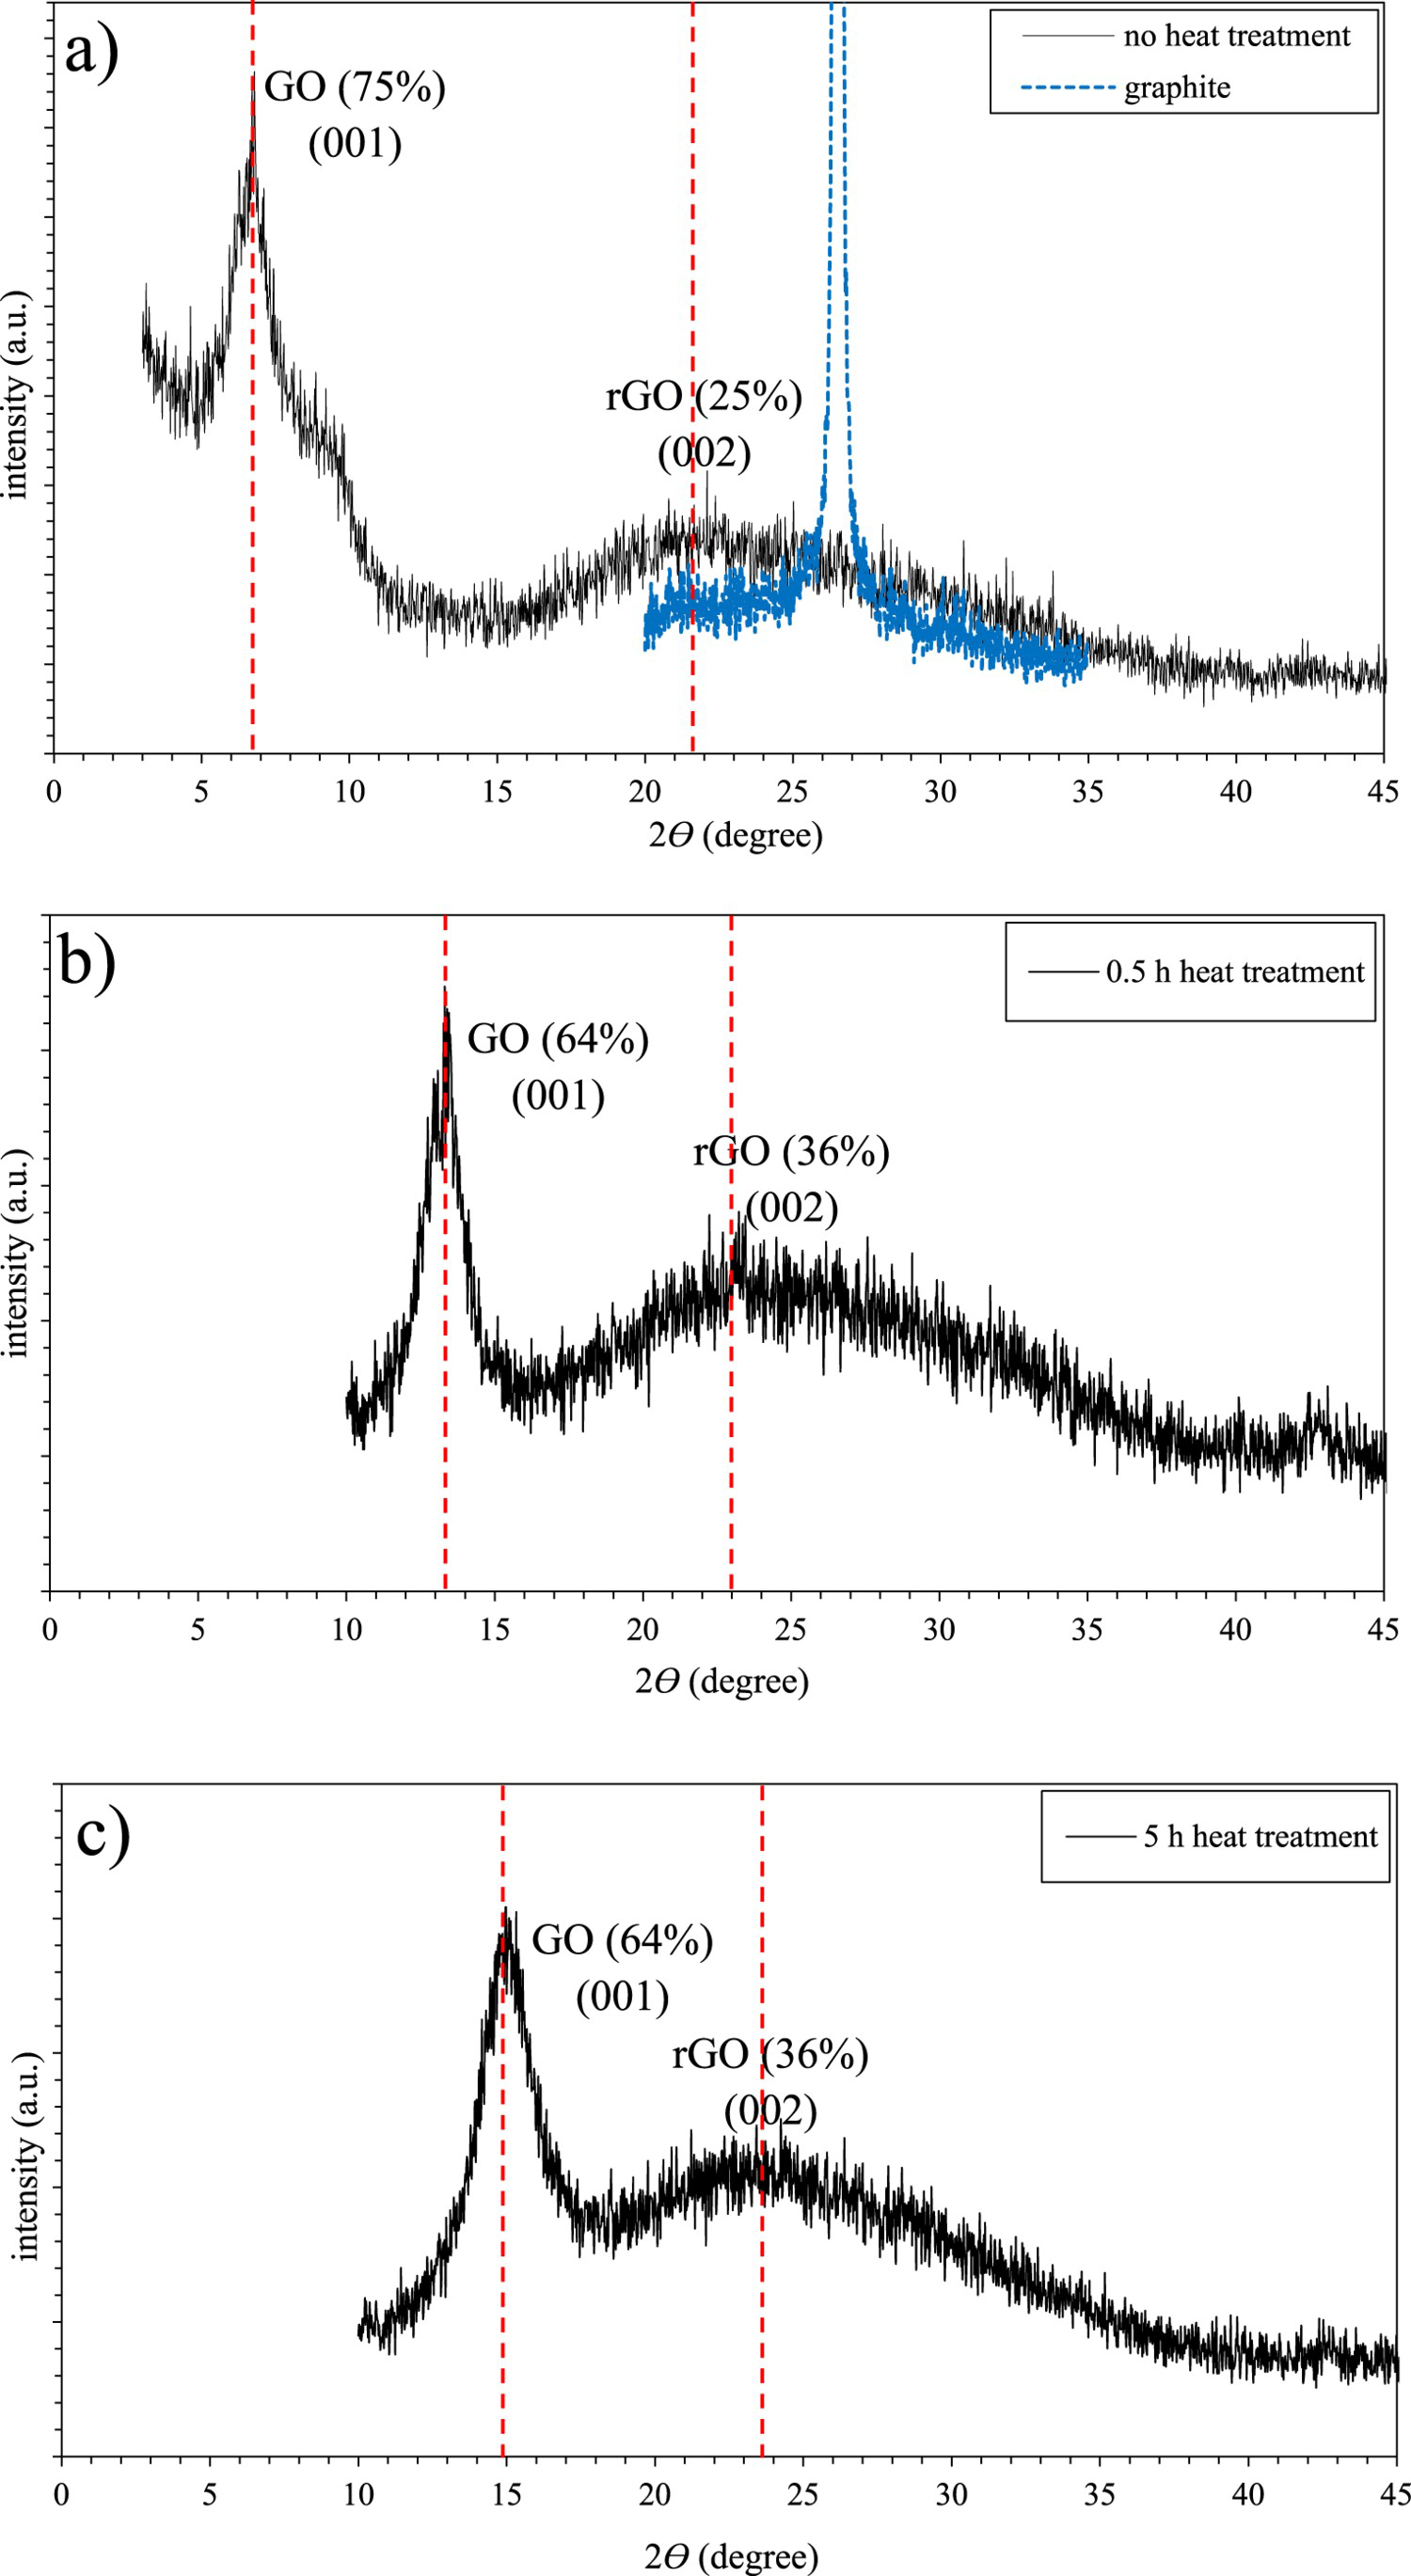
Detection of rGO in the XRD spectrum of the GO deposit, without heat treatment indicates that, during the electrophoretic deposition process, GO partially gets converted to rGO. Moreover, the peak intensity ratios in Figure 2(a) show that approximately 25% of the deposit is in the reduced form.
However, as Figure 2(b,c) clearly shows, by conducting 0.5 and 5 h heat treatment at 150°C on the GO deposit, the GO peak shifts towards higher 2ϴ values and the intensity ratio of the rGO shoulder peak against GO reaches to about 36%. Finally, in Figure 2(d) it can be seen that when the duration of the heat treatment increases to 10 h, the intensity of the GO peak significantly gets reduced and simultaneously the rGO peak intensity ratio grows to more than 50% compared to GO.
These patterns also show that by applying heat treatment, the peak position of GO shifts towards higher 2ϴ values. This indicates the reduction in the lattice parameter of GO. Similar shifts in the peak position of GO by heat treatment have been reported by Sengupta and his colleagues as well [53].
Similar to the XRD spectra, in the FTIR part of this figure (Figure 2(e)) also, it can be observed that, after 10 h heat treatment of the GO at 150°C, the coating has been mostly converted to rGO. These two FTIR spectra depict a reduction in the intensity of the transmittance peaks of GO after being heat treated. The spectrum of the rGO shows that several peaks corresponding to –OH, –C = C, –C–O–C–, and –C–O groups have either disappeared or reduced after heat treatment.
Effect of surface structure/roughness of steel
The effect of surface structuring and roughness parameters of the steel on its electrochemical corrosion behaviour after being electrophoretically coated with GO was investigated. Besides the polished steel, the surface topography of the steel coupons was also changed by mechanical grinding using SiC papers, laser processing, and chemical etching, and the electrochemical corrosion parameters of the bare and coated steel with each surface structure were compared.
Mechanical grinding
The steel coupons were mechanically ground with different grits of SiC papers and the topography of each ground surface was analysed by AFM.
The 3D AFM images of the polished and ground steel surfaces with their surface roughness parameters are illustrated in Figure 3. In this figure, the R a and R q are the arithmetic and root mean squared average roughness values, respectively. These AFM images clearly show that as the grit of the used SiC paper becomes larger the surface roughness of the steel coupons increases and dipper grooves are generated on the surface of the coupons.
AFM images of (a) polished (mirror-like) and (b–f) ground steel coupons with their R a and R q average roughness parameters. (b) # 2000, (c) # 1200, (d) # 800, (e) # 400, and (f) # 150. (# numbers represent the grit of the SiC papers used for grinding the steels).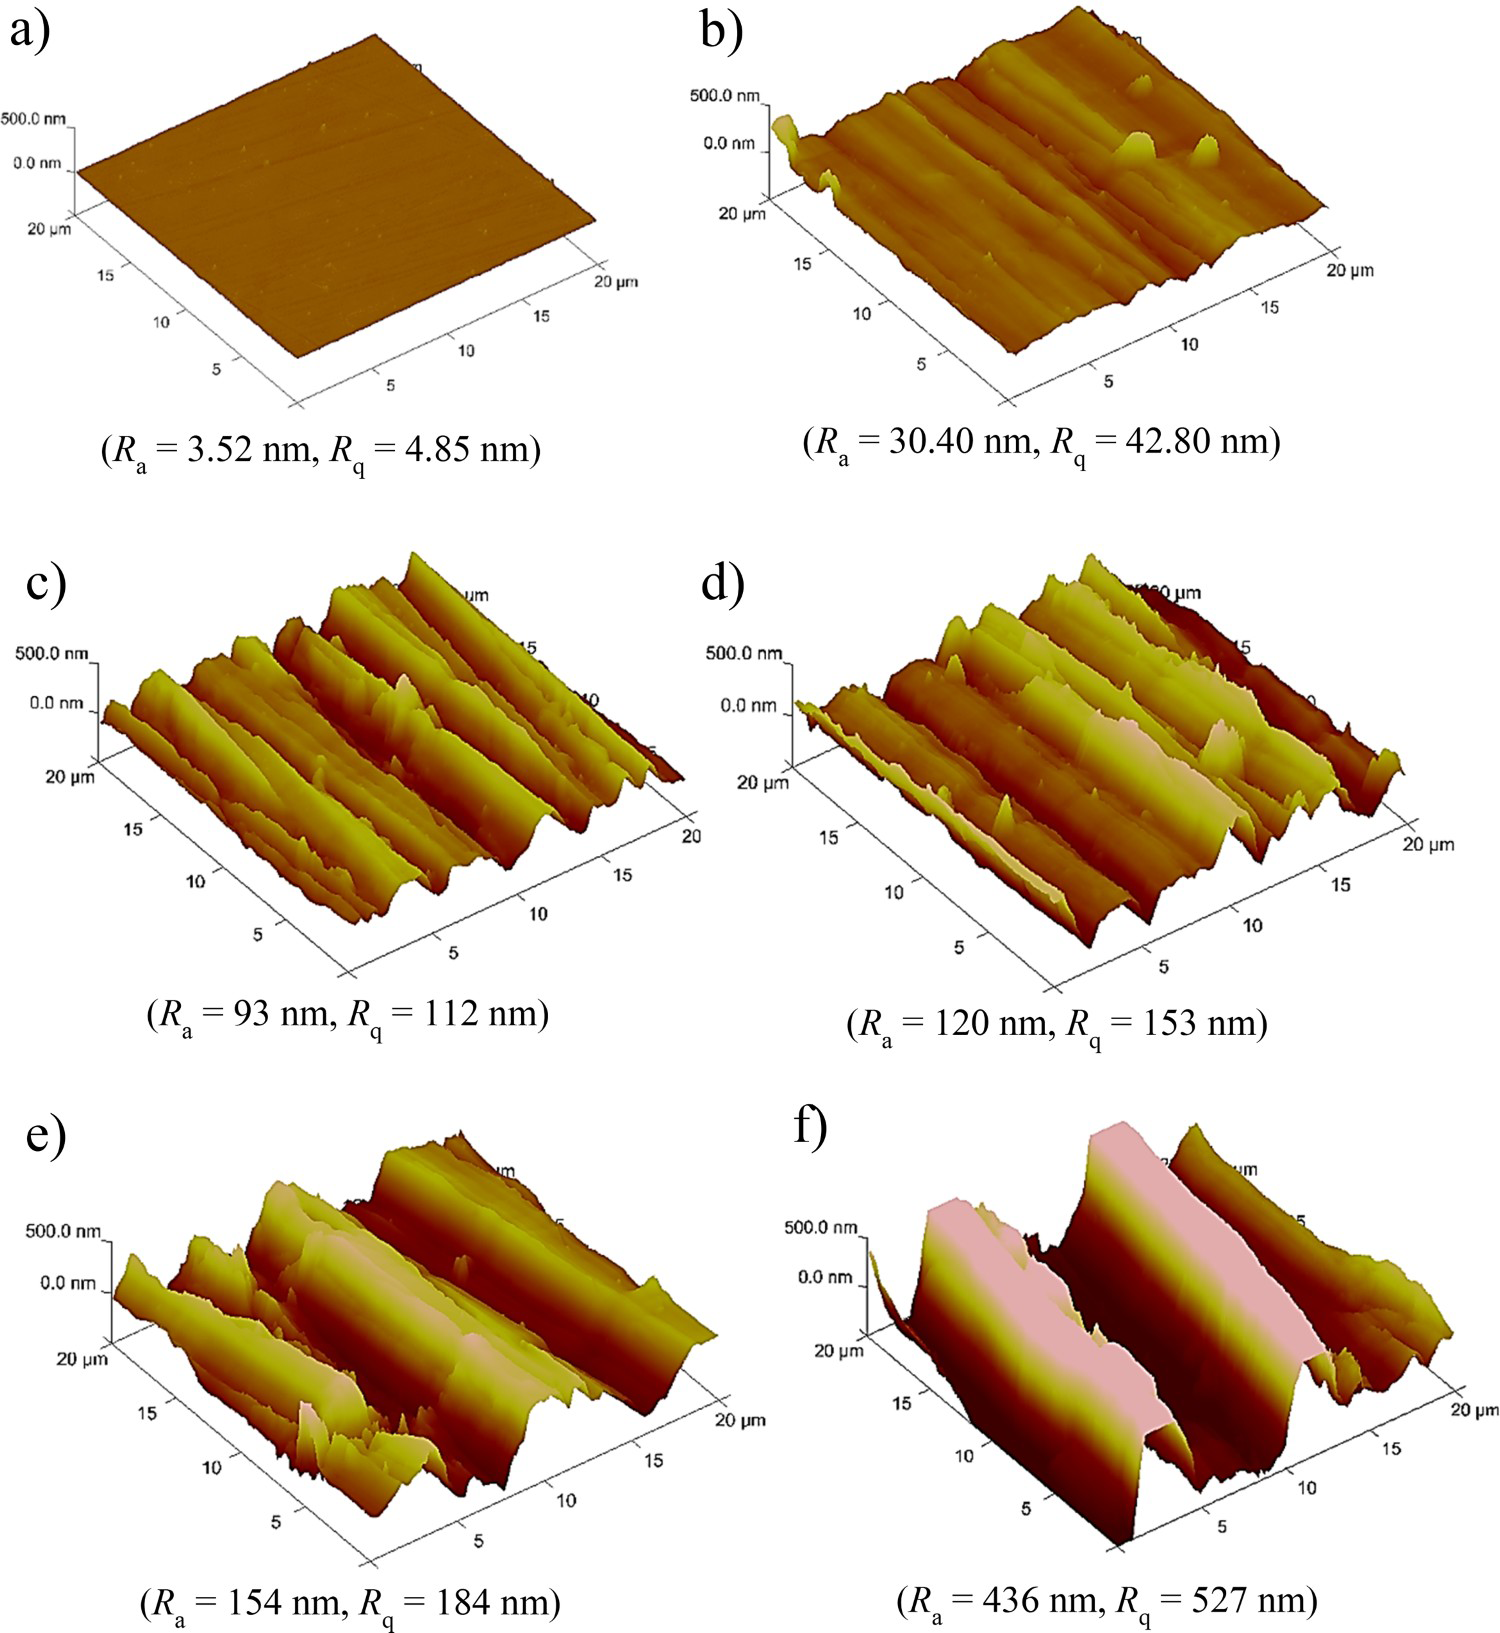
Figure 4(a–c) shows the potentiodynamic polarization curves of the bare and coated steel coupons after polishing with a polishing cloth and grinding with different grade SiC papers. In this series of curves, it can be seen that coating the polished steel surface with GO, causes the E corr of the steel to shift towards more negative potentials (E corr(bare) = −0.596 V/SCE, E corr(coated) = −0.663 V/SCE). However, these curves also reveal that the electrophoretic deposition of GO on the ground steel surfaces clearly improves the electrochemical corrosion parameters of steel. Comparing the potentiodynamic polarization curves of the bare and coated mechanically ground steel coupons, it can be observed that as the grit of the used SiC paper, and therefore the surface roughness of the ground coupons becomes larger, the degree of the improvement in the E corr (shifting towards more positive E corr) of the coated steel coupons increases. In Figure 4(a) the E corr of the bare steel ground by a 2000 grit SiC paper is about −0.621 V/SCE with the I corr of about 5.211 μA.cm−2, while this potential changes to −0.597 V/SCE and simultaneously the measured I corr reduces by almost 5 times to 1.112 μA.cm−2, when a steel coupon with a similar surface roughness is coated with GO (E corr(coated) – E corr(bare) = 0.024 V/SCE). The difference between the E corr values of the bare and coated ground steel coupons (ΔE corr) increases by increasing the surface roughness of the steel coupons. Finally, the ΔE corr reaches to about 0.057 V/SCE and the ΔI corr (I corr(coated) – I corr(bare)) to −2.361 μA.cm−2 when the potentiodynamic polarization curves of the bare and coated steel coupons, ground with a 150 grit SiC paper are compared (Figure 4(c)).
Potentiodynamic polarization curves of the polished and ground steel coupons with and without GO coating. (a) polished/# 2000, (b) # 1200/# 800, and (c) # 400/# 150. (# numbers represent the grit of the SiC papers used for grinding the steels).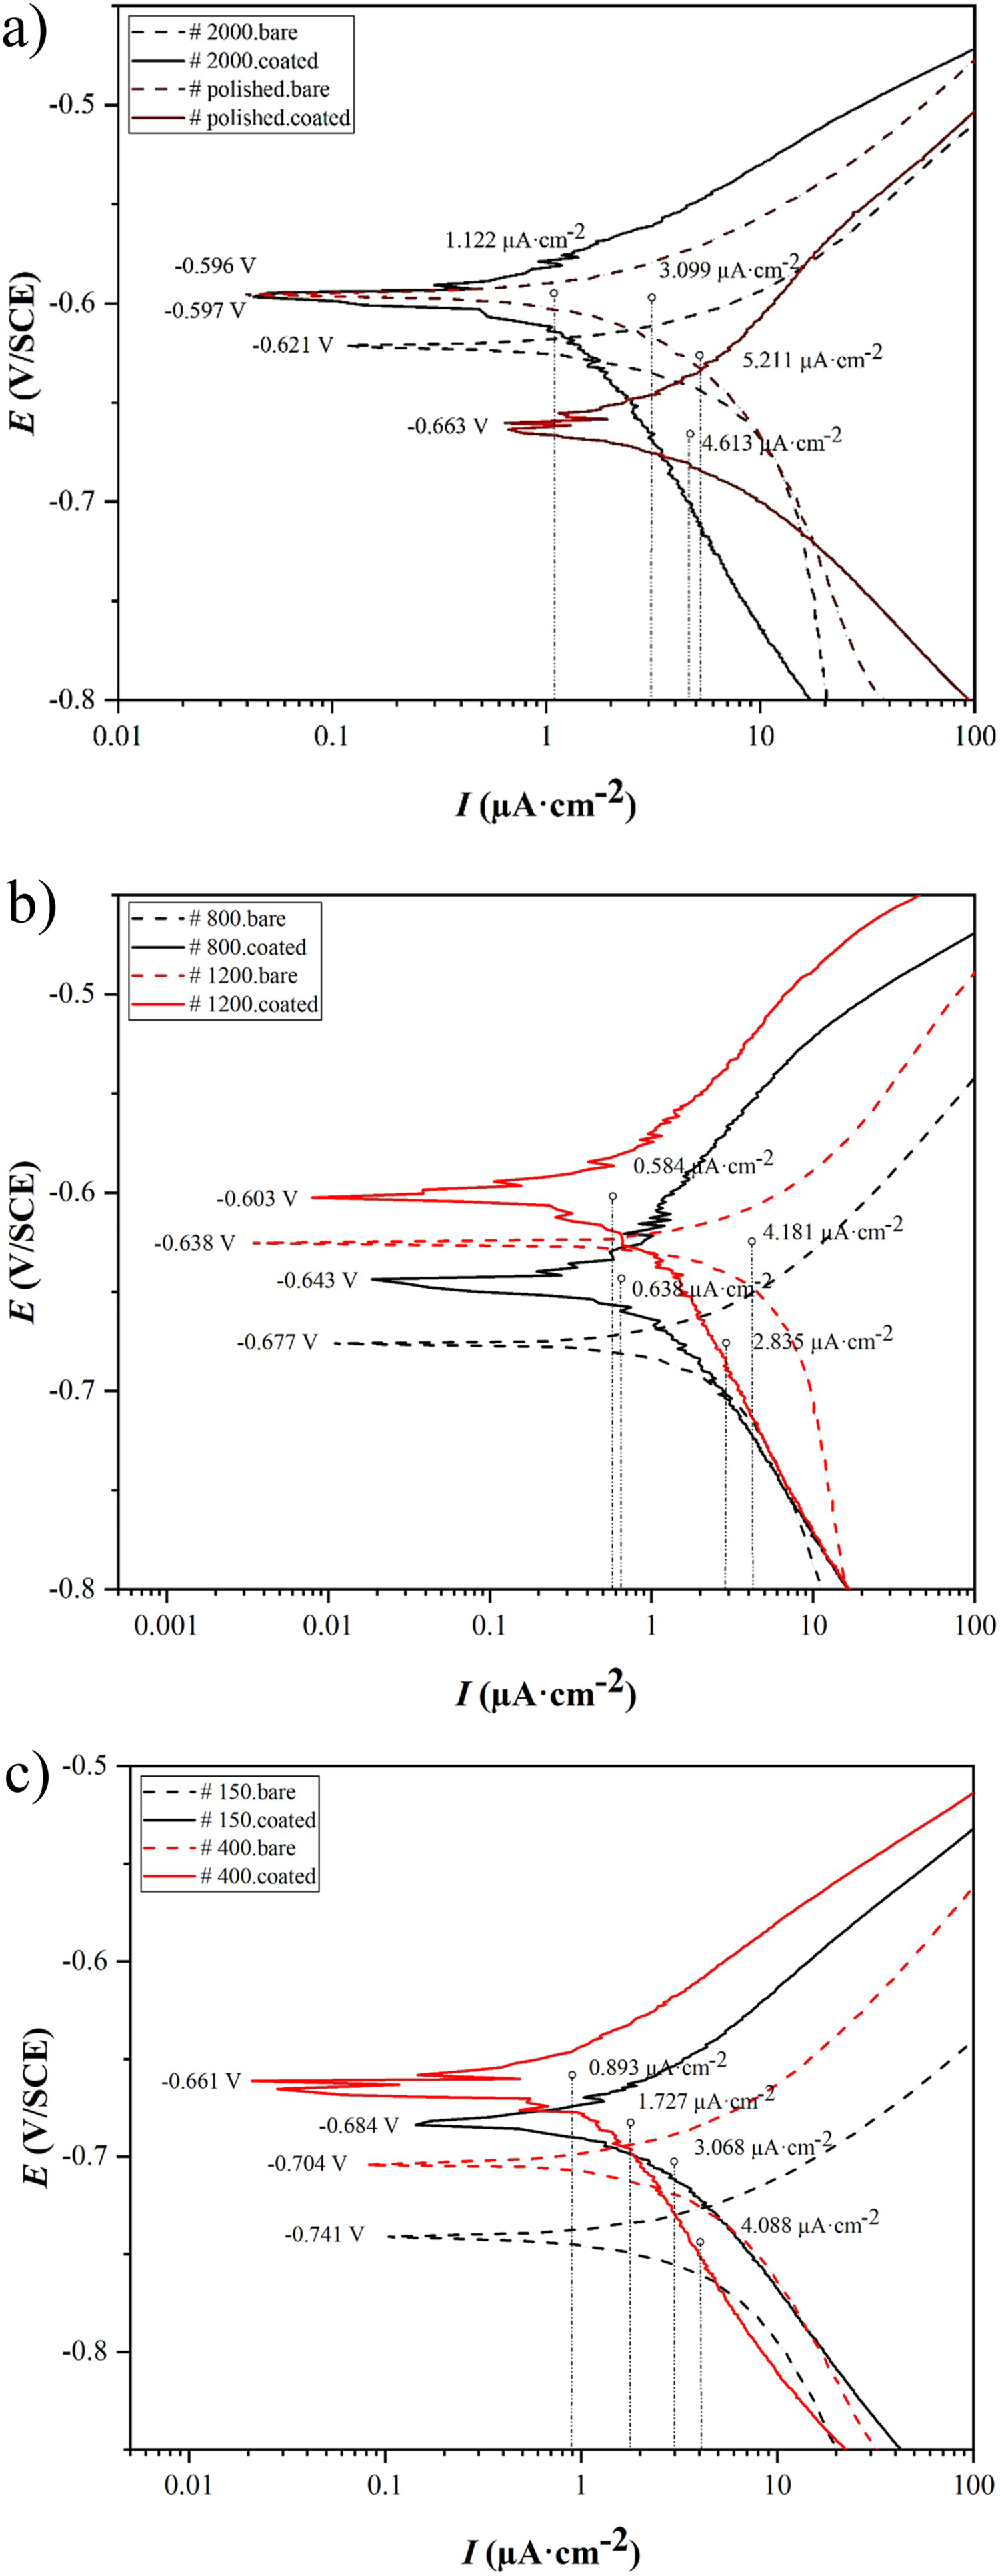
The Nyquist plots of the bare and GO-coated polished and ground steel coupons also can be observed in Figure 5(a–c). Here also in Plot(a) one can see that the R p of the polished steel reduces from above 1500 Ω cm2 to values lesser than 1000 Ω cm2 when the polished steel is coated with GO. Simultaneously, coating the surface of the polished steel coupon reduces the diameter of the Nyquist semi-circle in Plot(a).
Nyquist plots and electrical circuit models of the polished and ground steel coupons with and without GO coating. (a) polished/# 2000, (b) # 1200/# 800, and (c) # 400/# 150. (# numbers represent the grit of the SiC papers used for grinding the steels).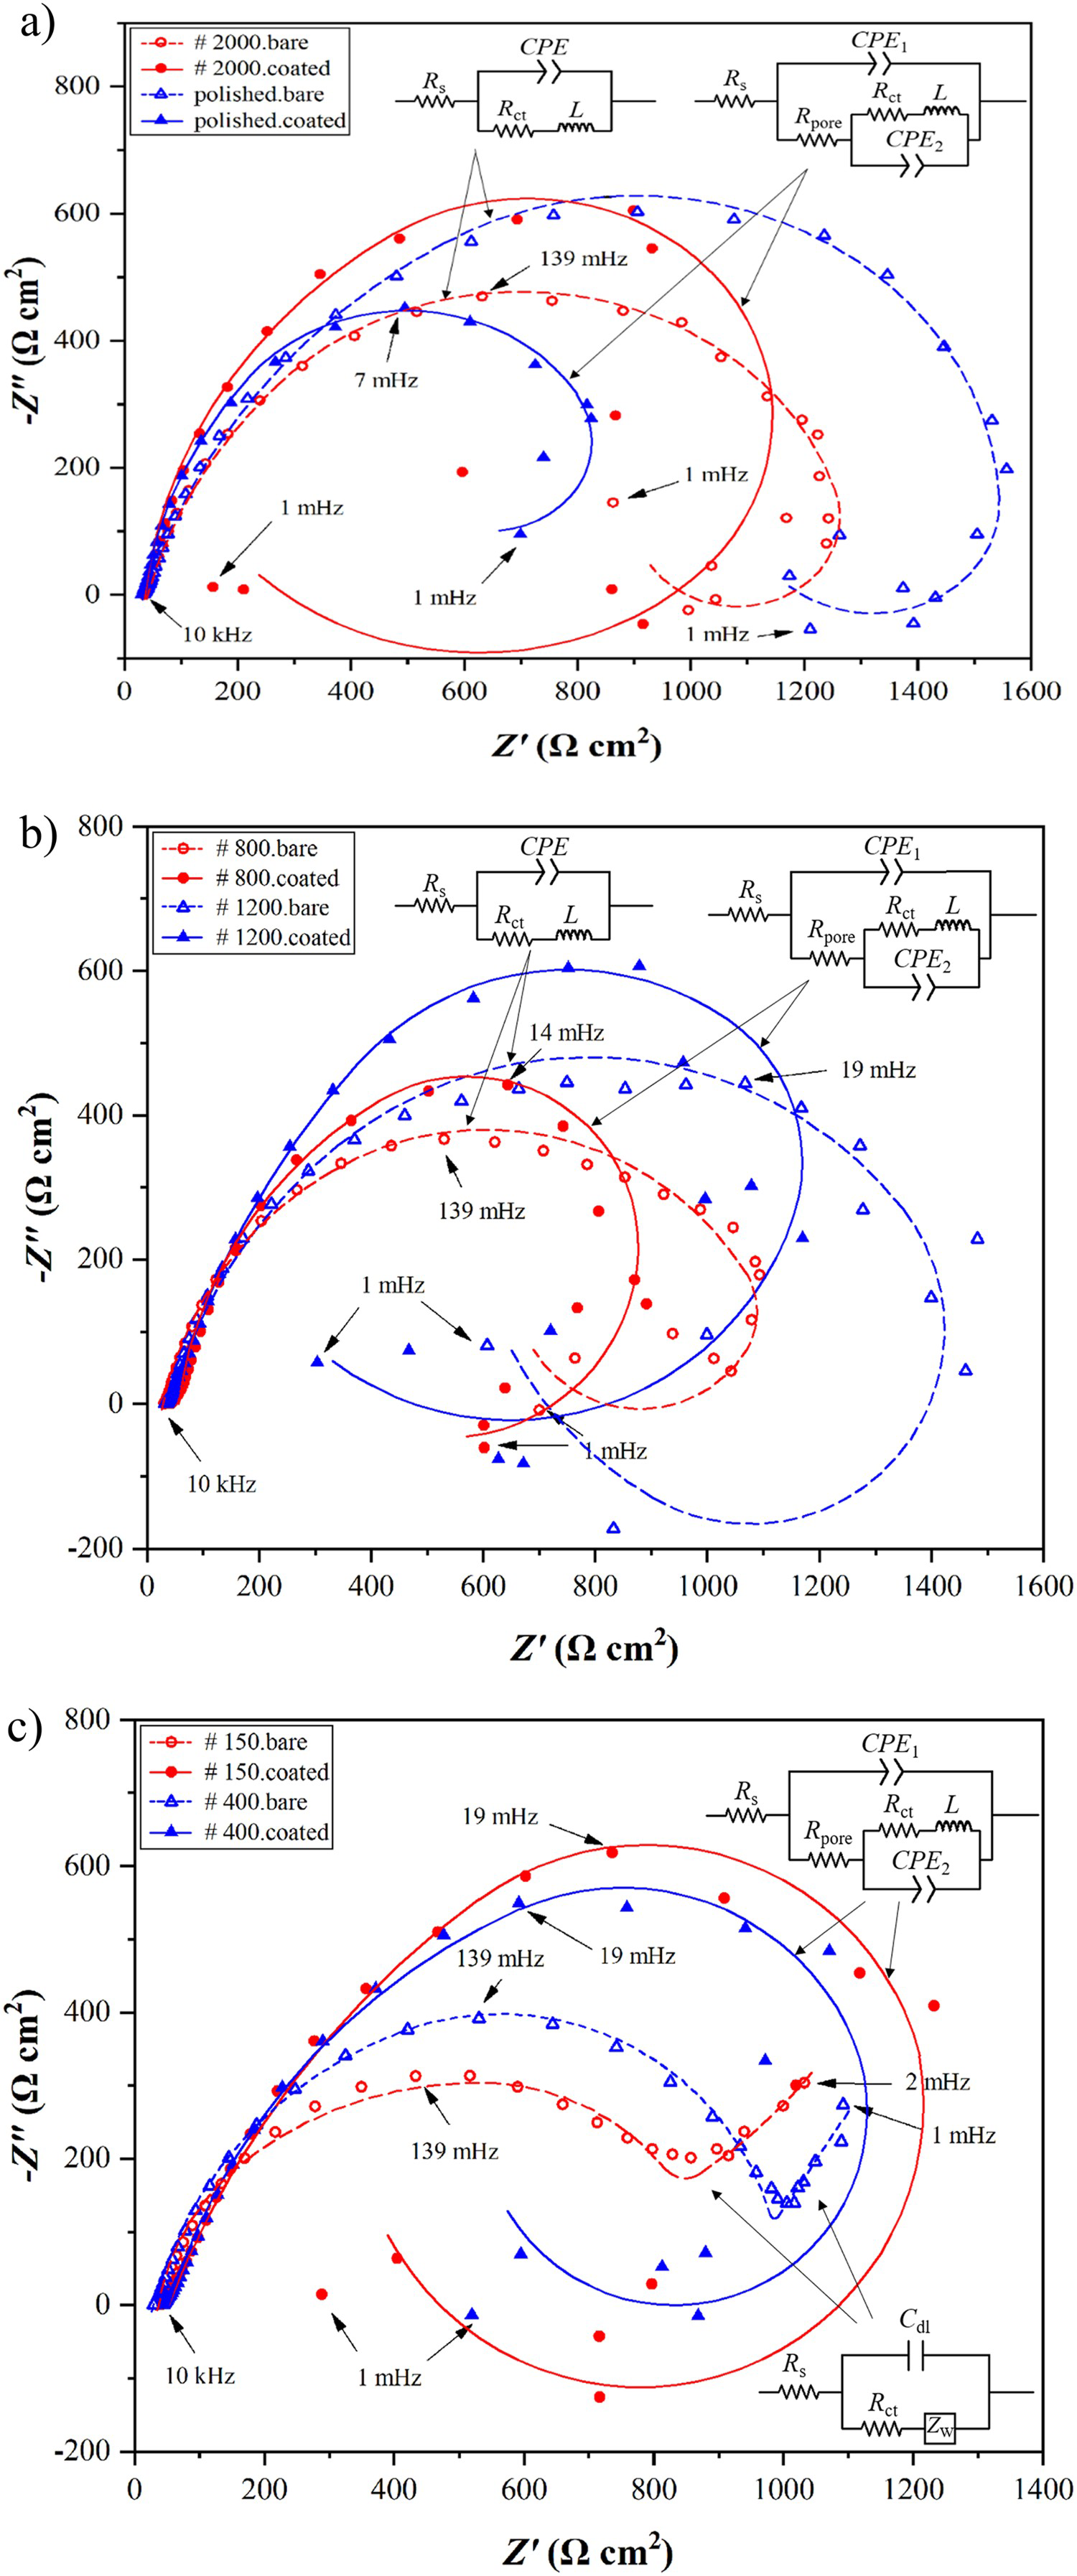
The Nyquist plot of the coated steel coupon ground by a 2000 grit SiC paper however, shows a larger R p and a larger maximum imaginary impedance (-Z″max) compared to the bare ground steel. The changes in the R p and -Z″max values of the steels ground by 1200, 800, 400, and 150 grits SiC papers show similar trends. In all these plots (Figure 5(b,c)), it can be observed that GO coating improves the corrosion resistance of the ground steels. The only major difference between the Nyquist plots shown in Figure 4 can be found in the plots of the bare steel ground by 400 and 150 grit SiC papers shown in Figure 5(c).
In Figure 5 most of the Nyquist plots (bare and coated) show a semi-circle with a non-ideal shape at low frequencies, which is called the low-frequency hook or inductive loop. Among these plots, only the Nyquist plots of the bare steels ground by 400 and 150 grit SiC papers (Plot (c)) have an incomplete semi-circle with a semi-infinite Warburg diffusion impedance part at the low-frequency region, that means the diffusion layer has an infinite thickness. The equivalent circuit models to describe the non-ideal semi-circles with inductive loops and spectra with Warburg impedance are shown in the inset of the plots in Figure 5. In these models, R s is the solution resistivity, R pore is the ion-conducting resistance of the coating, C dl is the double-layer capacitance, R ct is the charge transfer resistance, Z W is the Warburg impedance, CPE is the constant phase element and L is the inductance.
Laser texturing
Steel coupons with three different laser-structured patterns were prepared. The coupons with each texture were coated with GO and their electrochemical corrosion behaviour was compared with the bare laser textured coupons. The laser patterns were made on the mirror-like polished steel coupons. These patterns that are illustrated in Figure 6 were (i) straight grooves pattern with the groove width of 60 μm, (ii) crossed grooves pattern with triangle-like structure and groove width of 60 μm; and (iii) dimples (micro pits) pattern with the dimple diameter of 60 μm. In all the laser-textured steel coupons, the hatch distance between the consecutive scanning lines/dimples and the depth of the generated grooves and dimples were 200 μm and 15 μm, respectively.
SEM images of the laser-textured steel coupons with three different patterns. (a) straight grooves, (b) crossed grooves, and (c) dimples (micro pits).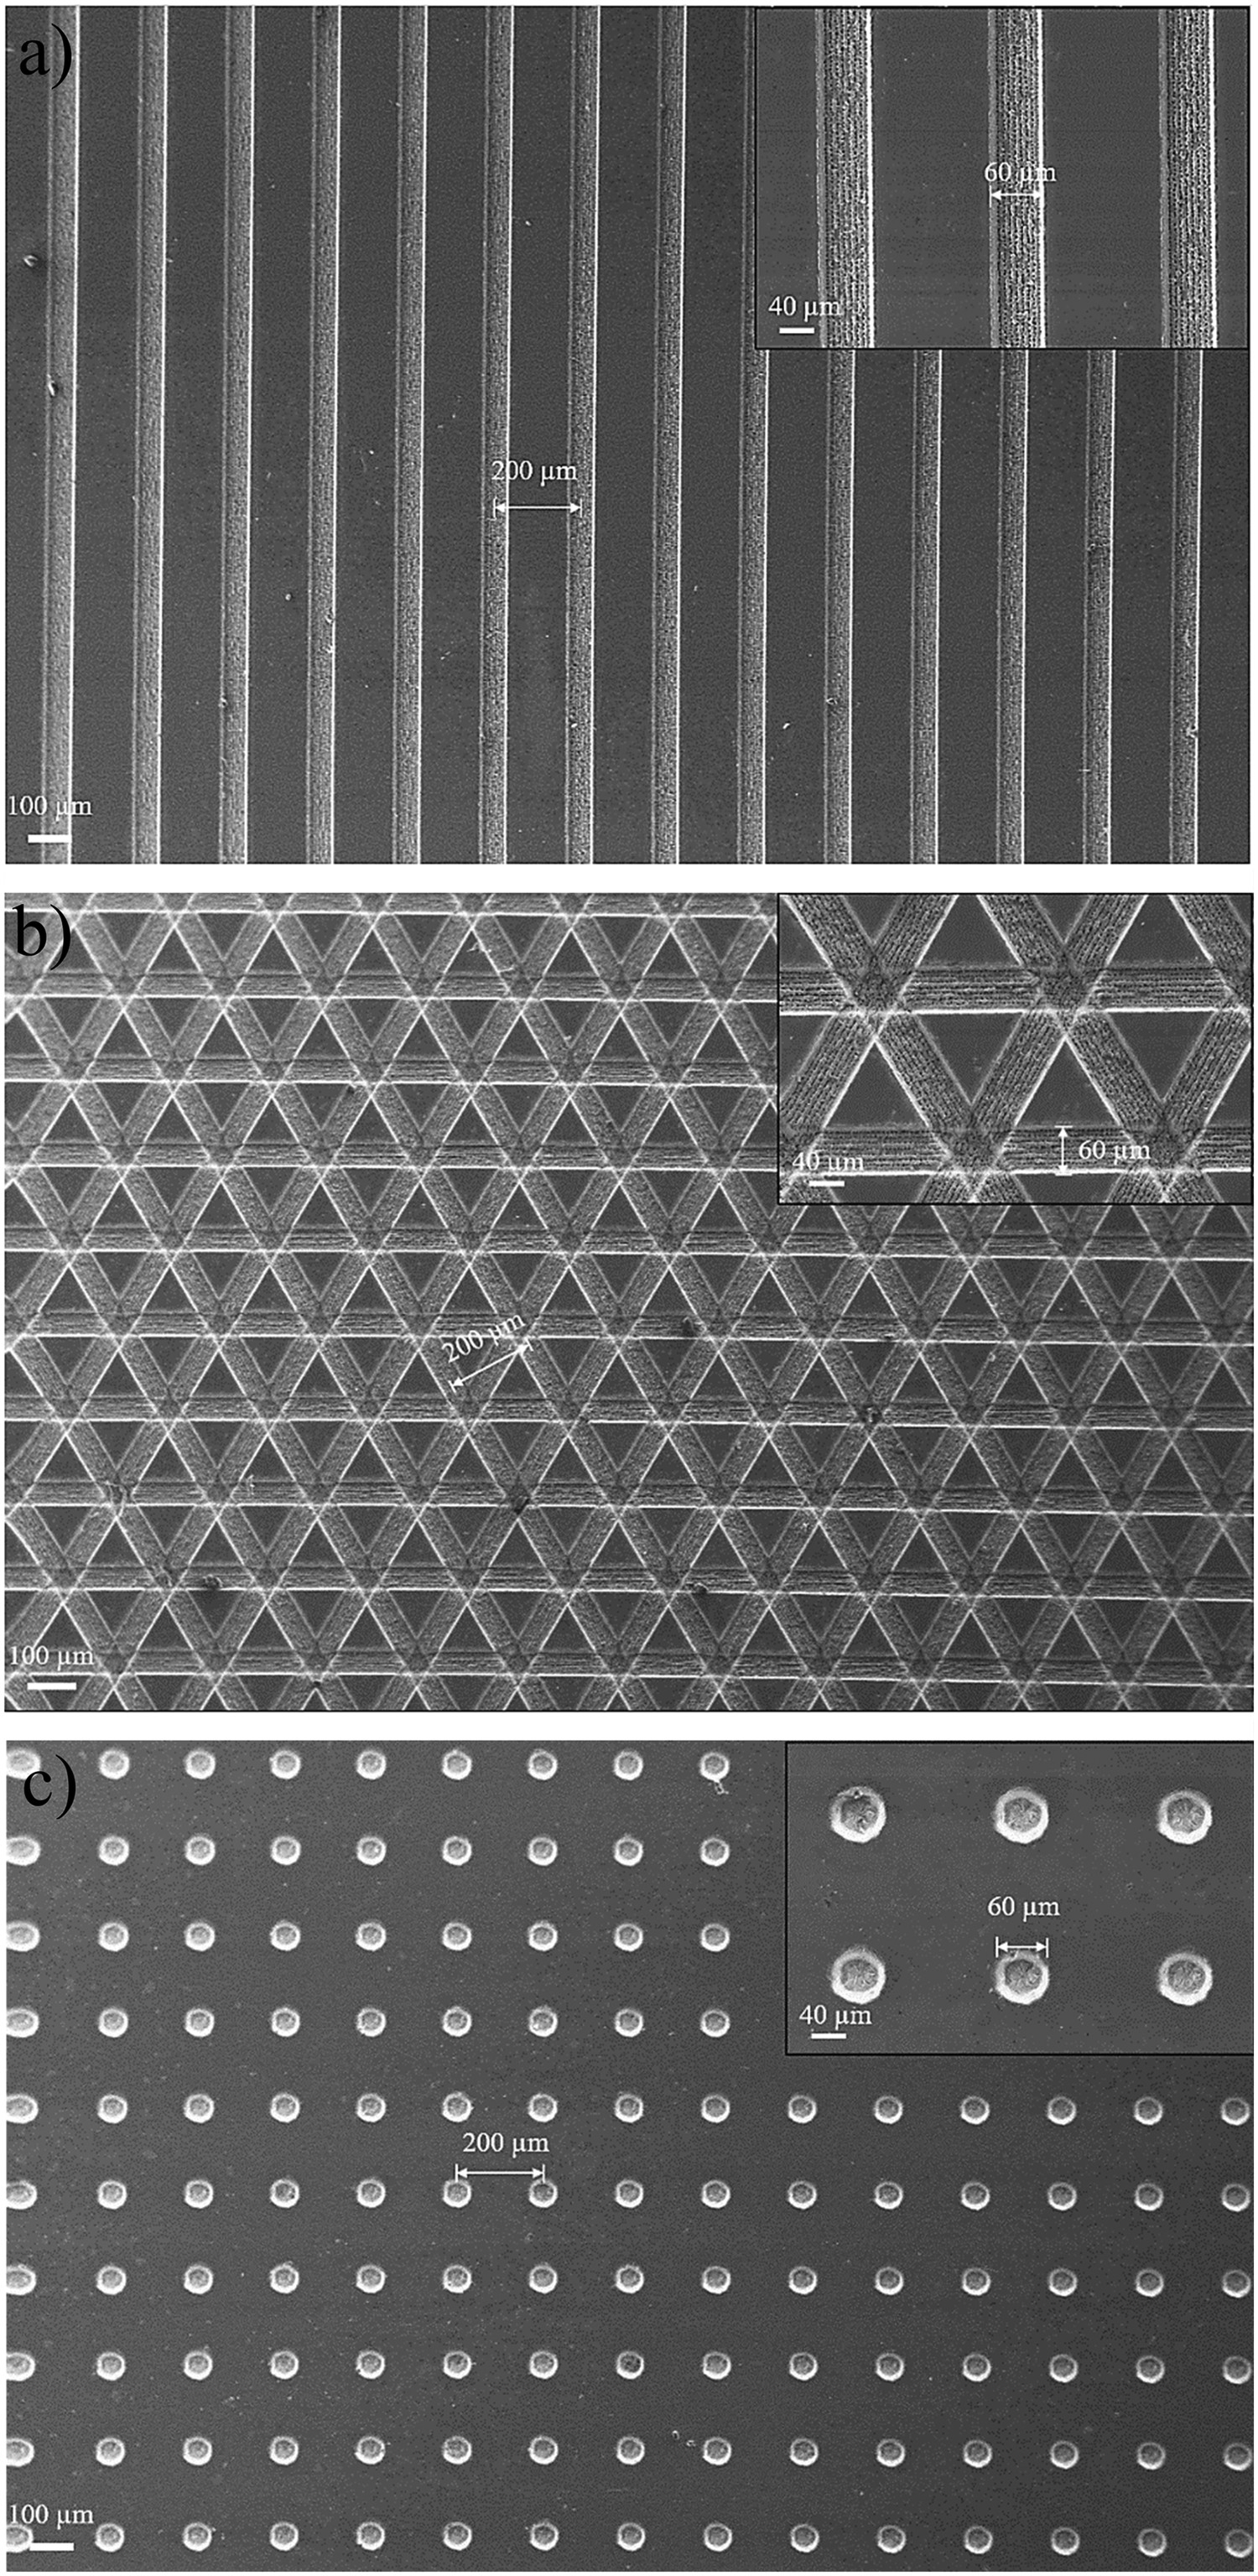
The electrochemical behaviour of the bare and GO-coated laser-textured steel coupons can be compared in Figure 7. The potentiodynamic polarization curves of this figure show that in both bare and coated series of the measurements, the dimples texture steels (bare and coated) have more positive E corr compared to the steel coupons textured with the other two patterns. However, this series of measurements shows that the E corr values of the coated steel coupons with laser-structured surfaces are more negative than the bare coupons with the same texture. In Figure 7(b) comparison of the Nyquist plots of the bare and GO coated laser-textured steel coupons shows that, coating the laser-textured surfaces reduces the values of the R p and -Z″max parameters.
(a) potentiodynamic polarization curves and (b) Nyquist plots of the laser textured steel coupons with and without GO coating.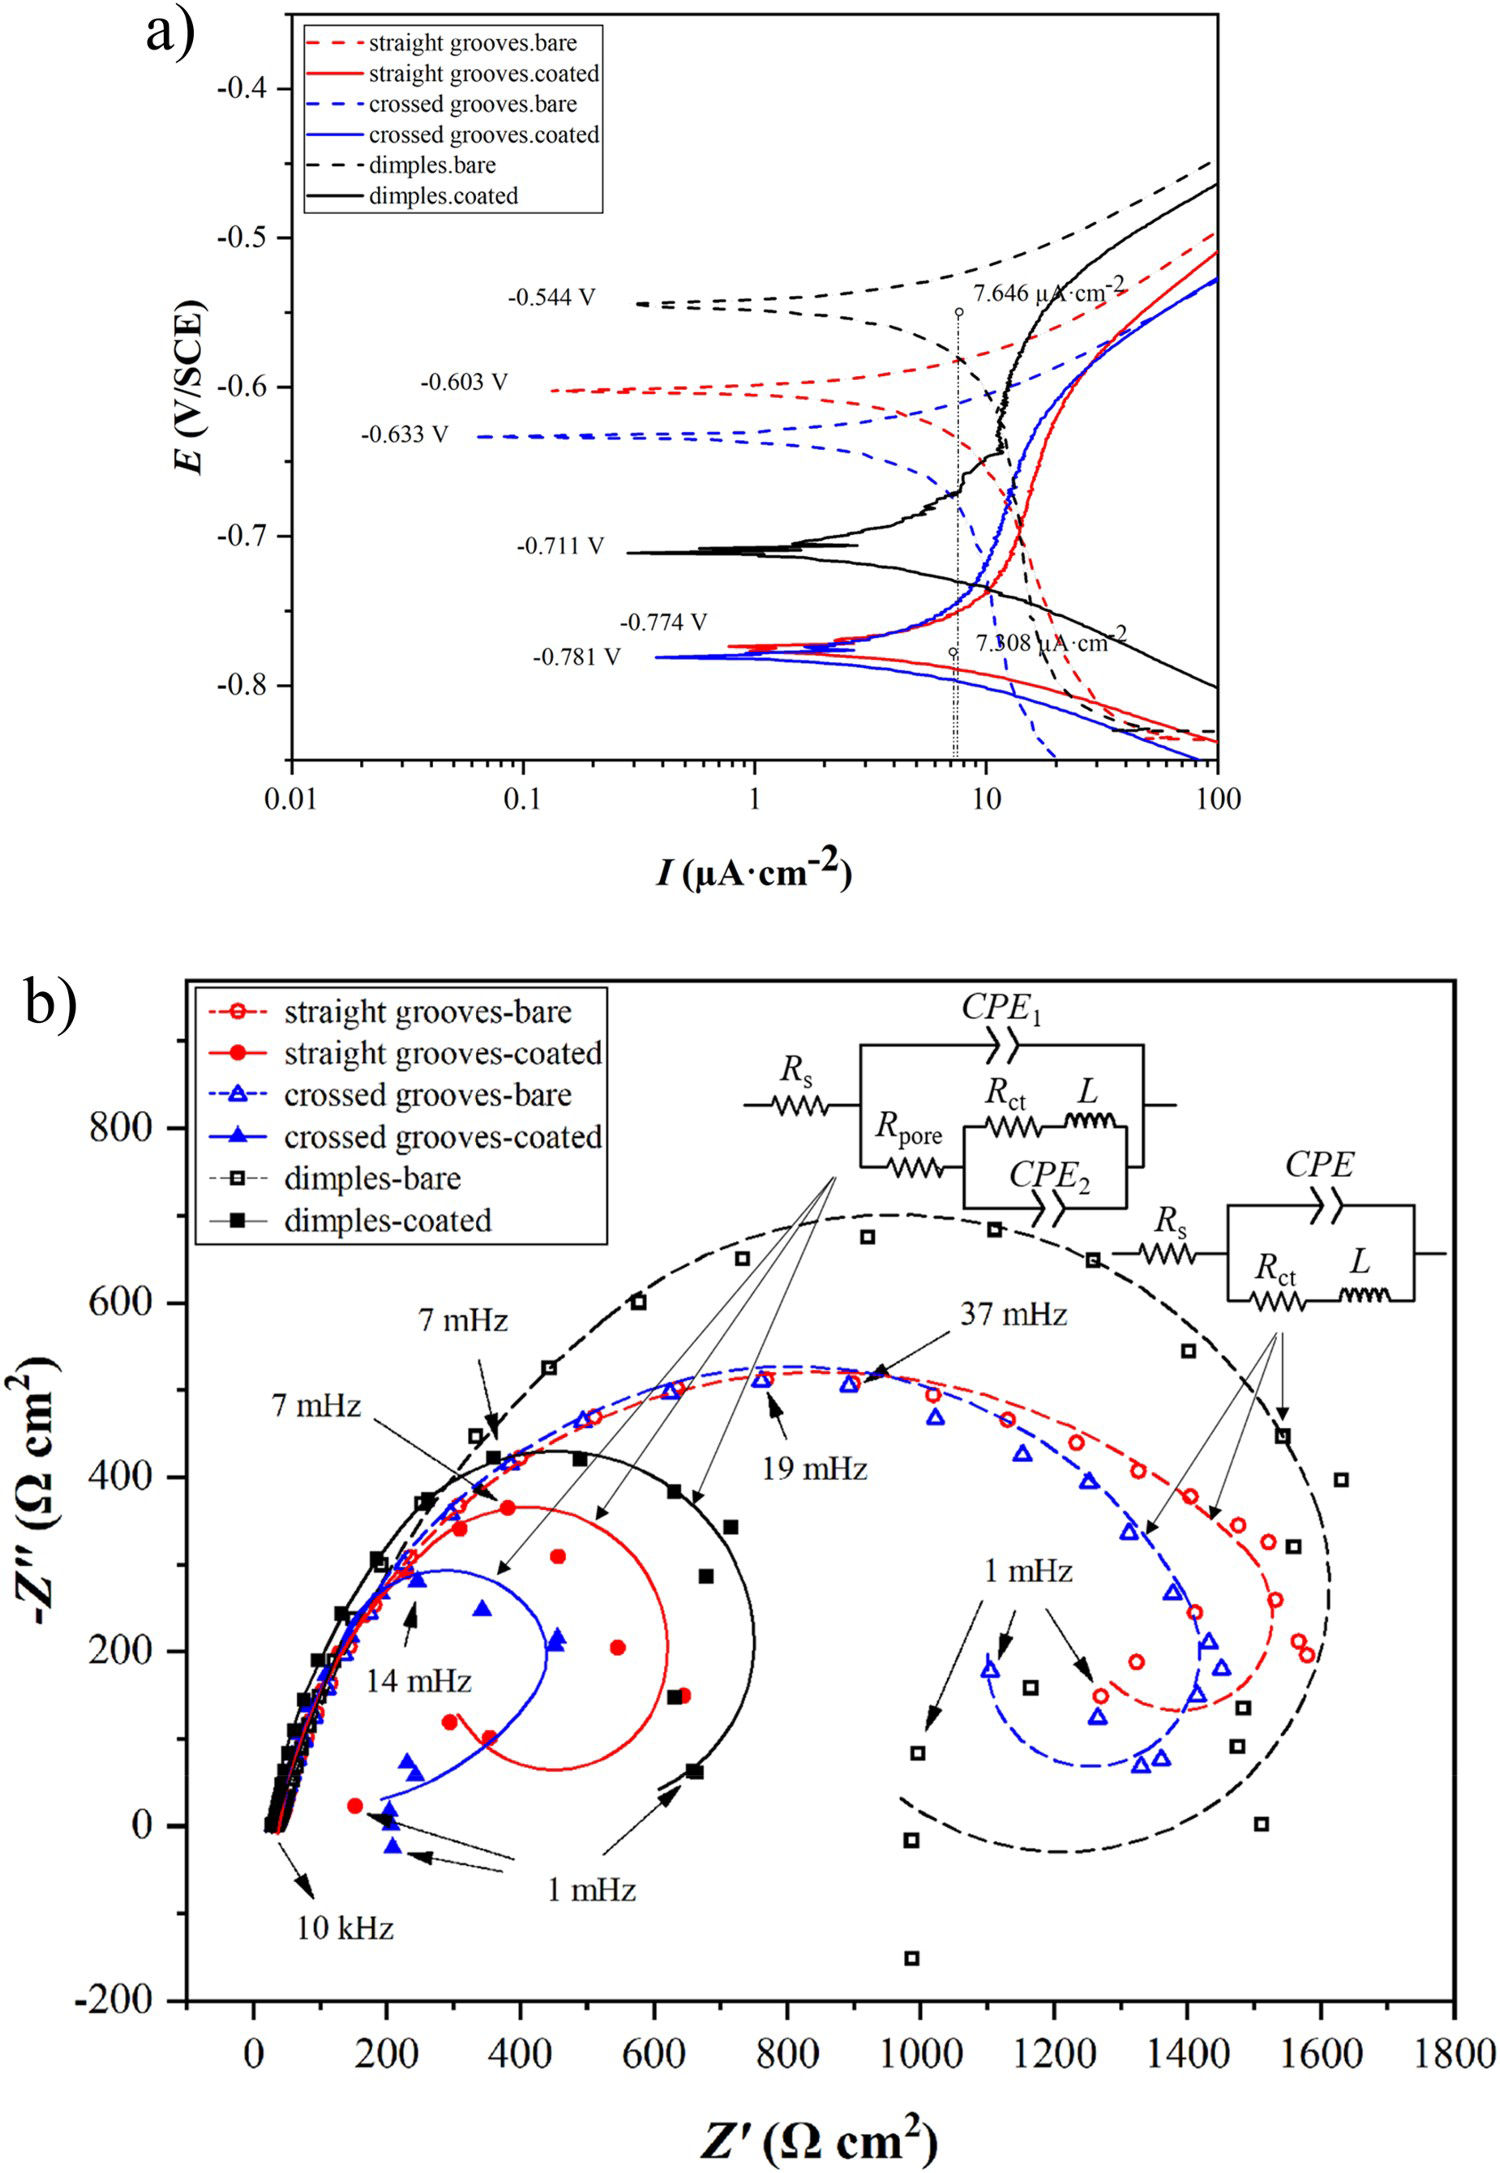
From the recorded electrochemical corrosion parameters in Figure 6, it can be observed that, similar to the electrochemical behaviour of the GO-coated polished steel, here also electrophoretic deposition of GO on the laser textured steel surfaces shown in Figure 5 not only does not provide an effective anti-corrosion and anti-oxidation barrier for this alloy, but also due to the presence of rGO in the coating, accelerates the galvanic corrosion of steel; and consequently GO is a much worse protective than no coating at all for laser textured surfaces.
Chemical etching
The anti-corrosion performance of GO layers deposited on chemically etched carbon steel surfaces was also investigated. Figure 8 shows the SEM images of a polished steel surface after 4 min immersion in an HF + H2O2 solution. As it is shown in Image(b), the microstructure of the etched steel consists of a dark ferrite and a white pearlite (ferrite + cementite) area. In Image(c) of Figure 8, the AFM surface map of the etched steel surface with the R a and R q parameters can be observed. Compared to the roughness parameters of the ground surfaces represented in Figure 3, it is obvious that the roughness parameters of the etched steel surface are close to the parameters of the # 2000 ground steel in Figure 3(b) (R a = 30.40 nm, R q = 42.80 nm).
(a, b) SEM and (c) AFM images of a polished steel coupon, taken after etching its surface with a mixture of HF and H2O2.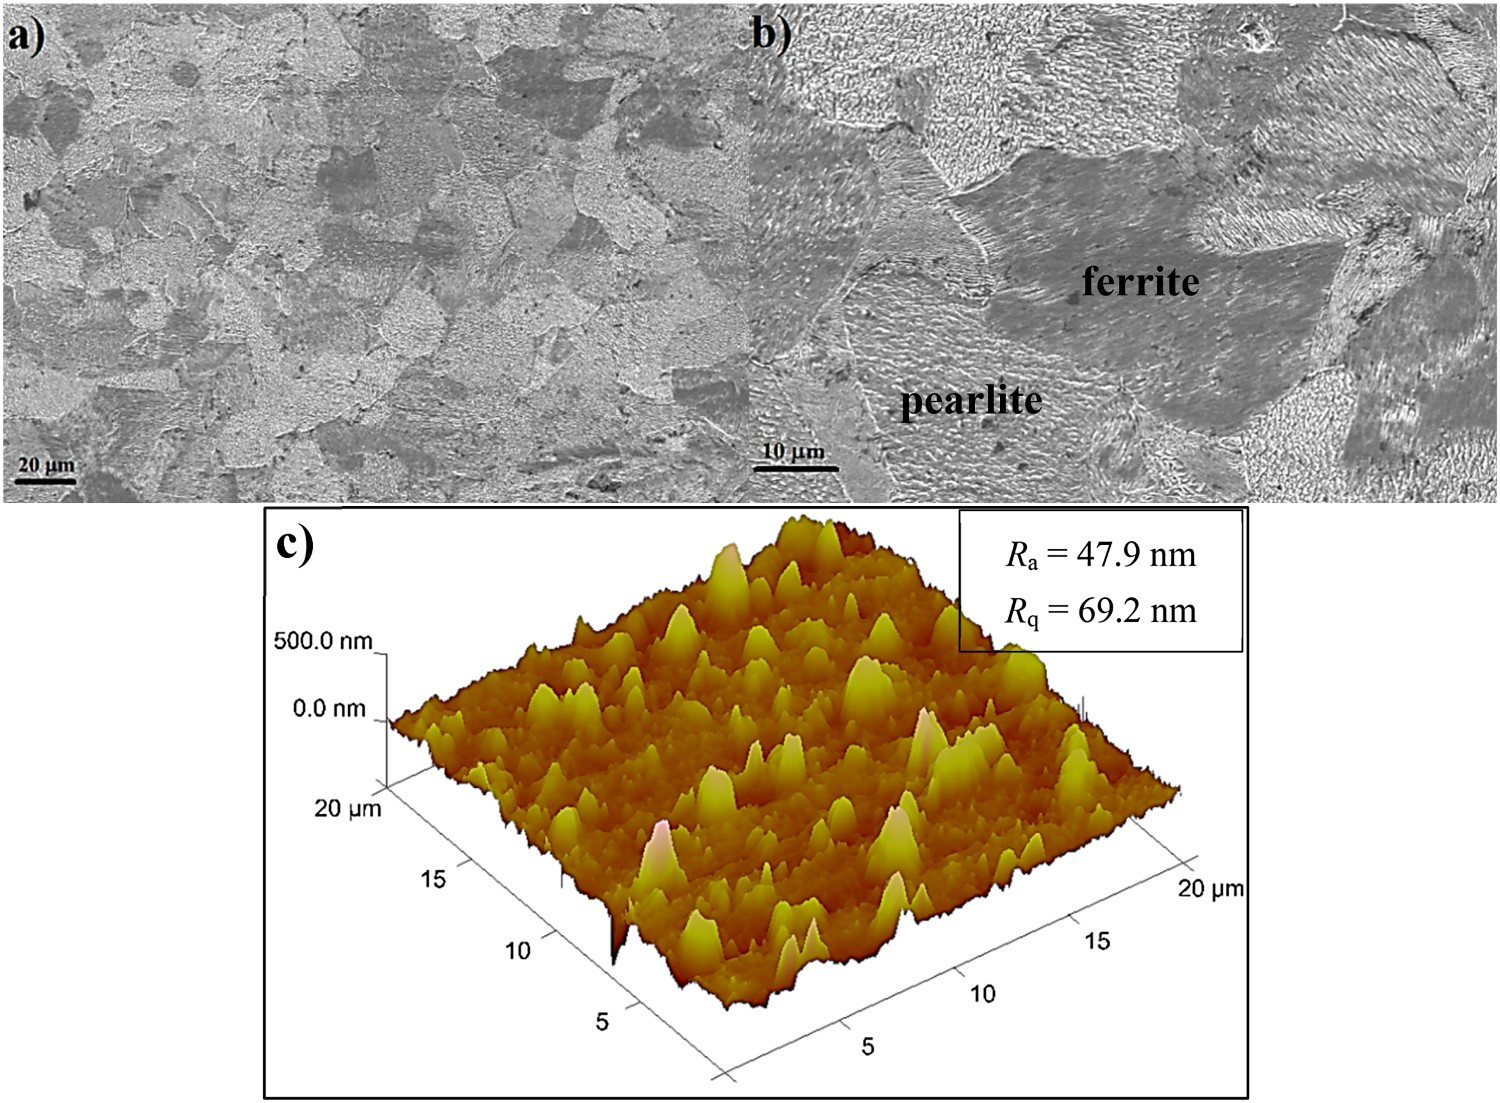
In the potentiodynamic polarization curves and Nyquist plots represented in Figure 9, the electrochemical corrosion parameters of the chemically etched steel coupons with and without GO coating can be compared. Figure 9(a), shows that coating the surface of the etched steel shifts the E corr of steel from −0.762 V/SCE to the more positive potential of −0.629 V/SCE (ΔE corr = 0.133 V/SCE) and simultaneously reduces the I corr of steel by almost 3 times (ΔI corr = −6.879 μA.cm−2). Here it should be noted that, the negative value of the ΔI corr indicates that the magnitude of the I corr of the coated coupon is smaller than that of the bare coupon.
(a) potentiodynamic polarization curves and (b) Nyquist plots of the chemically etched steel coupons with and without GO coating.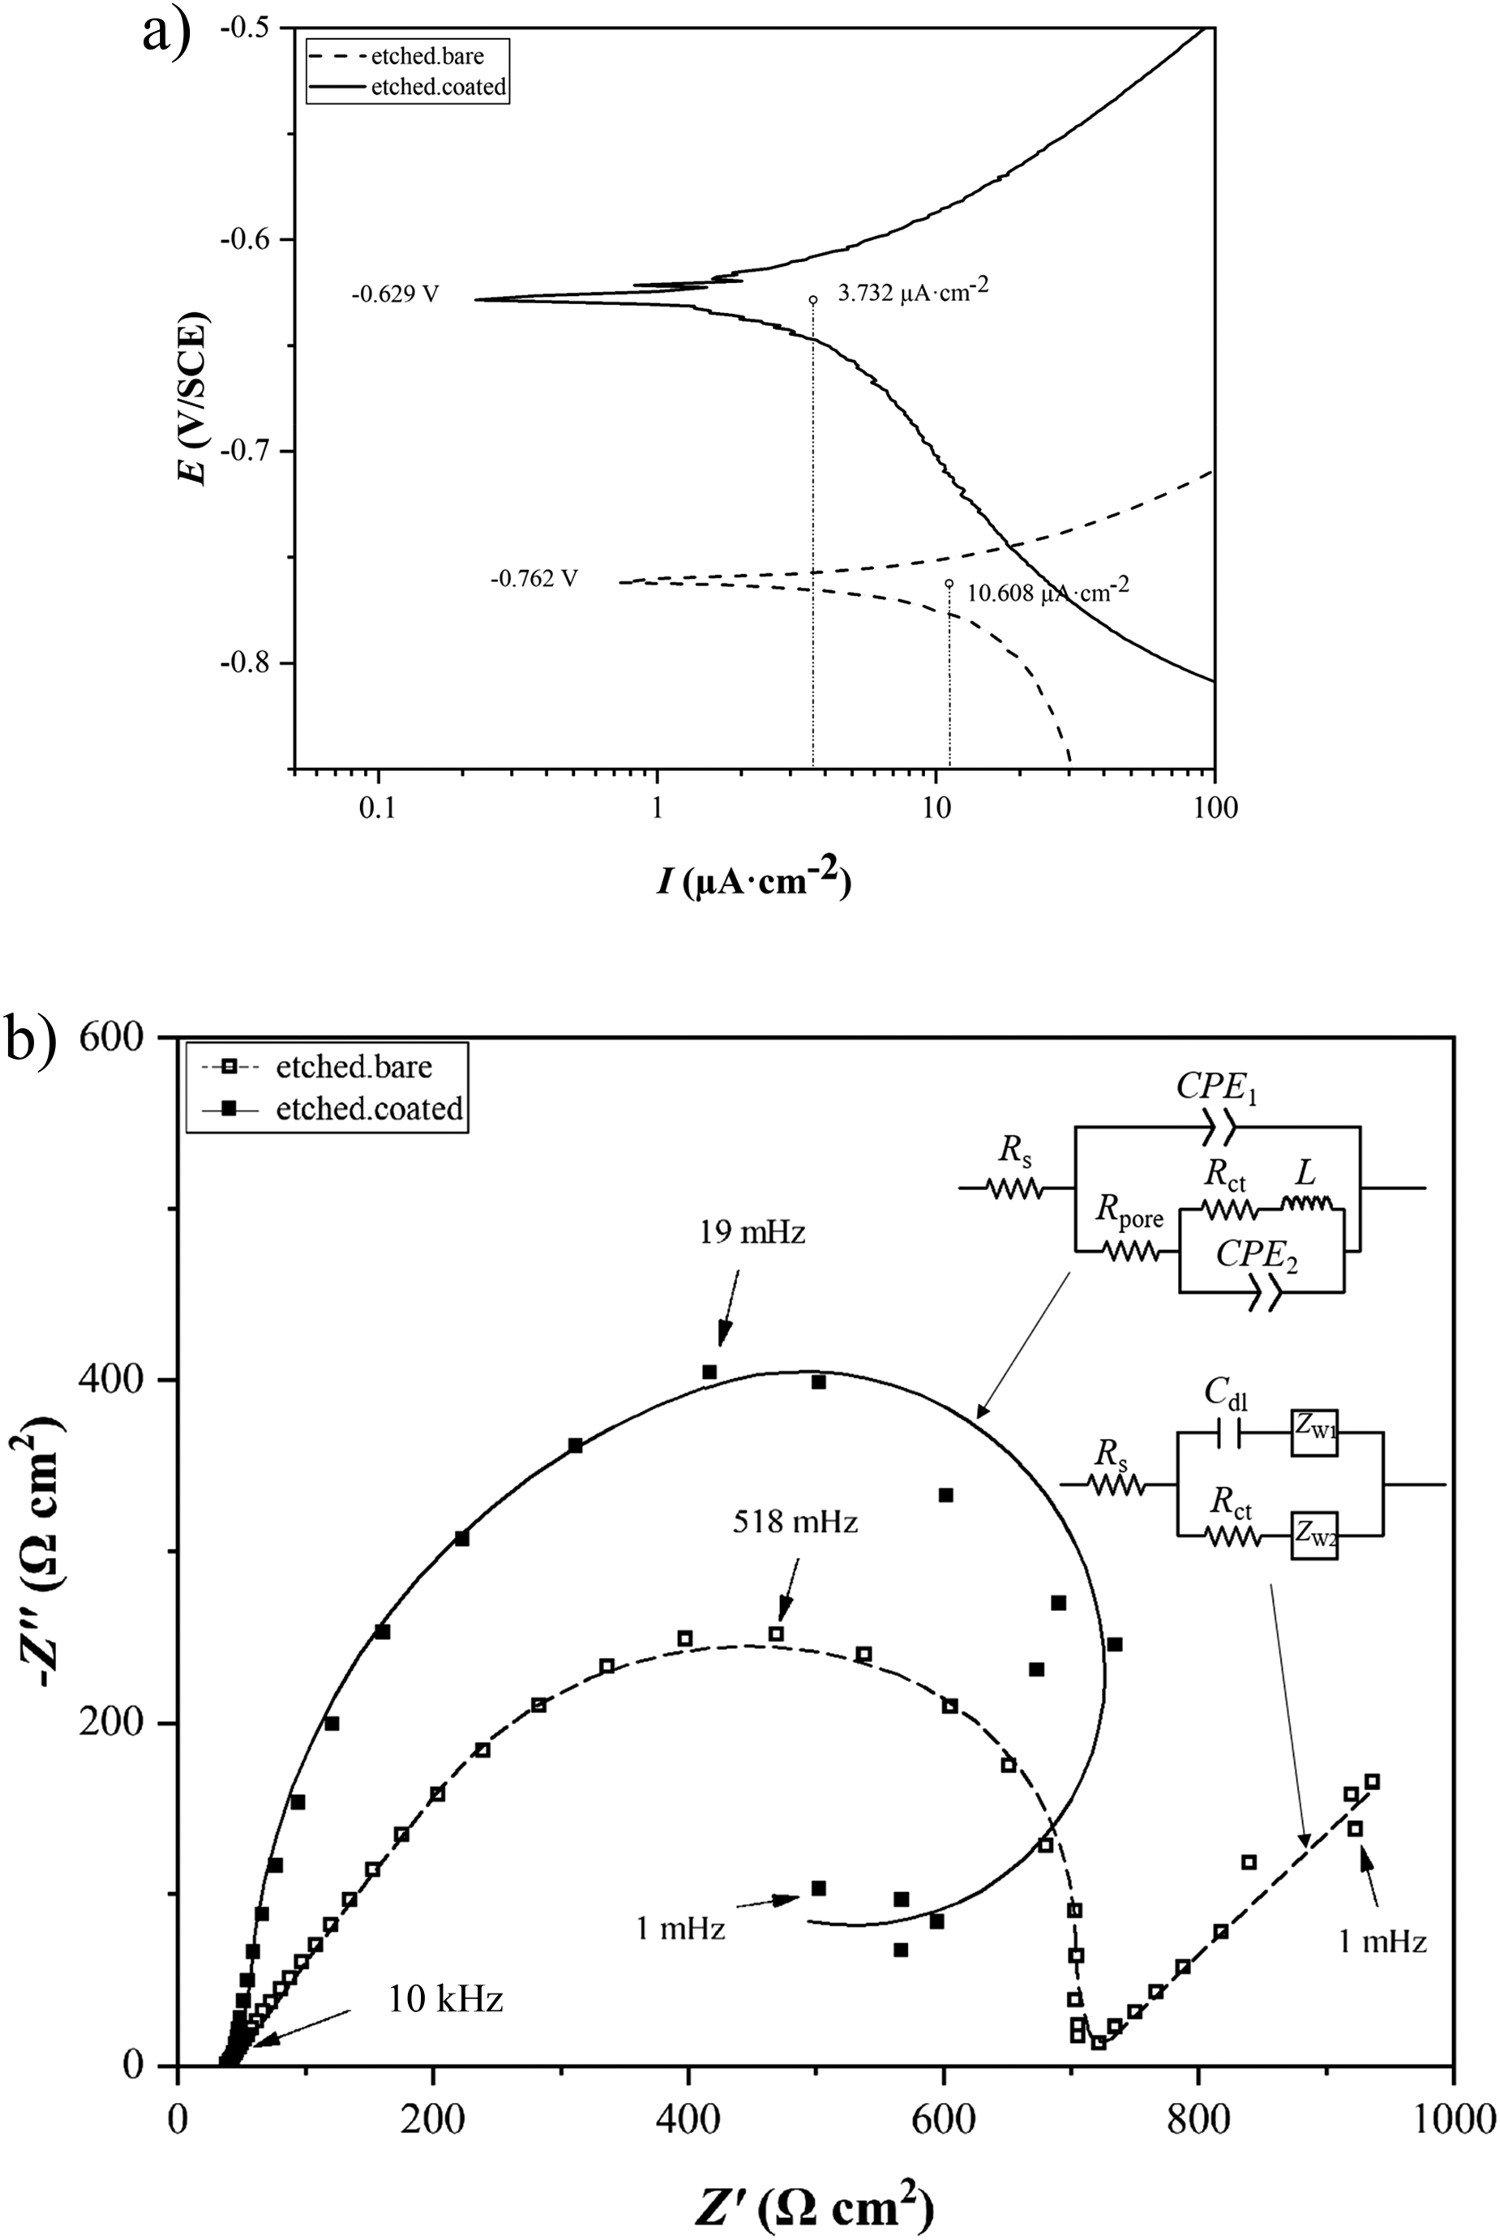
In the Nyquist plots of the bare and GO-coated etched steel coupons shown in Figure 9(b) it can be observed that the non-ideal semi-circle of the coated steel has larger R p and -Z″max values in comparison to the plot of the bare steel. This indicates that, the deposited GO layers have improved the corrosion resistance of the etched steel surface. However, similar to the Nyquist plots of the ground steel coupons (# 400 and # 150) shown in Figure 5(c), in this figure also, the Nyquist plot of the bare etched steel consists of two Warburg impedance parts that indicate the diffusion flux of the ionic species on the steel surface in contact with the electrolyte. The two diffusional Warburg impedances in the electrical circuit model of the bare etched steel in the inset of Figure 9(b) refer to the Warburg impedances at the low-frequency end (ZW1: Z′ > 700 (Ω cm2)) and high-frequency part of the plot (ZW2: Z′ < 400 (Ω cm2)). The low-frequency part, in the form of a straight line with a ∼ 45° angle is the semi-infinite Warburg impedance, while the diffusional impedance that is seen in the high-frequency part of the non-ideal semi-circle is a finite length Warburg impedance that is formed as a result of a diffusion process with transmissive boundary condition [54].
Figure 10 summarises the variations in the E corr and I corr of the analysed carbon steel coupons with different surface structures and roughness after being electrophoretically coated with multilayers of GO. Each ΔE corr and ΔI corr value represented in this figure is an average value, that has been calculated from the results of three series of measurements. In this figure the ΔE corr means E corr(coated) - E corr(bare) and ΔI corr is I corr(coated) - I corr(bare). Therefore, the negative ΔE corr values in Plot(a) indicate that the E corr of the GO-coated steel is more negative than the E corr of the bare steel. Similarly, the positive ΔI corr values that are shown in Plot(b) indicate that the magnitude of the I corr of the coated steel is larger than the I corr of the bare steel with the same surface structure/roughness.
Variations in the (a) ΔE corr (E corr(coated) – E corr(bare)) and (b) ΔI corr (I corr(coated) – I corr(bare)) of steel versus different surface structures and roughness parameters.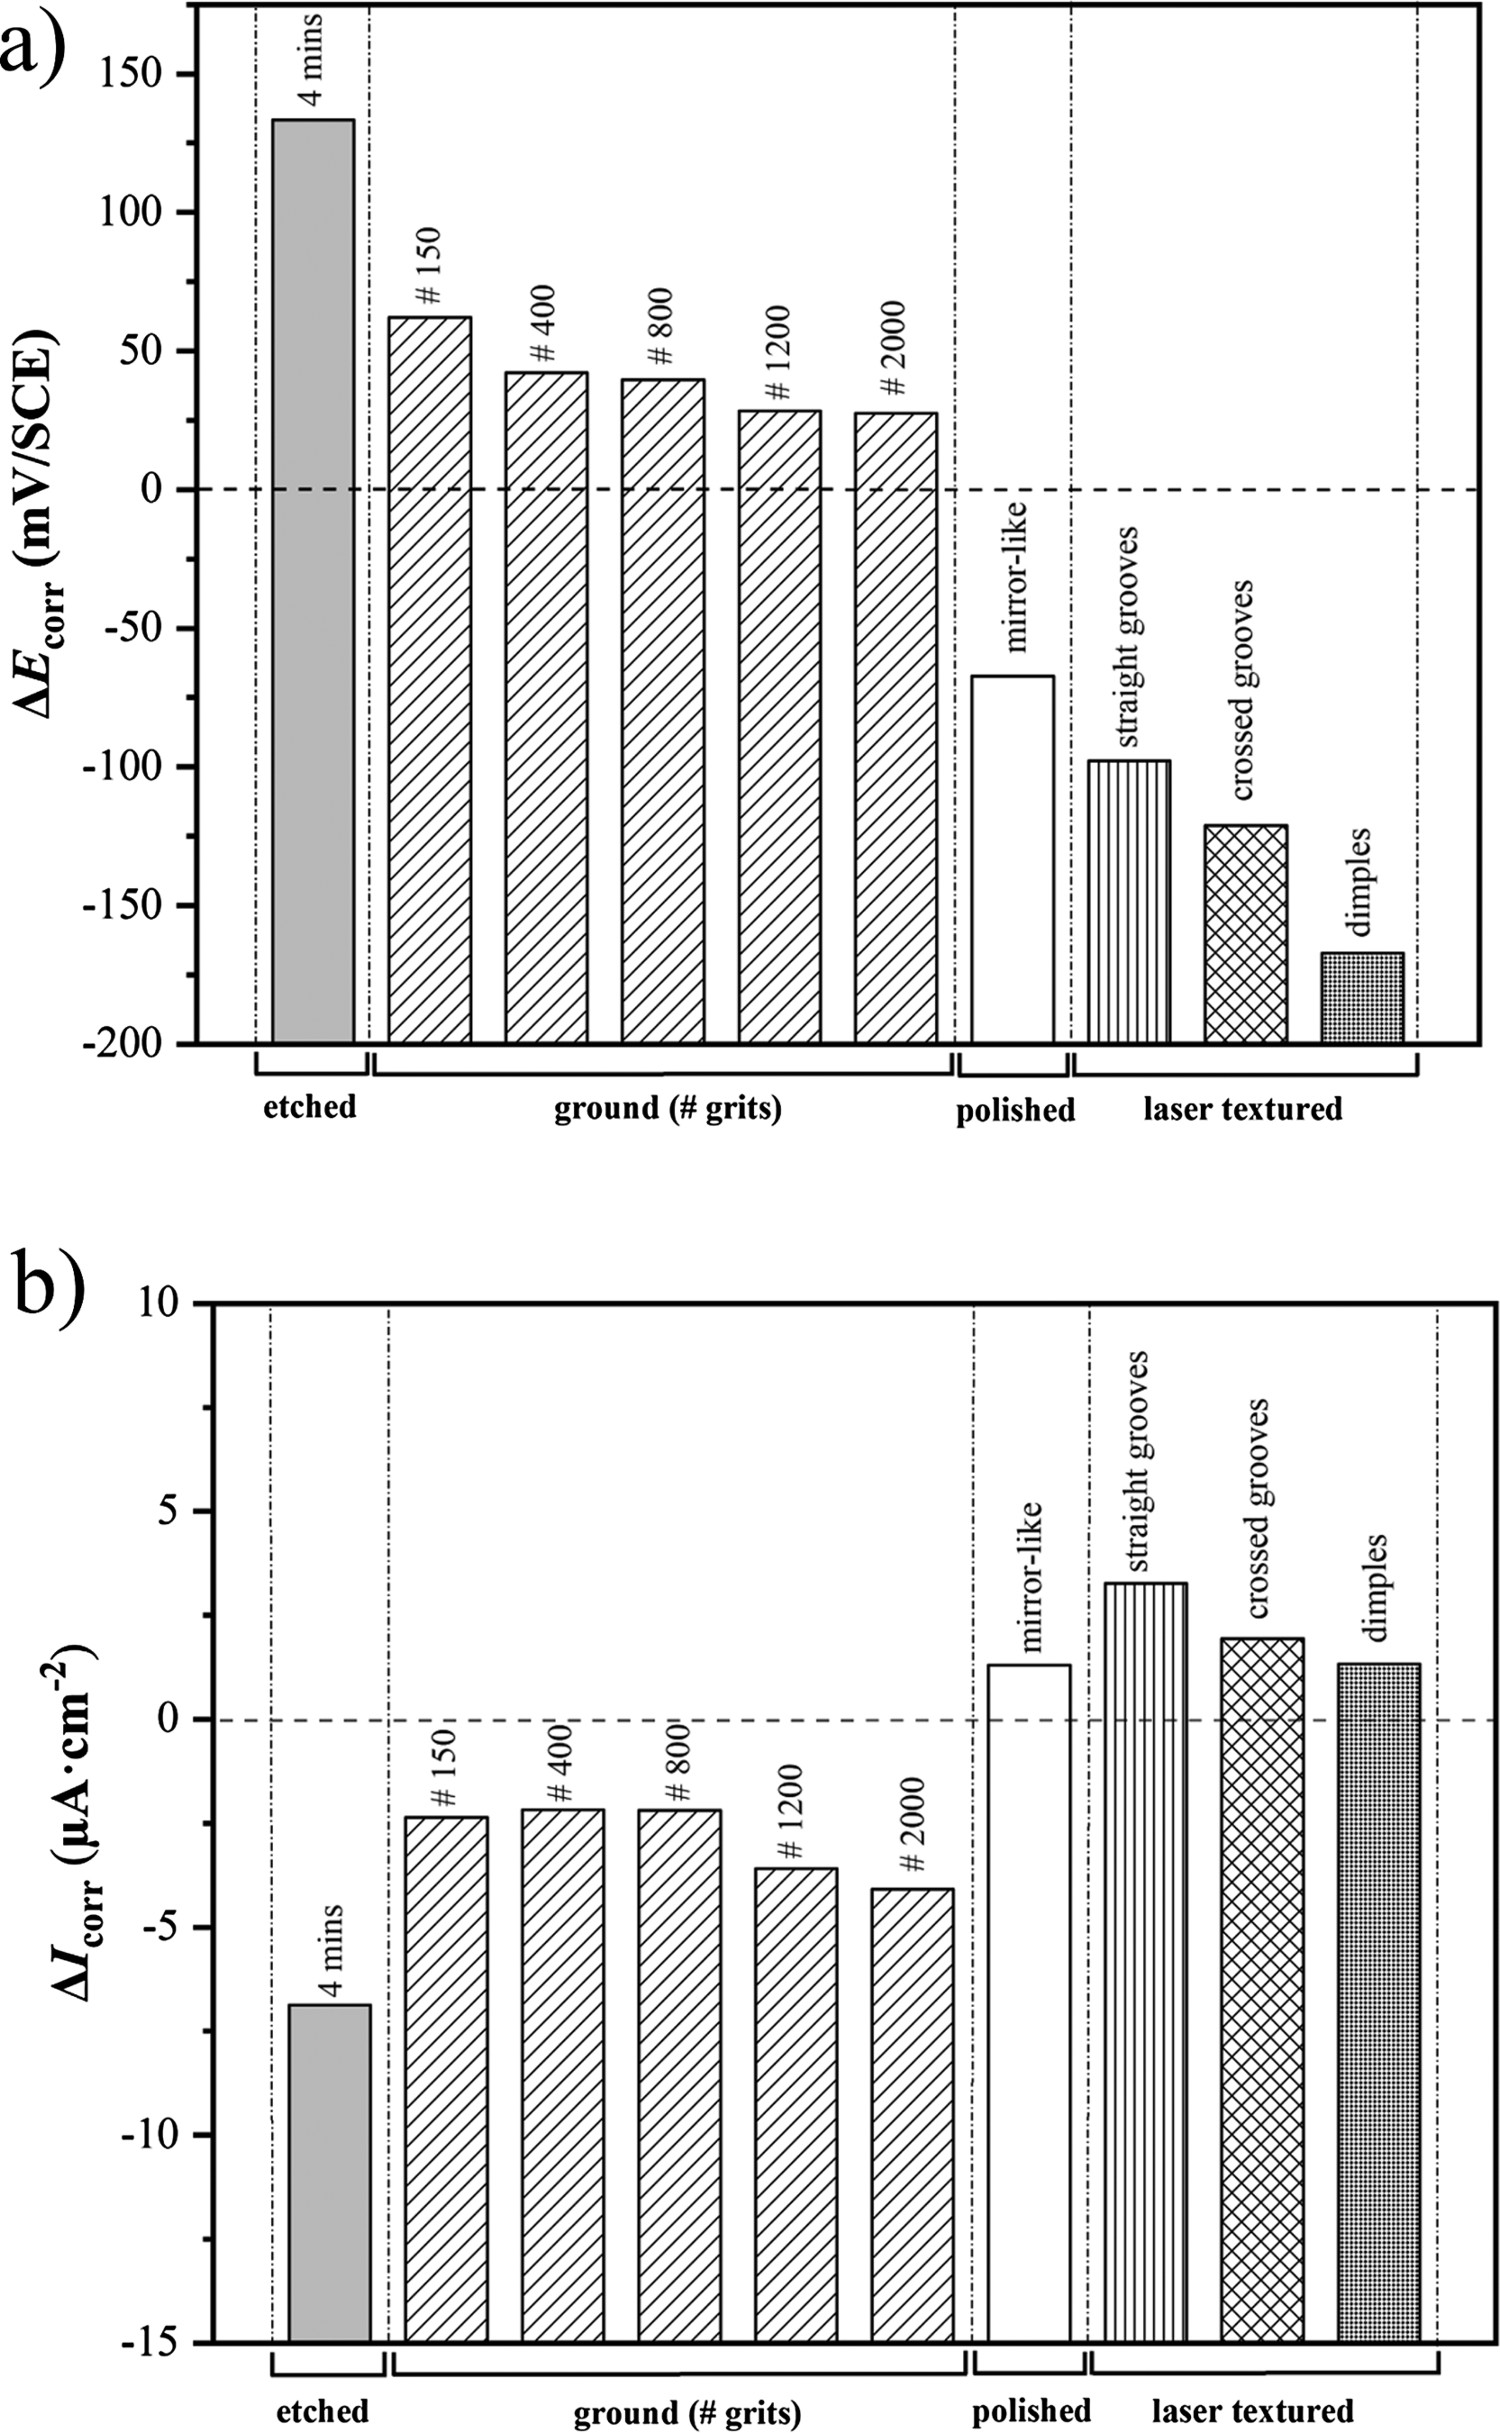
In Figure 10, it can be seen that, in the case of the ground coupons, as the surface roughness parameters increase, the difference between the E corr of the coated and bare steel coupons becomes larger. However, Plot(b) shows that the steel coupon ground with a 2000 grit SiC paper has the maximum ΔI corr value among the ground surfaces. In these two plots, it can also be seen that the ΔE corr and ΔI corr reach their maximum values when the variations in the I corr and E corr of the GO-coated and bare-etched steel coupons are calculated.
The side view SEM images of the coated ground (# 150 and # 400), etched and laser textured (crossed grooves) steel coupons are shown in Figure 11. In each image of this figure, the thickness of the deposited GO in a random area of the coating can be seen.
Side view SEM images of the GO coatings, deposited on the (a) # 150 ground, (b) # 400 ground, (c) etched, and (d) laser textured (crossed grooves) steel coupons. (# numbers represent the grit of the SiC papers used for grinding the steels).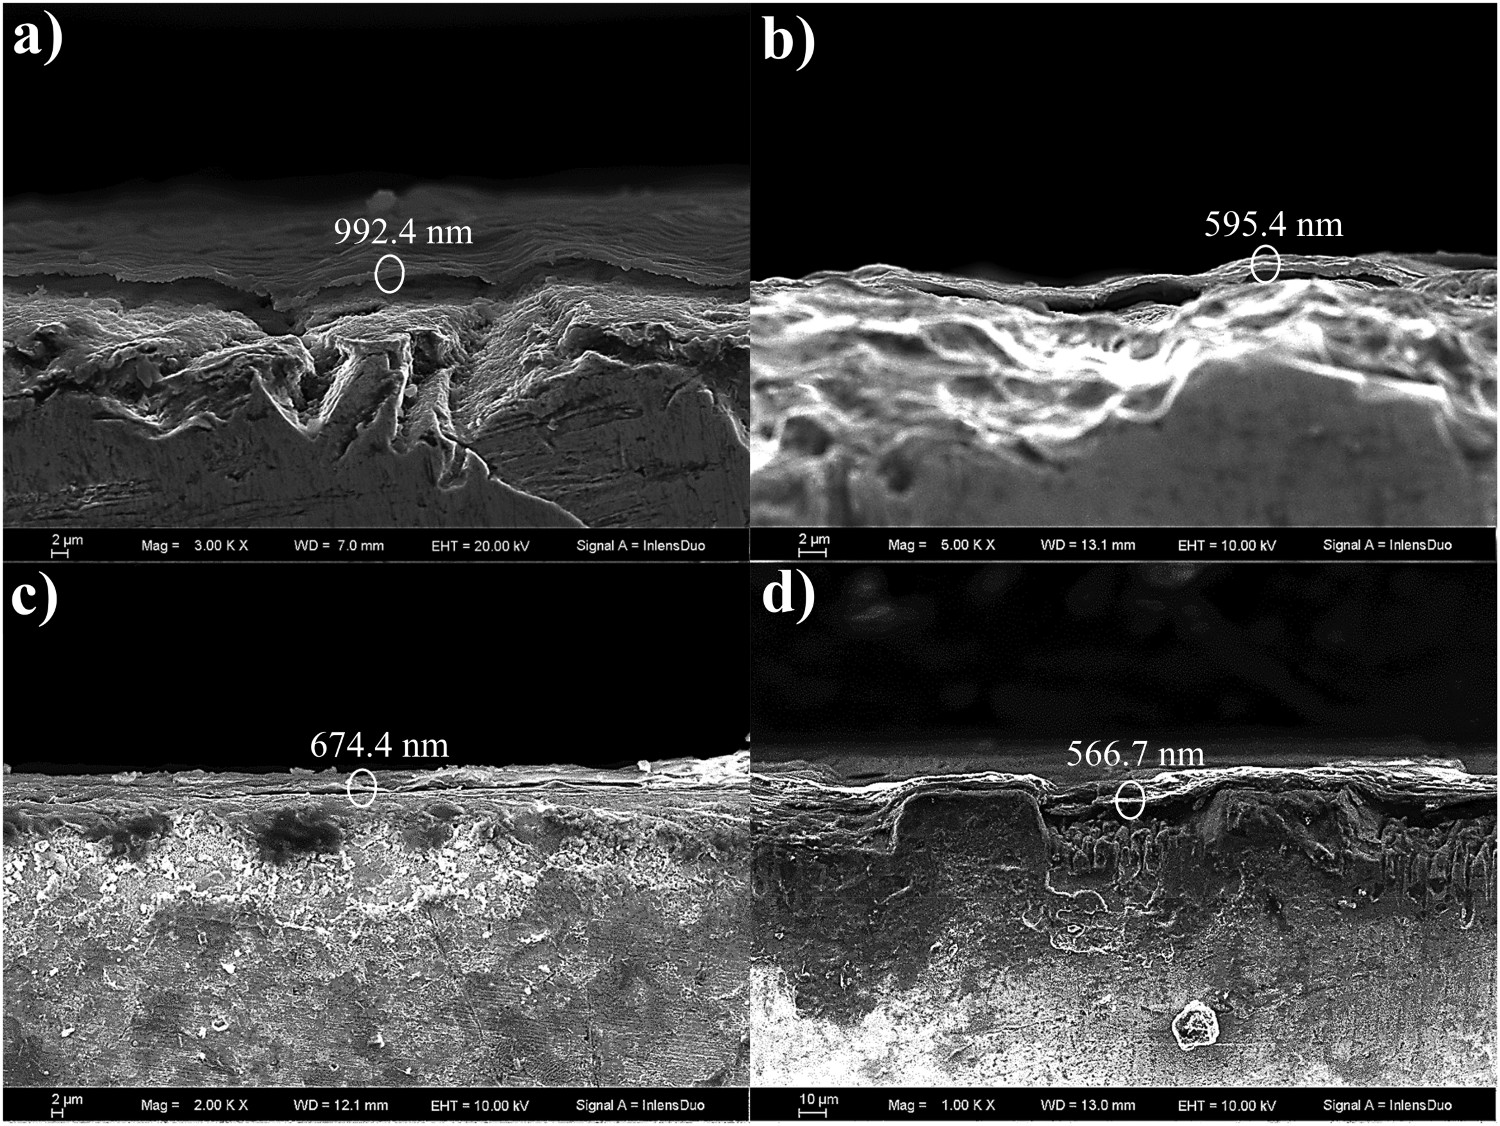
Wettability of the steel surface
Besides the surface roughness parameters, the wettability of the bare (laser textured, polished, ground, and chemically etched) and GO/rGO coated # 2000 ground steel coupons were also analysed by determination of the water contact angle on each surface. Figure 12 illustrates the positioned water droplets on each bare and coated surface with its determined contact angles. This figure shows that the laser-textured and polished steel surfaces have the largest water contact angles among the steel coupons. In the group of laser-textured surfaces, the largest contact angle belongs to the surface with crossed grooves pattern that indicates the high hydrophobicity of this surface. The contact angles of the polished and dimple pattern surfaces were almost identical. In Images(f–i) of Figure 12, the reduction in the water contact angles of the ground surfaces indicates that grinding increases the hydrophilicity of the steel surface. In this figure, Image(j) depicts that the etched steel surface has the lowest water contact angle and therefore, is the most hydrophilic bare surface that has been analysed in this study. Image(k) in this figure is a schematic illustration of the positioning of a water droplet on the surface of a ground steel from two different side views. In this image, a comparison of the shapes of the water droplet, shown from two side views, reveals that, the positioned water droplet on a ground surface gets spread along the grooves. This means that, when the water contact angle is determined on a ground surface, the side view vertical to the direction of the surface grooves must be chosen to see the right angle of the water droplet on the surface. Finally, in Images(l,m) of Figure 12, the water contact angles of GO and rGO coated on ground (# 2000) steel coupons can be observed. In Image(m), the rGO coating has been prepared by conducting 10 h heat treatment at 150°C. In these two images, one can see that the water contact angle of GO increases from ∼77° to ∼98° when the GO deposit is converted to rGO by heat treatment.
Water contact angles were determined on the bare steel coupons with different surface structures and roughness. (a) crossed grooves, (b) straight grooves, (c) polished (mirror-like), (d) dimples, (e) # 1200, (f) # 2000, (g) # 400, (h) # 800, (i) # 150, (j) chemically etched, (k) water droplet positioned on a ground steel surface from two cross views, (l) GO coated on a # 2000 steel and (m) rGO (heat treated for 10 h at 150°C) coated on a # 2000 steel. (# numbers represent the grit of the SiC papers used for grinding the steels).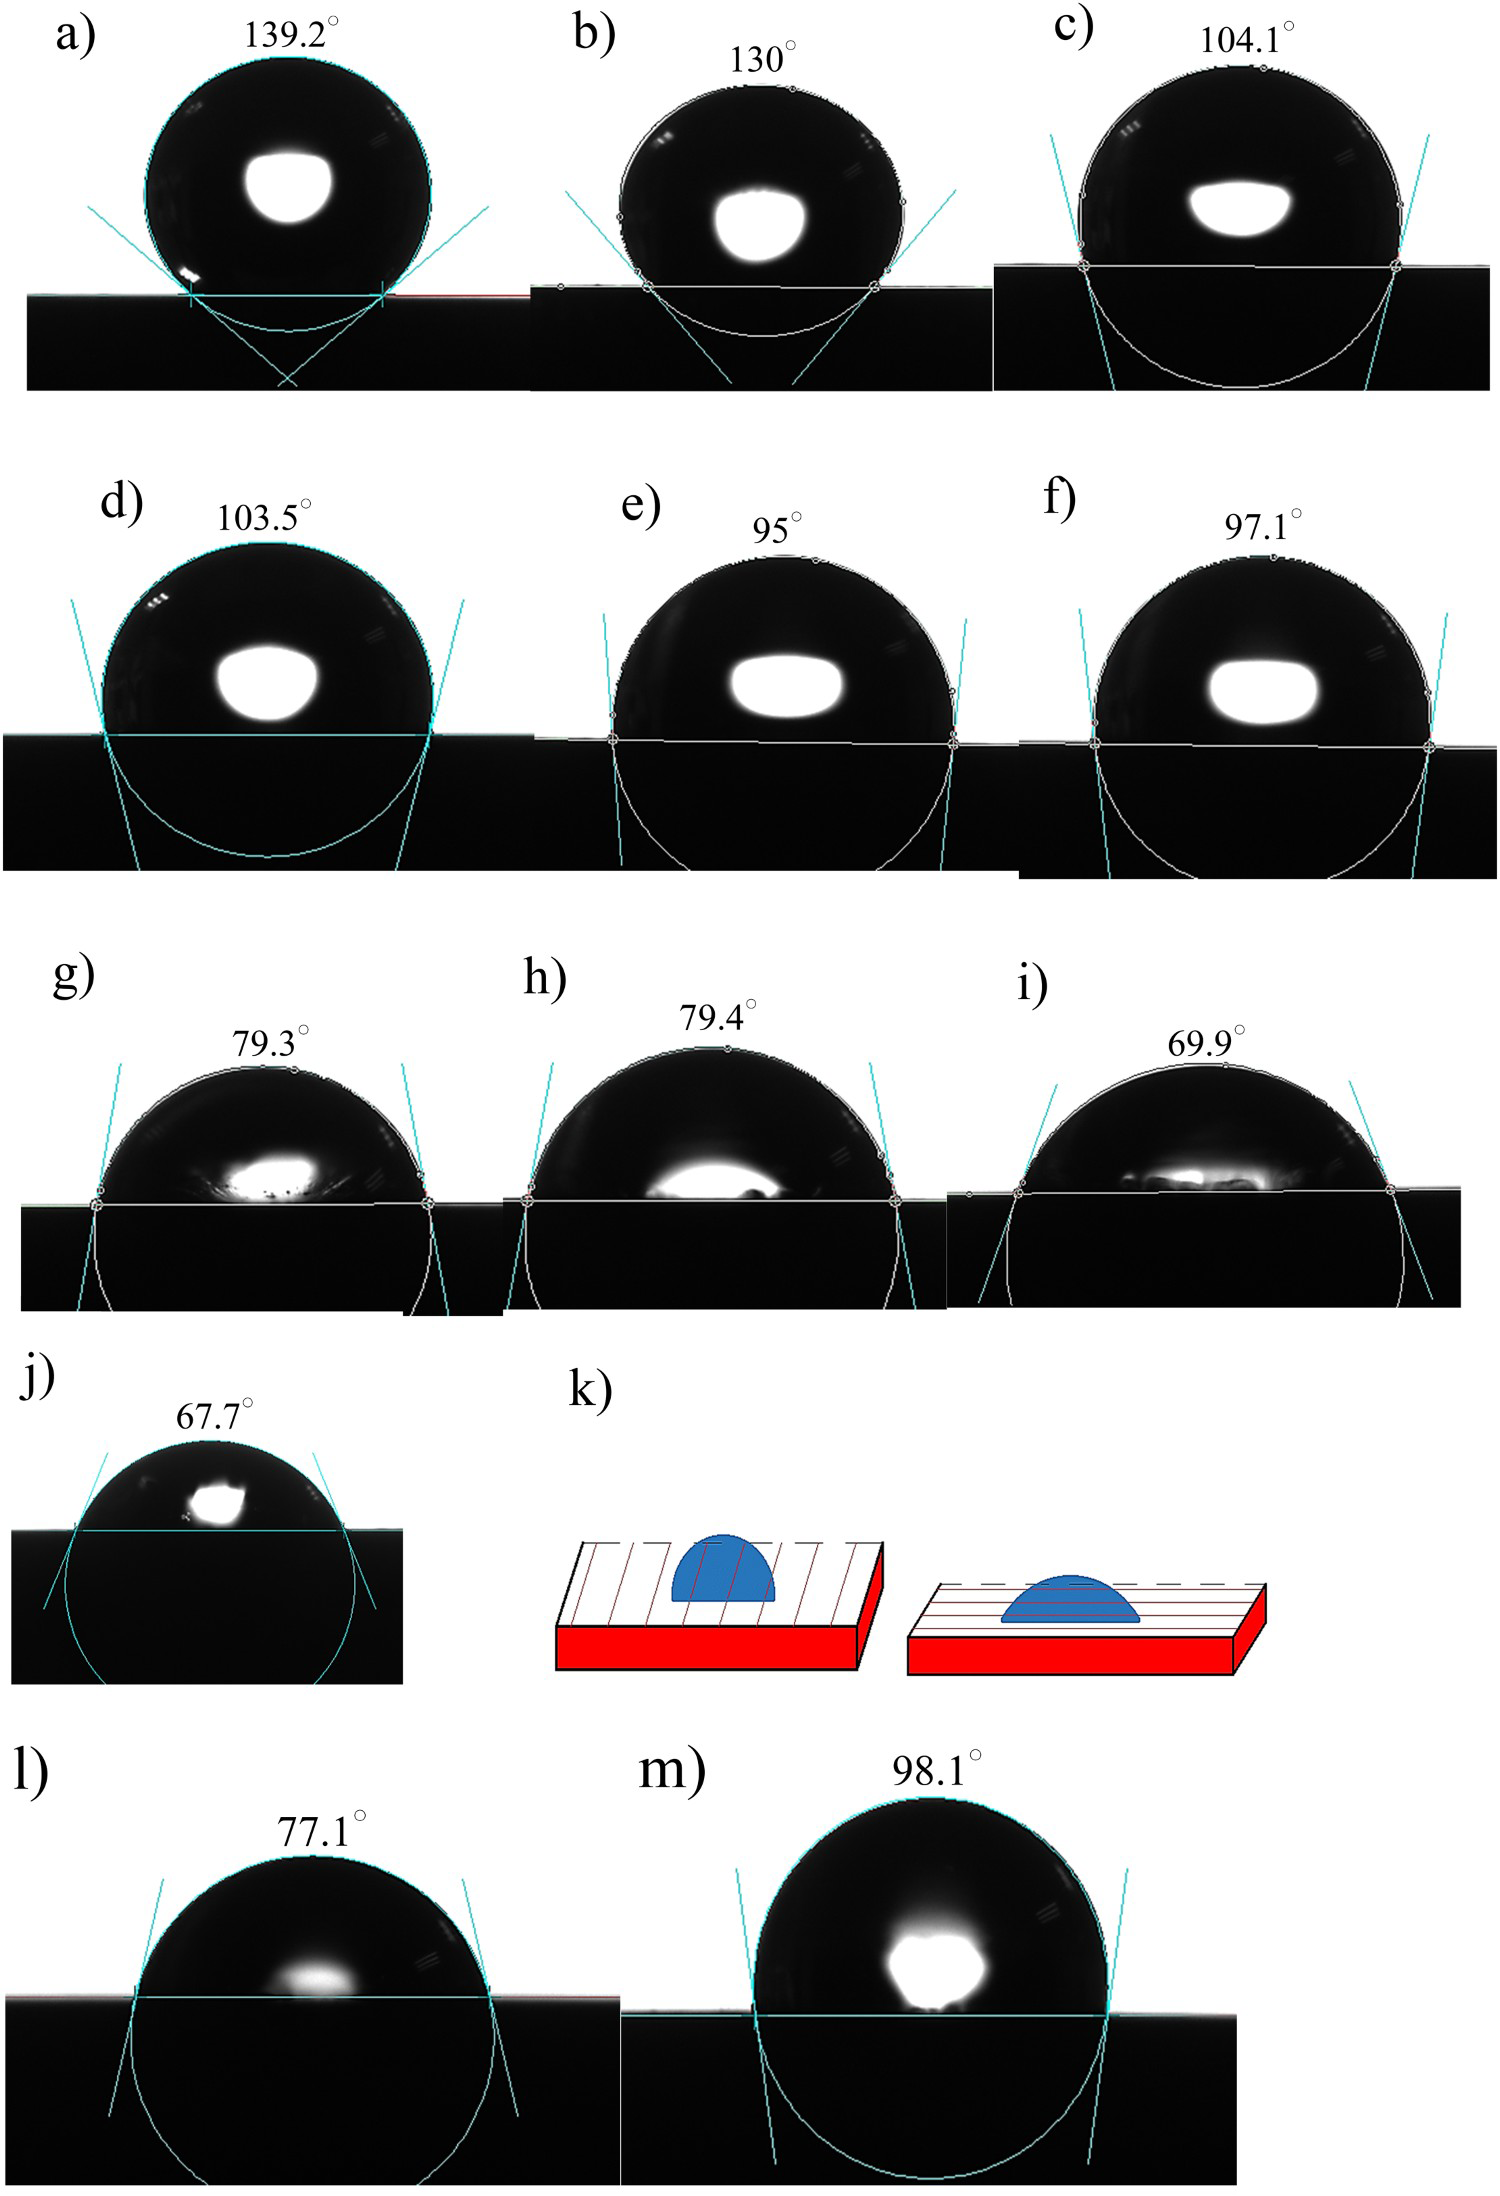
Based on the results obtained from the electrochemical measurements, AFM surface analysis, and wettability tests of this study; it can be concluded that as the surface roughness and hydrophilicity of the carbon steel coupons increase, the electrophoretically deposited GO coatings on the steel show better protective performance. Our results also showed that, intelligently structured surfaces by laser processing are not suitable substrates to be coated with GO. We observed that randomly generated microscale level grooves/valleys, peaks, and pits on the steel surface by mechanical grinding and chemical etching increases the mechanical interlocking/adhesion between the GO platelets and steel surface. This way, GO can fill the micro grooves and valleys and inhibit the diffusion of aggressive ionic species from the corrosive environment to the surface of the steel. In fact, our results proved that, increasing the surface roughness and hydrophilicity of steel, promotes the positive factor of mechanical interlocking/adhesion between GO and steel surface, and consequently, helps this factor to win the competition against the two other factors that have negative effects on the anti-oxidation/corrosion performance of GO. These two negative factors are the galvanic behaviour of rGO, which opposite to GO is electrically conductive, –metal couple, and hydrophilic nature of GO.
Here it is important to be noted that in Figure 10 the ground and etched steel surfaces, with surface hydrophilicity degrees higher than the laser textured and polished surfaces show larger shifts in the E corr and I corr values, towards more positive potentials and lesser current densities, respectively (ΔE corr and ΔI corr). However, it is well-known that roughening a metallic surface and increasing its surface wettability accelerate the electrochemical corrosion and oxidation of the surface in aqueous environments. Therefore, our recommendation is that, for each metal or alloy, optimum degrees of the surface roughness and hydrophilicity should be considered before the electrophoretic deposition of GO. Here for the specific case of carbon steel we recommend grinding the steel surface with a # 2000 grit SiC paper before electrophoretic deposition of the GO. This way the protection of the alloy surface will be achieved while the negative side effects of the large roughness and high wettability of the surface are avoided.
Protective performance of the rGO coating
In the last part of this study, the deposited GO coating on a # 2000 ground carbon steel was converted to rGO by heat treatment (150°C for 10 h). The XRD and FTIR spectra of the rGO are shown in Figure 2. After conversion of most of the (001) GO coating to (002) rGO, the potentiodynamic polarization curve and Nyquist plot of the rGO-coated steel coupon were recorded. The obtained results can be compared with the electrochemical parameters of the bare and GO-coated steel in Figure 13. The potentiodynamic polarization curves represented in Plot(a) of this figure show that, although the recorded I corr of the rGO-coated steel is almost three times larger than the I corr of the steel coupon that was coated with GO, reduction of the GO coating has shifted the E corr of steel to about −0.506 V/SCE which is the most positive E corr that has been achieved for a coated carbon steel in this study. Comparison of the cathodic branches of the potentiodynamic polarization curves in this figure also reveals that the rate of the cathodic reduction reactions that occur on the rGO (mainly oxygen reduction reactions) is much larger than the rate of the reduction reactions on the GO. The Nyquist plots of the rGO and GO-coated steels in Plot(b) of Figure 13 also show that the R p of the rGO-coated steel electrode is larger than the R p of both bare and GO-coated steels.
(a) potentiodynamic polarization curves and (b) Nyquist plots of the # 2000 bare and GO/rGO coated # 2000 steel coupons. (# numbers represent the grit of the SiC papers used for grinding the steels).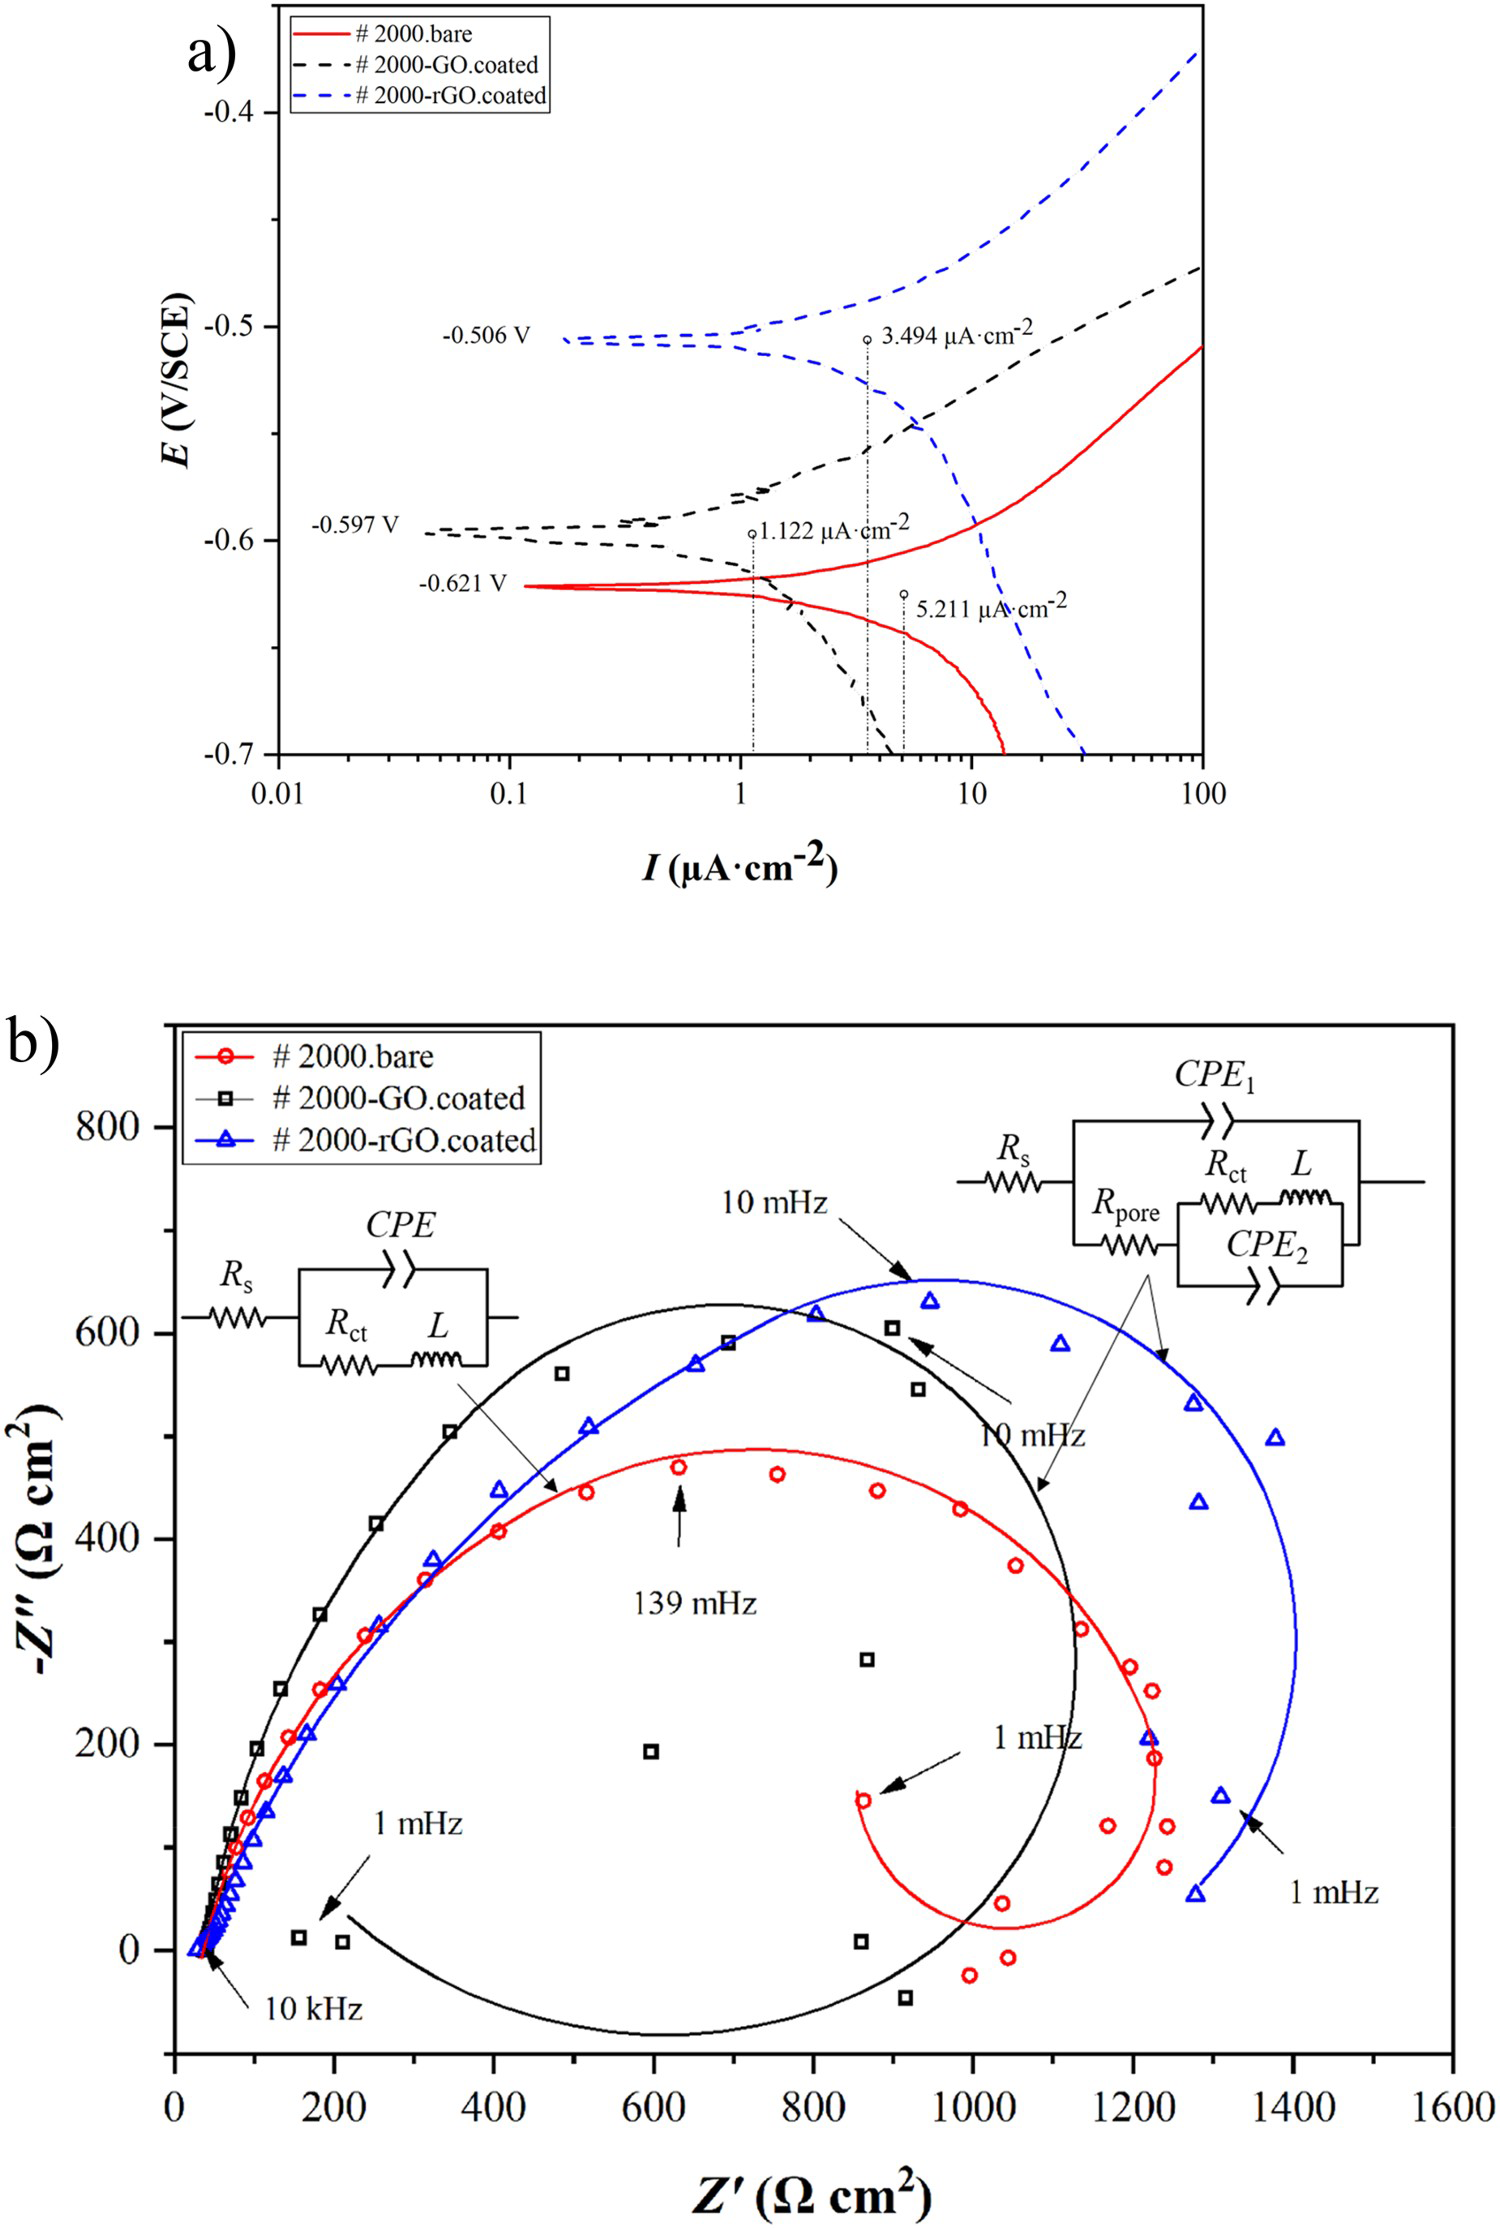
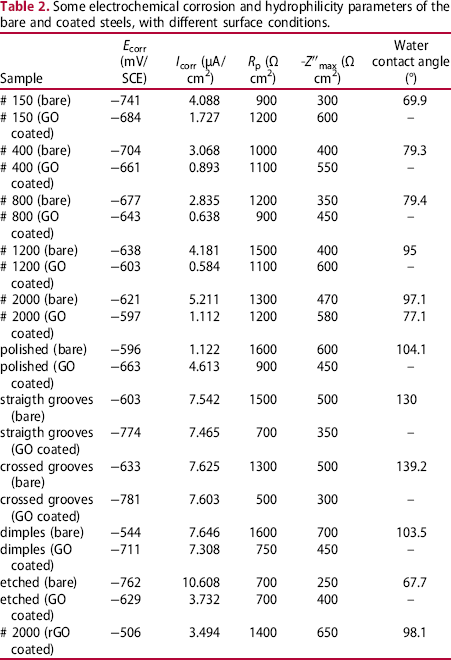
Some electrochemical corrosion and hydrophilicity parameters of the bare and coated steels, with different surface conditions.
Conclusions
Effect of prior surface treatment of carbon steel on the protection performance of the electrophoretically deposited GO on steel was investigated. Steel surfaces after laser texturing, mechanical polishing/grinding, and chemical etching were coated with multilayers of GO and the electrochemical corrosion parameters of the coated and bare surfaces were compared. From the results obtained in this study, the following conclusions can be drawn.
GO can be used as an effective anti-oxidation/corrosion barrier on carbon steel if prior surface treatments are performed on the steel surface.
Anodic electrophoretic deposition process of the non-conductive GO dispersed in distilled water reduces part of it to make electrically conductive rGO.
The protective performance of the deposited GO(+rGO) can overcome the two negative factors of galvanic behaviour of rGO-steel and hydrophilic nature of GO, only if the mechanical interlocking/adhesion between the GO and steel surface be promoted before coating the steel.
Mechanical grinding and chemical etching of steel increase the mechanical interlocking/adhesion between the GO platelets and steel surface through increasing the roughness and hydrophilicity of the bare surface. Therefore, electrophoretically deposited GO on rough and hydrophilic steel surfaces improves their electrochemical corrosion parameters.
Hydrophobic steel surfaces such as laser-textured and polished steels are not suitable substrates to be electrophoretically coated with GO for corrosion protection.
For the specific case of carbon steel the proper prior surface treatment that we can recommend is grinding the steel surface with a # 2000 grit SiC paper (water contact angle <100°) before deposition of the GO.
Further improvements in the electrochemical corrosion parameters of steel can be achieved by promoting the conversion of GO coating to rGO.
Footnotes
Disclosure statement
No potential conflict of interest was reported by the author(s).