
Abstract
In the present study, laser surface melting (LSM) of 304L stainless steel (SS) was performed using 250 W pulse Nd: YAG laser which resulted in a 250 µm thick melted layer with refined microstructure on the surface. Potentiostatic polarisations at various potentials in the transpassive regime in 6 M HNO3 solution at 95°C were used to quantify the IGC rate. The transpassive dissolution rate was significantly reduced after LSM. The pitting corrosion susceptibility was assessed by potentiodynamic polarisation in 3.5 wt-% NaCl solution. LSM resulted in an increase in pitting potential. Following electrochemical tests, sample surfaces were examined using optical and scanning electron microscopes besides a 3-D optical profilometer. The depths of IGC attack and pit were significantly reduced after LSM. The improvement in resistance to pitting corrosion and transpassive dissolution was attributed to the elimination of inclusions and impurity segregation at the grain boundaries brought about by LSM.
Keywords
Introduction
Laser has emerged over decades as a novel surface modification tool for metals and alloys [1–4]. Among different laser treatment techniques, laser surface melting (LSM) is becoming increasingly useful for a variety of engineering applications [5 7]. In LSM, the laser beam is focussed on the surface of the material, causing it to melt instantly up to a certain depth. Consequently, a rapid solidification occurs at a very high cooling rate up to 1010 K s−1 [8]. LSM results in a surface modified layer with superior surface properties when conducted in a controlled setting (in an Ar/N2 atmosphere). On the laser-melted stainless steel (SS) surface, a high solidification rate produces a refined microstructure [9]. In certain manufacturing processes, such as machining and grinding, surface defects are introduced into the metal which can be eliminated by LSM due to the evaporation and redistribution of the elements [10]. At the incidence point of the laser beam, the energy distribution over the circular region of interaction is Gaussian. This will lead to a variation in the depth of melting from the centre of the laser spot to the periphery. Therefore, for the treatment of a large surface area, overlapping of the individual laser impact points is required where the microstructure and phase distribution in the overlapped region is very complicated. The more is the overlapping percentage; the more thermal cycles occur on the same area resulting in a more homogenised surface [9]. A 70% overlap has been shown to improve the corrosion resistance of various alloys [11].
For nitric acid applications, austenitic SS type 304L is extensively used as structural materials. It forms a stable, adherent and protective chromium oxide surface film making it highly resistant to uniform corrosion in nitric acid. However, sensitisation is a major concern for this material which may develop either during welding or by an improper heat treatment. In a sensitised SS, regions adjacent to the grain boundaries become depleted in chromium (to a level below 12 wt-%) due to the formation of Cr-rich carbides. Such regions do not have a sufficiently strong protective film, hence in aggressive environments, preferential corrosion takes place in those regions resulting in intergranular corrosion (IGC) [12 14].
Even in the absence of sensitisation, austenitic SS can still undergo IGC if the operating potentials are in the transpassive regime [14 19]. The corrosion potential of SS in nitric acid solution is dictated by the nitric acid concentration, temperature and the cathodic reaction of the reduction–oxidation (redox) process between the alloying elements of steel and the ionic species present in the solution [15]. If oxidising ions are present in the solution, the reduction reactions of these ions raise the corrosion potential [16]. A non-sensitised SS displays very good IGC resistance in the passive potential range of the anodic polarisation curve. In a nuclear spent fuel reprocessing plant, components made of 304L SS are in contact with concentrated (up to 6 M) boiling nitric acid [12]. This environment is extremely aggressive as indicated by the operating potential which is just below the transpassive potential in the passive range. A small increase in the aggressiveness of the environment, e.g. an increase in oxidising ion concentration, may shift the potential to the transpassive regime. So even with a non-sensitised SS, IGC has been observed [14,17]. At transpassivity and beyond, SS is no longer covered by the protective Cr2O3 film as Cr3+ is rapidly oxidised to Cr6+ which is soluble in nitric acid [20]. The main characteristics of IGC have been found to be the formation of triangular grooves at the grain boundaries due to the preferential accelerated corrosion attack at these regions. These grooves progress along grain boundaries inside the SS, completely covering the grain, which finally lead to grain dropping [21]. The present understanding of reasons for IGC in the transpassive regime, i.e. transpassive dissolution are (i) the segregation of impurity elements at grain boundaries and (ii) the relative misorientation of adjacent grains at grain boundaries which affects the kinetics of the attack [22].
Another key issue that might result in catastrophic failure is the pitting corrosion of SS [23]. In the presence of chloride ions, the protective passive film that is rich in chromium may break down locally [24 26]. As a result, the underneath metal suffers localised corrosion attack, initiating a pit. The corrosion products, e.g. metal ions attract the chloride ions and react with them. As a result, the pH decreases inside the pit. The propagation of pits happens through this autocatalytic process [13].
The corrosion behaviour of various alloys following LSM has widely been studied [27 33]. LSM has been reported to improve the IGC resistance of austenitic SSs in the sensitised condition [29,30]. This is due to the removal of chromium carbides and Cr depletion at the grain boundaries after LSM. Additionally, it has been demonstrated that the laser surface melted SSs are less prone to pitting corrosion than the base materials [11,31,32]. A few studies also report an increase in pitting corrosion susceptibility of SS after LSM [34,35]. However, no investigation on the effect of LSM on the IGC resistance of a non-sensitised 304L SS in the transpassive potential regime has been published. In the present study, the mitigation of IGC of a non-sensitised SS at potentials in the transpassive regime by LSM is explored. The effect of LSM on the susceptibility to pitting corrosion is also established.
Materials and methods
Material details
Chemical composition of 304L SS.

Laser surface melting
LSM was performed with a fibre coupled pulsed Nd:YAG laser system with 250 W average power, 5 kW maximum peak power, 2-20 ms pulse duration, and 1-100 Hz repetition rate. Laser beam was delivered through a 600 μm core diameter and 0.22 numerical aperture (NA) silica-silica optical fibre. At the exit fibre end, laser beam was focused to a diameter of 1.2 mm using 1:2 lens imaging configuration. A compact nozzle having provision to purge argon inert gas coaxially with the laser beam on the material surface was used for LSM of specimens. Specimens of size 25 mm × 25 mm were cut from the SS plate. Laser melting was done on all the six surfaces. The pulse width and pulse energy to carry out LSM were 20 ms and 32 J, respectively. Laser beam with a spot size of 1.2 mm was focused on the surface, and it was moved across it at a scan rate of 60 mm min−1. The overlapping ratio between two neighbouring spots was 70%. An argon gas flow rate of 2 kg cm−2 was maintained during LSM to prevent metal surface oxidation.
Throughout the entire article, specimens in the as-received condition and those that have been subjected to LSM will be referred to as ‘AR’ and ‘LSM’, respectively.
Microstructure, hardness and surface roughness measurements
To examine the microstructure, an LSM specimen was sectioned and the cross-section was mounted using cold setting resin. It was ground using progressively finer grit SiC emery papers up to 1000 grit, and subsequently polished using 1 µm diamond suspension. The specimen was electrolytically etched in 10% oxalic acid solution at 1 A cm−2 current density for 90 s. The microstructure was examined using both an optical microscope and a scanning electron microscope (SEM) attached with energy-dispersive spectroscopy (EDS). The surface microstructures of the AR and LSM specimens were also examined using the same procedure.
Vickers hardness was measured at a load of 300 gf and dwell time of 15 s. For this, the specimens were separately mounted in cold setting resin and were ground and polished up to a finish of 1 µm. In case of LSM specimen, only a thin layer of material was removed during grinding just to get rid of the surface roughness of the specimen as a result of LSM. In order to determine whether any hardening or softening had occurred in the laser-melted layer in comparison to the underneath base metal or AR specimen, the hardness measurement was also performed at a load of 10 gf on the transverse section of both the AR and LSM specimens. This was performed by using an instrumented hardness indentation machine (Model Fischerscope Hm 2000). A ferritscope was used to measure the amount of δ-ferrite on the surfaces of both AR and LSM specimens. The surface roughness of the LSM specimen was measured using a non-contact 3D-optical profilometer. An area of the LSM surface measuring 1.67 × 1.67 mm was scanned to calculate the S a (arithmetic mean height) value.
Electrochemical tests
A conventional three electrode corrosion cell was used for electrochemical tests. Platinum electrode and saturated calomel electrode (SCE) were used as counter and reference electrode, respectively. LSM or AR specimens served as the working electrode.
Transpassive dissolution at 95°C
A schematic of the experimental set up for electrochemical experiments at 95°C is shown in Figure 1. The test solution (6 M HNO3) was placed in the conical flask and the first beaker. The SCE was immersed in saturated potassium chloride solution at room temperature in the second beaker. Electrical connection was maintained through two luggin probes filled with the test solution. Both the working and counter electrodes were kept in the conical flask and the test solution inside this flask was heated with the help of an electrical heater.
Schematic experimental setup for electrochemical tests in 6 M HNO3 at 95°C [17].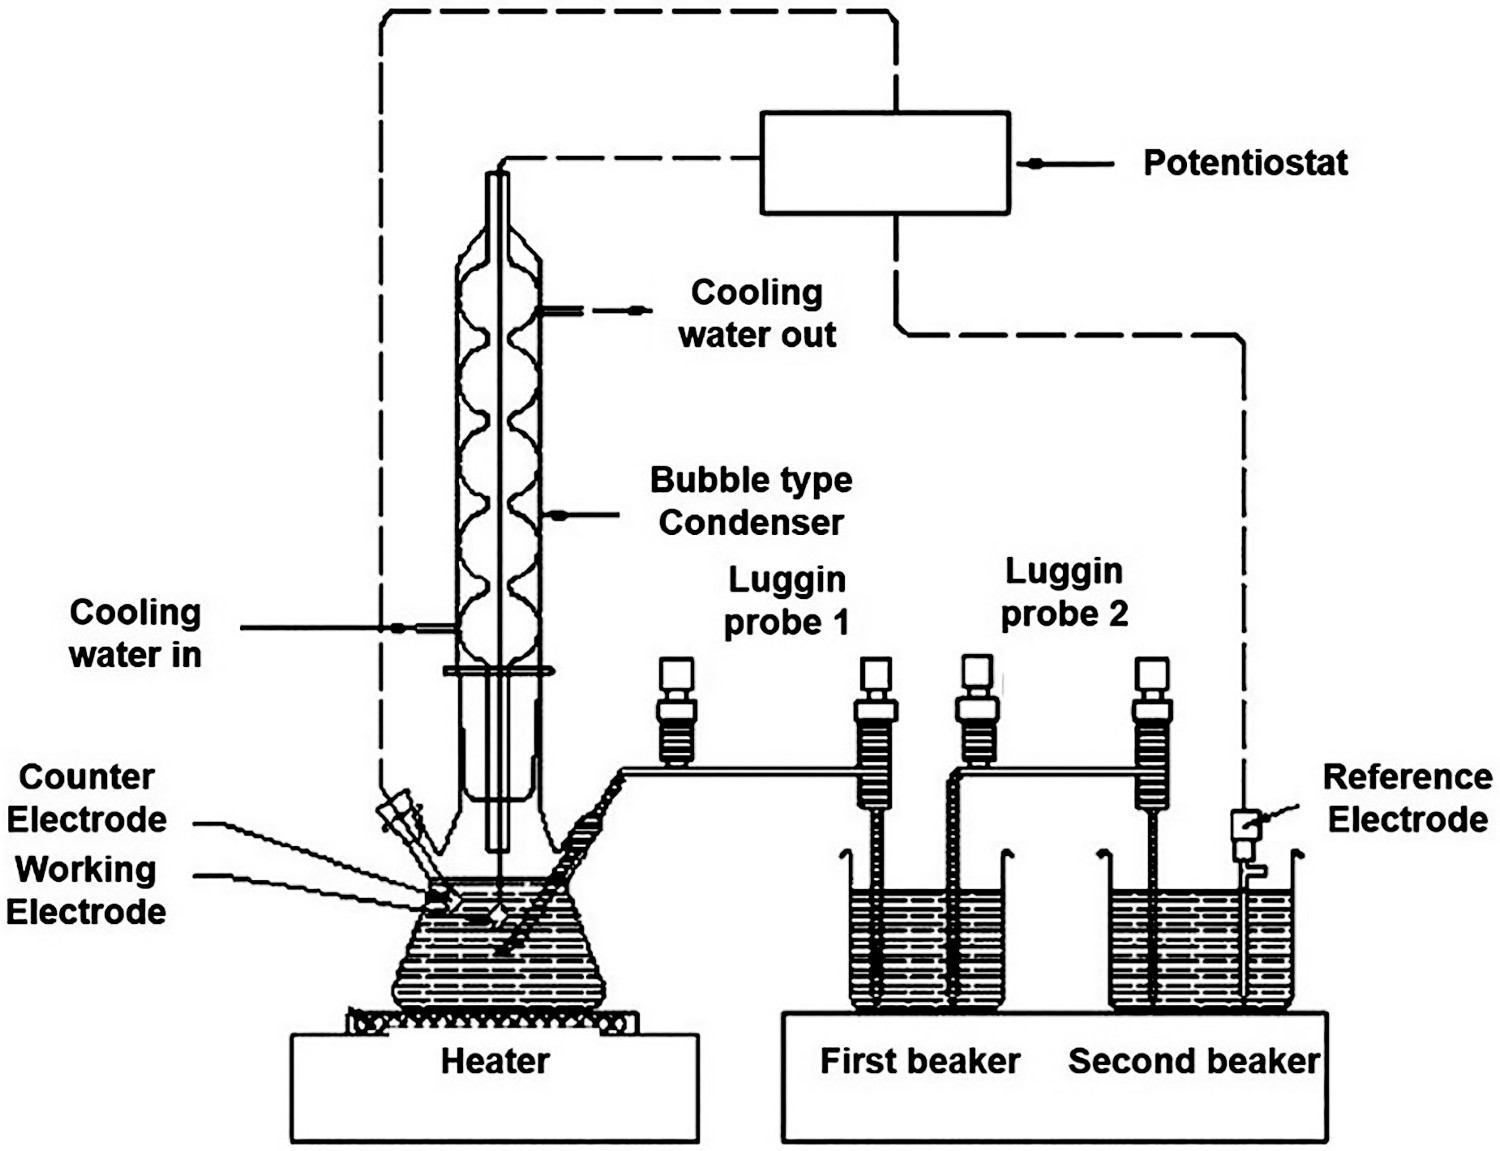
For electrical connection to the working electrode, a 2 mm hole was drilled on one side of the specimen and an SS wire (with an insulation sleeve) was tightened through this hole. Finally, Teflon tape was used to cover the hole. During the experiment, the specimen was immersed in the test solution till about half of its length. All electrochemical tests on LSM specimens were conducted on the as-melted surface, i.e. no surface modification was done after LSM. For the AR specimen, tests were done on the ground surface (ground up to 600 grit emery paper). Before the experiments, the specimens were thoroughly cleaned with acetone to remove any surface contamination.
The corrosion behaviour of specimens was examined using potentiostatic polarisation tests at potentials in the transpassive regime. These potentials were selected based on potentiodynamic polarisation test in 6 M HNO3. Before the potentiodynamic polarisation test, the open circuit potential (OCP) was monitored for its stabilisation. Once the OCP had stabilised, the potential was scanned at a rate of 20 mV min−1 from 200 mV below the OCP to 1050 mVSCE in the transpassive zone. Electrochemical data acquisition was performed using a portable Potentiostat/Galvanostat (Model Bio-Logic SP 150). Based on the potentiodynamic polarisation curve obtained, five distinct potentials of 900, 960, 975, 990 and 1000 mVSCE were selected near the transpassive region for potentiostatic polarisation tests. The potentiostatic polarisation for each specimen was performed for 48 h followed by the measurement of its weight change. From the weight loss, corrosion rate was calculated by using equation 1:

Pitting corrosion test at room temperature
To assess the susceptibility to pitting corrosion, potentiodynamic polarisation test was performed in 3.5 wt-% NaCl solution at room temperature using a conventional three electrode electrochemical cell. In this case, an SS wire was spot welded at a corner of the specimen for electrical conductivity and was mounted in a cold setting epoxy resin. Subsequently, it was polished up to a finish of 1 µm. For deaeration of the test solution, it was continuously purged with high purity argon gas for 1 h before starting the experiment and was continued during the experiment. The potentiodynamic polarisation was started after achieving a steady OCP. The potential was scanned from 200 mV below OCP up to a potential where the measured current density was nearly 1 mA cm−2. The scan rate was kept at 20 mV min−1. For each specimen, the experiment was repeated for three times.
Surface examination after electrochemical tests
After potentiostatic polarisations in 6 M HNO3, the exposed specimens were thoroughly cleaned and examined for any corrosion attack using a SEM. The depth of corrosion attack was measured with a noncontact 3-D optical profilometer. The pit morphology after the electrochemical test in 3.5 wt-% NaCl was examined under the optical microscope and the non-contact 3-D optical profilometry was utilised to measure the pit depth.
Results
Microstructure, hardness and surface roughness
The optical micrograph in Figure 2 shows the microstructure of AR 304L SS. The microstructure consists of equiaxed grains of austenite phase with a ‘step’ microstructure without any sensitisation [36].
Optical micrograph of AR 304L SS after electrolytic etching in 10% oxalic acid.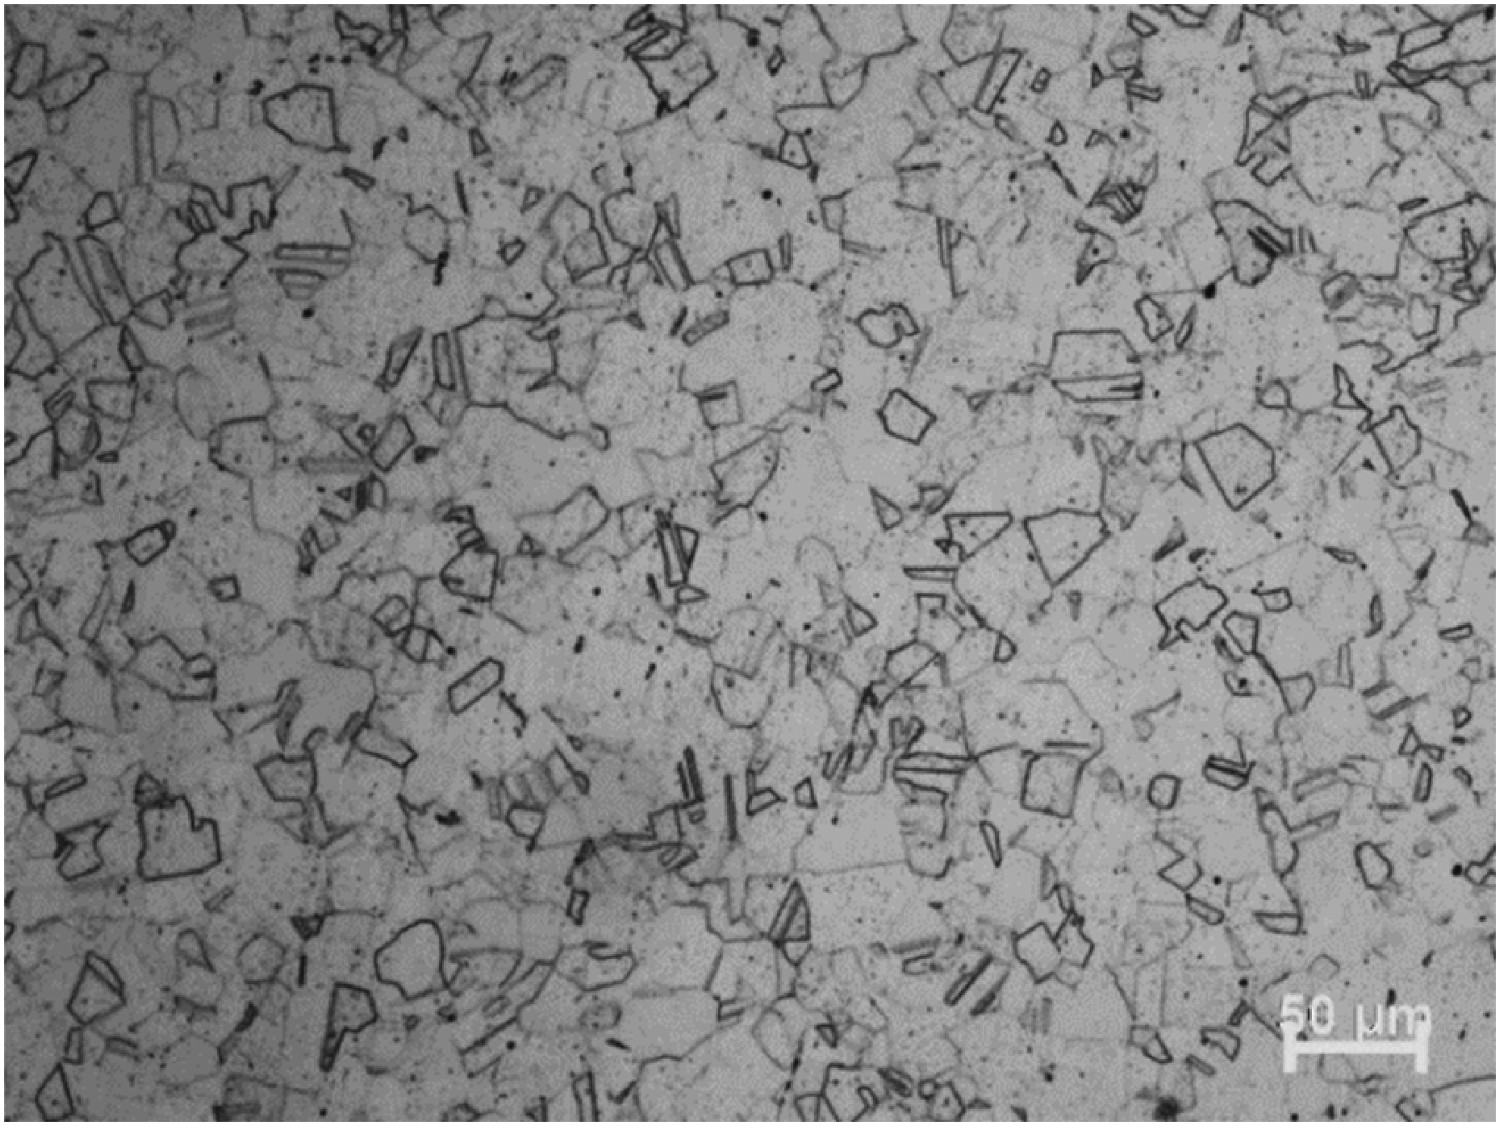
Figure 3 displays the optical micrographs of the cross-section and surface of the LSM specimen. The micrographs at the top and the bottom surface at a same location of the cross-section of the specimen are presented in Figure 3(a,b), respectively. The average depth of the laser-melted region was 250 µm. In contrast to the equiaxed grains in the base metal beneath, the microstructure in the laser-melted zone was made up of elongated grains that were predominantly extended towards the surface. Figure 3(c) represents the microstructure of the LSM specimen surface. In this case also, the elongated grain structure is observed in the melted layer. The grain structure in the laser-melted layer was reoriented as a result of fast solidification after LSM.
Optical micrograph of the LSM specimen (a), (b) the cross-section from top and bottom surface, respectively, (c) the surface.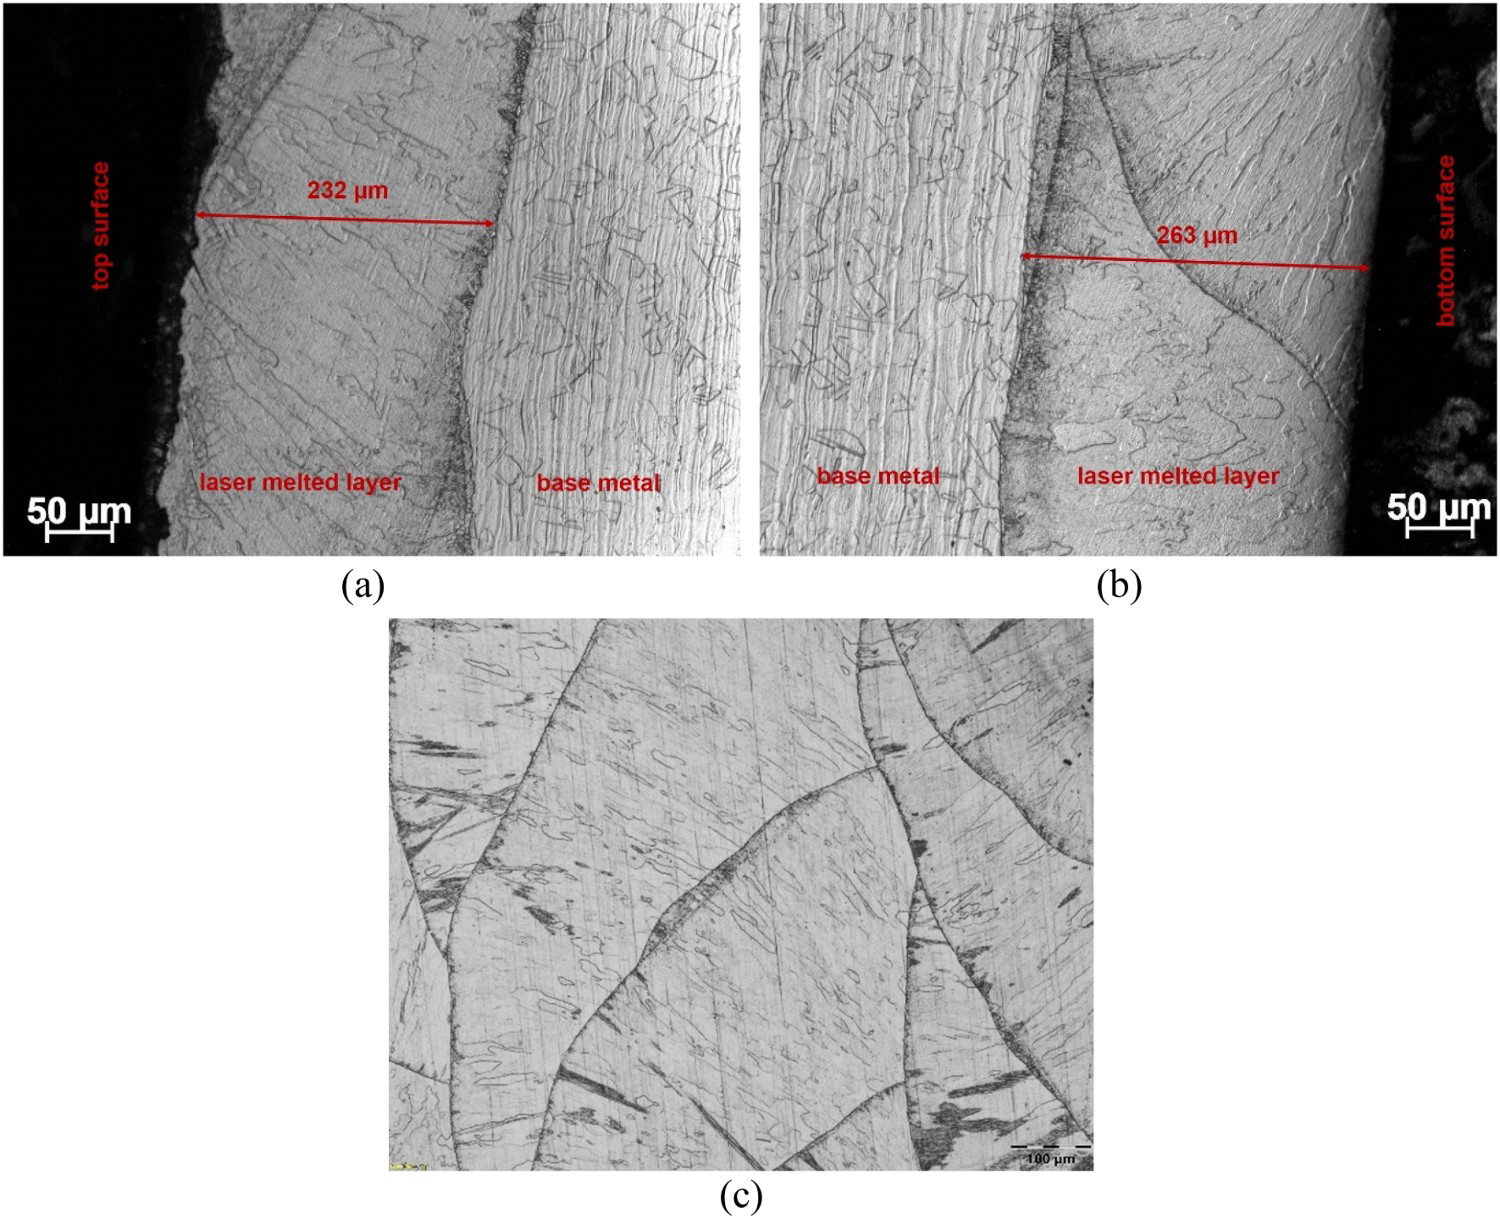
The average Vickers hardness measured on the surface of AR and LSM specimens were 180 and 190 HV0.3, respectively. This small increase in the hardness of SS 304L after LSM is not very noteworthy. Figure 4(a) displays the hardness (measured at a lower load of 10 gf) as a function of depth from the surfaces of both AR and LSM specimens. There is no discernible variation in hardness values with depth for both the specimens. In addition, the hardness values of the laser-melted layer (i.e. up to 250 µm in depth) are comparable to the underlying base metal or the AR specimen. It is to be noted that due to extremely localised indentation measured at a low load of 10 gf, the hardness value, does not reflect the true hardness. However, these hardness data (Figure 4(a)) are useful for comparing the hardness of the laser-melted layer and the base metal which shows that the LSM did not result in any appreciable hardness change. Figure 4(b) shows typical Vickers hardness indents on the cross-section of the LSM specimen.
(a) Hardness profile with depth as measured on the cross-sections of AR and LSM specimens, (b) optical micrograph of the cross-section of LSM specimen showing the Vickers indentation marks.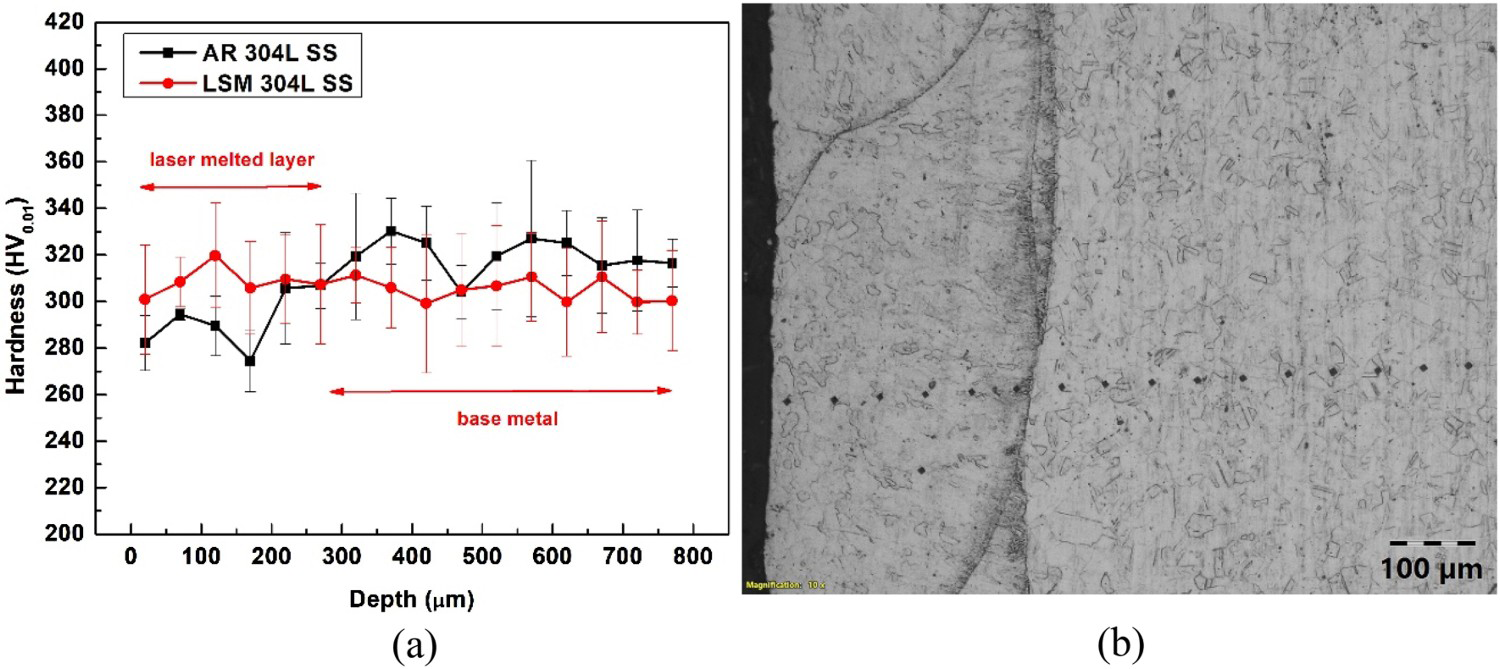
The magnetic phase content as measured by the ferritscope on the surface of LSM specimen was 0.3%. There are two magnetic phases expected in austenitic SSs: δ-ferrite and martensite. However, martensite phase is not expected in the solidified layer. Martensite would undergo reverse transformation into austenite during LSM even if it were present in the base material [9]. Therefore, the magnetic phase in the solidified layer was δ-ferrite. The magnetic phase content of the AR specimen was below the detection limit (0.1%) of the ferritscope.
Figure 5(a) shows the representative 3-D map on the LSM specimen surface, as observed by the 3-D optical profilometer. It depicts the surface topography of the as-melted surface of LSM specimen. It can be clearly seen that there is an overlap of the individual laser spots. This indicates that the metal surface during LSM was scanned by the laser beam in a raster, row by row, with overlaps of the individual melted spots. It is also evident that each laser spot has peaks at the edges and a considerably smaller height at the centre. The S a value was 3.5 μm. Figure 5(b) displays the 2D line profile corresponding to the black line marked in Figure 5(a). The line scan reveals a waviness with a periodicity close to 600 μm. Additionally, it is clear from Figure 5(a,b) that the height at the periphery of each spot was comparatively higher than that at the centre of the spot. When the SS surface is melted with laser, the surface temperature of the steel becomes more than the vaporisation temperature of the material which causes the ejection of matter through vapour plume from the surface. This causes liquid to move towards the edges of the laser spot where it solidifies almost immediately due to very high cooling rate forming circular rings [9]. In the present case, due to the presence of overlap in the subsequent laser spots, only a part of the circular ring morphology at each spot can be visualised.
3D optical profilometry of the laser-melted surface of the LSM specimen. (a) 3D map showing the surface topography and laser-melted tracks with overlap, (b) 2-D line profile across the black line marked on (a), demonstrating the waviness.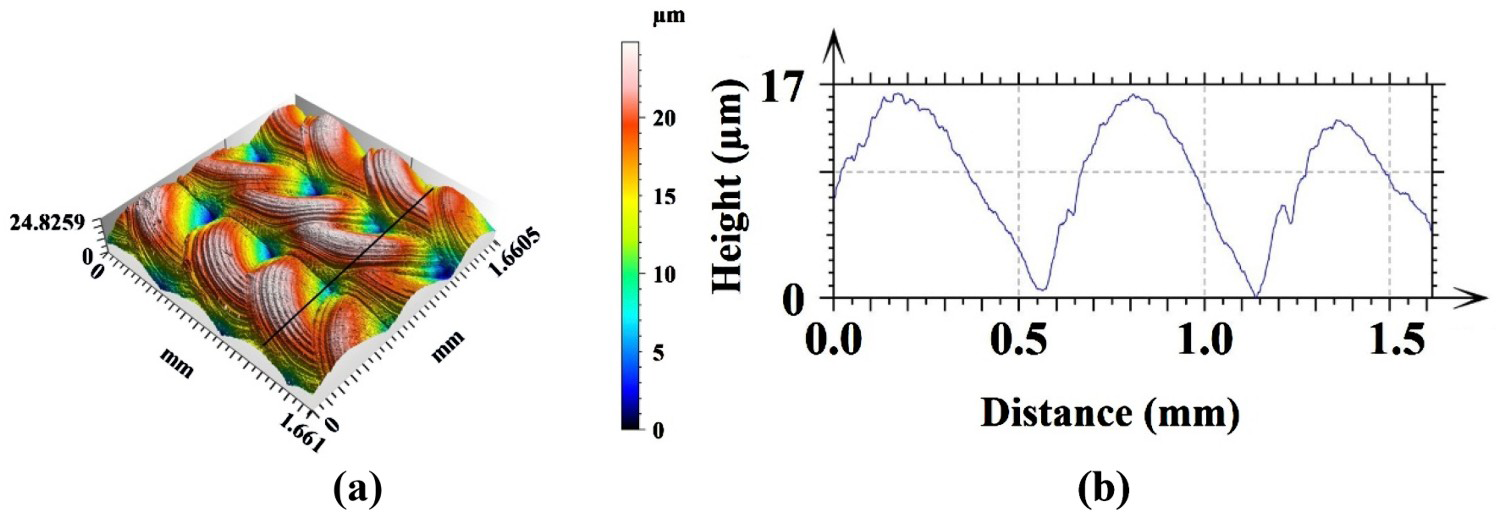
Chemical composition analysis of the inclusions
The microstructural examination of the AR material revealed elongated inclusions that were aligned along the working direction. This is illustrated in the optical micrographs (Figure 6) of the cross-section of the LSM specimen in the as-polished condition. The elongated inclusions are clearly seen (indicated by red arrows) in the underlying base metal (Figure 6(a)). Figure 6(b) represents the microstructure close to the surface of the LSM specimen. The laser-melted region (upto ∼ 250 µm depth from the surface, marked in Figure 6(b)) in the as-polished condition does not show such inclusions in the microstructure. However, elongated inclusions are visible in the base metal just below the laser-melted layer as indicated by red arrows in Figure 6(b).
Optical micrographs of the cross-section of the LSM specimen in the as-polished condition, (a) the underneath base metal showing elongated inclusions; (b) the laser-melted region near the surface. The inclusions are indicated by red arrows.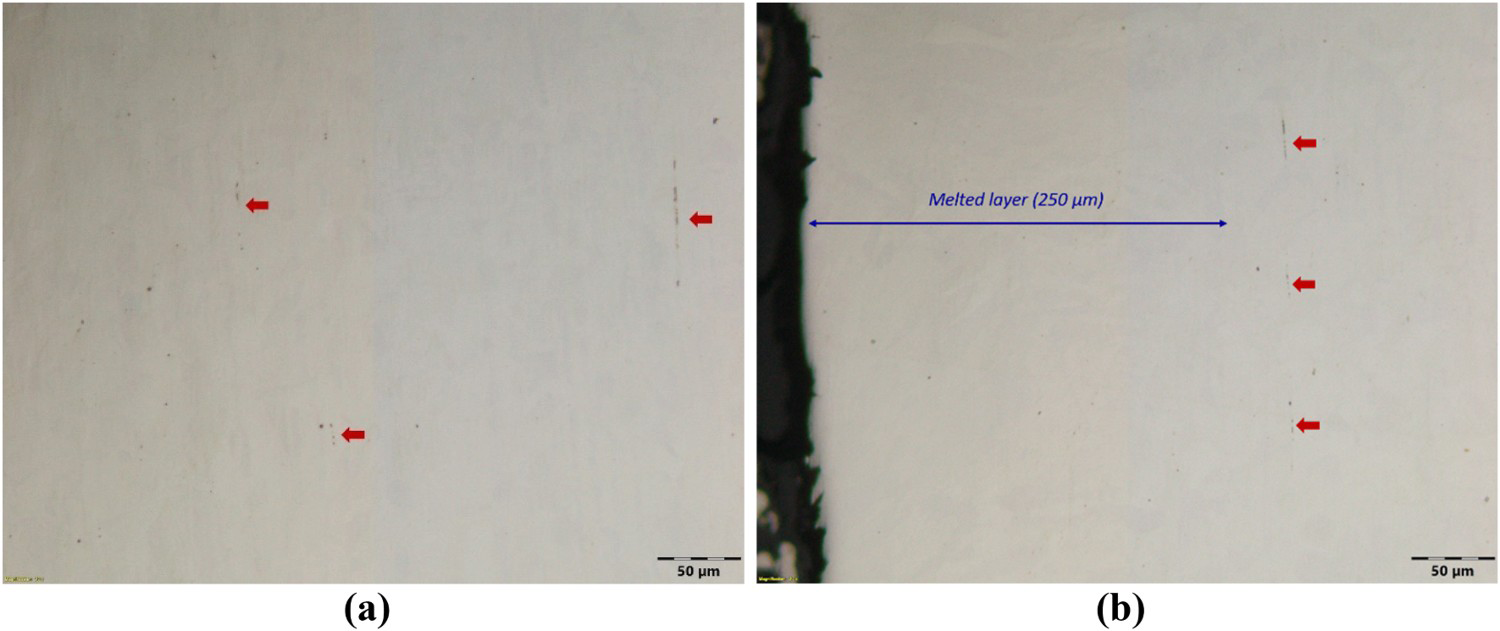
The inclusions in the base metal were further examined using the SEM-EDS. Two types of inclusions were detected: oxide and sulphide types. The oxide-type inclusions were mostly globular, whereas the sulphide-type inclusions were elongated (stringer form). These findings are illustrated in Figure 7 by displaying both the globular and stringer-type inclusions in the microstructure. Figure 7(a) shows the X-ray maps of Fe, Cr, Ni, Mn, S and O for the inclusions. The stringer-type inclusion is rich in Mn and S and depleted in Fe, Ni and Cr. The globular types are rich in Mn, Cr and O and depleted in Fe and Ni. Point EDS was also performed on different parts of the inclusion as marked in Figure 7(b), and their spectra are shown in Figure 7(c–f). The point EDS spectrum corresponding to the matrix is displayed in Figure 7(g), and it conforms to the standard composition of 304 type of SS. Spectra 1 and 2 correspond to the stringer-type inclusion, which depict very high Mn and S contents as compared to the base metal (Figure 7(g)). This indicates that the stringer-type inclusions are MnS type. Spectra 3 and 4 correspond to the globular part of the inclusion showing high contents of Mn, Cr, O and S compared to the base metal (Figure 7(g)). This is indicative of oxide-type inclusions.
SEM-EDS analysis of inclusions in the underlying base metal of the LSM specimen: (a) X-ray area map of different elements at the inclusion, (b) SEM micrograph showing the inclusions and marked with point EDS spectra. (c–f) Spectra 1-4 along with the elemental compositions in at.-% at the inclusions, (g) spectrum 5 along with the elemental composition (at.-%) of the matrix.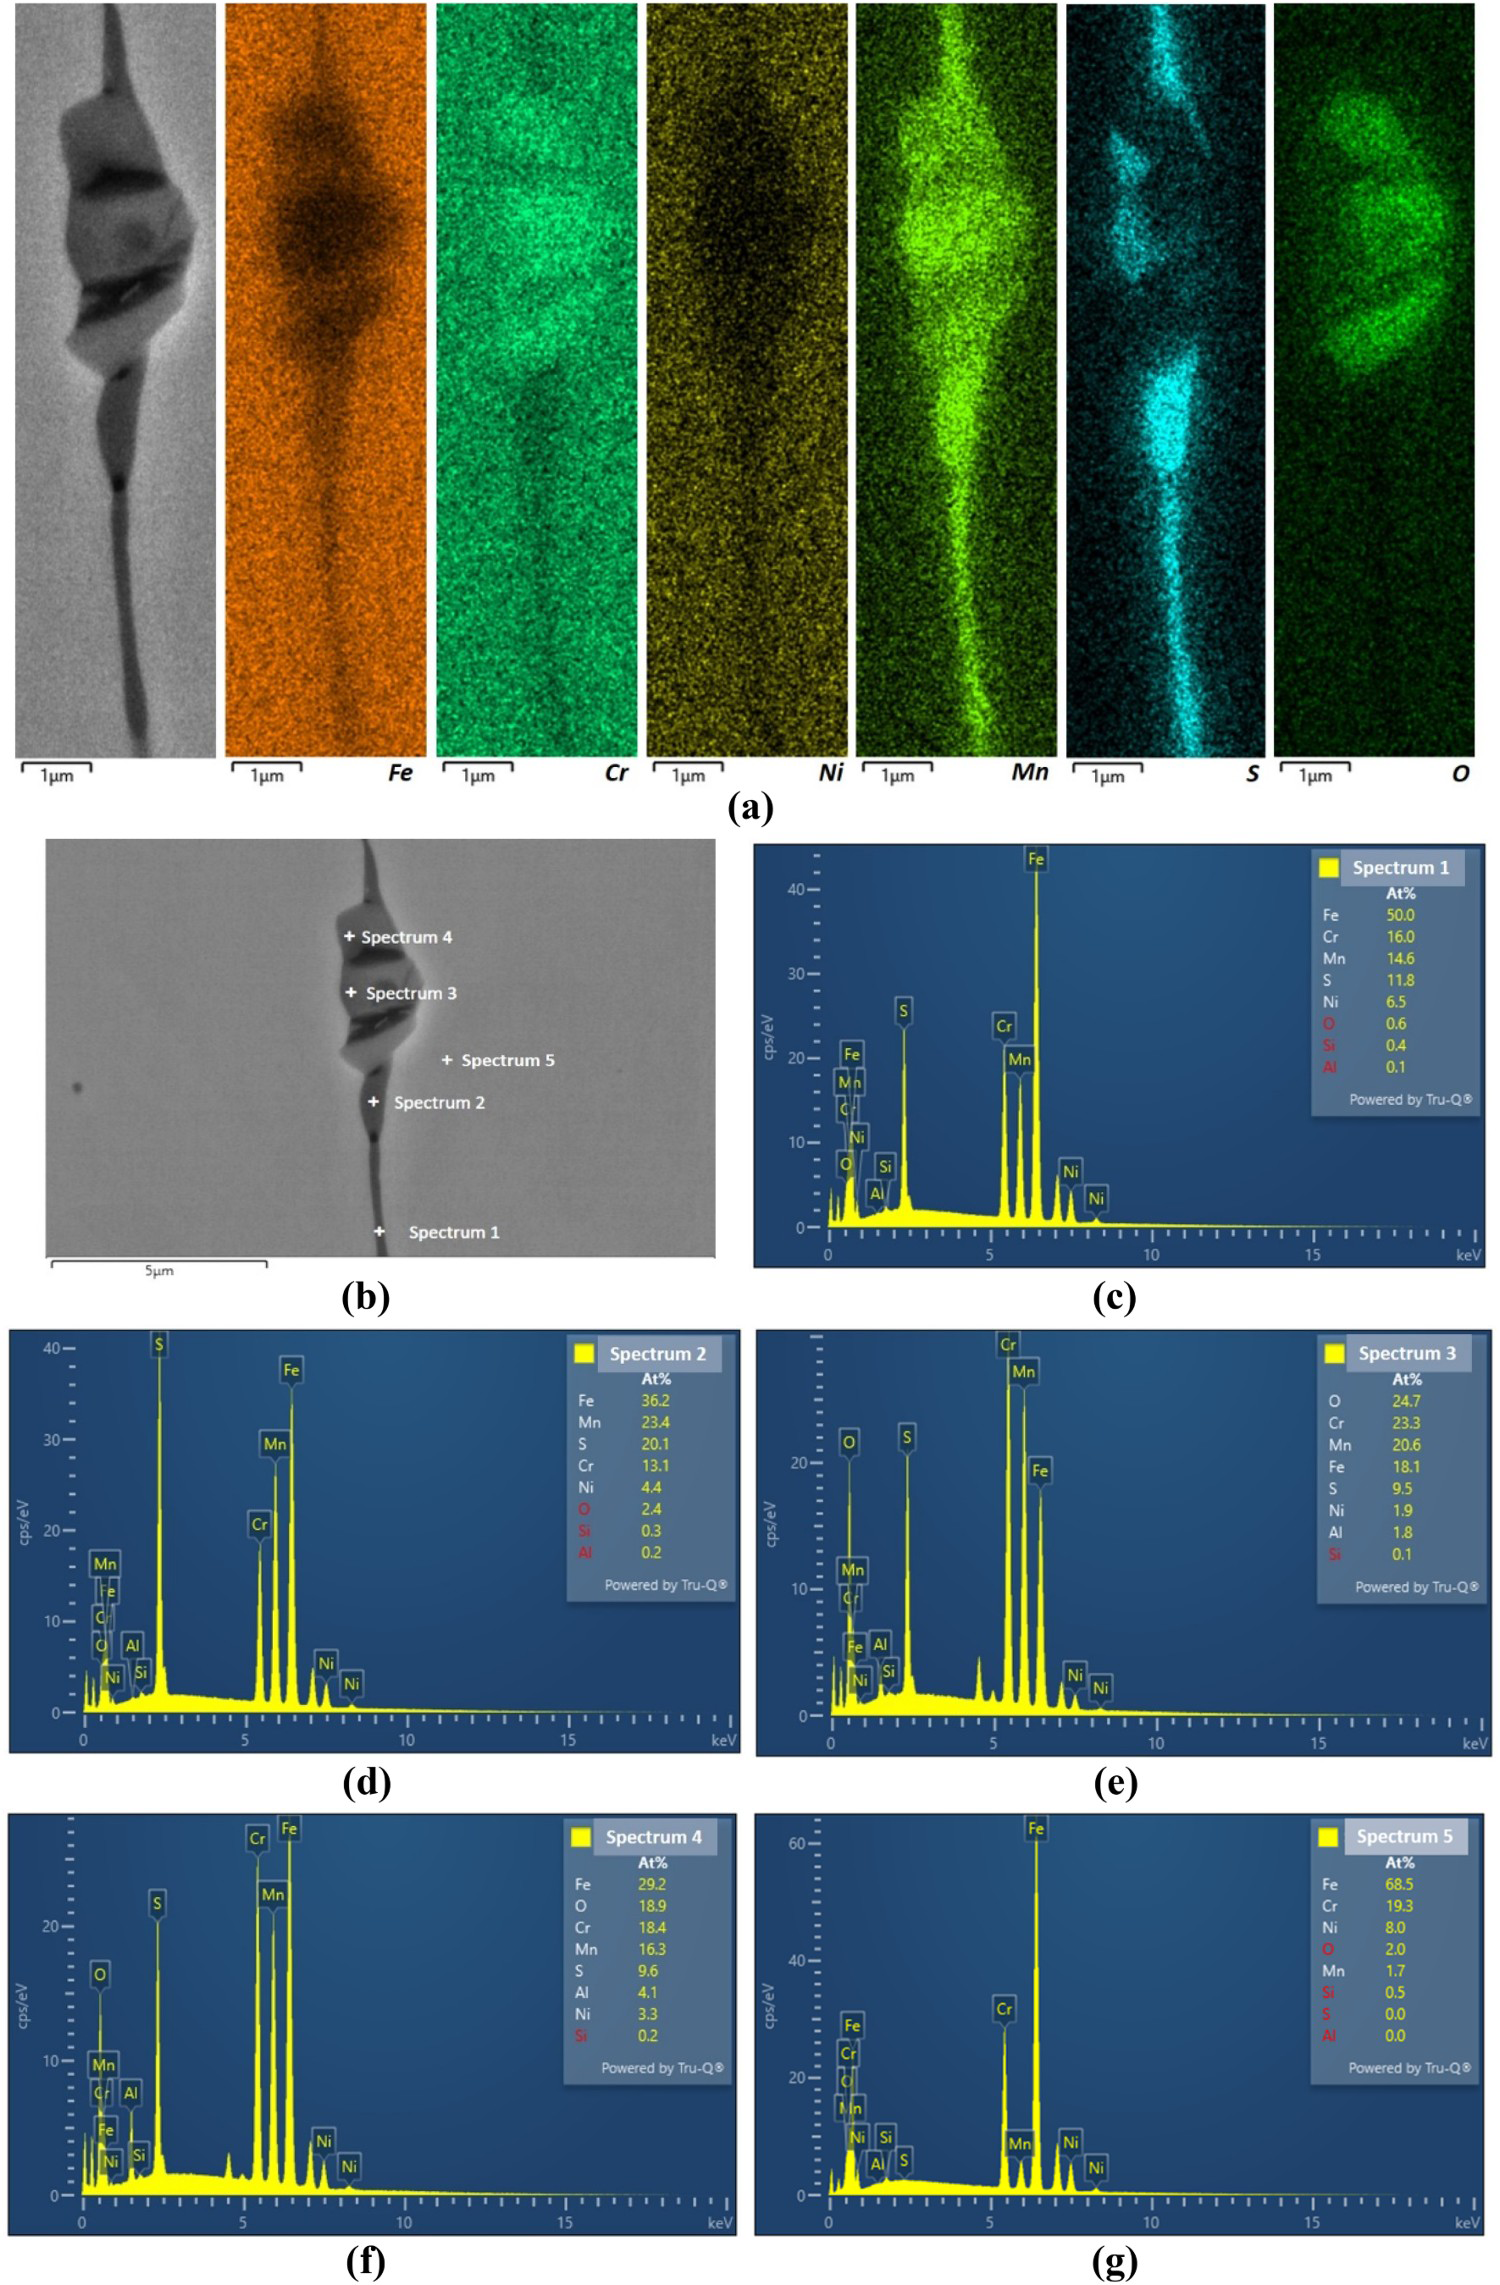
Electrochemical tests
Transpassive dissolution in 6 M HNO
3
The applied potential vs current density graphs obtained from potentiodynamic polarisation of AR and LSM specimens in 6 M HNO3 at 95°C are shown in Figure 8. It is clear from Figure 8 that the corrosion potential for LSM specimen shifted to a more anodic (positive) value (745 mVSCE) in comparison to the AR specimen (545 mVSCE). The transpassive potential for both the specimens was 920 mV. In the passive potential range, the current density of the LSM specimen was marginally lower than that of the AR specimen. Additionally, the LSM specimen has a lower current density than the AR specimen in the transpassive region.
Potentiodynamic polarisation curves of AR and LSM 304L SS in 6 M HNO3 at 95°C.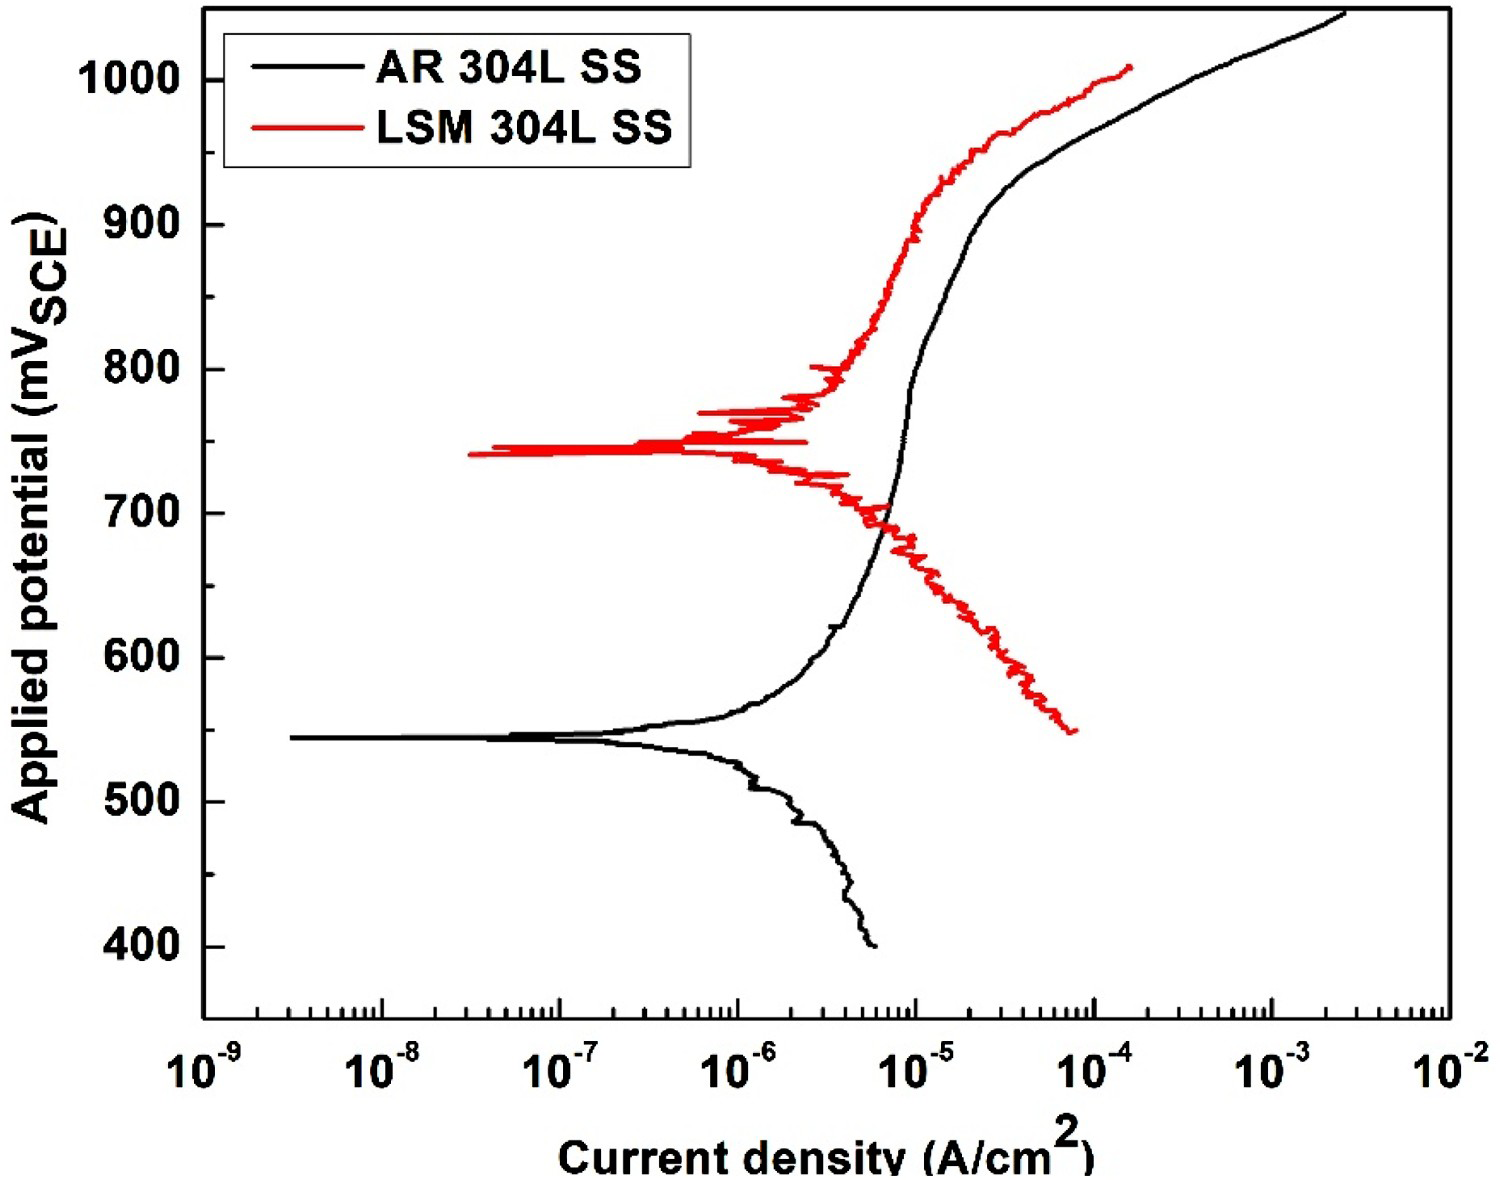
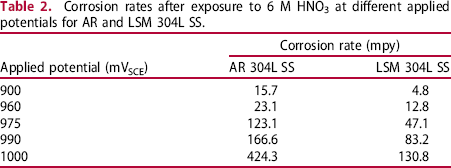
Corrosion rates after exposure to 6 M HNO3 at different applied potentials for AR and LSM 304L SS.
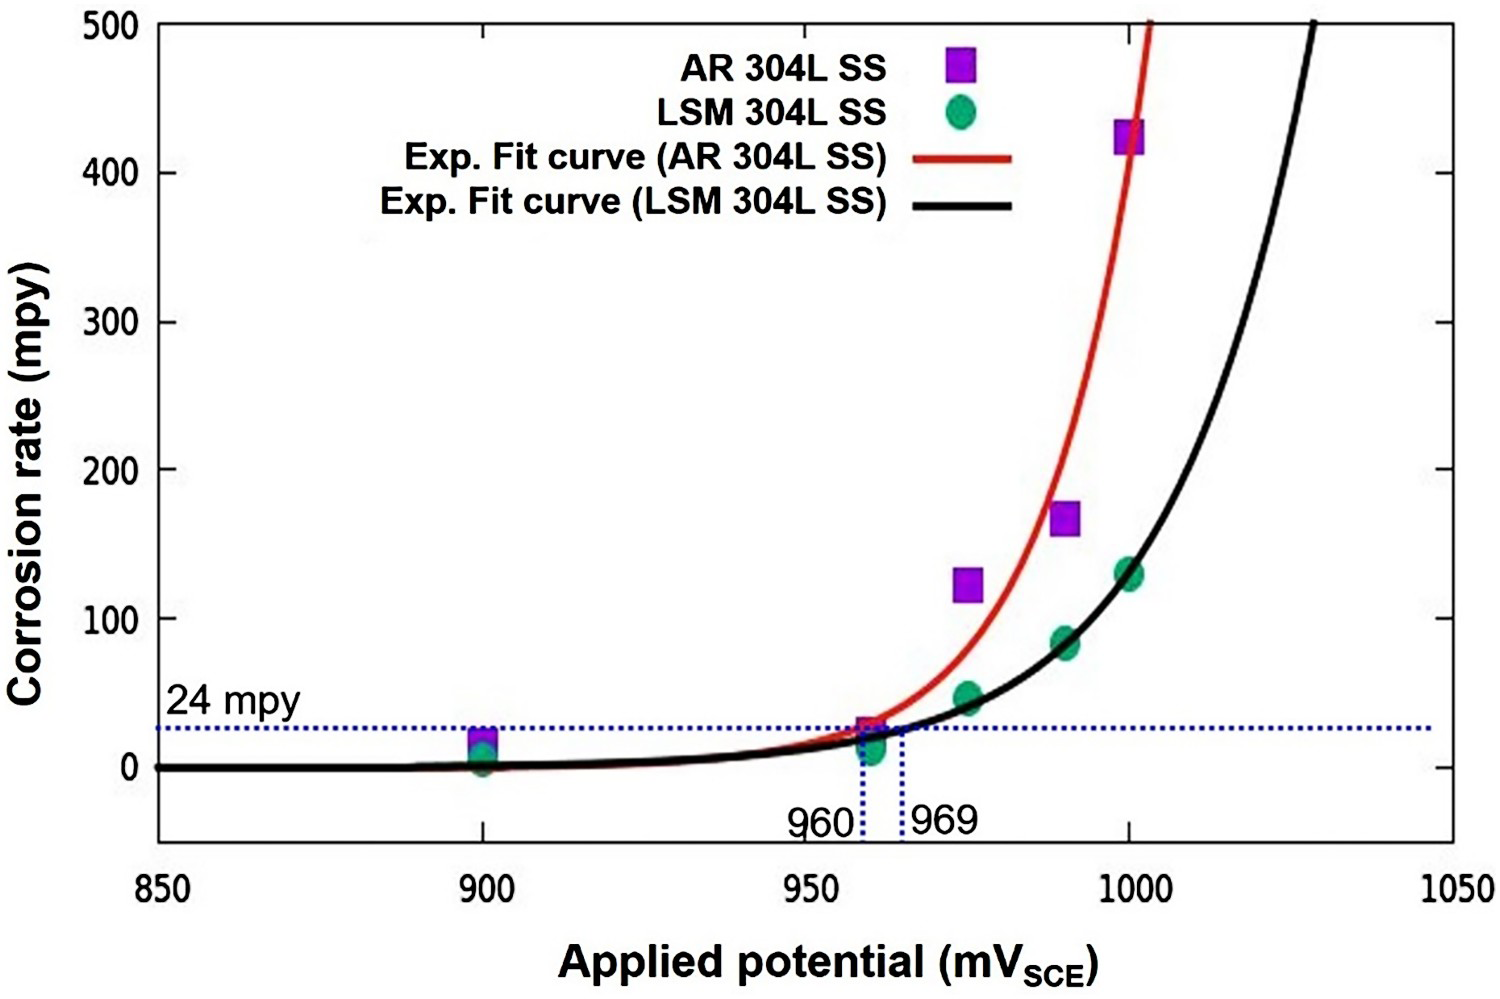
For both the AR and LSM specimens, the corrosion rates observed following potentiostatic polarisations as a function of various applied potentials were plotted and are displayed in Figure 9. According to Figure 9, the corrosion rates for both specimens increased exponentialy with potential. An exponential function, CR = A exp(E/B) was fitted to estimate the parameters A and B, where CR is the corrosion rate and E is the applied potential in mV (vs SCE). The exponential functions with estimated fitting parameters for AR and LSM specimens are represented by the following equations, respectively.
Corrosion rates measured after potentiostatic polarisations as a function of applied potential for AR and LSM specimens along with exponential fit curves.

Pitting corrosion test in 3.5 wt-% NaCl
Figure 10 is the representative potentiodynamic polarisation curves of AR and LSM 304L SS in 3.5 wt-% NaCl. Both the specimens showed spontaneous passivation with comparable current densities in the passive range of potentials. After the passive range, a sharp increase in current density is observed for both the specimens (Figure 10). This is due to pit formation on the specimen surface. The potential after which the rapid increase in current density is observed is termed as pitting potential (E pit). The average pitting potential of the AR specimen was 317 ± 68 mVSCE, which increased to 474 ± 88 mVSCE for the LSM specimen. LSM thus resulted in an increase in the passive range. Moreover, in the case of the AR specimen, some current transients just below the pitting potential, typical of metastable pitting (pit initiation followed by repassivation), are also observed. Such metastable pit formation is not seen in the LSM specimen (Figure 10).
Potentiodynamic polarisation curves of AR and LSM 304L SS in 3.5 wt-% NaCl solution.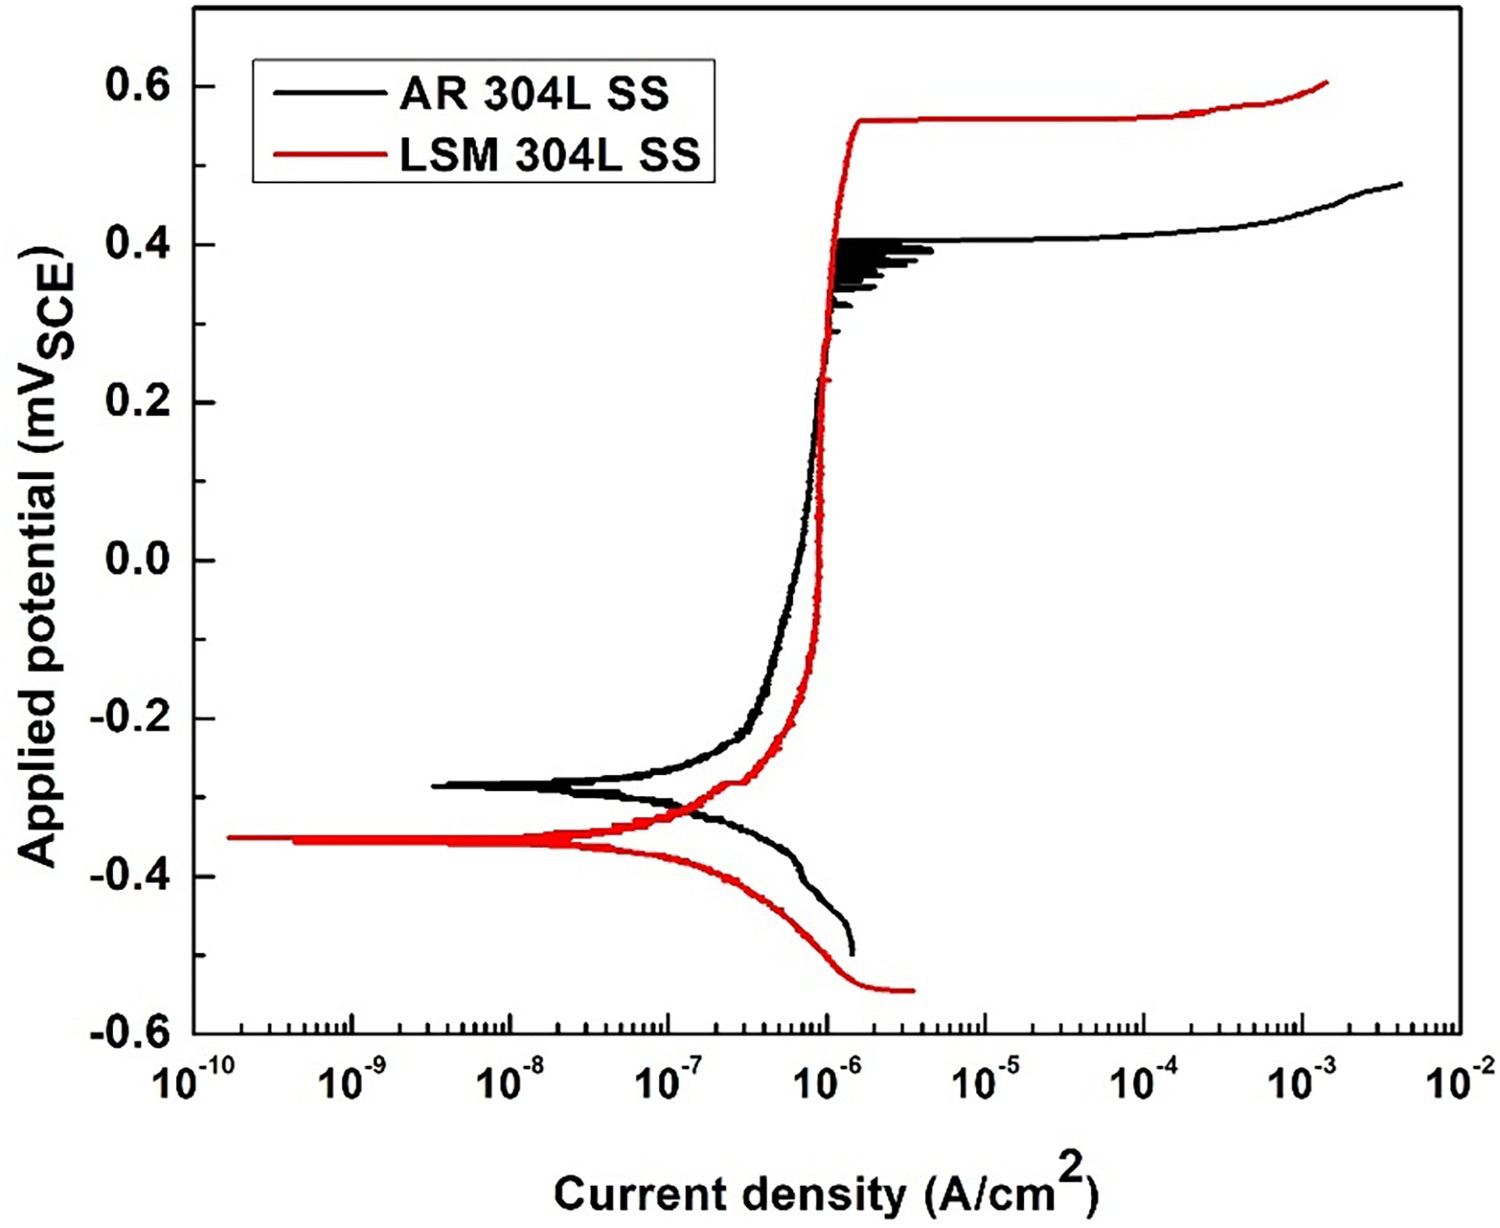
Examination of exposed surfaces after electrochemical tests
Surface appearance after transpassive dissolution
Figure 11 compares the surface appearance of AR and LSM specimens after potentiostatic polarisations at different potentials, as observed by the SEM. Both the AR and LSM specimens undergo IGC attack during potentiostatic polarisation. At lower potentials of 900 mVSCE (Figure 11(a) and 960 mVSCE (Figure 11(b)), the extent of IGC attack is small and there is no grain dropping. The surface appearances after potentiostatic polarisations at 975, 990 and 1000 mVSCE, are shown in Figure 11(c–e), respectively. At these three higher potentials, the AR specimen showed severe IGC along with grain dropping. Similarly, LSM specimens also underwent severe grain boundary attack. The extent of IGC attack increased with applied potentials, which is evident in the SEM micrographs (Figure 11). For a given potential, the IGC attack is comparatively less severe in LSM specimen than in AR specimen.
SEM micrographs of the surface after 48 h of potentiostatic polarisation in 6 M HNO3 at various potentials: (a) 900 mVSCE, (b) 960 mVSCE, (c) 975 mVSCE, (d) 990 mVSCE, (e) 1000 mVSCE.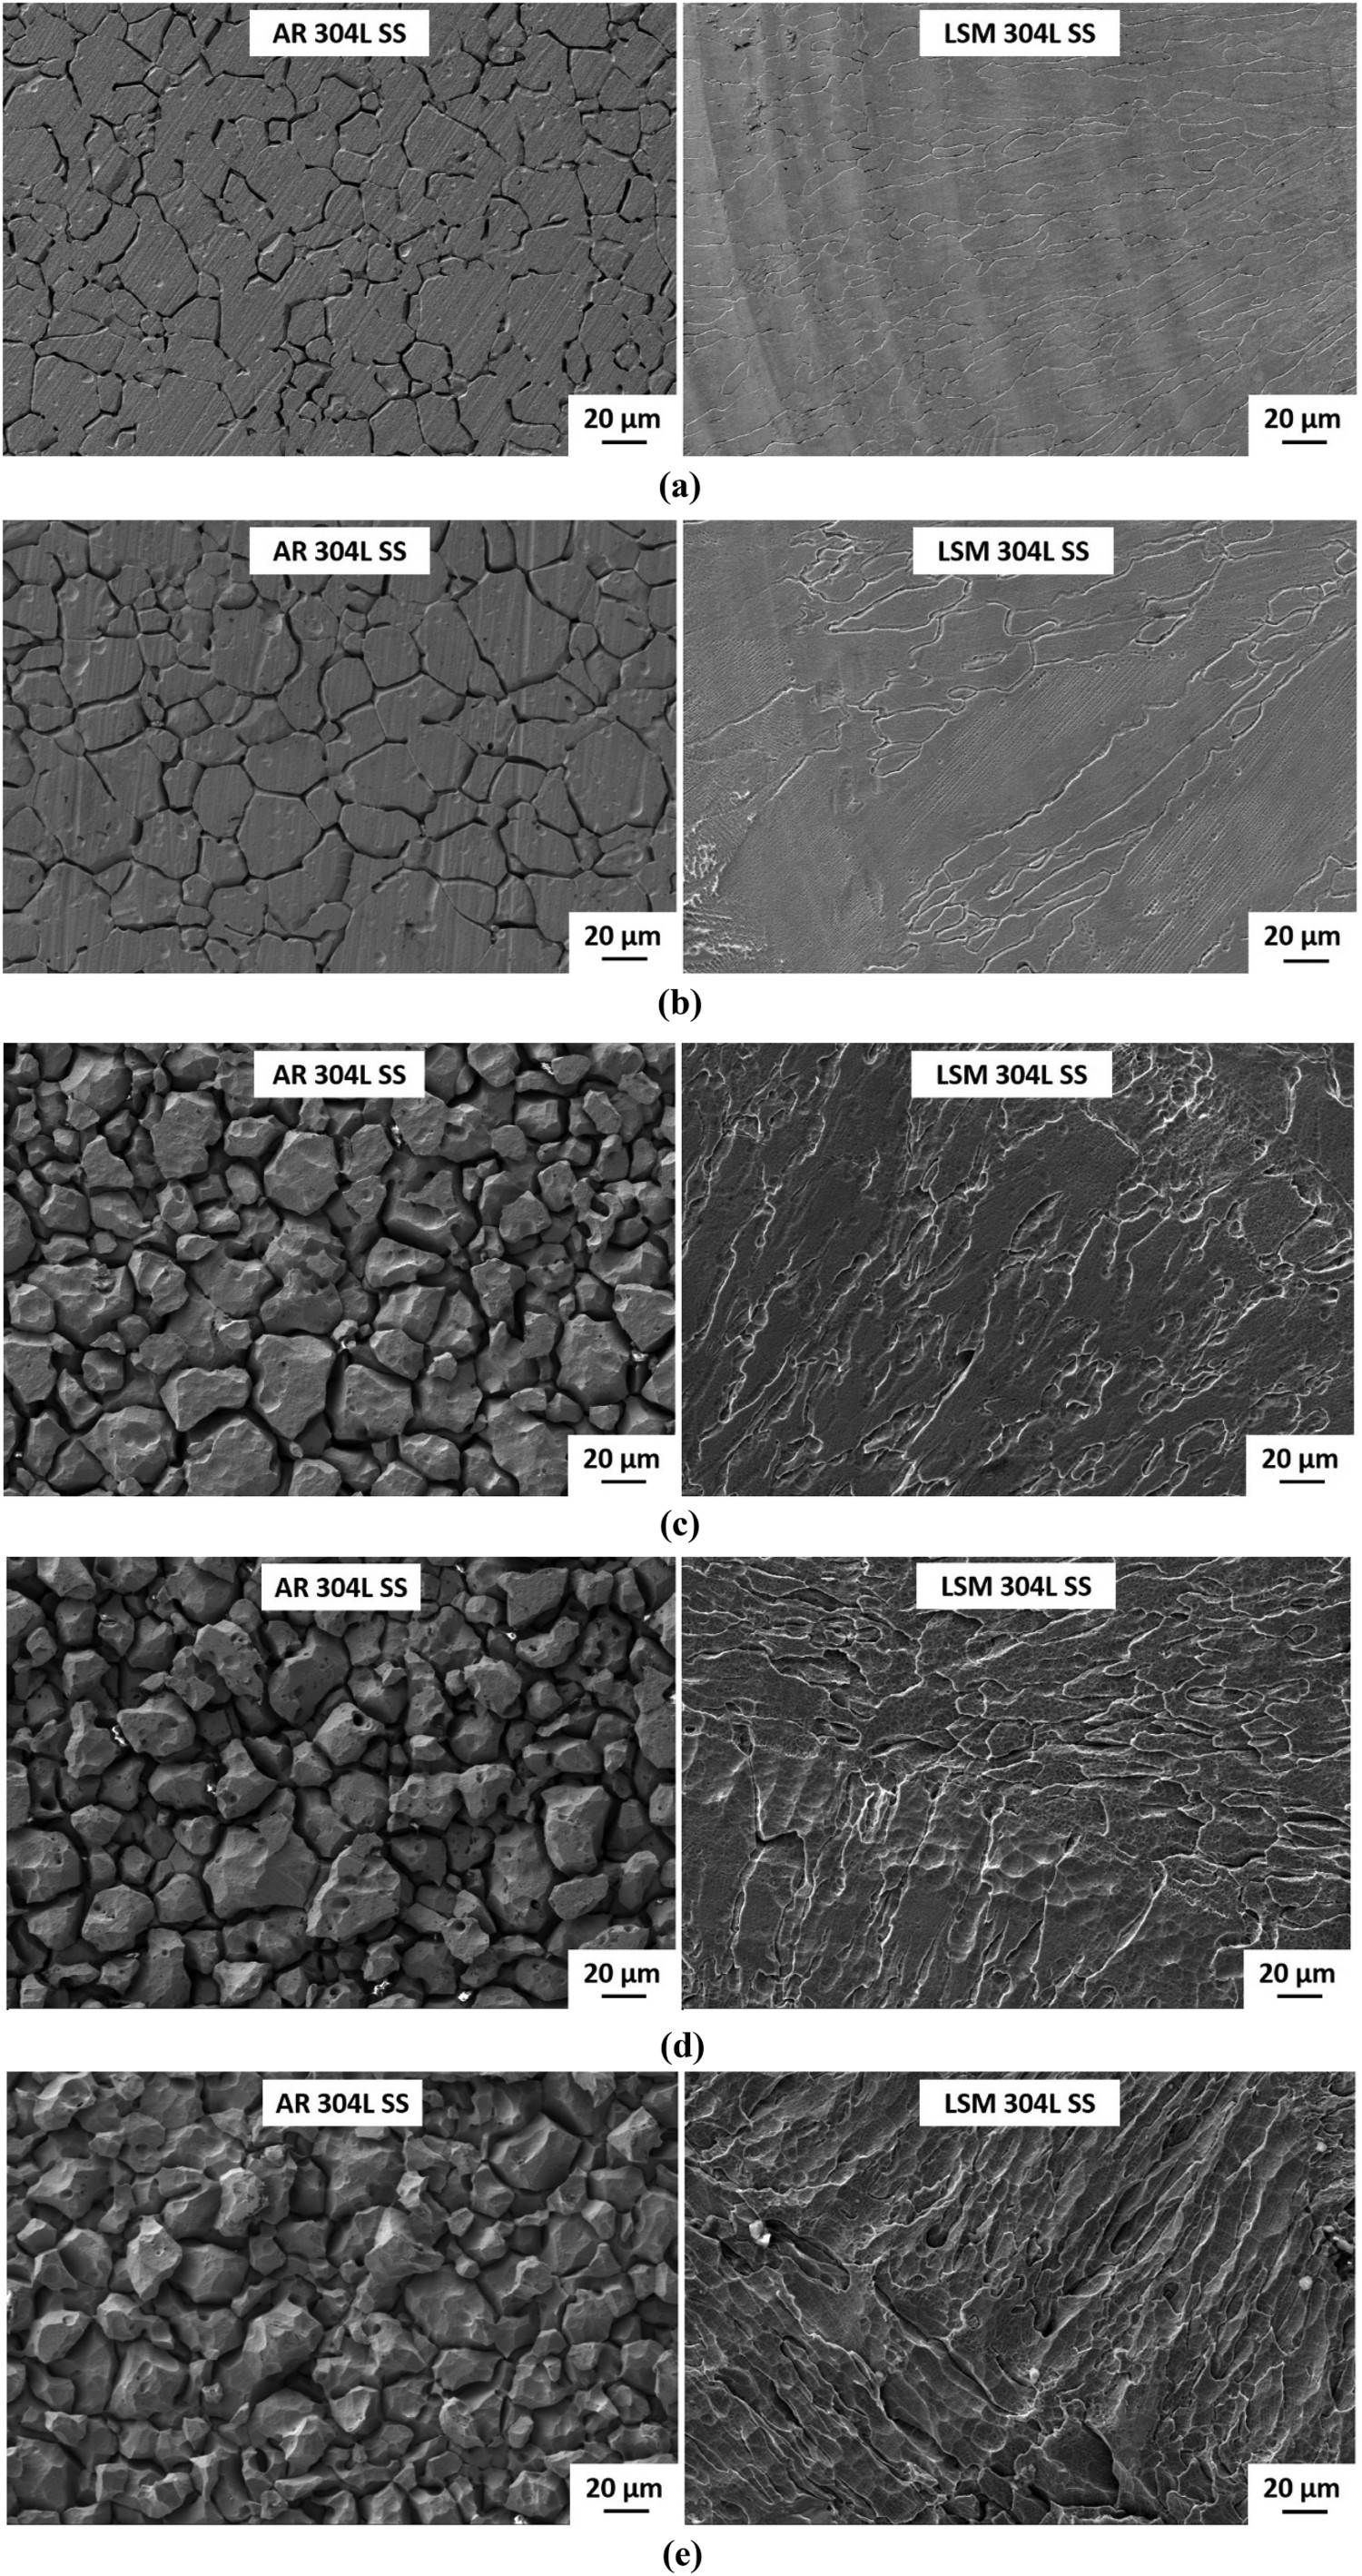
Depth of IGC attack after transpassive dissolution
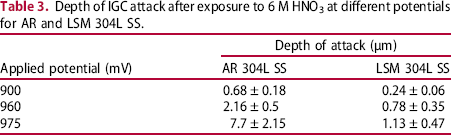
Figure 12(a) shows the representative 3-D map of the exposed surface of AR specimen after potentiostatic polarisation at 900 mVSCE as observed by the 3-D optical surface profilometer IGC attack is clearly visible in this 3-D map. Figure 12(b) displays the line profile corresponding to a black line marked in Figure 12(a). The depth of attack at different grain boundaries is evident in this profile. Similar optical line profiles were also recorded for both AR and LSM specimens when the applied potentials were 900, 960 and 975 mVSCE at multiple locations. The average of these depths at each potential for both specimens are listed in Table 3. The depth of attack is lesser for LSM specimen than the AR specimen at all the three applied potentials. Specimens after potentiostatic polarisations at higher potentials of 990 and 1000 mVSCE showed severe grain dropping and even thickness loss of the specimens. Therefore, the measurement of depth of attack using this technique is not useful because it will not present an accurate picture.
Representative 3-D optical profilometry on the exposed surface of AR 304L SS after potentiostatic polarisation at 900 mV in 6 M HNO3 (a) 3D map showing the IGC attack, (b) a 2-D line profile across the black line marked on (a), showing the depth of attacks at different grain boundaries. Depth of IGC attack after exposure to 6 M HNO3 at different potentials for AR and LSM 304L SS.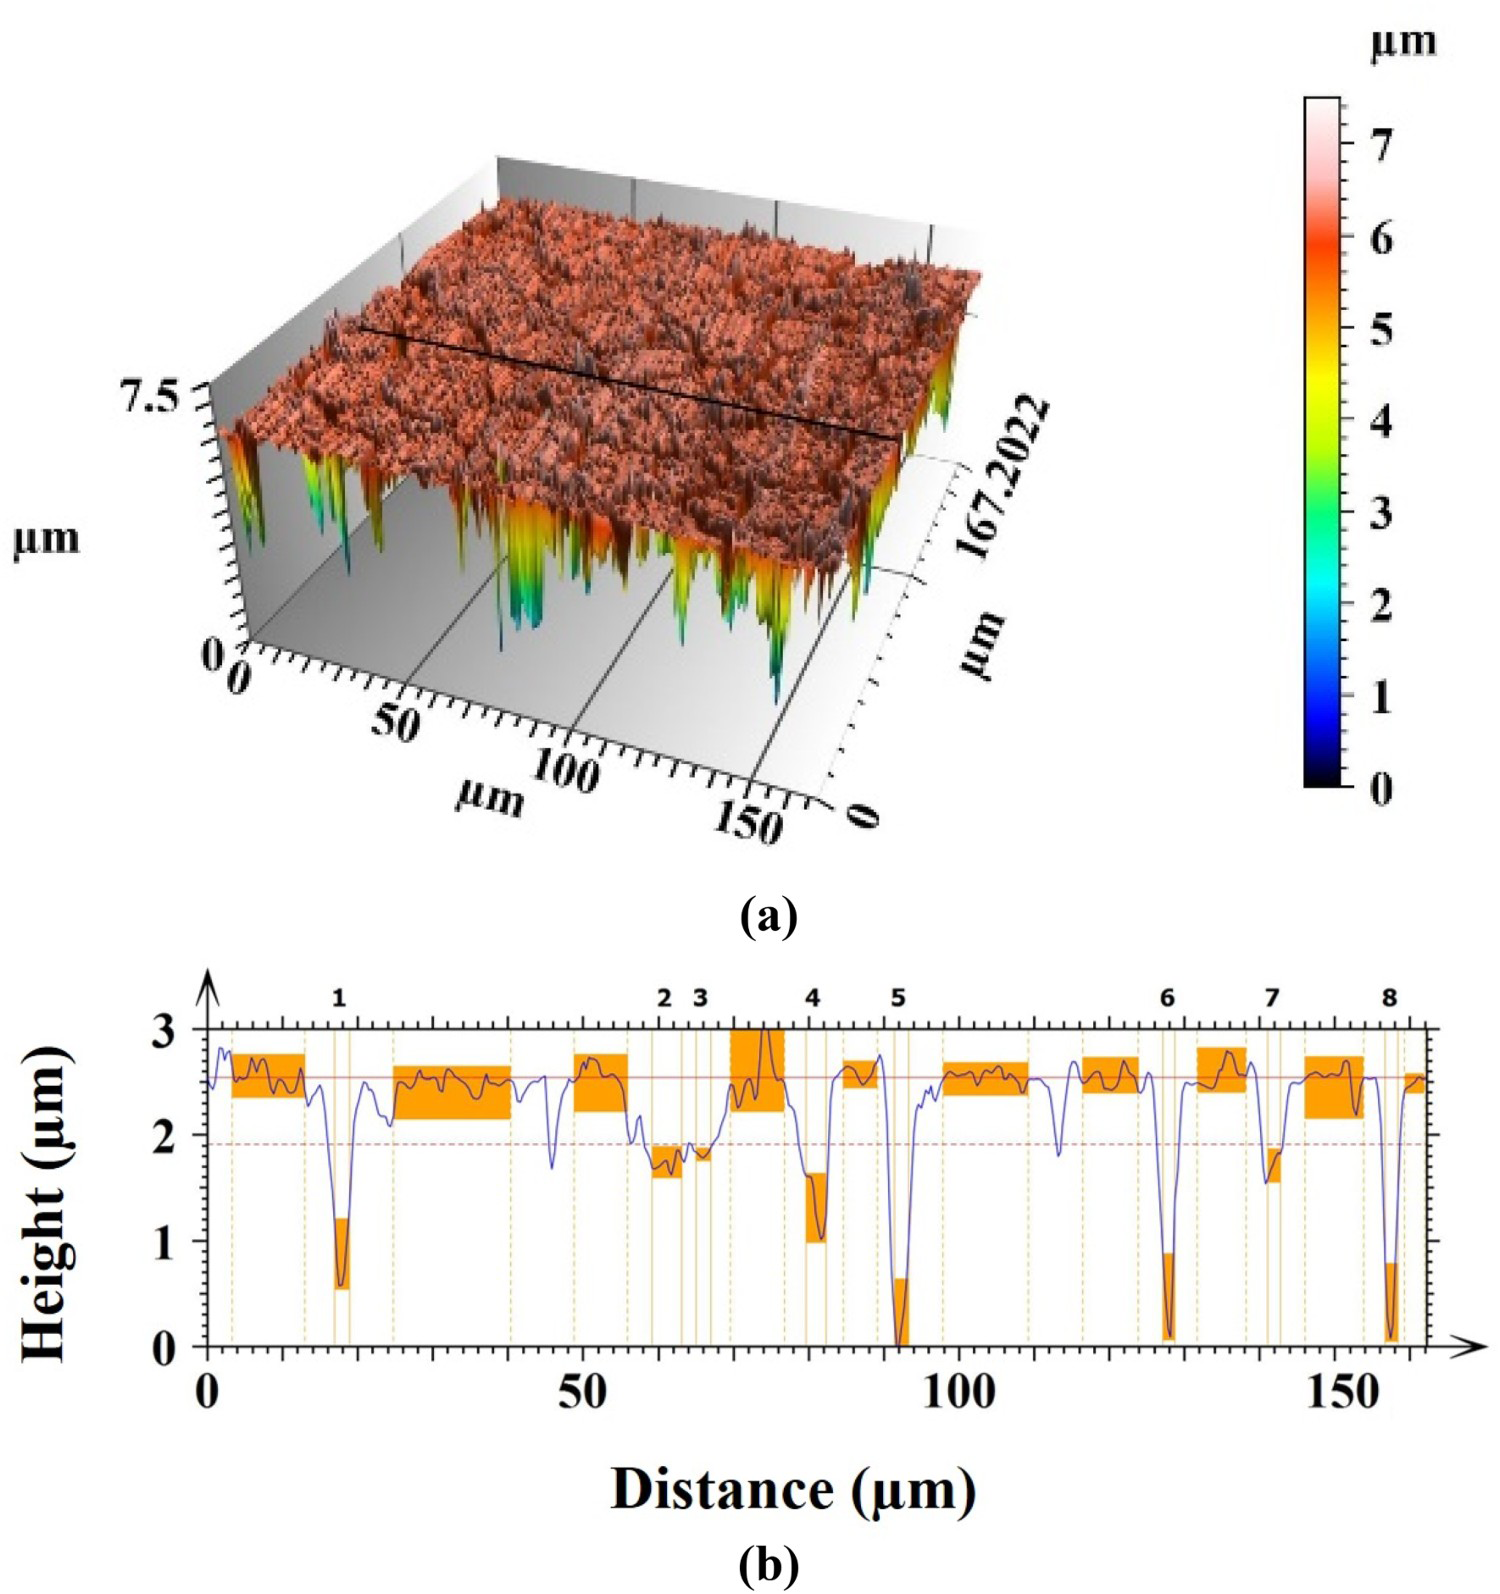
Surface appearance after pitting corrosion
Figure 13(a,b) depicts the representative optical micrographs of the exposed surface of AR 304L SS after potentiodynamic polarisation in 3.5 wt-% NaCl solution at low and high magnifications, respectively. The AR specimen showed several pits of varying size (Figure 13(a)). Figure 13(b) displays one of the larger pits at a higher magnification. In contrast to the AR specimen, the LSM specimen surface contained only one pit, as can be seen in the optical micrograph (Figure 13(c)). Even after repeated experiments, the LSM specimen displayed a maximum of two pits in contrast to the multiple pits observed in the AR specimen.
Optical micrographs of the exposed surfaces of the specimens after potentiodynamic polarisation test in 3.5 wt-% NaCl (a) AR 304L SS, lower magnification, (b) AR 304L SS, higher magnification, (c) LSM 304L SS.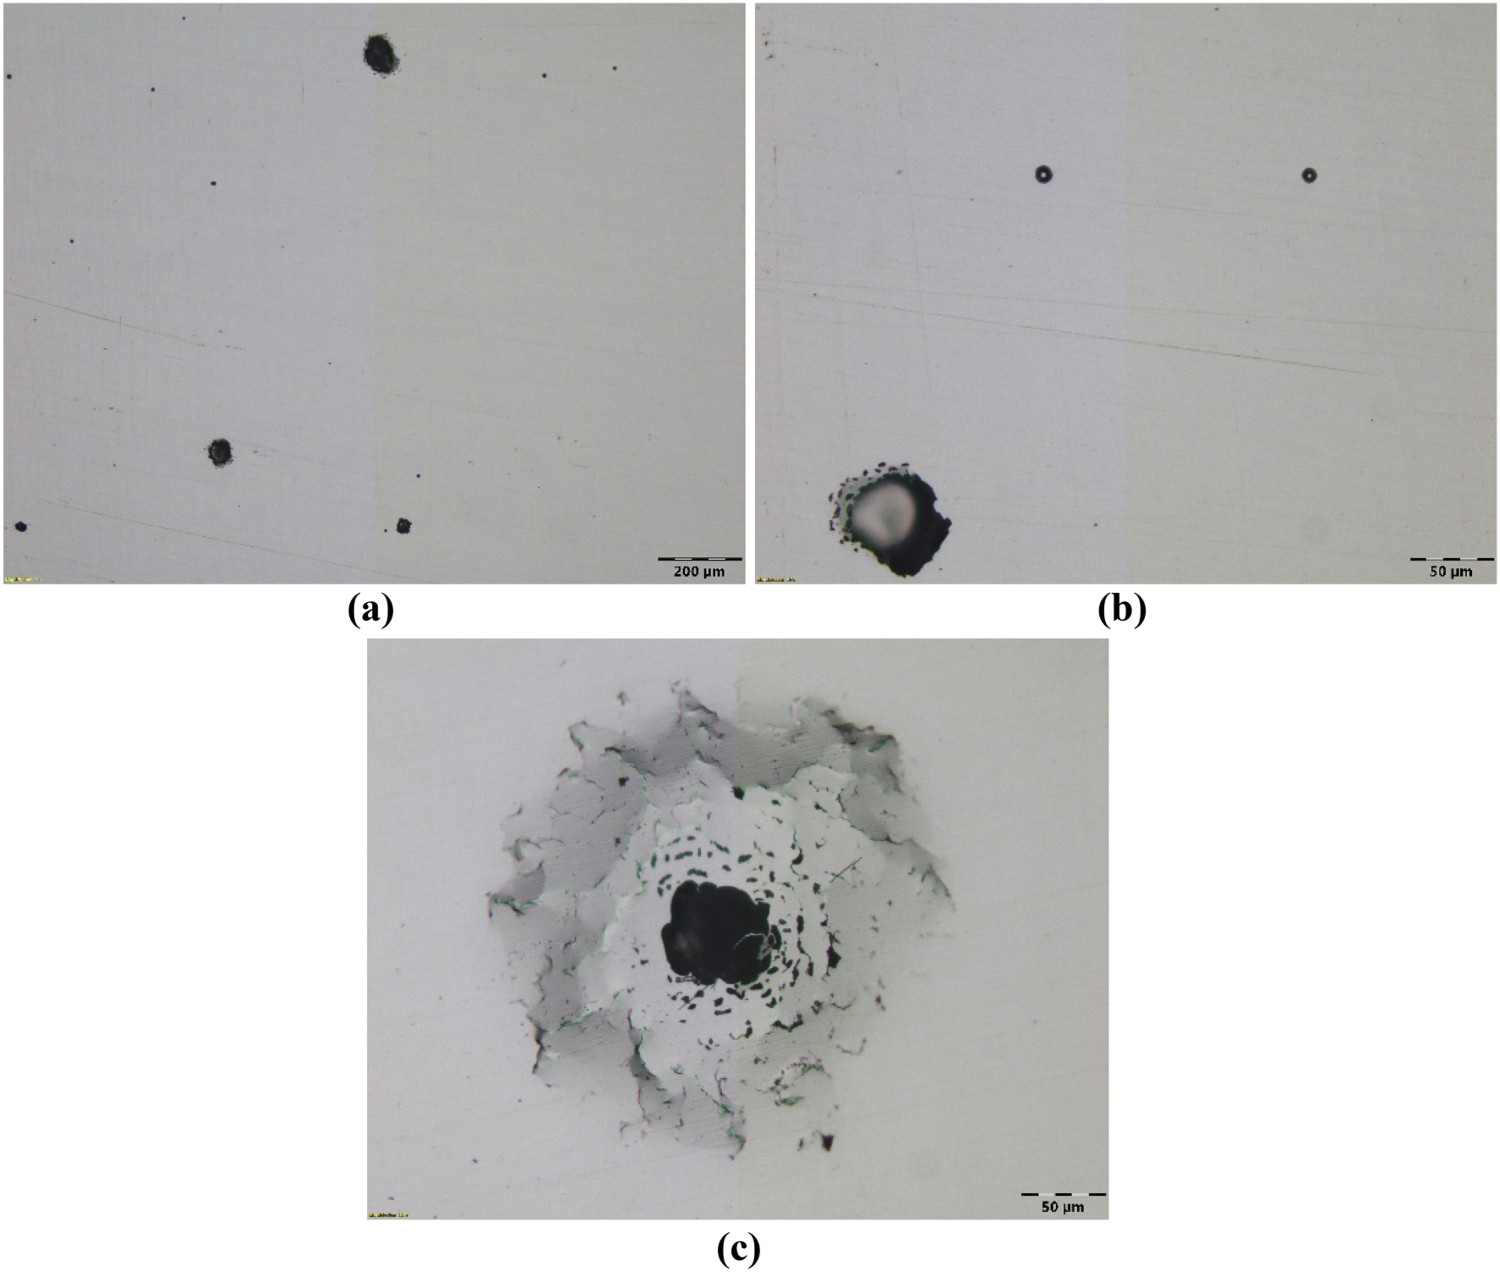
Depth of pit
The 3-D map of the exposed surfaces after potentiodynamic polarisation in 3.5 wt-% NaCl of AR and LSM specimens, observed with the 3-D optical surface profilometer, is shown in Figure 14. For the AR specimen, several pits of varying depths were observed. The highest pit depth measured for the AR specimen was 60 µm (Figure 14(a)). The diameter of this pit at the exposed surface was 100 µm. Figure 14(b) represents the 3-D view of the single pit formed on the LSM specimen. It showed a maximum depth of 18 µm and a diameter of 300 µm at the exposed surface. Even though the pit in the LSM specimen had a larger diameter than in the AR specimen, the pit in the LSM specimen was shallower. In case of pitting corrosion, the pit depth is much more crucial than pit diameter since an increase in pit depth might lead to catastrophic failure. Therefore, LSM improved the resistance to pitting corrosion of 304L SS by decreasing both the pit depth and the quantity of pits.
3-D optical profile of the exposed surfaces after potentiodynamic polarisation in 3.5 wt-% NaCl, showing the depth of the pits formed on the surface (a) AR 304L SS, (b) LSM 304L SS.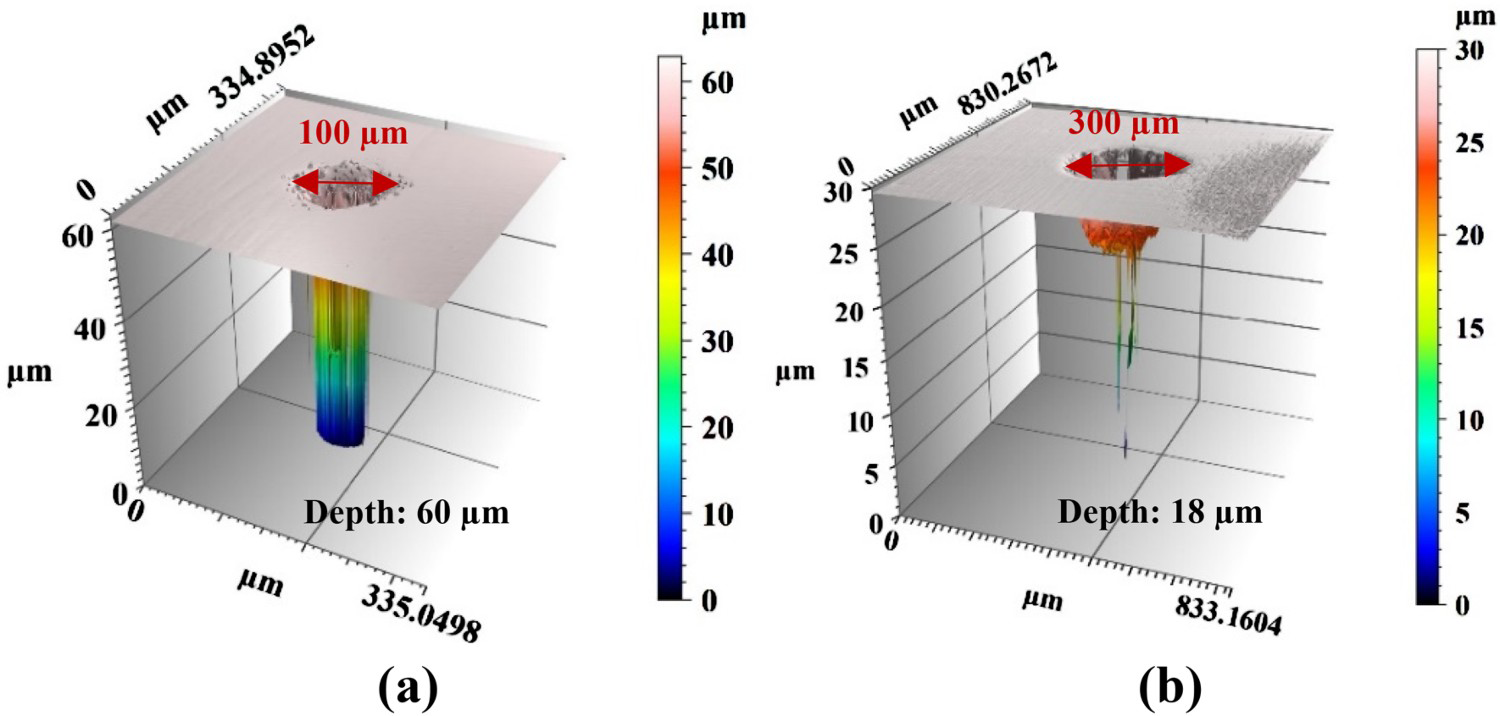
Discussion
Owing to melting and subsequent solidification, LSM of 304L SS resulted in microstructural changes (Figure 3) up to a depth of ∼ 250 µm. Owing to the overlap of the individual laser spots, the depth of the laser-melted layer was uniform throughout the specimens. In general, the microstructure of a material is sensitive to the cooling rate during solidification. The microstructure in the laser-melted layer was characterised by elongated grain structure. The reorientation of grains in this melted layer revealed a fast solidification morphology wherein the grains were stretched towards the surface as a result of pulsed laser treatment. This microstructure was uniformly present throughout the thermally affected zones on the laser-melted surface. Similar microstructural modifications brought on by LSM have already been documented [10,37].
The microstructures of both the LSM and AR specimens also indicated that neither of these materials were sensitised. However, the microstructure of the AR specimen contained both sulphide and oxide types of inclusions (Figure 7). The presence of a few inclusions in the microstructure is quite normal. During steel making, oxides (e.g. SiO2, MnO) having high melting point float on the surface of the melt pool and are removed as slag [38]. However, some particles may be retained in the melt pool which precipitate during solidification and appear as oxide/sulphide type of inclusions [39]. However, when LSM is conducted, these inclusions are dissolved and, due to the ultra-high cooling rate, do not form again. This is the reason as to why inclusions were not detected in the melted layer of the LSM specimen in the present study (Figure 6(b)). It was also demonstrated in another study that the ultra-high cooling rates inherent to the selective laser melting process prevent the formation of MnS inclusions in austenitic SS [40]. Chandra et al. [41] also reported the elimination or redistribution of MnS inclusions in 304L SS after LSM. The laser-melted layer consisted of austenite as the major phase with 0.3% δ-ferrite. There was no change in the hardness of this melted layer as compared to the underneath base metal (Figure 4). The presence of this laser-melted layer on the surface of 304L SS on transpassive dissolution and pitting corrosion was evaluated.
Resistance to transpassive dissolution
LSM led to an increase in the IGC resistance of non-sensitised 304L SS in the transpassive regime. This was demonstrated not only by the reduction in corrosion rates observed during potentiostatic polarisation tests in nitric acid (Table 2) but also by surface topographic investigation using the SEM (Figure 11) and the 3D-optical profilometer (Table 3). At any given potential, the IGC attack in LSM specimen was significantly less severe than that in AR specimen. The improvement in the IGC resistance of 304L SS after LSM can be understood when the role of certain impurities such as P, S, B, etc., on corrosion behaviour of materials are considered. In commercial SSs, impurities like P, S, B, Si, etc., segregate at the grain boundaries, creating active sites for the initiation of IGC attack [42,43]. The rapid cooling after LSM and subsequent removal of the impurity segregation at the grain boundaries may be the likely causes of the improved corrosion resistance of the LSM specimen. Moreover, overlap during laser melting imposes additional thermal cycles which leads to a more homogeneous distribution of impurity elements [11]. As a result, the LSM specimen has fewer IGC initiation sites at grain boundaries in the transpassive regime, which is a major reason for the reduction in corrosion rate following LSM. Increased IGC rates of SSs in nitric acid with the addition of impurity elements are reported in several investigations [42 47]. The corrosion rate of 316L SS decreased significantly with decreasing P and S levels when tested in 14.5 M HNO3 [44]. Ioka et al. [45] have reported that the addition of impurities like P, S, B, Si, C to extra high purity 310 SS resulted in increased corrosion rates in 14.5 M HNO3. Mayuzumi et al. [46] demonstrated that the addition of 0.005% of C, P or S in high purity 18%Cr–14%Ni alloys led to severe IGC in 13 M HNO3 containing Ce4+ ions in the transpassive potential regime. Therefore, the improvement in IGC resistance in the transpassive regime of SS 304L following LSM is attributable to the elimination of grain boundary segregation of impurity elements.
Resistance to pitting corrosion
AR specimen exhibited an average pitting potential of 317 ± 68 mVSCE in 3.5 wt-% NaCl, in addition to some current transients immediately below the pitting potential (Figure 10). Compared to the AR specimen, the LSM specimen showed a higher pitting potential of 474 ± 88 mVSCE. After polarisation experiments, the AR specimen typically displayed multiple pits on the exposed surface, whereas the LSM specimen consistently revealed only one or two pits (Figure 11). It is well known that the size and density of MnS inclusions play a significant role in pit initiation in wrought SS in the chloride environment [47]. For the AR specimen, several inclusions were observed in the as-polished condition (Figure 6(a)). The current transients exhibited immediately below the pitting potential are an indication of metastable pit initiations caused by these inclusions present in the material. However, as previously mentioned, rapid solidification during LSM inhibited the formation of inclusions, and therefore, no inclusions were found in the laser-melted layer of the LSM specimen (Figure 6(b)). The observation of 1-2 pits and the absence of current transients in the LSM specimen could be related to a reduction in the pit initiation sites, i.e. MnS inclusions, following LSM.
There are two theories on how pit initiates at MnS inclusions in SSs. Some researchers report that these inclusions are soluble in the test solution and act as preferred sites for pit initiation [48,49]. A few studies [50,51] report the presence of Cr depletion zone of width 200-500 nm around these MnS precipitates which act as pit initiating sites due to the absence of Cr oxide passive film. According to Suter et al. [52], when the electrochemical cell was localised across the inclusion-metal boundary in electrochemical micro-cell tests, the current values increased steeply at much lower potentials. Therefore, in the current study, the improvement in the pitting corrosion susceptibility as shown by the increase in pitting potential after LSM, is linked to the redistribution or elimination of MnS inclusions. For the first time, the present investigation reports a reduction in pit depth following LSM. The increase in pitting potential of austenitic SS after LSM has been widely documented [37,53,54]. A decrease in number of pits following LSM was also noted by Cui et al. [28]. Chong et al. [27] attributed the increase in pitting potential after LSM to the removal of MnS inclusions as a result of LSM.
In contrast, a few studies [34,35] have reported a decrease in pitting resistance of SS 316L after LSM owing to different modes of solidification and the accompanying inhomogeneous distribution of chromium, which resulted in chromium depletion in some regions, such as at ferrite/austenite boundaries. However, such a decrease in pitting resistance was not observed in the present study. This different behaviour of pitting resistance after LSM may be related to the different alloy systems investigated (SS 316L versus 304L in the present study).
Conclusions
Based on the evaluation of the resistance of 304L SS to transpassive dissolution and pitting corrosion after LSM, the following findings can be made:
LSM of 304L SS under controlled parameters resulted in a melted top layer that was approximately 250 µm from the surface and had a refined dendritic microstructure. The layer that was laser-melted exhibited no appreciable difference in hardness from the base material. IGC rate as well as the depth of attack during transpassive dissolution of 304L SS were significantly reduced after LSM. When comparing LSM specimens to AR specimens, the potential that corresponds to the initiation of grain dropping owing to IGC was increased by 9 mV. After LSM, the resistance of SS 304L to pitting corrosion was increased. This was demonstrated by an increase in pitting potential, a reduction in the number of pits, and a reduction in pit depth following LSM.
Footnotes
Acknowledgement
Technical assistance of Mr. Pawan Kumar during laser surface melting experiments is thankfully acknowledged.
Disclosure statement
No potential conflict of interest was reported by the author(s).