






Abstract
In resistance spot welding (RSW) joints of austenitic stainless steel (ASS), a small-scale electrochemical cell (minicell) was used for assessing individually, on each of the three welding zones, of size less than 1000 µm (fusion zone (FZ), heat affected zone (HAZ) and base metal (BM)), the combined effect of a RSW process and post-welding sensitisation on the degree of sensitisation (DOS). The results show that the three welding zones have different microstructures that make each of them respond differently to post-welding sensitisation. The DOS varies with post-welding sensitisation time in all three welding zones, but it varies at a different rate in each welding zone (the highest rate in the FZ). This variation is due to the fact that when the DOS reaches a certain level, which is observed when plotting the reactivation charge (Qr) versus the post-welding sensitisation time, a microstructural regeneration occurs.
Keywords
Introduction
Resistance spot welding (RSW) is widely employed for joining metal sheets in the manufacturing of automobiles, trucks trailers, buses, recreational vehicles, office furniture and appliances, railway vehicles, aeroplane structures and also for aeronautical and space applications [1]. In the automotive industry, RSW, because of its low cost, high speed and high degree of adaptability for automation in mass production, is the predominant process in sheet metal joining [2 9].
Austenitic stainless steels (ASSs), in view of their good combination of (i) energy-absorption ability, due to a face-centered-cubic lattice structure of austenite stabilised at room temperature by nickel alloy additions, and (ii) corrosion resistance, due to chromium alloy additions that allow the formation of a protective layer based on chromium oxide, can be considered as an interesting option for vehicle body manufacturing in the automotive industry [10,11]. Andersson et al. [12] pointed out that crash performance and energy absorbing capability of a specific component in automotive vehicles is a combination of geometry and material properties and that, since ASSs combine excellent formability with high strength, can be press-formed into components with high stiffness and high energy absorbing capability. Capelli et al. [13] and Friesen and Cunat [14] agreed that ASSs combine high strain rate sensitivity with high formability capability (that, in turn, allows straighter designs), which promotes crushing instead of buckling and, consequently, improves the energy-absorption capability. The NGV (Next Generation Vehicle) Project showed that ASSs can be used to improve safety and sustainability in structural automotive systems while reducing both weight and costs [15]. In addition to the automotive industry, RSW of ASS, given its good performance, is extensively used in metro and railway car body manufacturing [16 18].
The heat associated with welding processes may cause, in ASSs, a phenomenon known as sensitisation which leads to precipitation, along critical zones, of chromium-rich phases whose adjacent zones are then chromium-depleted zones and therefore more susceptible to corrosion attack [19,20]. RSW has the advantage over other welding processes of having rapid heating/cooling cycles [3,5,21], which limits the thermal exposure time and, therefore, can reduce the formation of the aforementioned chromium-rich phases [22,23].
Even though the degree of sensitisation (DOS) associated with RSW process is low [24], the RSW joint may be subjected to high-temperature service conditions [15,25] where the temperature range in which sensitisation occurs is reached and, hence, it is necessary to assess the combined effect of RSW process and post-welding sensitisation, induced by subsequent service conditions, on the DOS [24]. In addition, the effect of corrosion can be critical in an already small-sized welded joint such as a RSW joint [26].
Electrochemical potentiokinetic reactivation (EPR) is a quasi non-destructive test that is used mainly to assess the DOS, and which is more sensitive, faster and more precise than the conventional corrosion tests [27,28].
RSW is a fusion welding process, in which a weld nugget is formed from the solidification of the molten metal after heating by Joule effect [29]. Thus, as a result of the process, three weld zones can be distinguished in the RSW joint [30]: (i) fusion zone (FZ), also called weld nugget; (ii) heat affected zone (HAZ); and (iii) base metal (BM). Since the maximum dimensions of the FZ are limited by the face diameter of the contact electrodes (i.e. by the electrode-sheet contact area) and by the thickness of the overlapped sheets, and since the HAZ is narrow due to the fact that RSW is a low heat input process compared to other welding processes [31,32] such as gas metal arc welding (GMAW) process [33], and that ASSs have low thermal conductivity [34] compared to carbon steel [35,36], a conventional large-scale EPR test may not be able to isolate specific results from each of the three small-sized individual zones of the RSW joint.
The majority of microelectrochemical methods employed to study localised corrosion on small areas [37 41] use microcapillary-based droplet cells that have the advantage of the small size (in the micrometer range) of the exposed working area [42 44]. These capillary microcells have some drawbacks [45] and in some cases it is not required to use areas as small as those provided by microcapillaries [46]. Thus, ad hoc small-scale electrochemical cell known as ‘minicell’, different to the capillary-based microcell and which has been successfully utilised in the study of welded joints of ASSs [46–49], can be applied to RSW joints given that it has study sizes in the range of 200-1000 µm [48].
In this work, a small-scale electrochemical cell (minicell) was used for assessing individually, on each of the three small-sized zones of the welded joint, the combined effect of RSW process and post-welding sensitisation, induced by subsequent service conditions, on the DOS, with the aim of overcoming the limitations of employing large-scale EPR tests for assessing the DOS in small-sized welding zones.
Experimental procedure
Materials
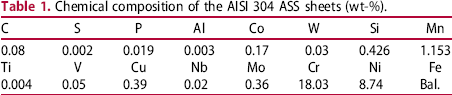
Chemical composition of the AISI 304 ASS sheets (wt-%).
Mechanical properties of the AISI 304 ASS sheets.

RSW procedure
The AISI 304 ASS sheets were welded with a single-phase alternating current (AC) 50 Hz equipment by using water-cooled truncated cone Resistance Welding Manufacturing Alliance (RWMA) Group A Class 2 electrodes with 4.5 mm face diameter [50]. The controlled parameters in RSW process were welding current (fixed at 5 kA), welding time (fixed at 0.20 s) and electrode force (fixed at 1500 N).
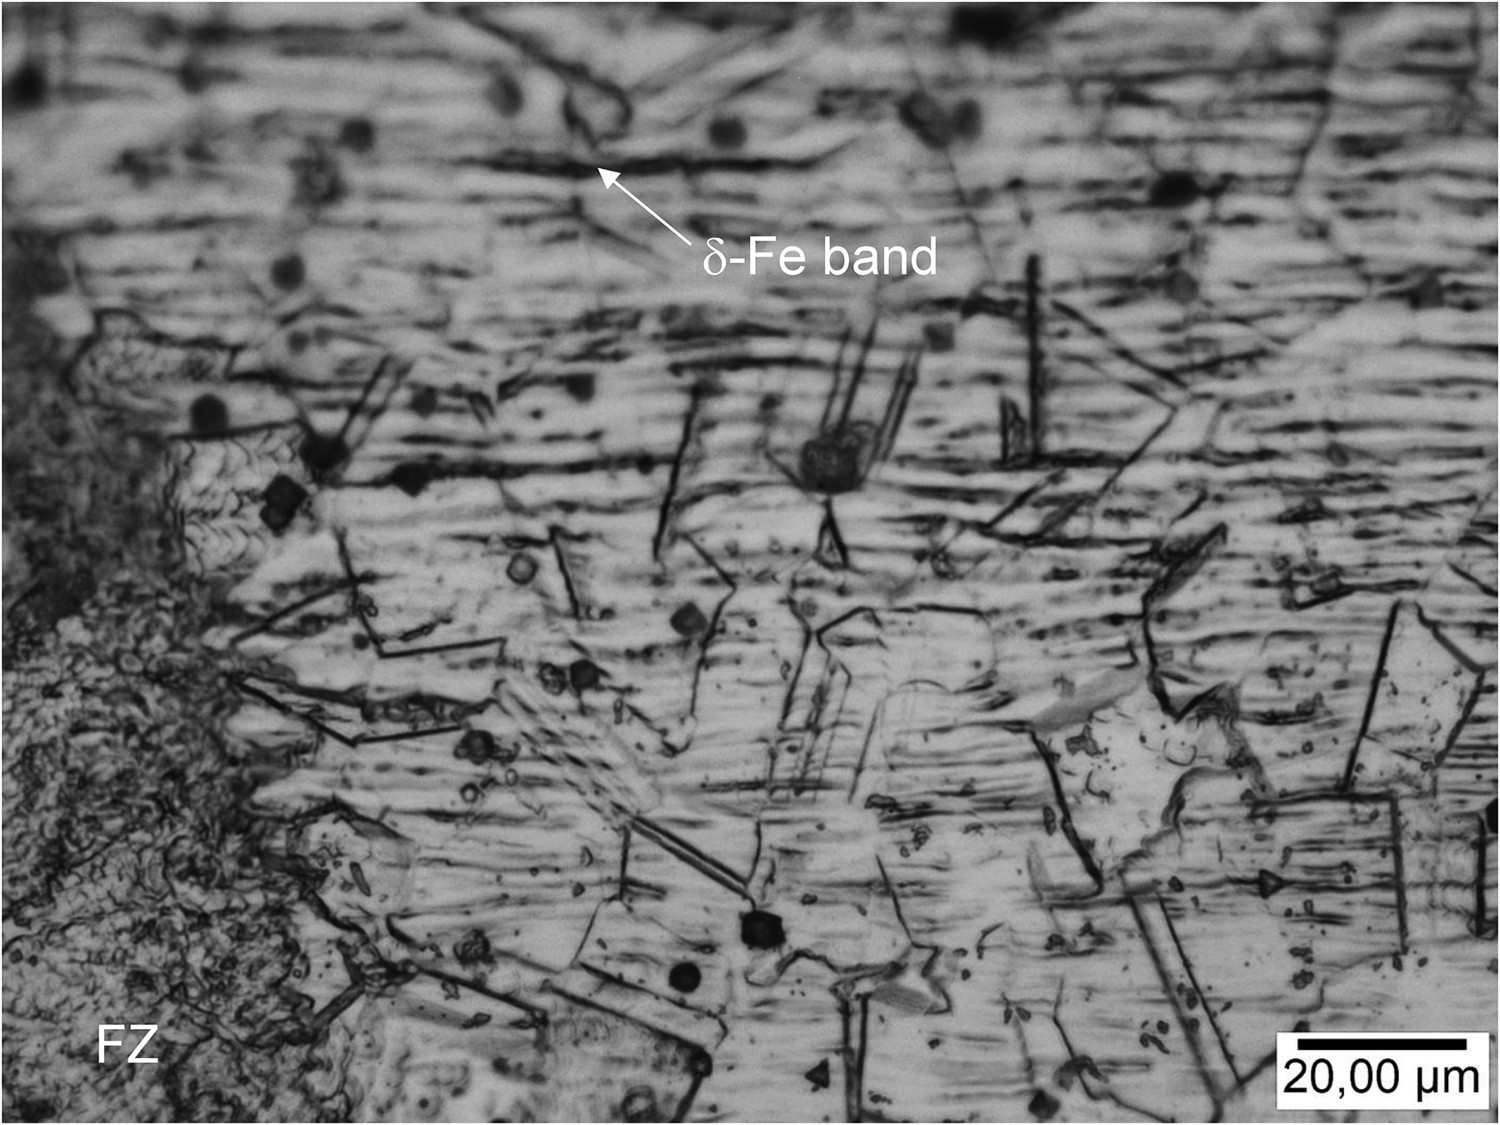
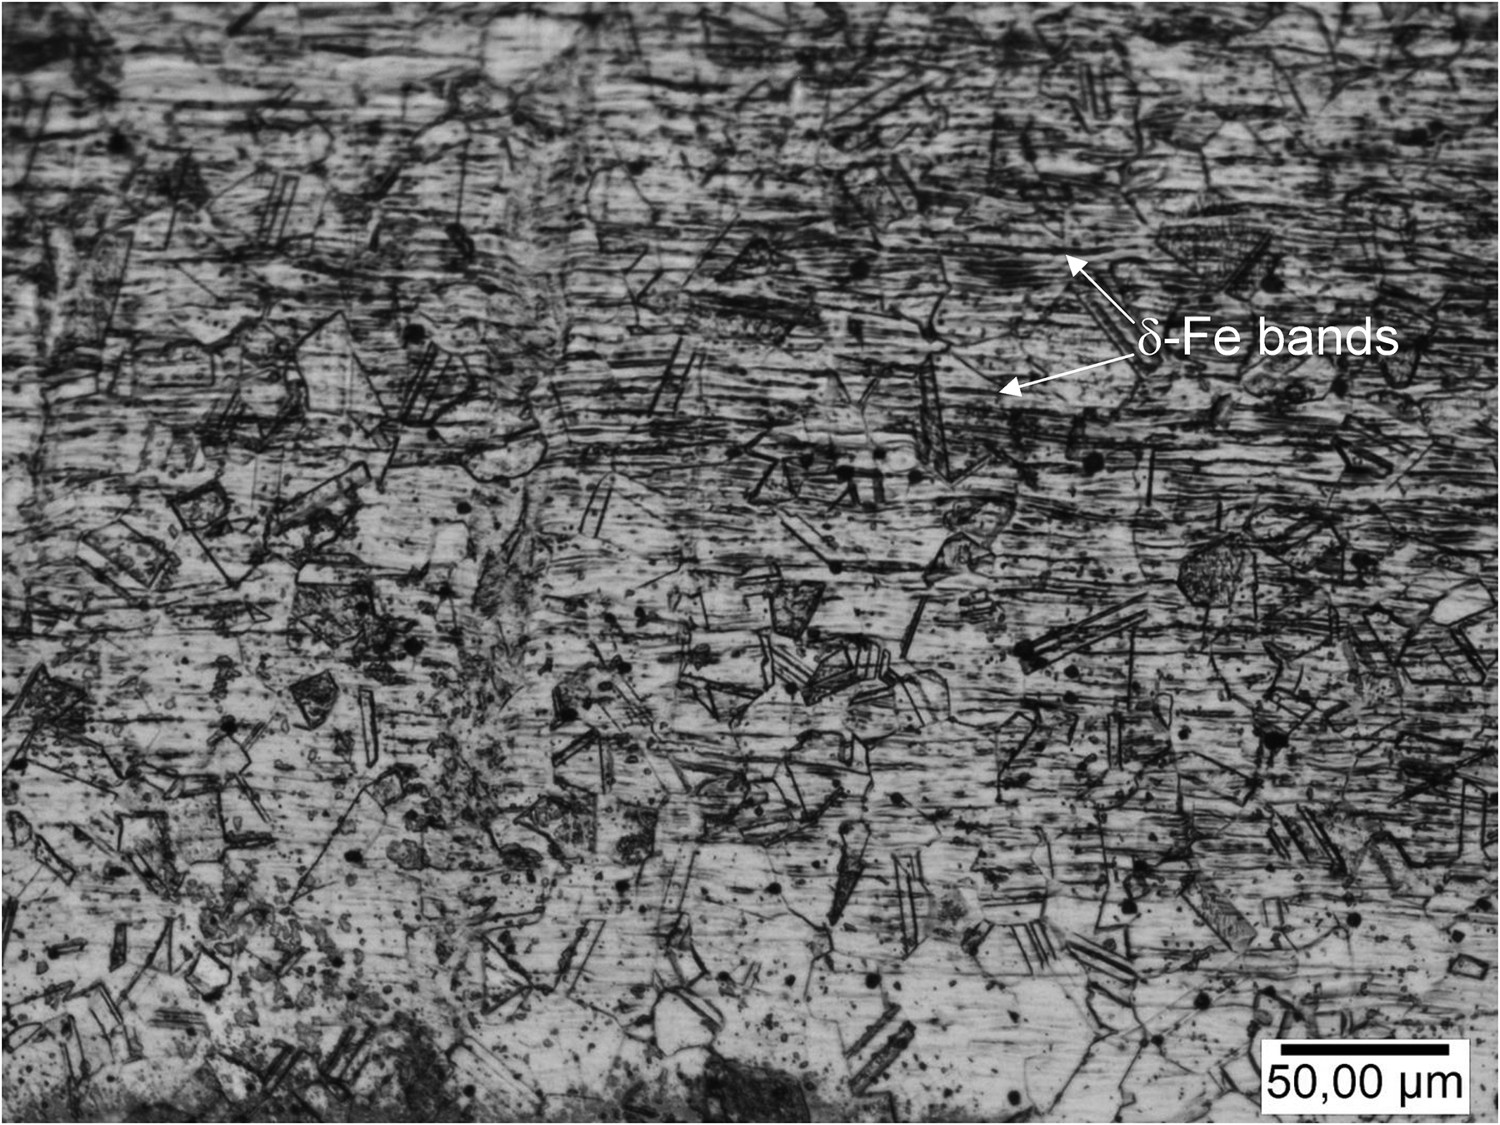
As a result of the fusion welding process, the RSW joint has three small-sized welding zones with different microstructures that can respond in different ways to post-welding sensitisation: (i) FZ (weld nugget), which is a cast dendritic microstructure of austenite with delta-ferrite in interdendritic regions (Figure 1); (ii) HAZ, whose microstructure depends on the heat generated in the RSW process which may remove signs of prior cold work (Figure 2); and (iii) BM, which is not affected by the welding heat input, and shows an austenitic structure with signs of prior cold work such as delta-ferrite bands oriented in the rolling direction (Figure 3) [19,24].
Optical micrograph of the FZ of a RSW joint (without post-welding sensitisation), which has a cast dendritic microstructure of austenite with delta-ferrite (δ-Fe) in interdendritic regions (electrolytic etching with oxalic acid according to ASTM A262-15(2021) Practice A) [51]. Optical micrograph of the HAZ of a RSW joint (without post-welding sensitisation), in which signs of prior cold work (delta-ferrite (δ-Fe) bands oriented in the rolling direction) are partially removed by the effect of the welding heat input (electrolytic etching with oxalic acid according to ASTM A262-15(2021) Practice A) [51]. Optical micrograph of the BM of a RSW joint (without post-welding sensitisation), which shows an austenitic structure with signs of prior cold work such as delta-ferrite (δ-Fe) bands oriented in the rolling direction (electrolytic etching with oxalic acid according to ASTM A262-15(2021) Practice A) [51].
Post-welding sensitisation procedure
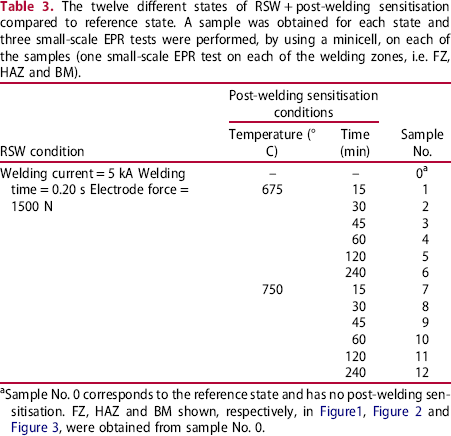
The twelve different states of RSW + post-welding sensitisation compared to reference state. A sample was obtained for each state and three small-scale EPR tests were performed, by using a minicell, on each of the samples (one small-scale EPR test on each of the welding zones, i.e. FZ, HAZ and BM).
Small-scale EPR test
Minicell set-up
The sample to be studied was clamped on a micrometer table. Thus, it was possible to move the sample to the desired position with respect to the tip of the minicell, so that the tip was located exactly on top of the weld zone to be studied in each case (Figure 4(A)).
(A) Micrometer table on which the sample was clamped. (B) Minicell used in the small-scale EPR tests. (C) Optical macrograph taken in the BM of a RSW joint after a small-scale EPR test to show the size of the exposed working area.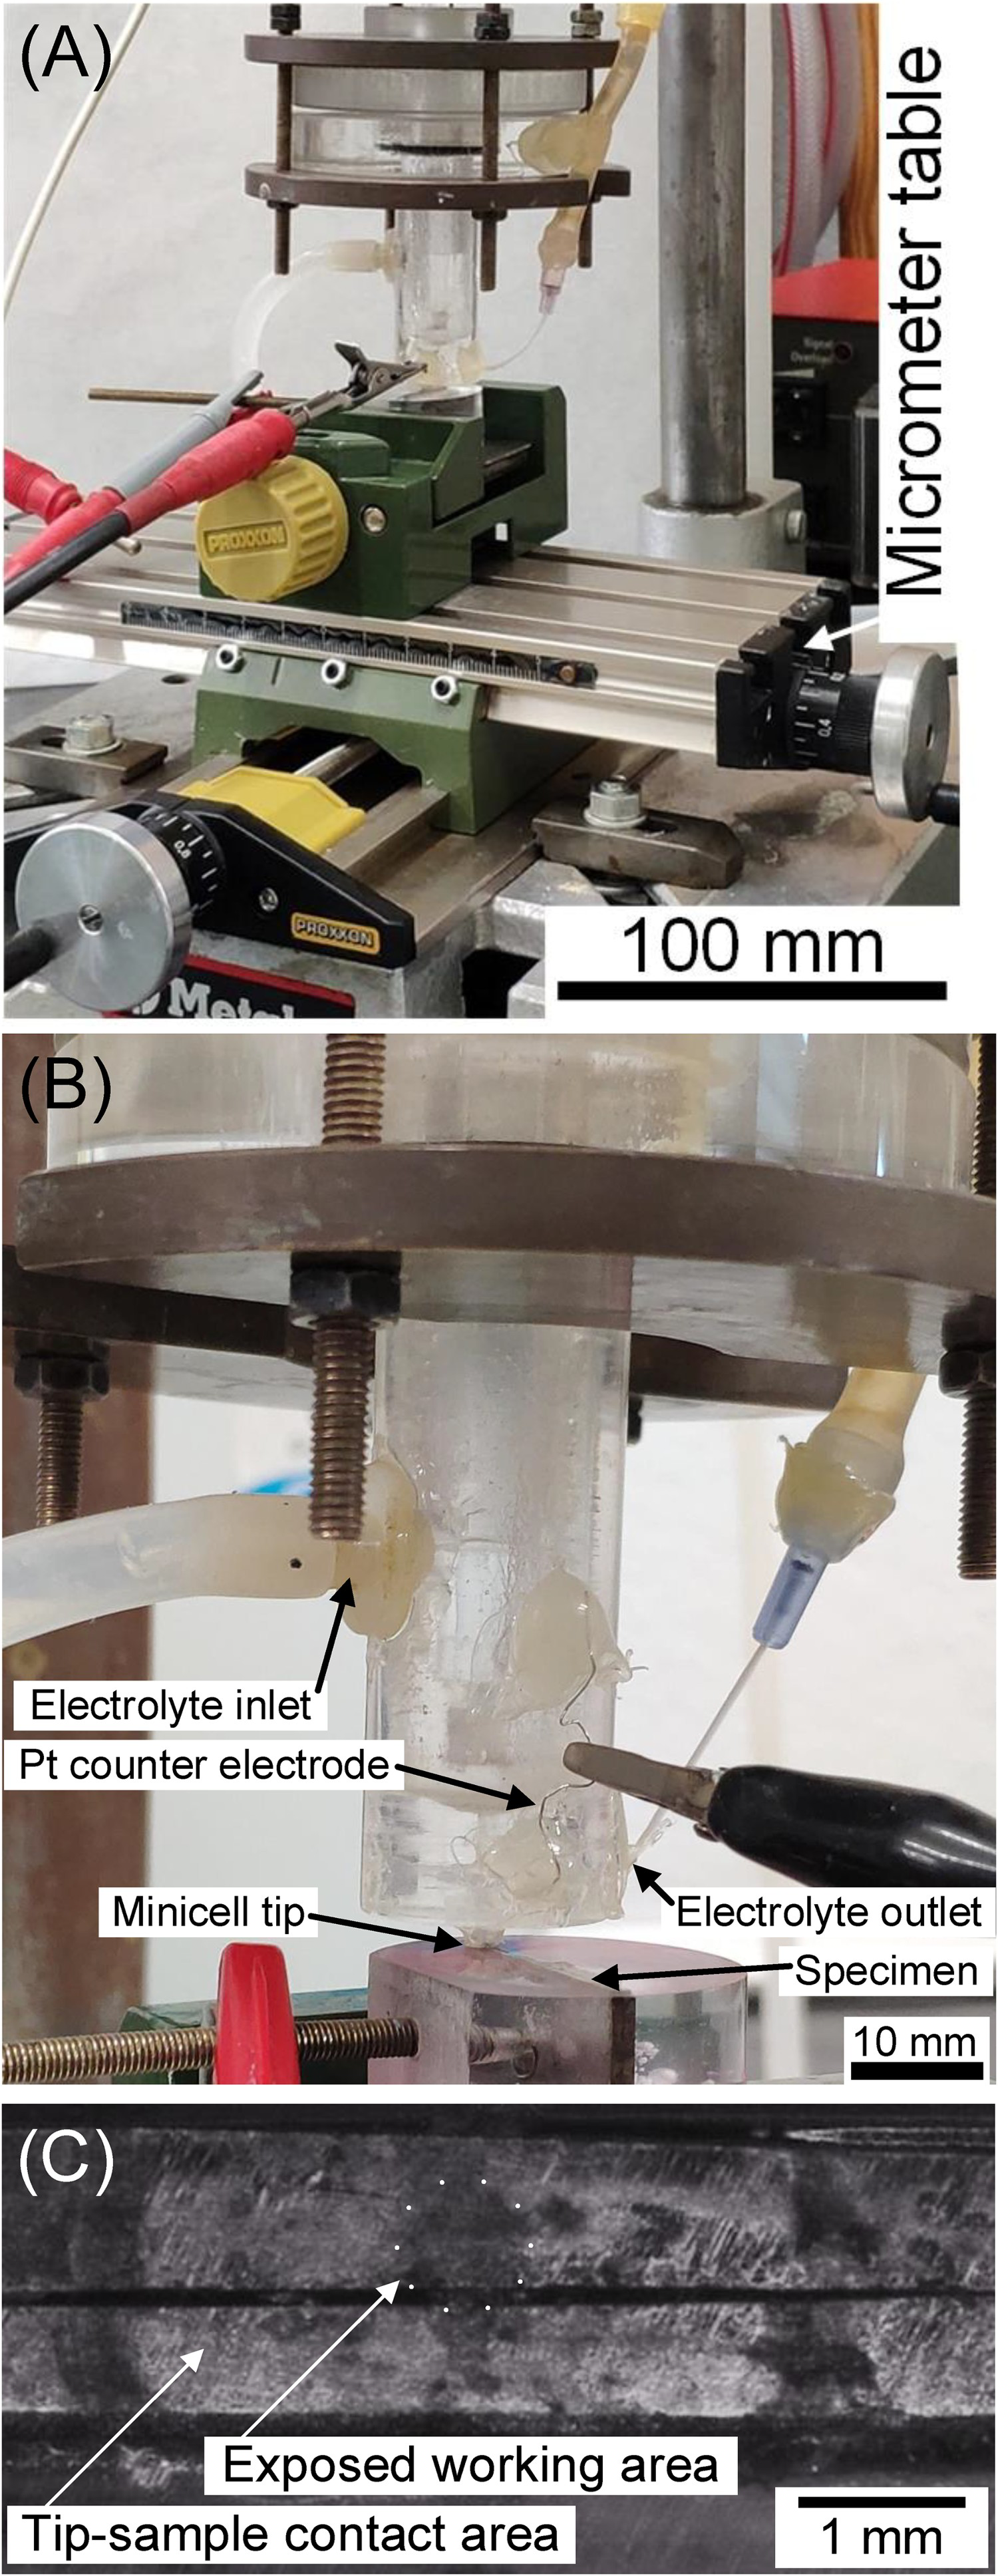
The minicell used (Figure 4(B)) was made in polymethyl methacrylate (PMMA). It consisted of two parts: the lid and the body. The electrolyte flowed in the minicell through the upper inlet (5 mm in diameter) and left through the lower outlet (1 mm in diameter). Thus, the reduction in section led to a suction effect that continuously renovated the chemical species of the working area and allowed a continuous flow of fresh electrolyte over the working electrode area, and the disturbing phenomenon of possible bubbling was then lessened. The platinum counter electrode (0.2 mm wire) was positioned between the working and the reference electrode. The same reference electrode as for large-scale experiments was used (Saturated Calomel Electrode (SCE)), and was located at a distance (ca. 9 mm) from the working electrode (this positioning is aimed at obtaining the best possible electrical signals) [46,48,49].
Small-scale EPR test procedure
EPR test was performed following ASTM Standard G-108 [52] but, given that the results were found to be dependent on the degree of surface preparation, an electrochemical conditioning, which allows a degree of surface preparation (No. 600 emery paper) less severe than the established by the aforementioned standard, was conducted [46]. The electrolyte was 0.5 M H2SO4 + 0.01 M KSCN and the test temperature is 30°C ± 1. The experimental procedure of the test was the following: a holding time of 5 min at open circuit (OC) potential, deaerated, an anodic attack at −220 mV(SCE) for 2 min, a holding time of 2 min at VOC, a cathodic cleaning at −600 mV(SCE) for 1 min and a holding time of 5 min at VOC. Passivation was carried out by applying 200 mV(SCE) for 2 min (a longer time would give rise to a more stable passive layer, which would prevent certain EPR curves from having a passive zone where the current density is not exactly constant, but it would also lead to a lack of reactivation in other EPR curves). The reactivation scan starts at 200 mV until 100 mV below the VOC at a rate of 100 mV min−1.
As shown above (Figure 4(C)), the exposed working area studied in each of the small-scale EPR tests has a value of approximately 0.005 cm2 (ca. 0.8 mm in diameter).
Three small-scale EPR tests were conducted, by using the minicell, on each of the 13 samples Nos. 0-12 (one small-scale EPR test on each of the welding zones, i.e. FZ, HAZ and BM) (Figure 5(A)). The repeatability of the tests was assessed by repeating the small-scale EPR test several times in the same welding zone and verifying that the differences between the EPR curves obtained were not significant (Figure 5(B)).
(A) Location of the small-scale EPR tests in each of the welding zones. The exposed working area is indicated by a circle 0.005 cm2 in area and 0.8 mm in diameter. in the small-scale EPR tests. The RSW joint shown corresponds to sample No. 10 (electrolytic etching with oxalic acid according to ASTM A262-15(2021) Practice A) [51]. (B) Assessment of repeatability of the small-scale EPR tests: curves obtained from the BM in samples No. 1 (C1 and C2) and No. 0 (C3 and C4).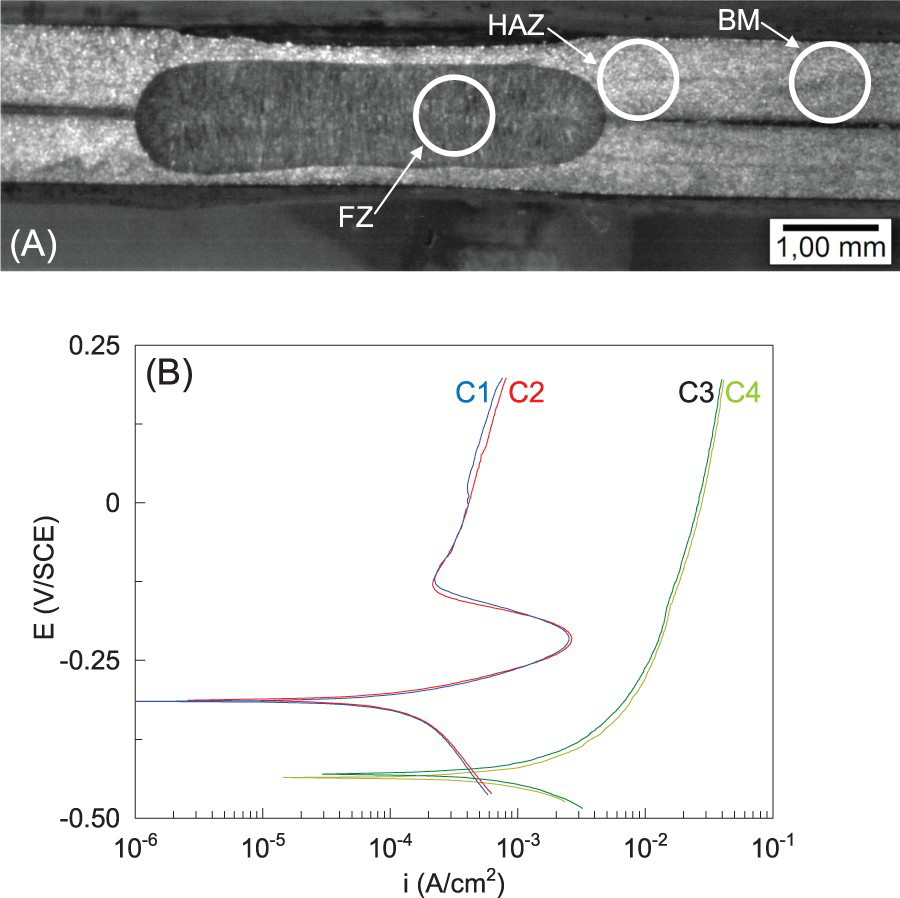
The EPR test parameter Qr (reactivation charge) (Figure 6), given its correspondence with the DOS [53], is used to assess such a DOS [54].
In each EPR curve, the reactivation charge Qr is determined between point A1 and point A2 (reactivation hump). Passive layer formation occurs at 200 mVsce (A0) and the passive layer (passive zone between A0 and A1) limits the flow of current until its localised breakdown (A1) causes the current density to increase significantly. The small-scale EPR curve shown is obtained from the FZ of sample No. 11.
Certain EPR small-scale EPR curves show local increases of current density that may be due to the formation of crevice corrosion at the interface between the minicell tip and the sample, but this phenomenon occurs mainly in the passive zone of the EPR curve, outside the reactivation hump (Figure 9(C), Figure 10(D) and Figure 12(B)) and also, as pointed out by De Tiedra [55], does not affect significantly the reactivation charge Qr (Figure 6).
Results and discussion
The results obtained from the small-scale EPR curves (Figures 7–12) are analysed in terms of the Qr parameter (Figures 13 and 14) [54]. As shown in Figure 6, the Qr parameter increases as the current density through the passive layer increases, which occurs when the passive layer is broken or weakened at the zones where chromium-rich phases precipitate.
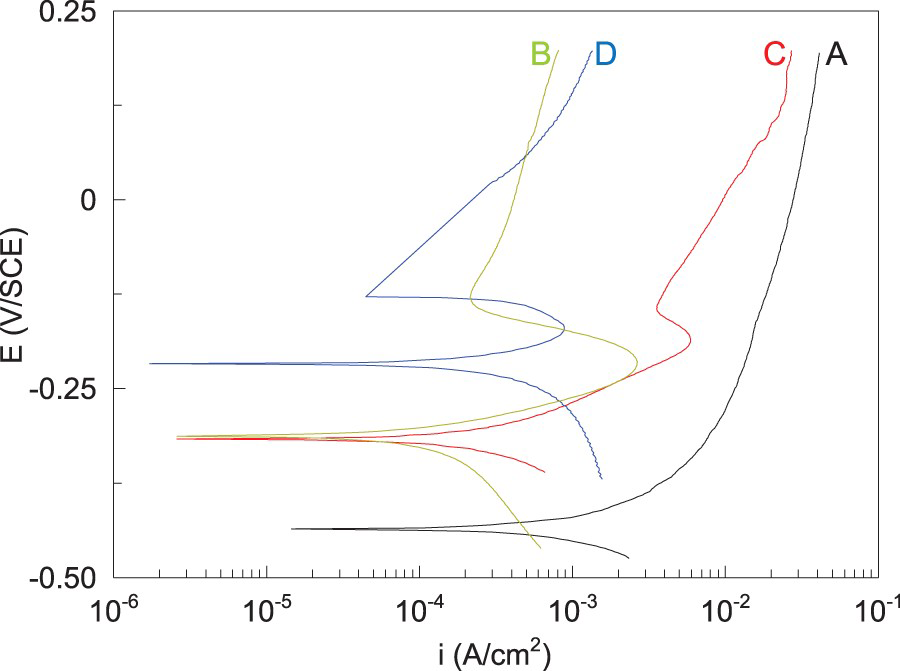
Small-scale EPR curves obtained from the FZ of: (A) sample No. 0 (Qr = 0.52144 C cm−2); (B) sample No. 1 (Qr = 1.2165 C cm−2); (C) sample No. 4 (Qr = 0.37101 C cm−2); and (D) sample No. 6 (Qr = 3.4622 C cm−2). Small-scale EPR curves obtained from the HAZ of: (A) sample No. 0 (Qr = 0.23861 C cm−2); (B) sample No. 1 (Qr = 0.69272 C cm−2); (C) sample No. 4 (Qr = 0.41732 C cm−2); and (D) sample No. 6 (Qr = 0.1602 C cm−2). Small-scale EPR curves obtained from the BM of: (A) sample No. 0 (Qr = 0 C cm−2, i.e. there is no reactivation); (B) sample No. 1 (Qr = 0.14747 C cm−2); (C) sample No. 4 (Qr = 0.32757 C cm−2); and (D) sample No. 6 (Qr = 0.03397 C cm−2). Small-scale EPR curves obtained from the FZ of: (A) sample No. 0 (Qr = 0.52144 C cm−2); (B) sample No. 7 (Qr = 0.094963 C cm−2); (C) sample No. 10 (Qr = 0.25427 C cm−2); and (D) sample No. 12 (Qr = 2.1729 C cm−2). Small-scale EPR curves obtained from the HAZ of: (A) sample No. 0 (Qr = 0.23861 C cm−2); (B) sample No. 7 (Qr = 1.9035 C cm−2); (C) sample No. 10 (Qr = 0.16359 C cm−2); and (D) sample No. 12 (Qr = 10.345 C cm−2). Small-scale EPR curves obtained from the BM of: (A) sample No. 0 (Qr = 0 C cm−2, i.e. there is no reactivation); (B) sample No. 7 (Qr = 1.1744 C cm−2); (C) sample No. 10 (Qr = 4.2562 C cm−2); and (D) sample No. 12 (Qr = 11.143 C cm−2). Reactivation charge, Qr (C/cm2), obtained from each of the welding zones (FZ, HAZ and BM) of the RSW joint without post-weld sensitisation (sample No. 0, which has no reactivation in the BM, i.e. with Qr = 0 C cm−2) and of the six RSW joints subjected to post-weld sensitisation at 675°C (samples Nos. 1-6). Reactivation charge, Qr (C/cm2), obtained from each of the welding zones (FZ, HAZ and BM) of the RSW joint without post-weld sensitisation (sample No. 0, which has no reactivation in the BM, i.e. with Qr = 0 C cm−2) and of the six RSW joints subjected to post-weld sensitisation at 750°C (samples Nos. 7-12).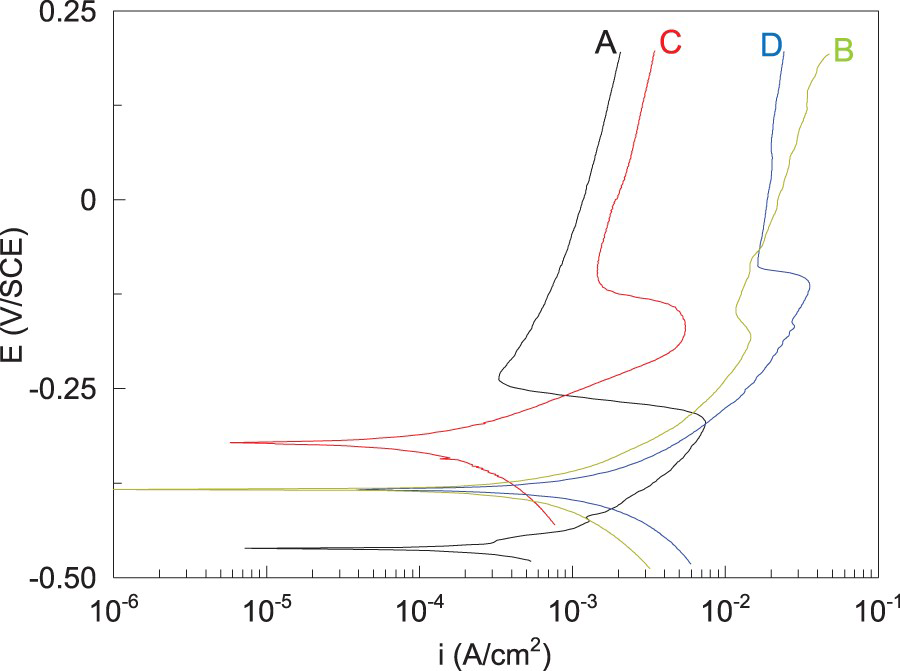



The DOS values are, in general, higher in the post-welding sensitisation at higher temperature (750°C) [56] (Figures 13 and 14), which is consistent with the results of Yu et al. [57]. According to these authors, DOS increases as sensitisation temperature increases, due to the fact that the rate of chromium diffusion increases when the temperature increases.
As it can be seen in Figures 7–14, the DOS experiences a variation with post-welding sensitisation time which is due to the fact that when the DOS reaches a certain level, a microstructural regeneration, during which the DOS decreases with sensitisation time, takes place [48,49]. After this microstructural regeneration, the microstructure undergoes a further increase in DOS with sensitisation time until the level at which microstructural regeneration occurs is reached again. These results are consistent with those of Matula et al. [54], according to which the EPR test is capable of detecting modifications in the chromium distribution, not only the depletion but also the rehomogenisation [54].
In FZ, the post-welding sensitisation causes the precipitation of chromium (ferrite-stabilising element) rich phases along dendritic boundaries [19] (Figure 15), which have a high content of delta-ferrite due to the rapid cooling [58,59] associated with the RSW process [60,61]. This type of sensitisation is associated with interdendritic corrosion (IDC). The variation, of the DOS in FZ, with post-weld sensitisation time, shown in Figures 13 and 14, is in accordance with that of the IDC, shown in Figure 1, Figure 16(A–C) and Figure 17(A–C).
(A) EDX line scan between two dendrites for Cr content in the FZ of sample No. 12; although the electrolytic etching with oxalic acid, according to ASTM A262-15(2021), dissolves the chromium-rich phases that had precipitated along interdendritic regions, the chromium depleted zones, adjacent to the chromium-rich phases, are shown. (B) SEM micrograph of the line scan location. Optical micrographs (electrolytic etching with oxalic acid according to ASTM A262-15(2021) Practice A [51]) of: (A) FZ of sample No. 1; (B) FZ of sample No. 4; (C) FZ of sample No. 6; (D) HAZ of sample No. 1. (E) HAZ of sample No. 4; (F) HAZ of sample No. 6; (G) BM of sample No. 1; (H) BM of sample No. 4; (C) BM of sample No. 6. Optical micrographs (electrolytic etching with oxalic acid according to ASTM A262-15(2021) Practice A [51]) of: (A) FZ of sample No. 7; (B) FZ of sample No. 10; (C) FZ of sample No. 12; (D) HAZ of sample No. 7. (E) HAZ of sample No. 10; (F) HAZ of sample No. 12; (G) BM of sample No. 7; (H) BM of sample No. 10; (C) BM of sample No. 12.


In both HAZ and BM, the post-welding sensitisation causes the precipitation of chromium-rich phases [19,20,34,62 64], which takes place along: (i) austenite/delta-ferrite interfaces, twins and slip bands inside austenitic grains (this type of sensitisation is associated with transgranular corrosion (TGC)); and (ii) and grain boundaries (this type of sensitisation is associated with intergranular corrosion (IGC)). The variation, of the DOS in HAZ and BM, with post-weld sensitisation time, shown in Figures 13 and 14, is in accordance with that of the TGC and IGC, shown in Figure 2, Figure 16(D–F) and Figure 17(D–F) for HAZ and in Figure 3, Figure 16(G–I) and Figure 17(G–I) for BM. It is also observed that, in both HAZ and BM, the variation over sensitisation time is more significant for TGC than for IGC [24].
As can be seen in Figures 13, 14, 16, 17, the fact that the three welding zones (FZ, HAZ and BM) have different microstructures makes each of them respond differently to post-welding sensitisation: although the DOS varies with sensitisation time in all three welding zones, it varies at a different rate in each welding zone.
As it can be observed in Figures 13 and 14, the variation rate of the DOS with post-welding sensitisation time is higher in the FZ than in HAZ and BM. This phenomenon is caused by the fact that the kinetics of microstructural regeneration is faster in FZ than in HAZ and BM [24,65], which may be due to two causes. First, the chemical segregation associated with the solidification processes [66,67], where the last fraction of liquid that solidifies enriches in ferrite-stabilising elements such as chromium, and thus, the interdendritic regions can be expected to be zones for preferential delta-ferrite formation [68,69] (this chemical segregation makes the rate of diffusion higher since concentration gradient is, according to Fick's law, the driving force of diffusion [70]). Second, diffusion takes place faster along grain boundaries than into the grain [71,72] and, as can be seen in Figures 1–3, 16 and 17, grain boundary area is larger in the dendritic-grain microstructure of FZ than in the equiaxed-grain microstructure of HAZ and BM.
Finally, the fact that BM (without thermal effects due to welding process) of sample No. 0 (without post-welding sensitisation) has no reactivation (EPR curve A in Figure 9 and Figure 12) confirms that the lack of reactivation occurs when the DOS does not reach a certain reactivation threshold [19].
Conclusions
In this work, a small-scale electrochemical cell (minicell) is used for assessing individually, on each of the three small-sized zones (of size less than 1000 µm) of the welded joint, the combined effect of RSW process and post-welding sensitisation, induced by subsequent service conditions, on the DOS. The main conclusions are:
The three weld zones (FZ, HAZ and BM) in the RSW joint have different microstructures that makes each of them respond differently to post-welding sensitisation: although the DOS varies with post-welding sensitisation time in all three weld zones, it varies at a different rate in each weld zone. The variation of the DOS with post-welding sensitisation time observed is due to the change when the DOS reaches a certain level (which can be observed when plotting the reactivation charge (Qr) versus the post-welding sensitisation time) and a microstructural regeneration occurs. The variation rate of the DOS with post-welding sensitisation time is higher in the FZ than in HAZ and BM. This phenomenon may be due to kinetics of microstructural regeneration are faster in FZ than in HAZ and BM. The base metal (without thermal effects due to welding process or post-welding sensitisation) has no reactivation and appears to confirm that reactivation of the RSW weld microstructures only occurs when the DOS reaches a certain reactivation threshold.
Footnotes
Disclosure statement
No potential conflict of interest was reported by the author(s).