
Abstract
Cost effective and fast ultra-high-temperature testing methods such as oxyacetylene torch testing are extremely useful for the rapid screening of ultra-high-temperature ceramic (UHTC) materials for hypersonic applications. There is no report in the literature, however, of an organised study to measure the heat flux and how it varies with gas flow rate, gas flow ratio and distance from the nozzle tip for an oxyacetylene flame. In this paper, the authors report for the first time the heat flux mapping of an oxidising, neutral and reducing flame. The measured heat flux was as high as ∼17 MW m−2 at a distance of 10 mm from the nozzle, which is much higher than that previously reported in the literature. Torch testing was carried out for Cf-HfB2 UHTC composites at this heat flux and the results are presented along with detailed microstructural characterisation.
Introduction
There is significant interest in the scientific community in the development of material systems suitable for ultra-high-temperature (UHT) applications. Transition metal borides and carbides including HfB2, ZrB2, HfC and ZrC are of importance for such applications because of their high melting temperatures close to or above 3000°C and the formation of highly stable products on oxidation. They are generally known as ultra-high-temperature ceramics (UHTCs).1-3 These materials have been extensively investigated as innovative thermal protection systems 4 6 and sharp leading edge components 7 9 for aerospace vehicles where oxidation and/or erosion resistance at temperatures of at least 2000°C are required. Other potential applications include control surfaces, engine inlets and exits, and engine hot flow path components. The suitability of single-phase ceramics for UHTC applications is limited owing to their poor thermal shock and defect tolerance. 10 Even with the incorporation of additional phases such as SiC or LaB6, these materials do not possess the high temperature, thermal shock or fracture toughness required. This suggests that a fibre reinforced composite approach might be beneficial. Carbon fibre (Cf) and silicon carbide fibre (SiCf) are two obvious choices, provided they can be protected at the application temperatures.
Development of test methods to characterise UHTC materials at UHT is also very important. Static furnace oxidation testing is the most commonly used method,11-13 where a sample is simply heated inside a furnace, often with ZrO2 heating elements, to achieve temperatures >2000°C. Although the heating and cooling rates can be controlled precisely, they are much lower than encountered in hypersonic applications and there is no gas flow. The peak temperature is also limited and contamination of samples from kiln furniture and heating elements has also been reported. 13
Strip heating is another technique that can be used for heating materials to very high temperatures at high heating rates.14-16 The technique is based on passing a very large current through the sample. Unlike practical applications, heating initiates from the inside of the sample. There are also restrictions on the size/geometry of the samples and it is difficult to achieve uniform heating with UHTC composites because of differences in the conductivity of the matrix and reinforcement phases.
Laser ablation testing can also be used to evaluate the high-temperature performance of materials.17-19 Common test set-ups enable the effect of high heat fluxes to be studied effectively in the absence of any gas flow, even though it is possible to add high-velocity gas streams to include the effect of continuous material removal. Nevertheless, there are difficulties associated with precise temperature measurement and restrictions with sample dimensions. The addition of external gas flow also reduces the surface temperature.
Plasma wind tunnel testing,8,20-22 arc-jet testing8,22,23 and scramjet testing 24 are highly sophisticated techniques, but are generally less accessible and very expensive to run. They can produce the most useful results out of any ground-based testing techniques, but they are not considered economically viable for the initial screening of UHTC materials.
None of the methods discussed so far can reproduce all the conditions experienced during hypersonic flight. It is also difficult to interpret the results of some of these tests because of the large number of variables that influence the oxidation and ablation processes. These include temperature, heating rate, heat flux, gas flow velocity, gas chemistry and the presence of highly reactant gas species such as atomic oxygen. Thus, it is generally accepted that the best solution is to test materials using a range of techniques to develop the best possible understanding of a material's UHT performance.
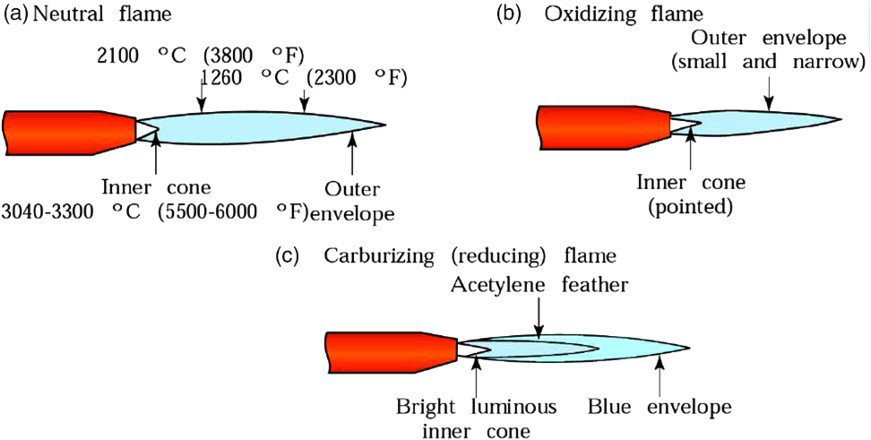
Oxyacetylene torch testing is a comparatively cheap technique that can be used for the initial characterisation or screening of materials at extremely high temperatures.25-34 High heating rates and temperatures can be easily achieved and the testing involves high-velocity gas flow and reactive gaseous species. Even though there is an ASTM standard (ASTM E285-08) for ablation testing of thermal insulation materials, the method has not gained much acceptance for the evaluation of UHTC materials owing to the lack of a knowledge of key experimental parameters. It is difficult to precisely control the temperature and, most importantly, there are no reliable data on the heat flux and how it varies with the gas flow rate and ratio. The current paper describes the mapping of the heat flux for the three basic types of oxyacetylene flame, viz., oxidising, neutral and reducing oxyacetylene flames (Fig. 1) for different gas flow rates.
35
The heat flux has been measured so that, in future, test results can be compared with results from other tests such as arc-jet testing, where the heat flux and temperature is known. Cf-HfB2 UHTC composites were tested at very high heat fluxes and their performance is reported in conjunction with microstructural characterisation.
Three basic types of oxyacetylene flames: a neutral flame, b oxidising flame and c reducing flame
35
Experimental
For this study, 30-mm diameter × 20-mm thick 2.5-D needled Cf preforms with 23 vol.-% fibres were obtained from Surface Transforms plc., Cheshire, UK, whilst phenolic resin (Cellobond J2027L) with a carbon content of ∼45.5% (at 900°C under an inert atmosphere) was obtained from Hexion Specialty Chemicals, B. V., Rotterdam, the Netherlands. HfB2 (325 mesh, <44 µm) was procured from H. C. Starck GmbH, Goslar, Germany. HfB2/phenolic resin/acetone slurries were prepared by ball milling the ingredients in a plastic container using alumina milling media for 48 h. A typical slurry consisted of 40 g HfB2, 20 g phenolic resin and 12.5 g acetone. The Cf preforms were impregnated with the prepared slurries using a vacuum impregnation technique where the preforms were fully immersed in a beaker containing the slurry placed inside a vacuum chamber. A vacuum pump was used to create the required vacuum (gauge pressure = −1 bar) inside the chamber to facilitate the impregnation of the slurry into the preforms. The impregnated preforms were dried in an air oven at 75°C for 4 h followed by curing at 150°C for 2 h. This cycle was repeated twice before pyrolysing at 900°C for 2 h using a tube furnace under flowing argon (99.998% pure) using a heating and cooling rate of 1.5°C min−1. The impregnation-drying-curing-pyrolysis cycle was repeated three times to obtain the required powder loading. Further densification was achieved using chemical vapour infiltration of carbon by Surface Transforms plc. using a commercial process. The change in mass of the samples was recorded after each stage in the preparation process and the bulk density of the Cf-HfB2 composites was measured geometrically. These ranged from 2.17 to 2.87 g cm−3.
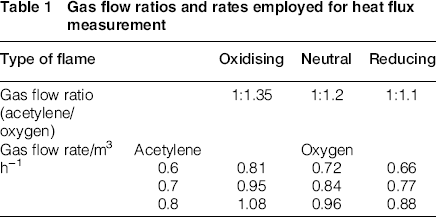
Gas flow ratios and rates employed for heat flux measurement
The torch was lit and the gas flow rates and ratios were carefully adjusted to achieve the required flame. The heat flux sensor was moved into the flame for a few seconds to produce a millivolt output corresponding to the heat flux of the flame at that particular location. The output of the sensor was logged using a high performance digital multimeter (Keithley 2100, Tektronix UK Ltd, Berkshire) connected to a computer. The heat flux was calculated by dividing the millivolt output by the sensor factor.
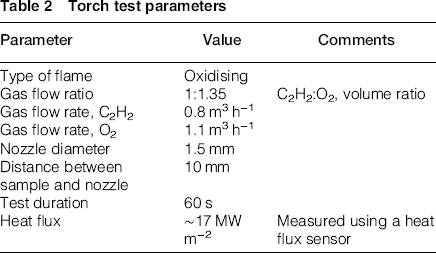
Torch test parameters
The surface and cross-sectional microstructure of the composites were analysed using a field emission gun scanning electron microscope (FEGSEM, Leo 1530VP, LEO, Elektronenskopie GmbH, Oberkochen, Germany) and the chemical composition was studied using energy-dispersive spectroscopy (EDS, EDAX, Inc., NJ, USA).
Results and discussion
Heat flux measurements
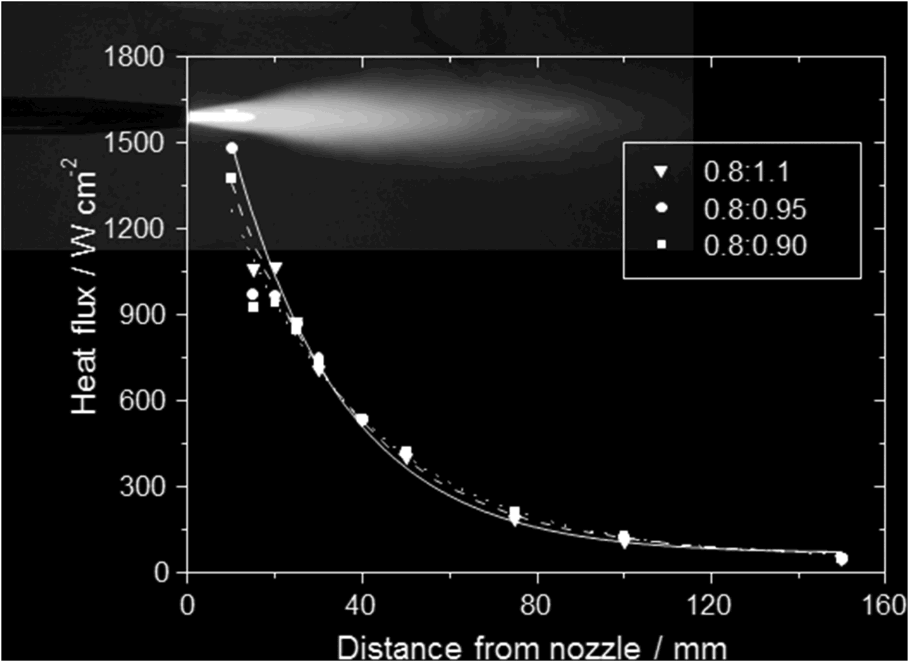
The gas flow ratios (C2H2:O2) were 1:1.35, 1:1.2 and 1:1.1 for oxidising, neutral and the reducing flames, respectively. The measured heat flux values are plotted against distance from the nozzle for all three types of flames in Fig. 2. As expected, the peak heat flux values increased from reducing (∼13 MW m−2) to neutral (∼15 MW m−2) to oxidising flame, which yielded the highest heat flux of ∼17 MW m−2
§
; all values were recorded at a distance of 10 mm from the nozzle. This is the distance where the samples were positioned during the subsequent oxyacetylene torch testing of UHTC composites. The heat flux values could be even higher closer to the nozzle, but were not measured owing to safety issues and to avoid any potential damage to the sensor. Note that the peak heat flux values were much higher than that reported for an oxyacetylene flame measured using a water cooled calorimeter (∼3.2 MW m−2).
34
The flow rates were 0.8 m3 h−1 C2H2 and 1.1 m3 h−1 O2, i.e. the typical flame employed for testing. The heat flux for the oxidising flame decreased at a slightly faster rate with the increasing distance from the nozzle compared with the neutral and reducing flames. The heat flux also slightly decreased with a decrease in the total gas flow rate at intermediate distances from the nozzle. This difference was not that apparent at shorter distances as the sensor was exposed to the hot inner cone of the flame, which dictated the spot heat flux. Figure 3 shows an image of an oxidising flame superimposed on a heat flux plot to show how the latter varies with the position of the flame.
Heat flux values measured for oxidising, neutral and reducing flames at a distance of 10-150 mm for various gas flow rates. The flow rates of acetylene and oxygen (in m3 h−1) are given in the keys Image of an oxidising flame superimposed on the heat flux vs distance plot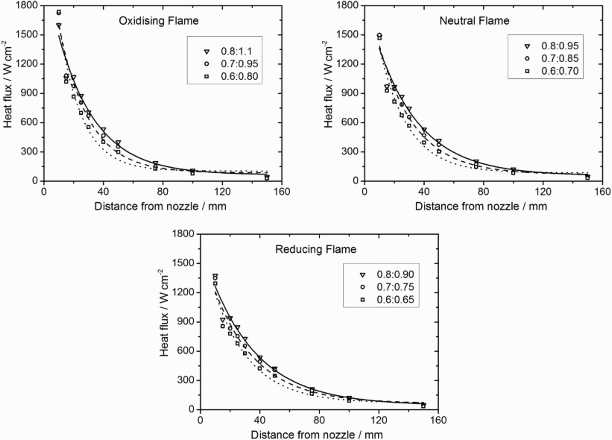
A detailed discussion on the flame chemistry is beyond the scope of this paper because of the complexity of the system. To give an idea of the latter, there are 108 species and 613 possible reactions during the oxidation of acetylene. 38
Oxyacetylene torch testing
The effect of nozzle-sample distance on the surface temperature has been studied for TaC
36
and UHTC samples
37
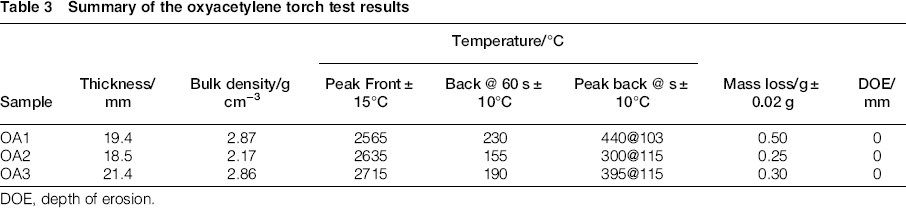
and the time-temperature profiles for the latter have been reported. Images of the samples after oxyacetylene torch testing are shown in Fig. 4 and the results are summarised in Table 3.
Photographic images of samples after 60 s oxyacetylene torch testing. a OA1, b OA2 and c OA3. The samples were 30 mm in diameter and ∼20 mm in thickness Summary of the oxyacetylene torch test results DOE, depth of erosion.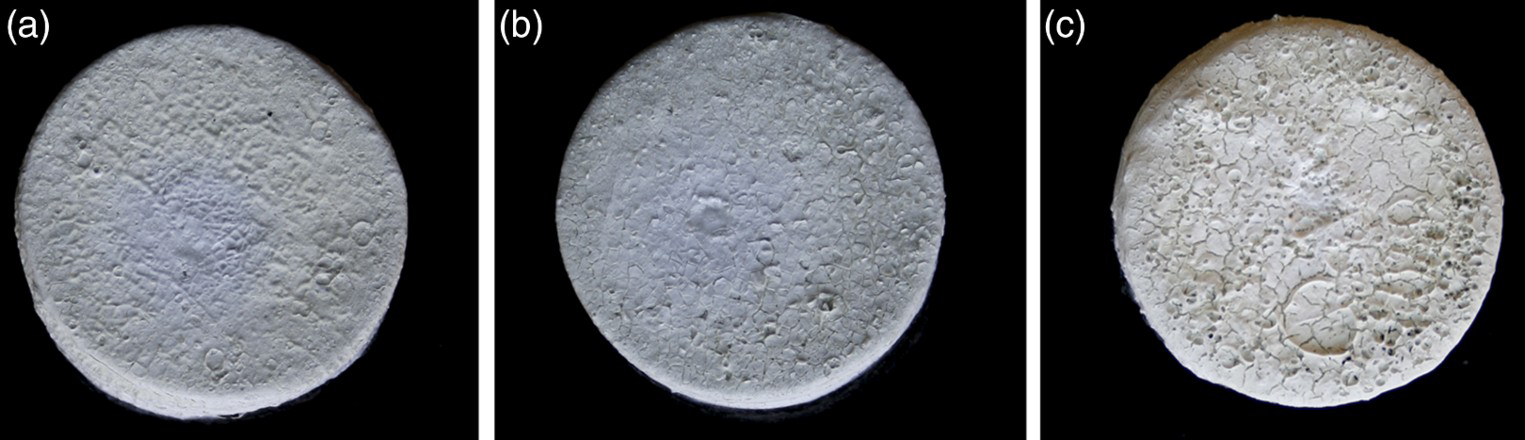
There was no surface erosion for any of the samples after exposure to ∼2600°C for 60 s. The white oxide formation on the front face of the sample indicated complete oxidation of HfB2 as discussed later. The difference in back face temperature between the samples could be the result of a difference in porosity and/or a difference in the amount of carbon (derived from the phenolic resin) present.
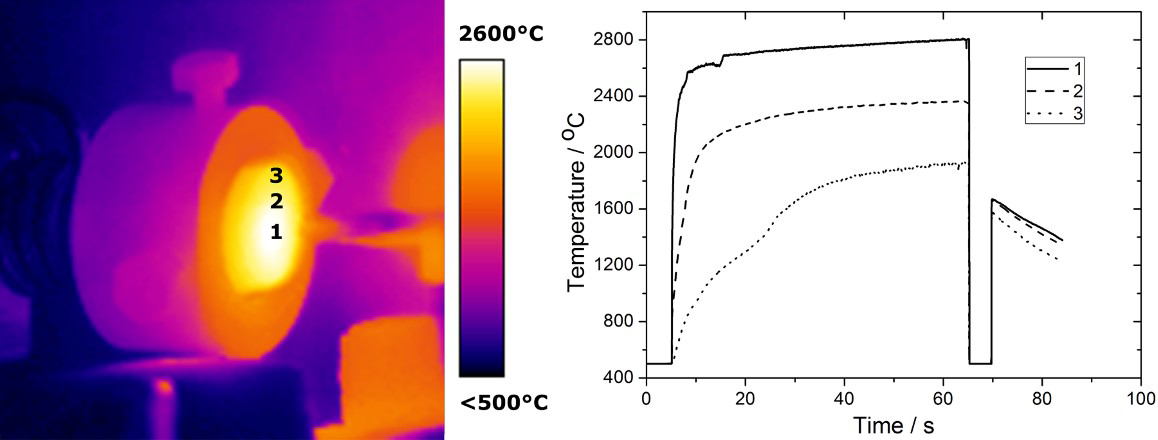
The surface microstructure of the composites after torch testing is shown in Fig. 5. A dense microstructure was observed directly below the flame tip, formed by the melting and re-crystallisation of HfO2 (Fig. 5a), whilst a porous microstructure was formed at ∼1 mm from the flame central point (fcp) owing to the escape of volatile B2O3 (Fig. 5b). Necking of the particles was observed at ∼8 mm from the fcp region where the particles have seen a lower temperature (Fig. 5c) of the order of 2200°C as measured by the thermal imaging camera. Figure 5d shows a region where the UHTC particles have seen an even lower temperature, of the order of 1800°C. No necking was observed in this region and the discontinuity between the particles was a result of the decomposition of the carbon originally present from the phenolic resin. Figure 5e is a representative EDS spectrum taken on the surface of the sample at the fcp and indicated that only HfO2 was present. A thermogram of the sample along with time-temperature plots from three different locations is given in Fig. 6, clearly indicating the temperature gradients experienced by the sample during high-temperature testing. Similar temperature gradients and the associated microstructure differences were previously reported for TaC subjected to torch testing.
36
Surface microstructure of OA1 after oxyacetylene torch testing. a At the fcp, b ∼1 mm, c ∼8 mm and d ∼15 mm from fcp. e A representative EDS of the sample surface at fcp showing only Hf and O Thermogram of a UHTC sample (OA1) highlighting the thermal gradients present during testing torch. The plots are created by extracting the data from the three points indicated. The sample was fixed inside a graphite sample holder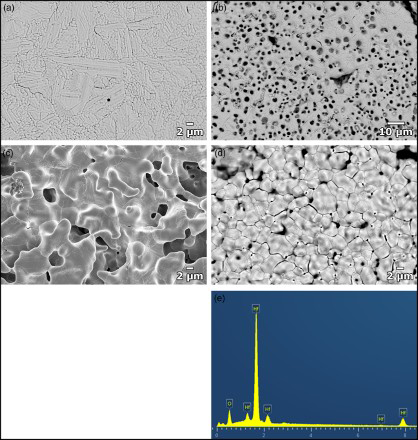
OA1 was cross-sectioned and analysed after oxyacetylene torch testing to determine the extent of oxidation. Energy-dispersive spectroscopy spectra were taken at a number of locations as indicated in Fig. 7a; Fig. 7b is a high-magnification image of the sample near the front face. A number of layers with differing concentration of UHTC powder were identified. Most of the UHTC powder is concentrated on intermediate layers formed by the needling process employed for the preparation of the 2.5-D preforms. For collecting the spectra, the locations were chosen and the magnification was increased in order to minimise any influence from neighbouring materials such as Cf or epoxy resin. The weight percentage of oxygen calculated from the spectra for each location is given in Table 4.
a Cross-section of OA1 showing the entire thickness. The numbers indicate the location where EDS spectra are collected. b A higher magnification view of the top layer (b is rotated 90° clockwise) Weight percentage of oxygen calculated from EDS spectra taken across the cross-section The tolerance is estimated to be ±1%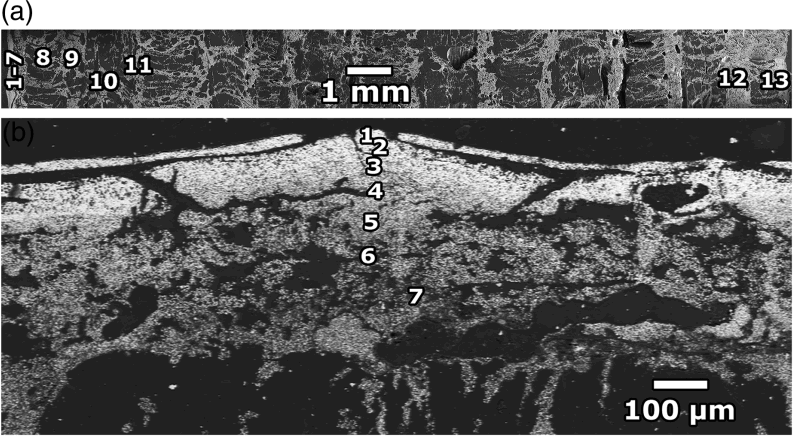
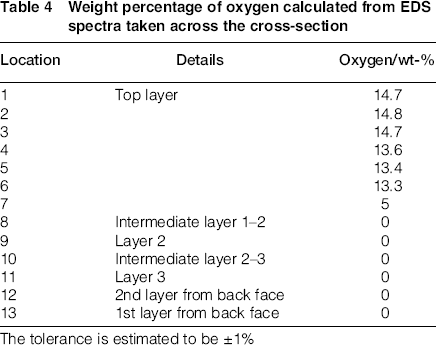
For pure HfO2, the wt-% of Hf and O are 84.8 and 15.2%, respectively, so it can be assumed that the HfB2 present at the top layer of the composite was completely oxidised to HfO2. The average thickness of the oxidised surface layer was ∼200 µm after torch testing at a temperature of ∼2600°C for 60 s. An EDS elemental map of the cross-section clearly confirmed this thickness of the oxidised layer (Fig. 8). Comparing Fig. 8c and d, it is evident that most of the oxygen signal below the HfO2 layer in Fig. 8d originated from the epoxy resin used for mounting and not from the ceramic phase.
Energy-dispersive spectroscopy mapping on the cross-section of OA1 after oxyacetylene torch testing. a Electronic image, b carbon, c hafnium and d oxygen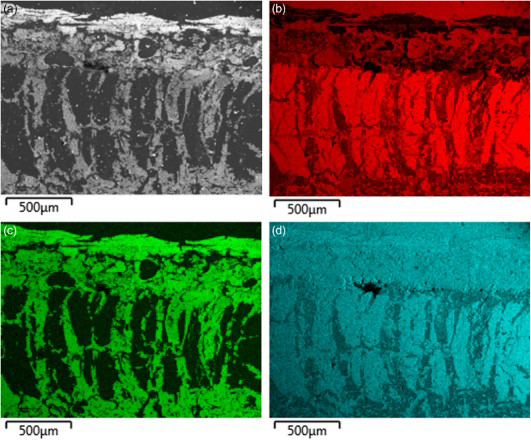
Conclusion
Heat flux mapping of the oxyacetylene flame has highlighted the high values (∼17 MW m−2) that can be achieved using this technique. This knowledge of the heat flux is valuable as the extent of damage after torch testing can be related to the heat flux experienced by the sample during testing. It will also enable comparisons between samples tested using different techniques, such as oxyacetylene, arc-jet testing and plasma wind tunnel, when the heat flux is known. The knowledge of heat flux will also enable decoupling of the effect of reactant species and Mach number on the oxidation of materials and enable tests to be carried out under predefined heat flux values using well-defined flame chemistry.
Torch testing of Cf-HfB2 composites proved their ability to withstand the UHTs generated by an oxyacetylene flame. A variety of microstructures were observed owing to the difference in temperature experienced by the composite. Energy-dispersive spectroscopy analysis confirmed the complete oxidation of UHTC particles near the exposed surface and the depth of oxidation was measured to be ∼200 µm. Further modification of the test set-up can be made in order to minimise temperature gradients on the front face during testing. This may require the use of a multi-flame nozzle in place of the current single-flame nozzle.
Footnotes
Acknowledgements
The authors thank the Defence Science and Technology Laboratory (DSTL), UK, for providing the financial support for this work under contract number DSTLX-1000015267.
‡
Now at the University of Birmingham, UK.
§
The peak flame temperature at the tip of the inner cone depends on the nature of the flame. The following values were reported in Fundamentals of Gas Cutting and Welding, Bhatia A., cedengineering.com: reducing flame, 3150°C; neutral flame, 3260°C and oxidising flame, 3480°C. Whilst the absolute values may be disputed, it is very clear that the flame temperature increases with the increasing oxygen content leading to a higher heat flux value.