
Abstract
Cf/SiBOC was fabricated from 2D carbon fabric as reinforcement and slurry-containing boron-modified phenol formaldehyde (BPF) resin with silicon as matrix resin using reaction-bonded silicon carbide method. The processing involves synthesis of (BPF) resin by reacting various amount of boric acid with phenol formaldehyde resin, polymer to ceramic transformation at 1450°C under argon atmosphere, with and without silicon, thermal transformation of the polymer matrix composite into a ceramic matrix composite and evaluation of isothermal oxidation for ceramics and its composites at 1000, 1250 and 1500°C. The ceramic studies, confirmed the formation of B4C, SiC and SiB4 (SiBOC) mixed phase and the role of boron as a catalyst for graphitisation of free carbon present in the ceramic. Oxidation of Cf/SiBOC composite at various temperatures leads to the formation of borosilicate glass which heals the cracks, hindering the inwards diffusion of oxygen.
Introduction
The Cf/SiC ceramic matrix composites (CMCs) with carbon as reinforcement and SiC as the matrix are potential materials for use in thermo-structural applications.1-3 These CMCs exhibit improved thermo-mechanical characteristics such as low density, high strength-to-weight ratio and wear resistance.4,5 The properties of CMCs are determined not only by the fibres and matrix, but also by the fibre/matrix interface. 6 So, the manufacturing method greatly influences the composite properties.
The main preparation methods of Cf/SiC composites include (1) a gas phase route, also referred to as chemical vapour infiltration (CVI), 7 (2) a liquid phase route including the polymer impregnation/pyrolysis (PIP), 8 and liquid silicon infiltration (LSI) 9 and (3) a ceramic route.10,11 Each of the above routes has their own advantages and disadvantages.
Both the CVI and PIP process suffer from longer preparation steps and both methods lead to high-performance materials but with brittle matrices.7,12,13 The conventional ceramic route is a fast densification process, yielding composites with almost no residual porosity. However, the high pressure damages the carbon fibre and further impacts the composites performance.10,11 LSI method leads to materials with quite different properties. 14 In this process, silicon carbide is formed by pyrolysis of a carbon matrix resin, infiltrated with molten silicon at a temperature slightly above the melting point of silicon. In comparison to CVI and PIP, the LSI process is relatively economical. 15,16 However, in this process, reaction of liquid silicon with carbon is not restricted to the carbon of the matrix, but it also reacts with the carbon fibre leading to poor mechanical properties. 17
To overcome the disadvantages of the LSI technique, while retaining the cost advantage, fine silicon powder was added to the polymeric precursor. Before silicon–carbon reaction occurs, silicon and carbon are distributed homogeneously within the matrix and hence the reaction is restricted mainly to the matrix.18-20 This method has been termed as ‘reaction-bonded silicon carbide method’ (RBSC). However, it is observed that, the intrinsic components of CMCs are still prone to oxidation in oxidising atmosphere.
To enhance the application regime of CMCs, the oxidation resistance of the composites has to be improved.21,22 In this respect, boron-bearing species are reported to be highly efficient. 23 They can form fluid oxide phases (B2O3 or Si–B–O ternary phase) during oxidation to fill cracks which in turn slows down the in-depth diffusion of oxygen imparting self-healing properties. 24 Previous authors have reported the introduction of a multi-layered self-healing matrix based on boron which was introduced in the SiC matrix to get silicon boron oxycarbide (SiBOC) matrix. 23 Compared to multi-layered self-healing matrix fabricated by the CVI method, synthesising boron as back bone of the matrix resin has shorter processing time and also more cost-effective. 1
Many reports are available on fabrication of self-healing Cf/SiBOC composite,1,23,25,26 but to the best of our knowledge there are no available reports on boron-modified phenol formaldehyde (BPF) resin-based Cf/SiBOC CMCs. Here, we report the synthesis and thermal transformation of BPF and silicon (BPFSi), with aim to use these polymers as precursors for ceramic matrices. The Cf/SiBOC composites were fabricated via RBSC technique. The microstructures, mechanical properties as well as oxidation behaviour of Cf/SiBOC composites, were thoroughly investigated.
Experimental
Materials
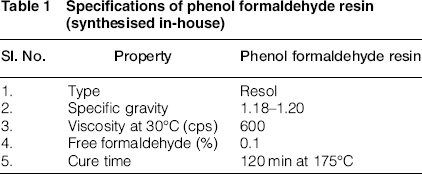
Specifications of phenol formaldehyde resin (synthesised in-house)
Synthesis of BPF resin
BPF resin was obtained according to the procedure reported earlier (Scheme 1).
27
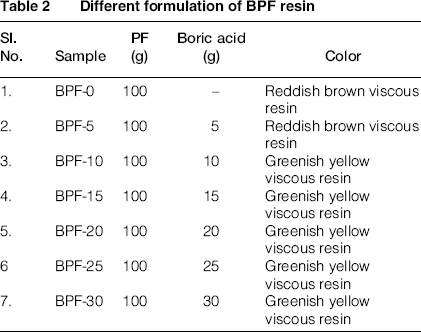
The concentration of boric acid was varied from 5 to 30 pph (as shown in Table 2). The concentration of boric acid could not be increased beyond 30 pph as it precipitated in solution. PF resin is soluble in acetone, whereas the BPF resin synthesised was insoluble in acetone.
Synthesis of BPF resin Different formulation of BPF resin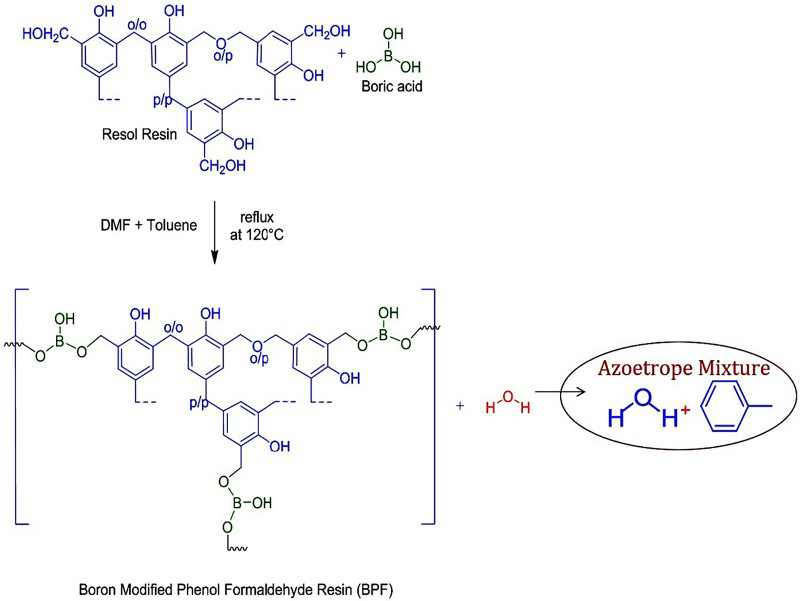
Methods
Functional group characterisation of BPF resin was done from FT-IR spectra (Perkin Elmer Spectrum GX spectrometer). The structural evolution of obtained ceramics was studied using X-ray diffraction (XRD, Bruker D8 discover) using Cu-Kα radiation (40 kV, 40 mA; step scan of 0.051, counting time of 5 s/step and 1.5460 A°). The crystallite size of carbon was calculated using Scherrer equation of (004) plane; D = kλ/(βcosθ), where D is the average crystallite size, k is the coefficient, which is generally taken as 0.94, λ is the wavelength of X-ray radiation equal to 1.5406 Å, β is full width at half maximum (FWHM) measured in radians and θ is the Bragg's angle. The nature of free carbon in the ceramics was understood using Raman spectra recorded with a WITec alpha 300R confocal Raman microscope using frequency doubled Nd: YAF laser of excitation wavelength 532 nm and high-resolution transmission electron microscope (HRTEM, Technai 30 G2, S-TWIN). HRTEM samples were prepared by finely powdering the ceramics into submicron-sized particles and dispersing these in acetone to form uniform slurry. A drop of the slurry was transferred to a carbon-film-coated TEM grid. For the evaluation of mechanical properties, the CMCs were cut into 60 × 9 × 3 mm3 coupons. Flexural strength was measured using three-point-bending test, INSTRON-5569 (upper span 7 mm and lower span 20 mm) as per the ASTM C 1341. Isothermal oxidation of ceramics and the CMCs was done in a raising hearth furnace (Fitzer Instruments India Pvt. Ltd). The morphological features were analysed using scanning electron microscopy (SEM, JEOL JED-2300). The elemental analysis of ceramics obtained at 1450°C was determined as shown in the Section ‘Elemental analysis’.
Polymer-to-ceramic transformation
In the first step, the synthesised BPF resins (Table 2) were pyrolysed at 1450°C in argon atmosphere to obtain boron and carbon (BC) containing ceramics. In the second step, BPF resin was blended with stoichiometric amount of silicon powder (designated as BPFSi) with respect to carbon obtained at 1450°C during pyrolysis of PF, i.e. ratio of Si:C = 2.33:1. The mixture was ball milled for 120 min to obtain uniform slurry, followed by curing at 175°C and pyrolysis at 1450°C in argon atmosphere to get silicon, carbon and boron-containing ceramics (designated as SiBOC). The flow chart of the process is as shown in Scheme 2.
Flow chart for the pyrolysis of BPF and BPFSi resin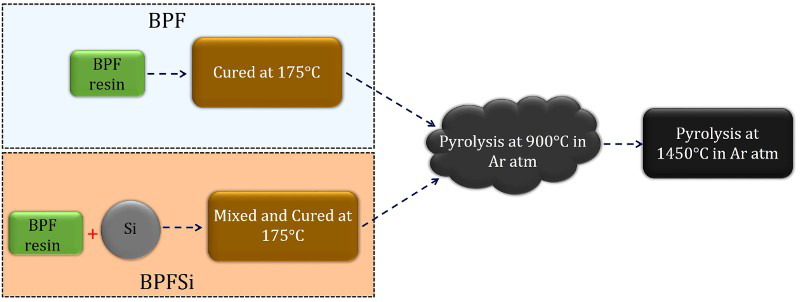
Elemental analysis
Estimation of carbon and oxygen
The percentage of carbon and oxygen present in ceramics was determined using a Perkin Elmer Elemental Analyzer (Model PE 2400). The analyser was based on the Flash dynamic catalytic combustion of samples into simple gases. The system used a steady-state wave-front chromatographic approach to separate the mixture of gases. The separated gases were detected as a function of thermal conductivity.
Estimation of silicon
The ceramics were converted into its sodium salt by sodium carbonate fusion. The extract was dehydrated with perchloric acid and ignited, and then volatilised with hydrofluoric acid. The residue obtained was ignited and weighed. The loss in weight represents the silica formed.
28

Estimation of boron
About 1–2 g of the oligomer and 5 g of anhydrous sodium carbonate were mixed thoroughly and taken in a platinum crucible and heated in a furnace to 1000°C. The melt was dissolved in water and digested. It was filtered through a filter paper and the pH of the filtrate was adjusted to 3.5 with dilute H2SO4 and heated to remove any carbonic acid formed. The filtrate was titrated against standardised sodium hydroxide. Mannitol solution was added and the titration was continued till mannitol borate equivalent point (near pH 8.1) was reached.
28

Fabrication of Cf/SiBOC composite
Two-dimensional (2D) preforms were fabricated from 2D carbon fabric as reinforcement and BPFSi as the matrix resin using the standard RBSC procedure as reported earlier
18
(Scheme 3). Finally, the Cf/SiBOC composites were machined to evaluate flexural strength and oxidation stability.
Schematic of processing method for Cf/SiBOC composites by RBSC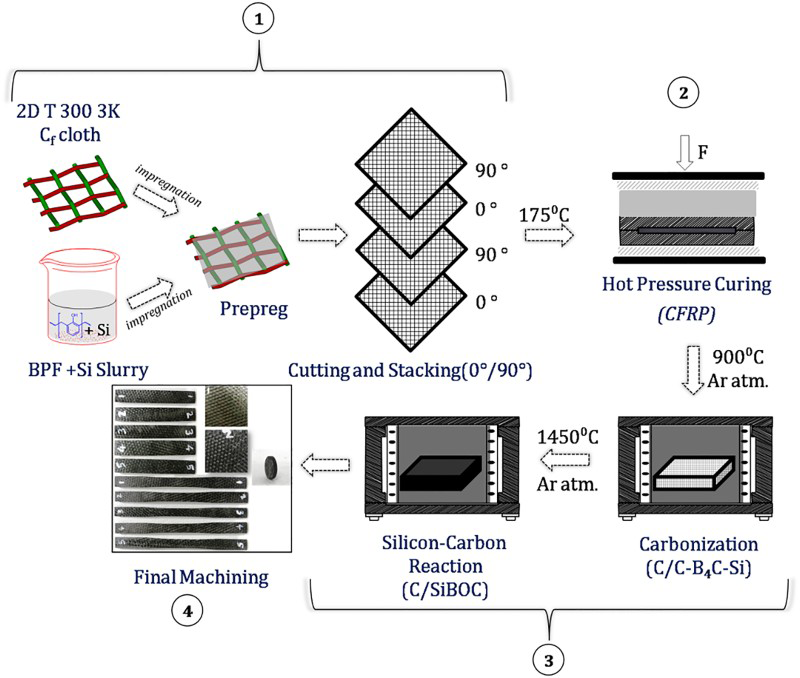
Oxidation tests
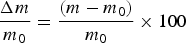
The samples were oxidised isothermally at three different temperatures 1000, 1250 and 1500°C in a raising hearth furnace at an air flow rate of 100 cm3 min−1 for 3 h with 30 min interval. The change in weight was calculated using the formula
Results and discussion
Synthesis and characterisation of BPF resin
The BPF resin was synthesised by reacting boric acid (5–30 pph) with PF resin. The PF resin consists of phenolic hydroxyl and methylol groups of which methylol groups are far more reactive functional groups when compared with phenolic hydroxyl groups. 29 The reaction of boric acid with methylol groups precedes that of boric acid with phenolic hydroxyl groups, as shown in Scheme 1.
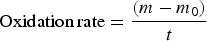
Figure 1 shows a FT-IR spectra of BPF resins and b magnification in the range from 3800 to 2800 cm−1 and 1650 to 1250 cm−1. The band which appears around 1098, 1385, 1475 and 3250 cm−1 corresponds to C–O–C, B–O–C, C–H and B–OH stretching, respectively. The formation of B–O–C linkage proves that boric acid has chemically reacted with PF resin by the condensation of boric acid with PF resin as reported earlier.
27
In addition, the presence of B–OH group indicates that, all the –OH groups in boric acid are not involved in the condensation reaction with methylol group which might be due to steric hindrance by phenolic groups.
30
It was also observed that, on increasing the concentration of boric acid, both B–OH and B–O–C stretching frequency shifted from 3240 to 3374 cm−1 and 1385 to 1365 cm−1 (Fig. 1b), respectively. This may be due to the interactions by the local electron density of the newly formed B–O–C group.31,32 Moreover, by increasing the concentration of boric acid, the intensity of B–O–C stretching band increases which proves beyond doubt that boric acid has chemically reacted with PF resin.
a FT-IR spectra of BPF resins and b magnification in the range from 3800 to 2800 cm−1 and 1650 to 1250 cm−1
Pyrolysis of BPF at 1450°C
As our objective was to make polymer-derived ceramic matrices, we have subjected BPF to pyrolysis at 1450°C in argon atmosphere (as shown in Scheme 2) and the structural evolution of the resultant ceramics was studied by XRD, Raman spectroscopic and HRTEM techniques.
XRD of BPF resin pyrolysed at 1450°C
The XRD pattern of the ceramic samples obtained from BPF resins after pyrolysis at 1450°C in argon atmosphere is as shown in Fig. 2. For BC-0, two broad diffraction peaks centred at 2θ = 24.9° and 43.2° are present, which corresponds to (002) and (004) planes of glassy carbon (PDF 89-8493), respectively. In the presence of boron, for BC-5 to 25, in addition to the peaks at 2θ = 24.9° and 43.2°, two other peaks at 2θ = 35.5° and 37.6° were observed, which corresponds to (104) and (021) planes of boron carbide (PDF 65-6874), respectively. For BC-30, new peaks were observed at 2θ = 14.5°, 27.7° and 40.1° which is not observed in other systems. The peaks at 2θ = 14.5° and 27.7° represent (101) and (021) planes of boron carbide (PDF 65-6874) present in the matrix of the carbon
33
and the peak at 2θ = 40.1° corresponds to boron oxide (PDF 06-0643).
XRD of BC ceramics derived for BPF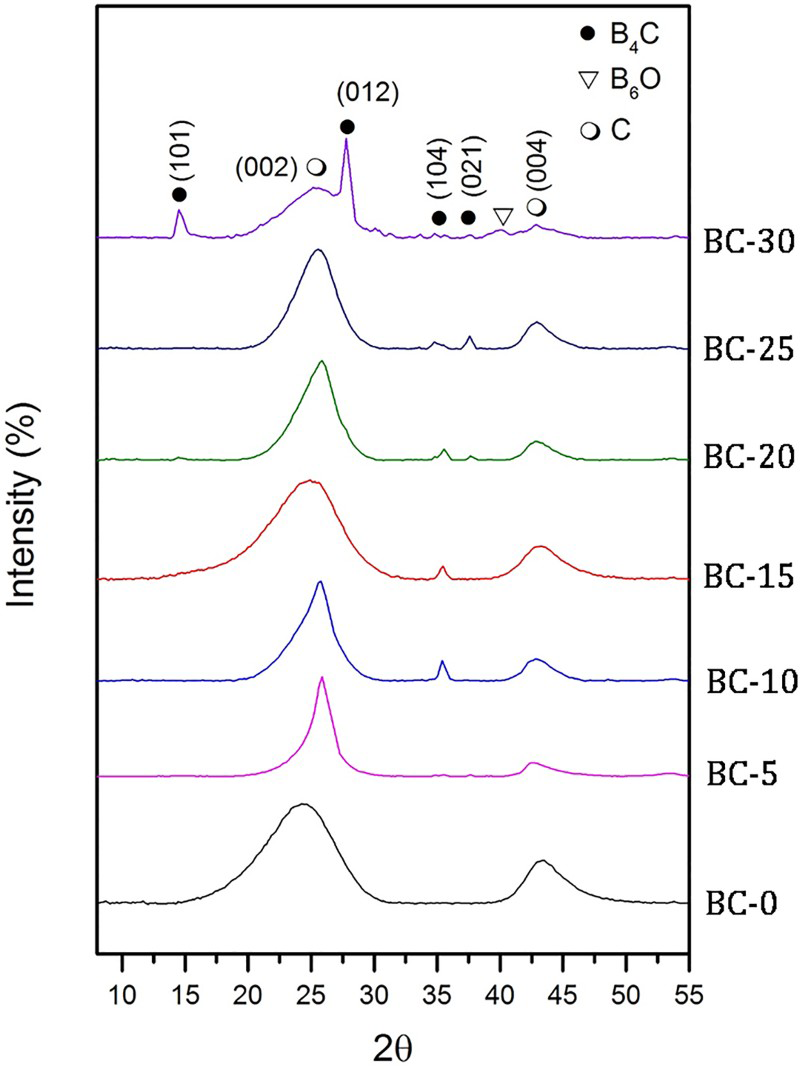
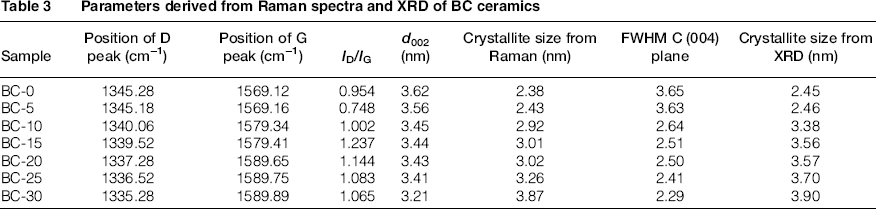
Parameters derived from Raman spectra and XRD of BC ceramics
Raman spectra of BPF resin pyrolysed at 1450°C
Further, structural information on free carbon present in BC ceramics was understood using Raman spectral analysis. In BC ceramics, there were two specific absorption peaks (as shown in Fig. 3) within the ranges of ∼1335 cm−1 (D-band) and ∼1565 cm−1 (G-band), respectively, indicating the presence of free carbon. Ceramics are heterogeneous systems and hence in the case of BC-25 and BC-15, in addition to free carbon peaks, B4C peaks were also observed. These low-intensity peaks in the range of 700–1050 cm−1 can be attributed to stretching vibrations in the C–B–C chains of B4C.
35
Raman spectra of the BC ceramics derived for BPF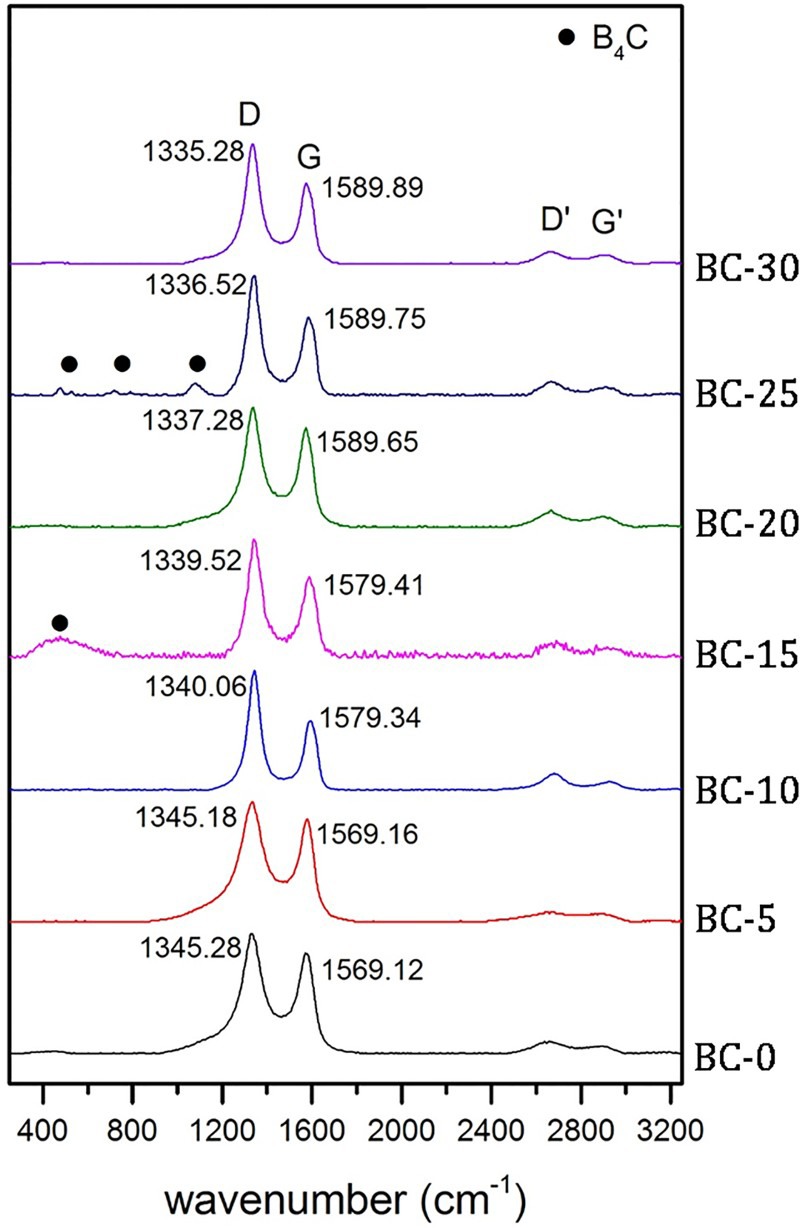
As per the literature, 36 increase in frequency of G band or a decrease in frequency of D band reflects the degree of the order in carbon. It was observed that there was an increase in the G-band and a decrease in the D-band from BC-0 to BC-30 with the incorporation of boron (as shown in Table 3). In addition, the D-band shifted to 1335 cm−1 (BC-30) from 1345 cm−1 (BC-0). The changes observed in the Raman spectra of BC indicates the rearrangement of crystalline structure leading to an increase in graphitic ordered structure followed by subsequent decrease in amorphous structure (Fig. 3). These rearrangements leading to graphitic ordered structure provides superior mechanical strength and oxidation stability to ceramics. 37
Further information on free carbon present in BPF-derived BC ceramics can be obtained by calculating the ratio of intensities of D band (ID) and G band (IG). By increasing the concentration of boron, the ID/IG value shows an increase from BC-0 to BC-15 and then it shows a decrease from BC-15 to BC-30 (Fig. 4).
Variation of ID/IG with interplanar distance (d002) of free carbon present in BC ceramics HRTEM image of a,b BC-0; d,e BC-10; g,h BC-15 and j,k BC-30 along with their corresponding SAED pattern c,f,i and l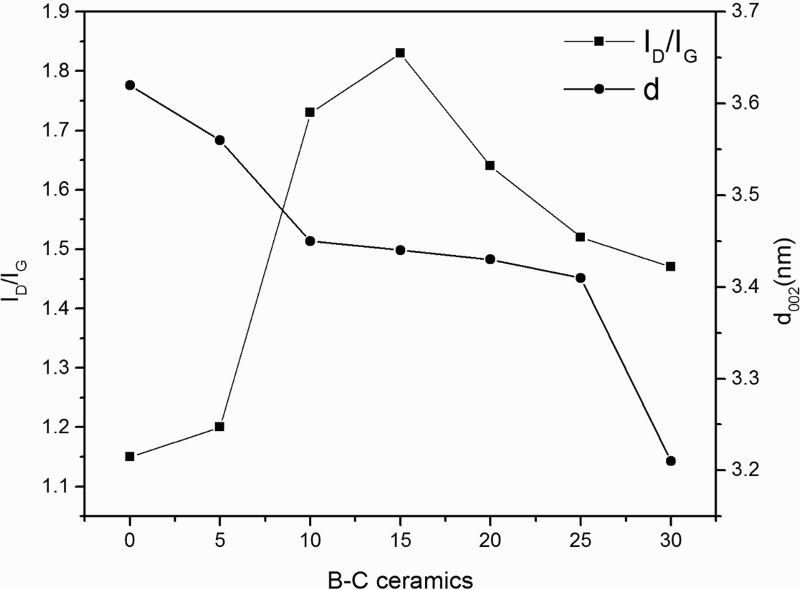
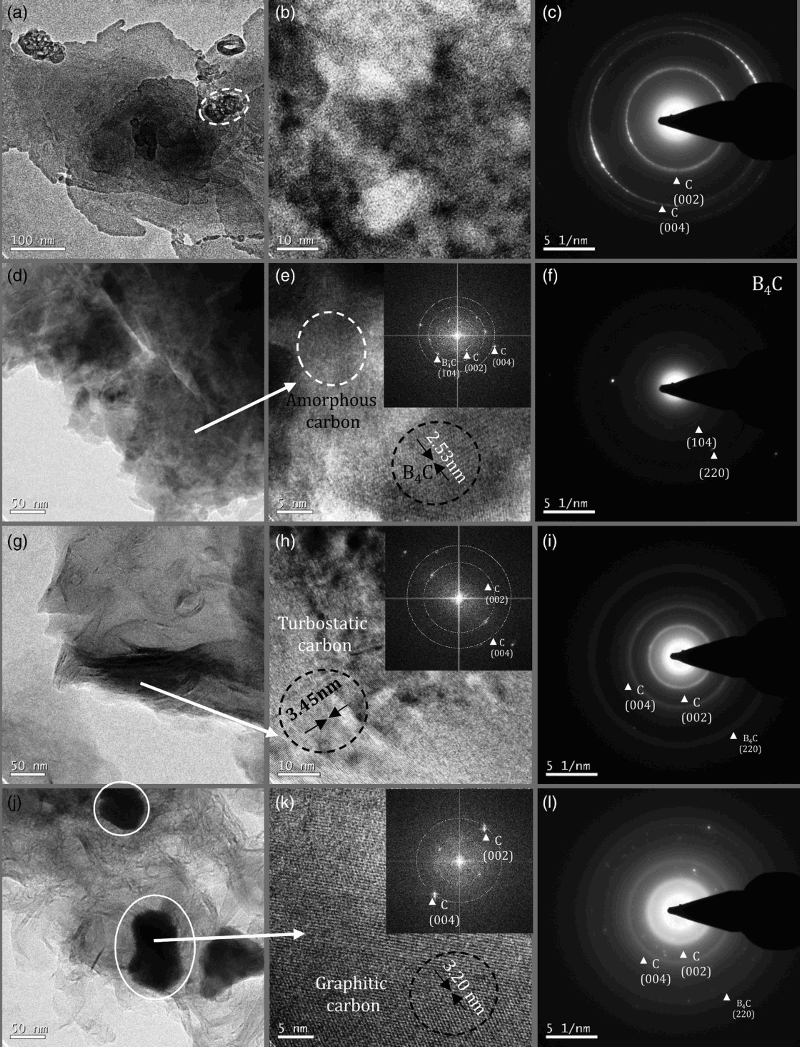
It is reported that,38,39 for amorphous carbon (BC-0 to BC-15) the ID/IG value is directly proportional to the crystallite size (La), and for crystalline carbon (BC-20 to BC-30) the ID/IG value is inversely proportional to the crystallite size (La). From the trend in ID/IG value, it can be concluded that, the morphology of free carbon changes from BC-0 to BC-30. BC-15 is the critical point where the phase transformation has taken place from amorphous carbon to crystalline carbon and the results fall in line with crystallite size obtained from XRD as well.
On correlating the interplanar distance (d) and crystallite size (La) with the concentration of boron, it can be seen that on increasing boron concentration, the crystallite size increases and the interplanar distance decreases. This results in the ordering of layers in plane and increase in stacking of the carbon layers leading to the formation of graphitic carbon.
From XRD and Raman spectral studies of BC ceramics, it was clear that phase transformation has taken place from BC-0 to BC-30. Previous researchers have used XRD and Raman spectroscopy as a tool to explain the phase transformation of carbon in the presence of boron.36,39-41
HRTEM of BPF resin pyrolysed at 1450°C
Elemental analysis for BC ceramics obtained at 1450°C in argon atmosphere
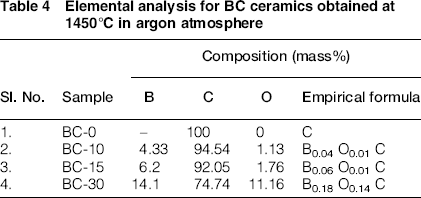
Figure 5a represents HRTEM of BC-0, where the glassy carbon is clearly visible. Glassy carbon is a form of carbon that is produced by carbonising a phenolic resin under carefully controlled conditions of temperature and pressure. 42 The glassy carbon is composed of fine ribbon-like structures which are entangled and randomly inter-weaved with each other. In the case of BC-10, the carbon was in amorphous form which was confirmed through SAED pattern (Fig. 5f). In addition, FFT pattern of BC-10 (Fig. 5e) confirms the presence of boron carbide lattice having d(104) spacing of 2.53 nm. HRTEM image of BC-15 (Fig. 5h) clearly shows the presence of turbostatic carbon having d002 spacing of 3.45 nm. In addition to these three distinct carbon structures, additional morphological features were also observed. In BC-30 ceramic, boron carbide nano-crystals with a size of less than 50 nm were observed (Fig. 5j) either on the edge of the granular particles or in the matrix of the graphitic structures, as indicated by circles. The existence of boron carbide in the BC-30 was identified by the SAED pattern (Fig. 5l) and the FFT pattern of BC-30 (Fig. 5k) which shows the graphitic carbon lattice having d002 spacing of 3.20 nm. From these results, the phase transformation of glassy carbon (BC-0) to graphitic carbon (BC-30) on incorporation of boron has been confirmed without any doubt. From HRTEM analysis of the BPF-derived ceramic matrix, it is evident that there is a gradual graphitisation pattern from BC-0 to BC-30. This phenomenon may be attributed to the catalytic effect of boron. 43
From the XRD and HRTEM of BC 30, it was observed that boron carbide (012) has crystallised out from the carbon matrix. So, from the result of elemental analysis of boron (Table 4), it can be concluded that at boron wt-% of 14.1 (BC 30), boron carbide has precipitated out from the carbon matrix. In the case of BC-10 (B wt-% 4.33) and BC-15 (B wt-% 6.2), boron may exist at the interstitial position of carbon. 44 On increasing boron concentration, boron promotes the graphitisation of glassy carbon by means of ‘bond-breaking mechanism’ and removes defects by replacing the carbon atoms in the graphite lattice. 45 As a result, interplanar distance decreases from d002 = 3.62–3.20 nm and leads to a rearrangement of the glassy carbon into graphitic carbon.
Pyrolysis of BPFSi at 1450°C
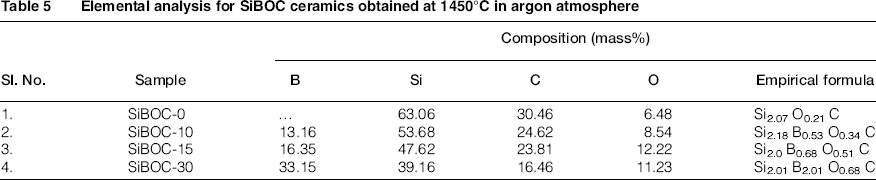
Elemental analysis for SiBOC ceramics obtained at 1450°C in argon atmosphere
XRD of BPFSi pyrolysed at 1450°C
Figure 6 shows the X-ray diffraction pattern of the ceramic samples obtained from BPFSi after pyrolysis at 1450°C in argon atmosphere. For SiBOC-0, peaks corresponding to β-SiC appeared at 2θ = 35.6°(111), 41.3°(200), 59.9°(220), 71.7°(311) and 75.4°(222) (PDF 74-2307) and carbon peak appeared at 2θ = 24.9° (PDF 89-8493). In the presence of boron, for SiBOC-5 and SiBOC-10, in addition to the peaks observed for SiBOC-0 ceramic, new peaks corresponding to SiB4 phase appeared at 2θ = 28.6° (110), 47.5° (205) and 56.3° (125). For SiBOC-15 to SiBOC-30, the carbon peak at 2θ = 24.9° disappears, whereas the intensity of SiB4 peaks at 2θ = 28.6° (110), 47.5° (205) and 56.3° (125) increases.
XRD of SiBOC mixed ceramics derived for BPFSi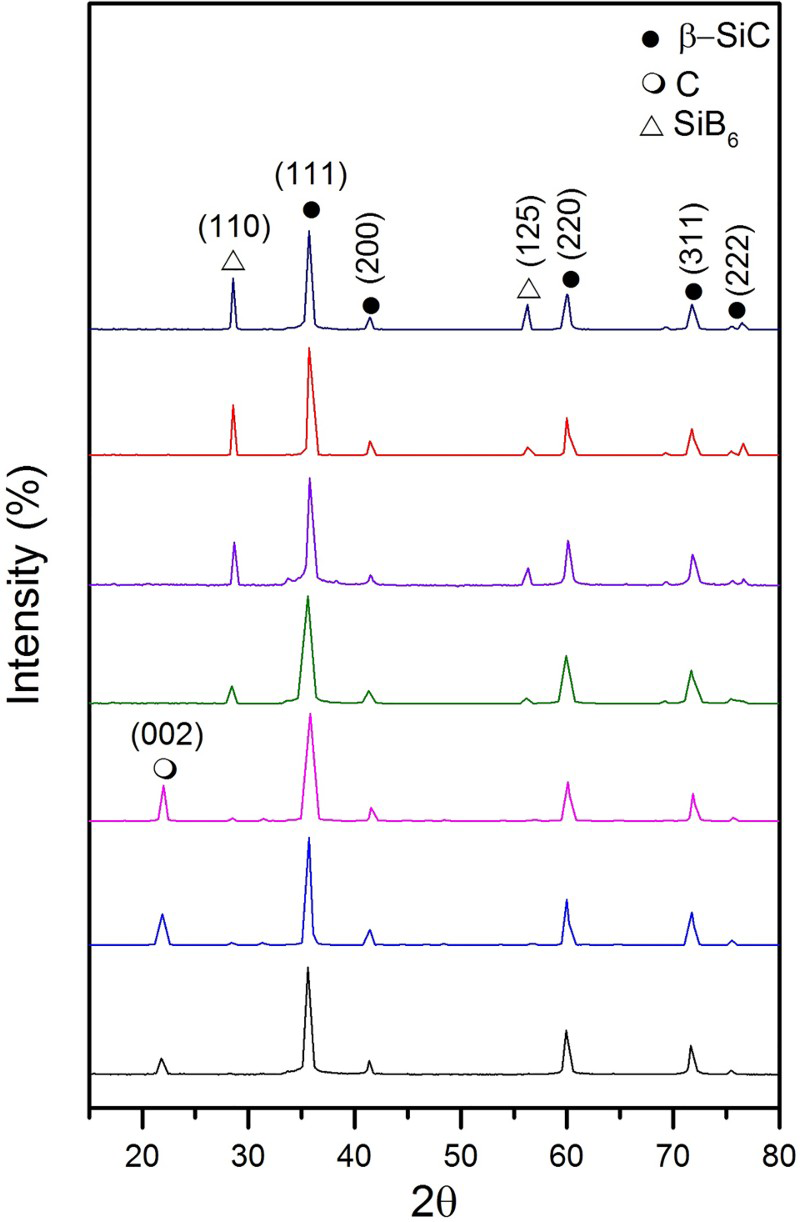
In the case of SiBOC-0 to SiBOC-10, the peak at 2θ = 24.9° corresponds to free carbon present in the ceramics. With high boron content in the case of SiBOC-15 to SiBOC-30, the boron will react with free carbon present in the ceramics to form B4C. At elevated temperatures, Si atoms may replace ‘C’ atoms in the C–B–C chain of icosahedron B4C, which leads to the formation of silicon boride. The replaced ‘C’ atoms may react with excess Si, leading to the formation of SiC
46
and the reactions are as shown in equations (3)–(5). This explains the disappearance of carbon phase and appearance of SiB4 phase in the ceramics.


Oxidation behaviour and microstructural of SiBOC ceramics
In order to evaluate the oxidation behaviour, typical ceramics (SiBOC-0, SiBOC-10, SiBOC-15 and SiBOC-30) were oxidised isothermally at 1000°C, the associated weight change and the oxidation rates were calculated (see the Section ‘Oxidation tests’).
Figure 7a shows the weight change (%) of oxidised SiBOC ceramics. In the presence of boron, increase in weight was observed for all the formulations due to the possible chemical reaction as shown in equations (7) and (9). As the concentration of boron increases, the concentration of fluid oxide phase (B2O3 (l) and SiO2 (l)) also increased leading to further increase in weight. In the case of SiBOC-0, weight loss was observed initially followed by a slight weight gain. The weight loss may be due to the presence of free carbon which gets oxidised at 400°C as shown in equation (6). In Fig. 7b, it can be seen that, in the presence of boron, the oxidation rate of the ceramics decreases. This is due to the formation of borosilicate glassy phase B2O3·xSiO2 (equation (9)) from a solution of SiO2 with B2O3 formed during the oxidation of SiB4 (equation (7)).
47
Isothermal oxidation at 1000°C in air for 3 h, showing a weight change (%) of oxidised SiBOC ceramic, b oxidation rate of SiBOC ceramic, c the SEM image of the SiBOC ceramic before oxidation and d SEM image of oxidised SiBOC ceramics at the interval of 1, 2 and 3 h

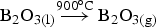

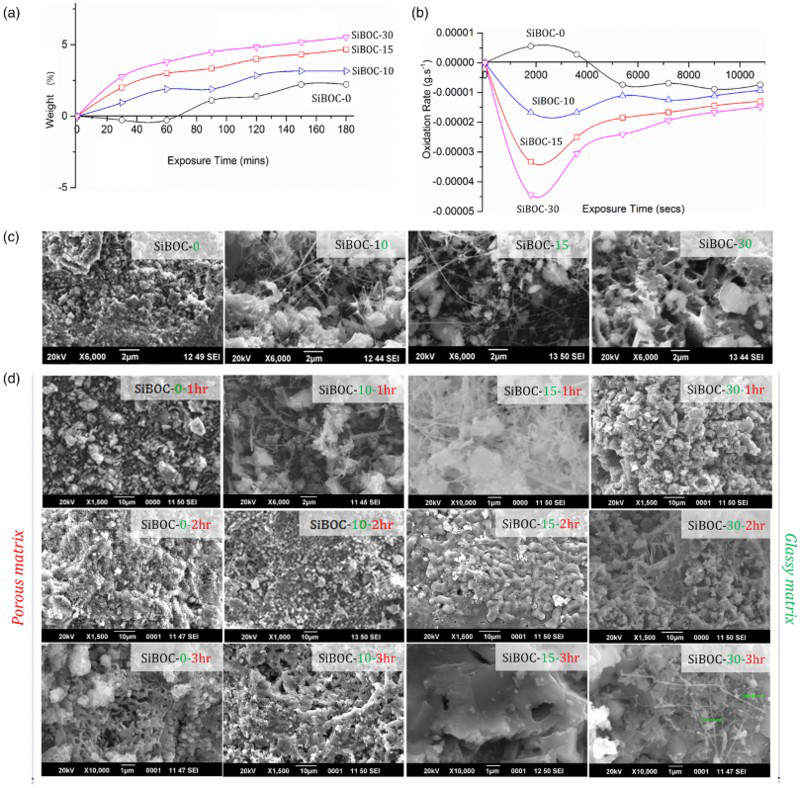
Figure 7c shows the surface morphology of SiBOC ceramics before oxidation, where SiBOC-0 and 30 show the presence of porosity in the matrix. It was observed that, as the oxidation exposure time for SiBOC-0 increases, the porosity level in the ceramic matrix also increases, this may be due to oxidation of free carbon present in the ceramics. 47 In the presence of boron, a glassy layer was formed on the surface of the ceramics which confirms the formation of fluid oxide material as per equations (7) and (9). As the oxidation time increases from 1 to 3 h for SiBOC-30, the concentration of fluid oxide (B2O3·xSiO2) also increases. This layer is responsible for protection of CMCs under severe oxidative atmosphere.48,49 Volatilisation of B2O3 phase can happen for ceramic matrix with low boron content as shown in equation (8).48,50 Hence, prolonged oxidation of SiBOC-10 leads to the formation of pores in the matrix (SiBOC-10-3h) due to B2O3 volatilisation.
In SiBOC-10 and SiBOC-15, nano/micro-whisker formation was seen and the concentration of these nano/micro-whiskers increases with the oxidation time (Fig. 7d). Oxidative decomposition of SiB4 results in formation of B2O3 and SiO2 (equation (7)). A liquid phase is formed due to miscibility of B2O3 with SiO2 and this helps in bringing silica and carbon in close contact which subsequently reacts to generate SiBOC whiskers. 51 Thus, boron acts as a catalyst for the formation of SiBOC whisker. This observation suggests that the whiskers may have grown by a vapour liquid solid mechanism. 52
Cf/SiBOC composite fabrication
Our studies proved that SiBOC obtained from BPFSi shows self-healing behaviour and so it was of interest to use it as preceramic matrix resin for the fabrication of carbon fibre-reinforced CMC (Cf/SiBOC). CMCs were fabricated using BPFSi-0, 10, 15 and 30 (Scheme 3) and preliminary mechanical properties were evaluated.
Evaluation of flexural strength
Figure 8a shows the typical stress–strain curves for the flexural strengths of the CMCs. Figure 8b shows the average flexural strength for carbon fibre-reinforced with different matrix composition (Cf/SiBOC-0, Cf/SiBOC-10, Cf/SiBOC-15 and Cf/SiBOC-30). It is expected that BPFSi as matrix resin will improve the mechanical strength due to the formation of β-SiC and SiB4 ceramics. However, it is observed that the improvement is marginal, i.e. maximum flexural strength obtained for Cf/SiBOC-30 was only 46 ± 1.6 MPa (ρ = 2.2 g cm−3) (Fig. 8b). The major reason for the low mechanical properties is that SiBOC matrix is very brittle and hence crack reaches the saturation point very fast and fibre fails in a brittle manner. The brittle failure of the composite was observed in the SEM image (Fig. 8c) which clearly shows lack of fibre pull out, indicating strong fibre–matrix bonding in the absence of an interphase coating.
53
Another reason can be that the presence of elemental silicon (melting point ∼1390–1410°C) and oxygen in the matrix can react with carbon fibre causing a reduction in strength of the fibre which has been proved with spot-EDX (energy-dispersive X-rays) analysis (Fig. 8d–f). The EDX was recorded for the top surface (plateau) of the fractured carbon fibre (Fig. 8e) and the carbon fibre side walls (Fig. 8f) of Cf/SiBOC-0 composite. It reveals that, the side wall of the carbon fibre is enriched with silicon 22.57 wt-% as compared to 6.05 wt-% on the top surface (plateau) of carbon fibre. The morphology of the carbon fibre side walls (Fig. 8d) clearly indicated that, it has been damaged by reacting with elemental silicon to form thin polycrystalline SiC layer which has led to reduction in the flexural strength of the Cf/SiBOC composites. This phenomenon may not exist in the presence of an interphase-coated carbon fibre (such as PyC or h-BN) which is reported to help in crack deflection and acts as a diffusion barrier.
23
This aspect is being further investigated by our team and will be communicated later.
a stress–strain diagram of Cf/SiBOC from a flexural strength, b comparison of average flexural strength of Cf/SiBOC along with its densities, c SEM image of fractured surface of Cf/SiBOC-0, d SEM image of the top surface (plateau) (blue) and side wall (orange) of carbon fibres, showing the thin polycrystalline SiC product layer on the side wall, e and f show the EDX for top surface (plateau) and side wall of carbon fibre, respectively
Oxidation of Cf/SiBOC composite and its microstructure
Cf/SiBOC composites were oxidised isothermally at three different temperatures 1000, 1250 and 1500°C in raising hearth furnace at the flow rate of air 100 cm3 min−1 for 3 h with 30-min intervals. The weight change and the oxidation rate were calculated as mentioned in the Section ‘Oxidation tests’.
Figure 9a and b shows the percentage weight change and oxidation rate of Cf/SiBOC composite, respectively. The weight loss was observed for the entire composite (Fig. 9a) and it increases with exposure time, indicating that oxygen has diffused into the Cf/SiBOC composite, resulting in the oxidation of the carbon phase (equation (10)). The weight loss is most predominant in the case of Cf/SiBOC-0 composite. Obviously, the increase of exposure time has led to the acceleration of the oxidation rate (Fig. 9b). Theoretically, the formation of B2O3 and SiO2 in the case of boron incorporated composite could lead to increase in weight (equation (11)) but loss in weight was observed experimentally due to predominant consumption of carbon. After oxidation for 1 h (Fig. 9b), the oxidation rate of the composite decreased due to the formation of B2O3, B2O3·xSiO2 and SiO2 phases at 1000, 1250 and 1500°C, respectively (as shown in equations (11)–(15)) which acts as self-healing film and hence subsequently hinders the diffusion of oxygen into the intra-bundle pores of the composite.
Isothermal oxidation at 1000, 1250 and 1500°C in air for 3 h, showing a percentage weight change of Cf/SiBOC composite, b oxidation rate of Cf/SiBOC composite, c the SEM image of the Cf/SiBOC composite before oxidation and d the SEM image of the Cf/SiBOC composite after oxidation


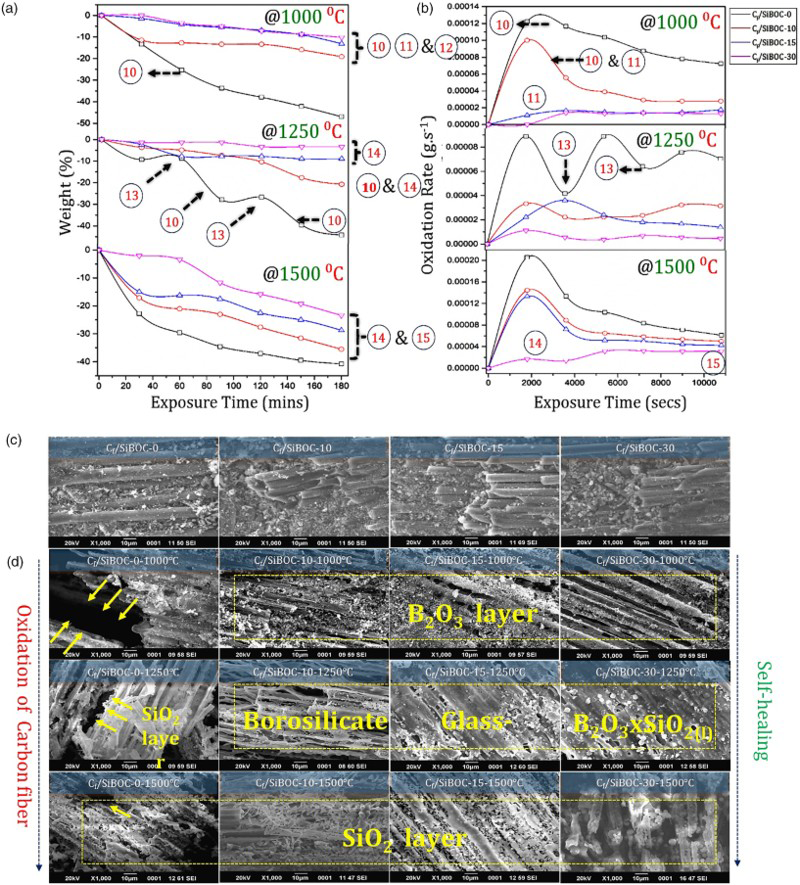
Further insight into the oxidation behaviour of the composites can be obtained from SEM studies. The SEM images of Cf/SiBOC composite before and after oxidation tests are as shown in Fig. 9c and d, respectively. In the case of Cf/SiBOC-0-1000°C composite, the exposed carbon fibres get oxidised leading to considerable weight loss, while the matrix remains intact. The voids present in Cf/SiBOC-0 at 1000, 1250 and 1500°C composite are caused due to the oxidation of fibres (as indicated in Fig. 9c) which becomes the pathway for oxygen to enter into the composite and hence results in a damage. It was expected that Cf/SiBOC-0-1250°C composite will form SiO2 layer which will protect the carbon fibre from oxidation. However, it is observed that the holes formed at 1000°C has become a pathway for the oxygen to enter into the system, 52 which leads to further weight loss at 1250 and 1500°C. This is reflected in the percentage weight loss (Fig. 9a) where we can see two-step weight losses in the case of Cf/SiBOC-0-1250°C composite. In the case of boron-bearing composite (Cf/SiBOC-10, Cf/SiBOC-15 and Cf/SiBOC-30), SiBOC matrix oxidised to form B2O3, B2O3·xSiO2 and SiO2 phases at 1000, 1250 and 1500°C, respectively, as per equations (11)–(15). The formation of these phases led to the healing of micro-crack in the SiBOC matrix and protected the carbon fibre from oxidation. Increasing the concentration of boron further increased the self-healing properties of Cf/SiBOC composite.
From the above results, it is proved that boron incorporated, i.e. Cf/SiBOC-10, 15 and 30 ceramic composites displayed better oxidation resistance compared to a Cf/SiBOC-0 due to the existence of SiB4 ceramics. However, in order to improve the oxidation as well as the reusability of the Cf/SiBOC composite materials, a suitable interphase coating on the fibre has to be employed in addition to a self-healing matrix.
Conclusions
The current work was aimed at developing a cost-effective Cf/SiBOC composite using BPFSi as matrix resin and 2D carbon fabric as reinforcement by the RBSC method. The study leads to following conclusions:
Boron is incorporated in the back bone of phenol formaldehyde resin which is the carbonaceous precursor for the formation of reaction-bonded SiBOC mixed ceramics. Raman and HRTEM analysis revealed the morphology of free carbon in BC ceramics which supports the transformation of glassy carbon (BPF-0) to graphitic carbon (BPF-30). Isothermal oxidation of SiBOC mixed ceramics at 1000°C leads to the formation of SiO2–B2O3 phase proving that boron-bearing ceramics are more efficient at relatively low temperatures (500–1000°C) to protect CMCs. Flexural strength of Cf/SiBOC composites showed that marginal improvement maximum of 46 ± 1.6 MPa was achieved in the case Cf/SiBOC-30. Fractured surface of Cf/SiBOC-0 composite was observed using SEM which showed brittle failure with no fibre pull out and this is attributed to the strong fibre–matrix bonding in the composite. EDX of Cf/SiBOC-0 composite show that, the side wall of the carbon fibre is enriched with silicon 22.57 wt-% as compared to 6.05 wt-% on top surface (plateau) of carbon fibre. This clearly indicated that it has been damaged by reacting with elemental silicon leading to reduction in the flexural strength of the Cf/SiBOC composites. Evaluation of oxidation resistance for Cf/SiBOC composites at various temperatures (1000, 1250 and 1500°C) proved the formation of borosilicate glass at relatively low temperature which is responsible for self-healing property of CMCs. Significance of interphase coating on the flexural strength has to be understood and hence will be studied in detail in future.
Footnotes
Acknowledgements
The authors thank the authorities of VSSC for granting permission to publish this work. One of the authors (Ganesh Babu T) is thankful to Indian Space Research Organization (ISRO) for the research fellowship. Help received from the members of the Analytical and Spectroscopy Division (ASD) for the thermal, chemical and spectral analyses is gratefully acknowledged.