
Abstract
The phase evolution studies of zirconia, with 4–16 mol-% doping of calcium, have been carried out after sintering the pellets at 1400°C. From the X-ray diffractometer patterns, it is evident that the zirconia exists only in the monoclinic phase. However, Rietveld refinement of calcium-doped zirconia revealed the stabilisation in the monoclinic and cubic phases. With increasing calcium doping, the development of the cubic phase in zirconia is seen and at 16 mol-% doping of calcium, almost fully stabilised cubic phase of zirconia (∼97%) is achieved. The microstructure and elemental analyses of the sintered pellets are done using a field-emission scanning electron microscopy and energy-dispersive spectroscopy, respectively. Raman spectroscopic studies validate the findings of XRD. It is expected that the present study on calcium-doped zirconia opened a new channel for its potential applications in new technology such as oxygen sensors and solid electrolyte.
Introduction
Ceramics are highly preferred for various kinds of industrial applications because of their fascinating physical properties, such as high mechanical stability, superior chemical stability, high radiation resistance, high melting point, and so on [1-3]. Ceramics can be broadly classified into oxides and non-oxide categories. The zirconium dioxide (ZrO2), commonly known as zirconia, is one example of oxide ceramics, which shows versatile physicochemical properties, such as high ionic conductivity, low thermal conductivity, superior chemical stability, high hardness, and prominent optical properties [47]. Owing to these fascinating properties, zirconia attracted innumerable researchers in recent years for studies and technological applications, such as oxygen detector, thermal barrier coatings, optical coatings, high-temperature solid oxide fuel cells, and so on [813]. Furthermore, zirconia is also a promising contender for inert matrix fuels (IMFs) in nuclear reactors [14,15].
The structural studies of zirconia have shown that it is a polymorphous, which exists in three crystallographic phases (i) monoclinic (m), which has the lowest symmetry structure with thermodynamic stability up to 1170°C; (ii) tetragonal (t), which appears from 1170 to 2370°C; (iii) cubic (c), which exists from 2370 to 2715°C (melting temperature) [4,16-18]. With improvement in physicochemical properties of zirconia upon phase transition, its high-temperature phases are more preferred for technological applications. Furthermore, pure zirconia is not stabilised in the cubic phase at room temperature because the Zr4+ ion is too small to sustain the symmetrical structure. Generally, fully stabilised zirconia (FSZ) is obtained by doping the zirconia with cations of lower valence and larger size (relative to Zr4+) e.g. by incorporating Y3+, Ca2+, or Mg2+ in the ZrO2 lattice [19]. The doping cations replace the Zr4+ after high-temperature sintering which causes the oxygen vacancies in the lattice [20].
Yttria-doped zirconia has been studied extensively for transformation in the structural properties of zirconia especially, to stabilise its cubic crystalline phase at room temperature [20-24]. Gaudon et al. [25] reported that the cubic phase of zirconia can be stabilised at room temperature by doping of 7 mol-% around and above yttria (Y2O3) into it. This material is known as yttria-stabilised zirconia (YSZ). Doping by 2–7 mol-% of yttria leads to the stabilisation of the tetragonal phase, i.e. a partially stabilised zirconia, whereas below 2 mol-% of yttria doping, the monoclinic phase is present.
However, limited studies are available on zirconia with calcium doping [26]. Furthermore, the ionic conductivity of calcium-stabilised zirconia is more than that of yttria-stabilised zirconia and it makes zirconia a strong candidate for oxygen sensors and solid electrolytes [27-29]. Also, the calcium-doped zirconia has toughness similar to YSZ and hence, a significant material for industrial applications [30,31]. Wu and Brook [32] reported the results of conventional sintering in the air at 1560°C for 13 h of partially stabilised zirconia (Ca-PSZ) by doping in the range of 8–20 mol-% of calcium in zirconia. They concluded that the samples with compositions with 12 mol-% of calcium or above had a cubic fluorite-type structure.
In 2008, Nath et al. [33] studied the phase stability relation with a density of only 8 mol-% calcium-doped PSZ and 16 mol-% calcium-doped FSZ. They concluded that the density of material decreases with an increase in phase percentage of c-ZrO2. Zhang et al. [34] reported a study on the effect of holding time on the phase stability of sintered CaO-doped PSZ. They found that the stability of the tetragonal phase of zirconia in sintered samples is maximum for a holding time of 2 h. The studies reported earlier for calcium-doped zirconia provide only limited information for the relation between phase percentage of cubic zirconia with lattice parameters and density of the material. Furthermore, a complete study of the shrinkage of calcium- doped zirconia on sintering and the atomic structure of calcium stabilised zirconia are not available in the literature which is required to further enhance our knowledge to identify the potential applications of this material. The significance of the present work is to thoroughly investigate the relation of lattice parameters, shrinkage, density, and cubic phase percentage against the different doping percentages of calcium in zirconia. In addition, the crystal structure of calcium-stabilised zirconia has been explored in monoclinic and cubic phases.
In the present work, the structural and morphological studies of zirconia with doping of 4–16 mol-% of calcium at 1400°C are investigated using the XRD, FESEM and RAMAN spectroscopy techniques to understand the role of doping percentage of calcium in zirconia on its phase stabilisation. The phase percentage in synthesised material, thereby optimising the doping percentage of calcium in zirconia to obtain calcia-stabilised zirconia, has been investigated by Rietveld Refinement studies.
Materials and methods
Synthesis of calcium-zirconia pellets
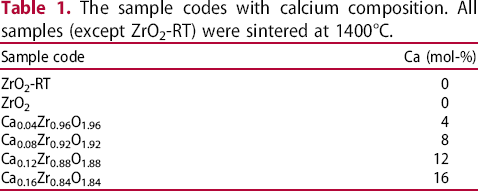
Pellets of calcium-doped zirconia with different composition Ca x Zr1–xO2–x: x = 0.04, 0.08, 0.12, and 0.16, have been synthesised by conventional solid-state reaction technique taking zirconium (IV) oxide (ZrO2) (∼ 99.999% purity) and calcium oxide (CaO) (∼ 99% purity) as the starting materials. Both the materials in powder form were mixed homogenously in the stoichiometric proportion to get different doping percentages of calcium in zirconia. This mixture was kept at 180°C overnight to remove the moisture content and then, it was ground with an agate mortar and pestle for 5 h and during this, a few drops of acetone were added after a regular interval.
The sample codes with calcium composition. All samples (except ZrO2-RT) were sintered at 1400°C.
Characterisation of samples
For the phase identification, the prepared samples have been analysed using a Bruker D8 advance X-ray Diffractometer (XRD) with CuKα radiation (λ = 1.54060 Å). The XRD spectra were recorded in the range of 20°–70° with a step size of 0.02° and at a scan speed of 5 s step−1. The Rietveld Refinement studies of the XRD spectra were performed using the TOPAS software program and the crystal structural parameters were determined. For this, all the standard Crystallographic Information File (CIF) was taken from the Crystallography Open Database (COD). The crystal structure of the samples was drawn using the Visualisation for Electronic and Structural Analysis (VESTA) software.
The surface morphology of the samples was recorded using a Field Emission Scanning Electron Microscope (FESEM; JSM 7610F Plus, JEOL). The samples were polished with a silicon carbide paper (mesh size 2000) and cleaned with acetone to remove the surface contamination before the recording of FESEM images. Also, the samples were coated with a 5 nm thin layer of gold using a DII-29030SCTR Smart Coater to prevent charging effects while there was bombardment of the samples with electron beam. Furthermore, the elemental analysis of samples was also carried out using Energy-dispersive X-ray spectroscopy (EDS), which is coupled with FESEM.
A Renishaw In-Via confocal micro-Raman spectrometer was used to measure the Raman spectra of the samples. For excitation, a 488 nm argon-ion laser at room temperature with a maximum beam spot size of 50 μm is available in this set-up. However, we employed an X20 objective lens to get a beam spot size of 2 mm in diameter for recording the spectra of zirconium samples in the range of 30–800 cm−1 with a spectral resolution of 1 cm−1. The Stoke lines were recorded in the backscattering geometry using an edge filter, a diffraction grating (2400 lines mm−1) and a Peltier-cooled charged coupled detector.
Results and discussion
XRD study
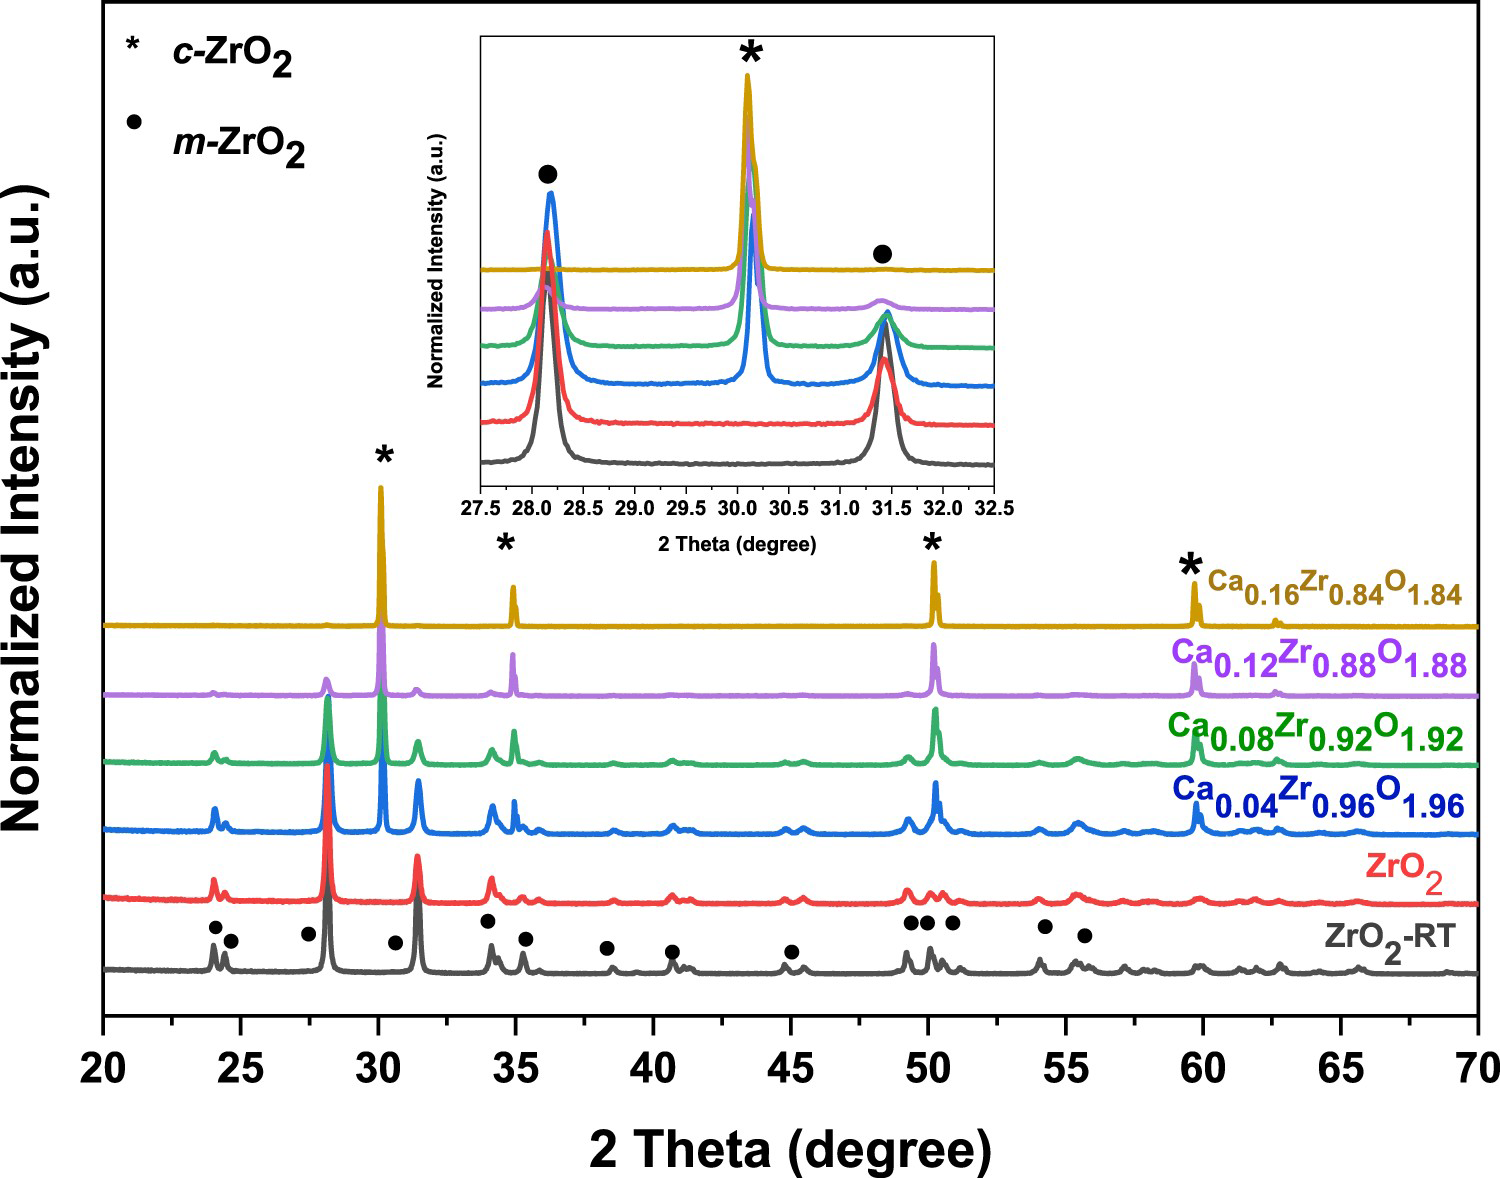
Figure 1 shows the XRD spectra of all samples (pellets of as-supplied zirconia powder, pure and doped zirconia sintered at 1400°C). The careful analysis of the XRD spectra of ZrO2-RT indicates the presence of a monoclinic phase [JCPDS No- 00-036-0420], as verified with the peaks marked by ‘●’ which are in agreement with earlier reported work [35,36]. The XRD peaks with strong intensity appeared at 2θ ≈24.07°
XRD patterns of the samples; ZrO2-RT, ZrO2, Ca
x
Zr1–xO2–x: x = 0.04, 0.08, 0.12, and 0.16. Inset: Enlarged view (2θ: 27.5–32.5°) of XRD patterns. , 24.46°
 28.19°
 , 31.48°
 , 34.19°
 , 49.27°
 , and 50.12°
 belong to the monoclinic phase (Space group: P21/c). With increasing the doping percentage of calcium, the monoclinic phase gets mixed with the cubic phase [JCPDS No- 01078-3351], as verified by the peaks marked by ‘*’. The diffraction peaks at 28.19° and 31.48° corresponding to
 and
and
 , which are the characteristic planes of the monoclinic phase, are shown in the zoomed version of the XRD pattern in Figure 1. As the doping percentage of calcium increases, the intensities of these two peaks reduce and a new diffraction peak appears at 30.32°. This new peak is attributed to the (111) plane of the cubic phase [JCPDS No- 01-078-3351] of zirconia [37].
The crystallite size and cubic phase percentage in the samples.
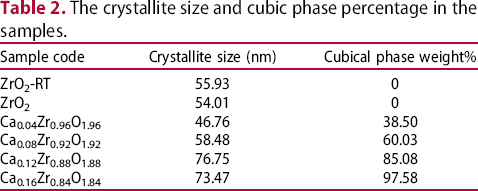
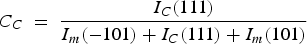
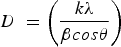
The average crystallite size has been estimated by considering the highest intensity diffraction peak and using Scherrer's equation [39,40], i.e.
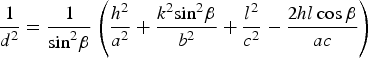
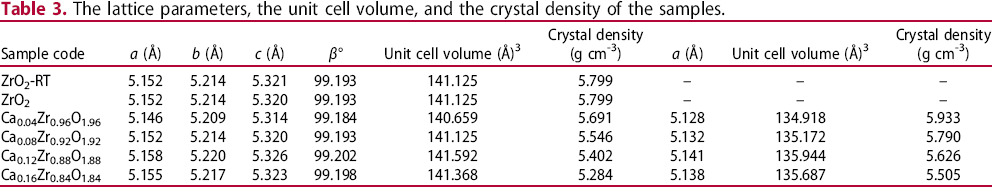
 , (111), (002), (020), and (200) of the monoclinic phase, have been used to evaluate the lattice parameters. Also, the unit cell volume and the crystal density of the samples are computed using standard formulas [43]. The lattice parameters of the cubic phase of zirconia have been determined from the (111) reflection. The lattice parameters, unit cell volume and crystal density values of all samples are depicted in Table 3. There is a decrease in the crystal density with increasing calcium doping percentage in zirconia. This is quite obvious because, with the incorporation of calcium, the overall molecular weight of the sample is getting reduced. These obtained lattice parameters for pure and doped zirconia samples are consistent with the standard JCPDS file [36-38].
The lattice parameters, the unit cell volume, and the crystal density of the samples.
Analysis through Rietveld refinement
The TOPAS software program was used for Rietveld refinement of XRD patterns to further analyse the samples. The refined XRD patterns of the samples, ZrO2-RT, ZrO2, Ca
x
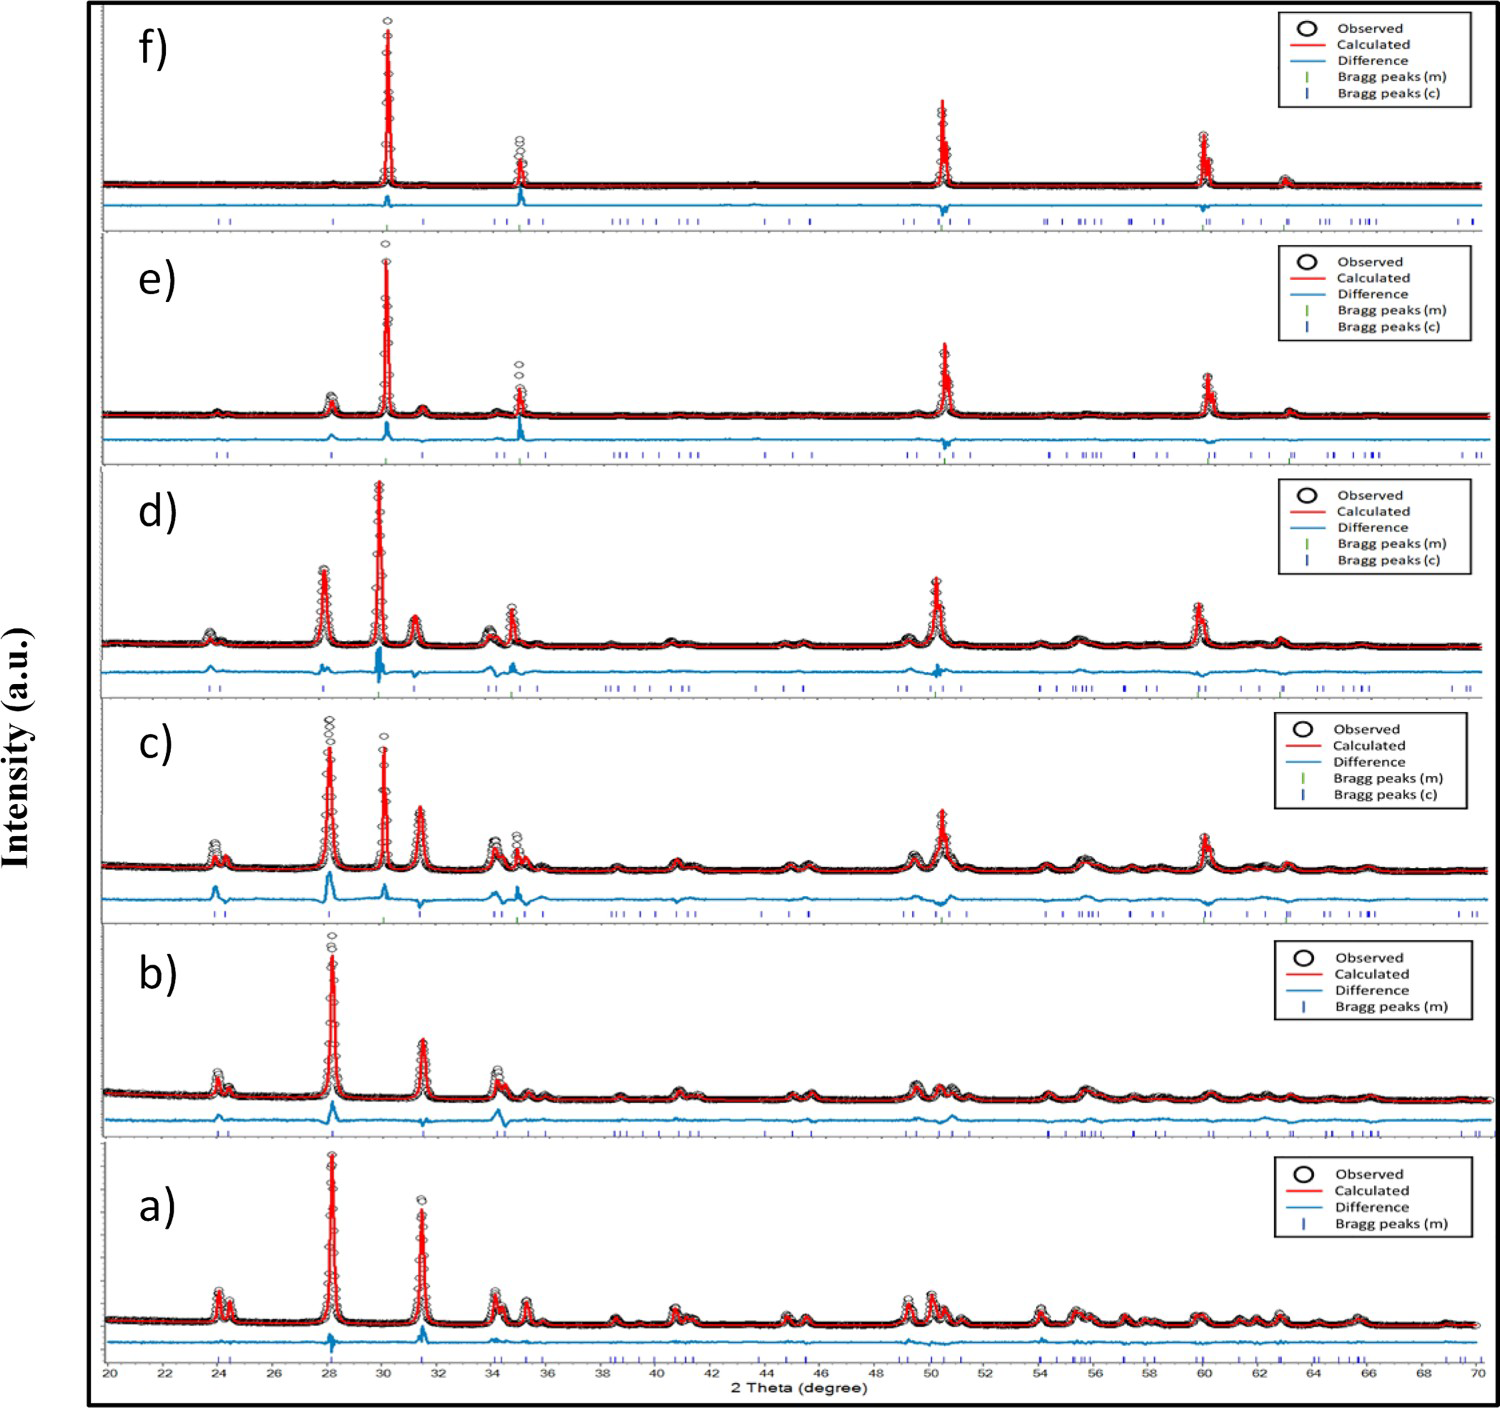
Zr1–xO2-x: x = 0.04, 0.08, 0.12, and 0.16, are illustrated in Figure 2. The experimental data, the calculated data, the difference between experimental and calculated data, and Bragg's peak are represented by the black close circle, red continuous line, blue continuous line, and the vertical line, respectively. Based on refinement studies, the presence of the cubic phase is reported in the calcium-doped zirconia samples, prepared by solid-state reaction. The cubic (space group Fm
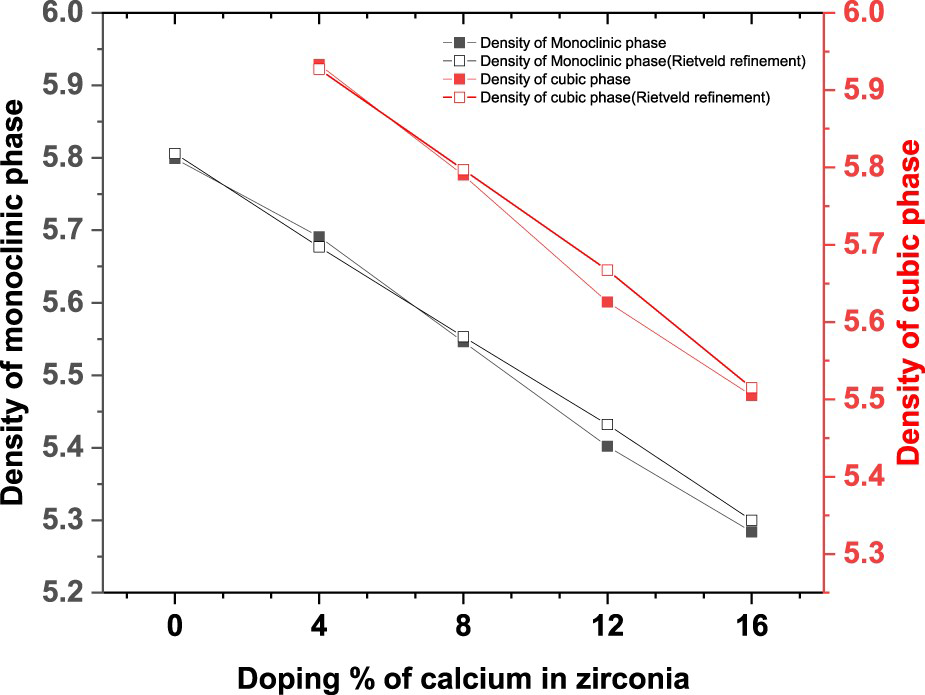
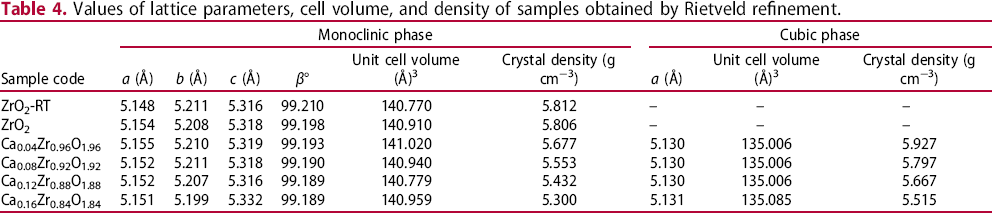
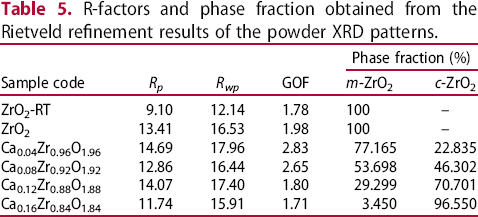
Rietveld refined XRD patterns of (a) ZrO2-RT (b) ZrO2 (c) Ca0.04Zr0.96O1.96 (d) Ca0.08Zr0.92O1.92 (e) Ca0.12Zr0.88O1.88 (f) Ca0.16Zr0.84O1.84. Variation in the density of the monoclinic phase and cubic phase with change in doping percentage of calcium in zirconia. Values of lattice parameters, cell volume, and density of samples obtained by Rietveld refinement. R-factors and phase fraction obtained from the Rietveld refinement results of the powder XRD patterns. m) [44] and the monoclinic (space group P21/c) phases have been used as the starting models for refining calcium-doped samples. But, only the monoclinic (space group P21/c) [45] phase has been used to refine the samples, ZrO2-RT and ZrO2. The lattice parameters, unit cell volume, and crystal density obtained from the refinement results are shown in Table 4. Furthermore, no XRD pattern of calcium is observed in samples during Rietveld refinement of the sintered samples which confirms the substitution of calcium at the appropriate site of the Zr site. The variation in the density of monoclinic and cubic phases for different doping percentages of calcium and its comparison with calculated values in zirconia is shown in Figure 3. From Figure 3, it is observed that the variance between experimental density and theoretical density is very less. The densities decrease with increasing doping and the refinement studies provide a linear dependence. Furthermore, the background and the peak shape were refined using a Chebychev polynomial with six coefficients, and a Fundamental-Parameters function, respectively. The various R factors and phase fraction obtained from the refinement results are listed in Table 5. The observed Rietveld patterns and R-factors (Rp, Rwp, and Goodness of Fit (GOF)) suggest a good agreement between the experimental and calculated data.
The crystal structure of the pure and calcium-doped zirconia was drawn using the VESTA [46] software by taking the data files obtained during Rietveld refinement. The monoclinic phase of pure zirconia at RT and, pure and doped zirconia sintered at 14000C, is shown in Figure 4.
The atomic structure of the monoclinic zirconia built using VESTA. (a) ZrO2-RT (b) ZrO2 (c) Ca0.04Zr0.96O1.96 (d) Ca0.08Zr0.92O1.92 (e) Ca0.12Zr0.88O1.88 (f) Ca0.16Zr0.84O1.84. The green and red balls are Zr and O atoms, respectively.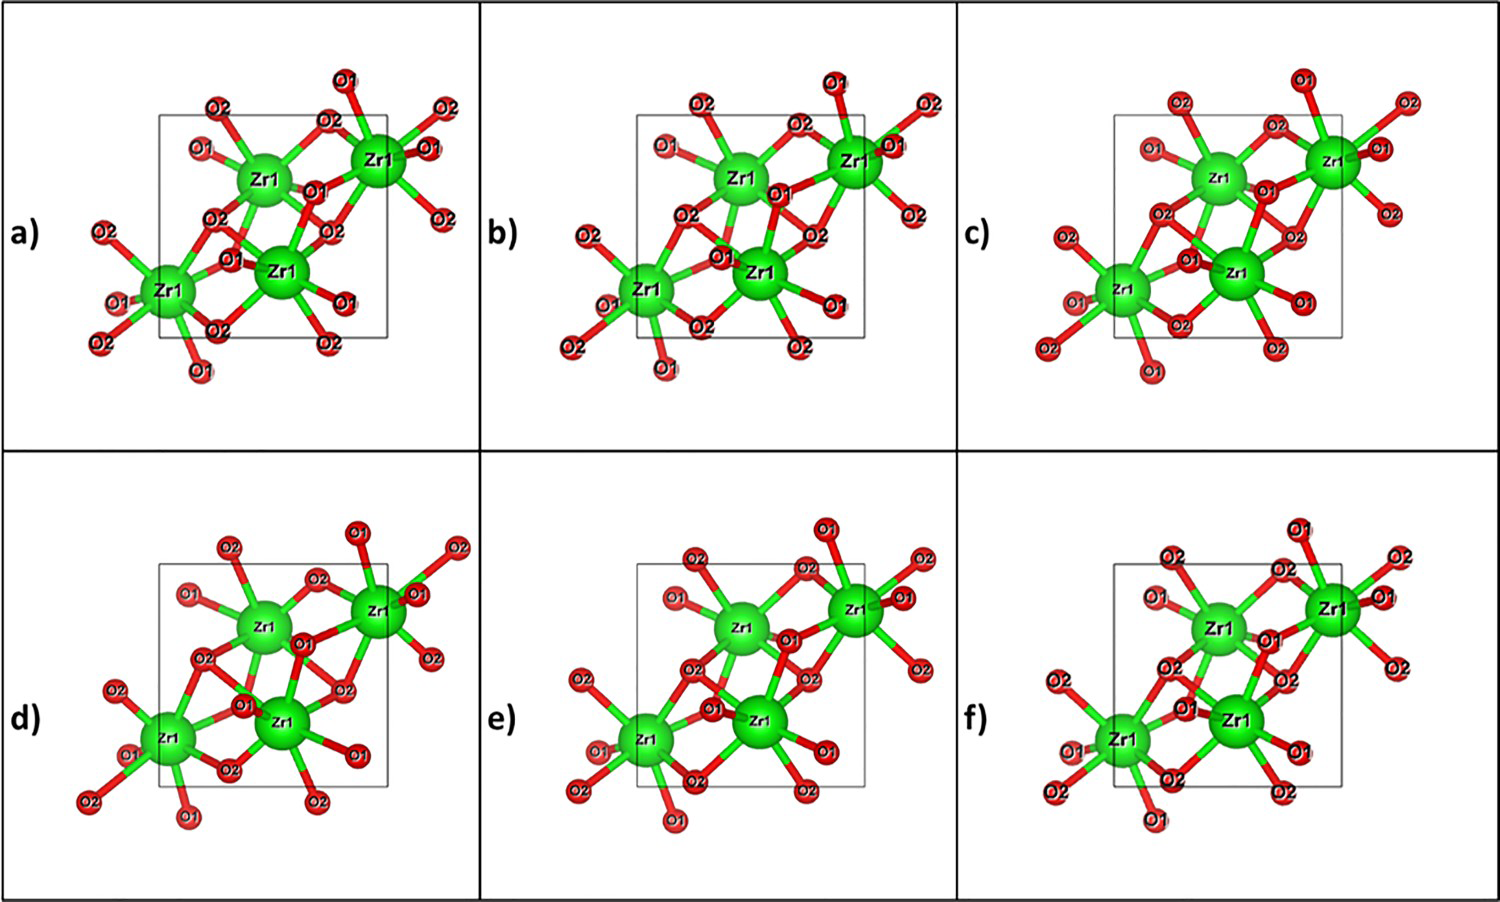
The monoclinic phase of zirconia belongs to the space group P21/c (# 14) with Zr occupying the position at (0.27231 0.03832 0.20679), and O1 at (0.07281 0.31591 0.34847), and O2 at (0.45075 0.75586 0.47220). But, in the cubic phase of zirconia (space group Fm
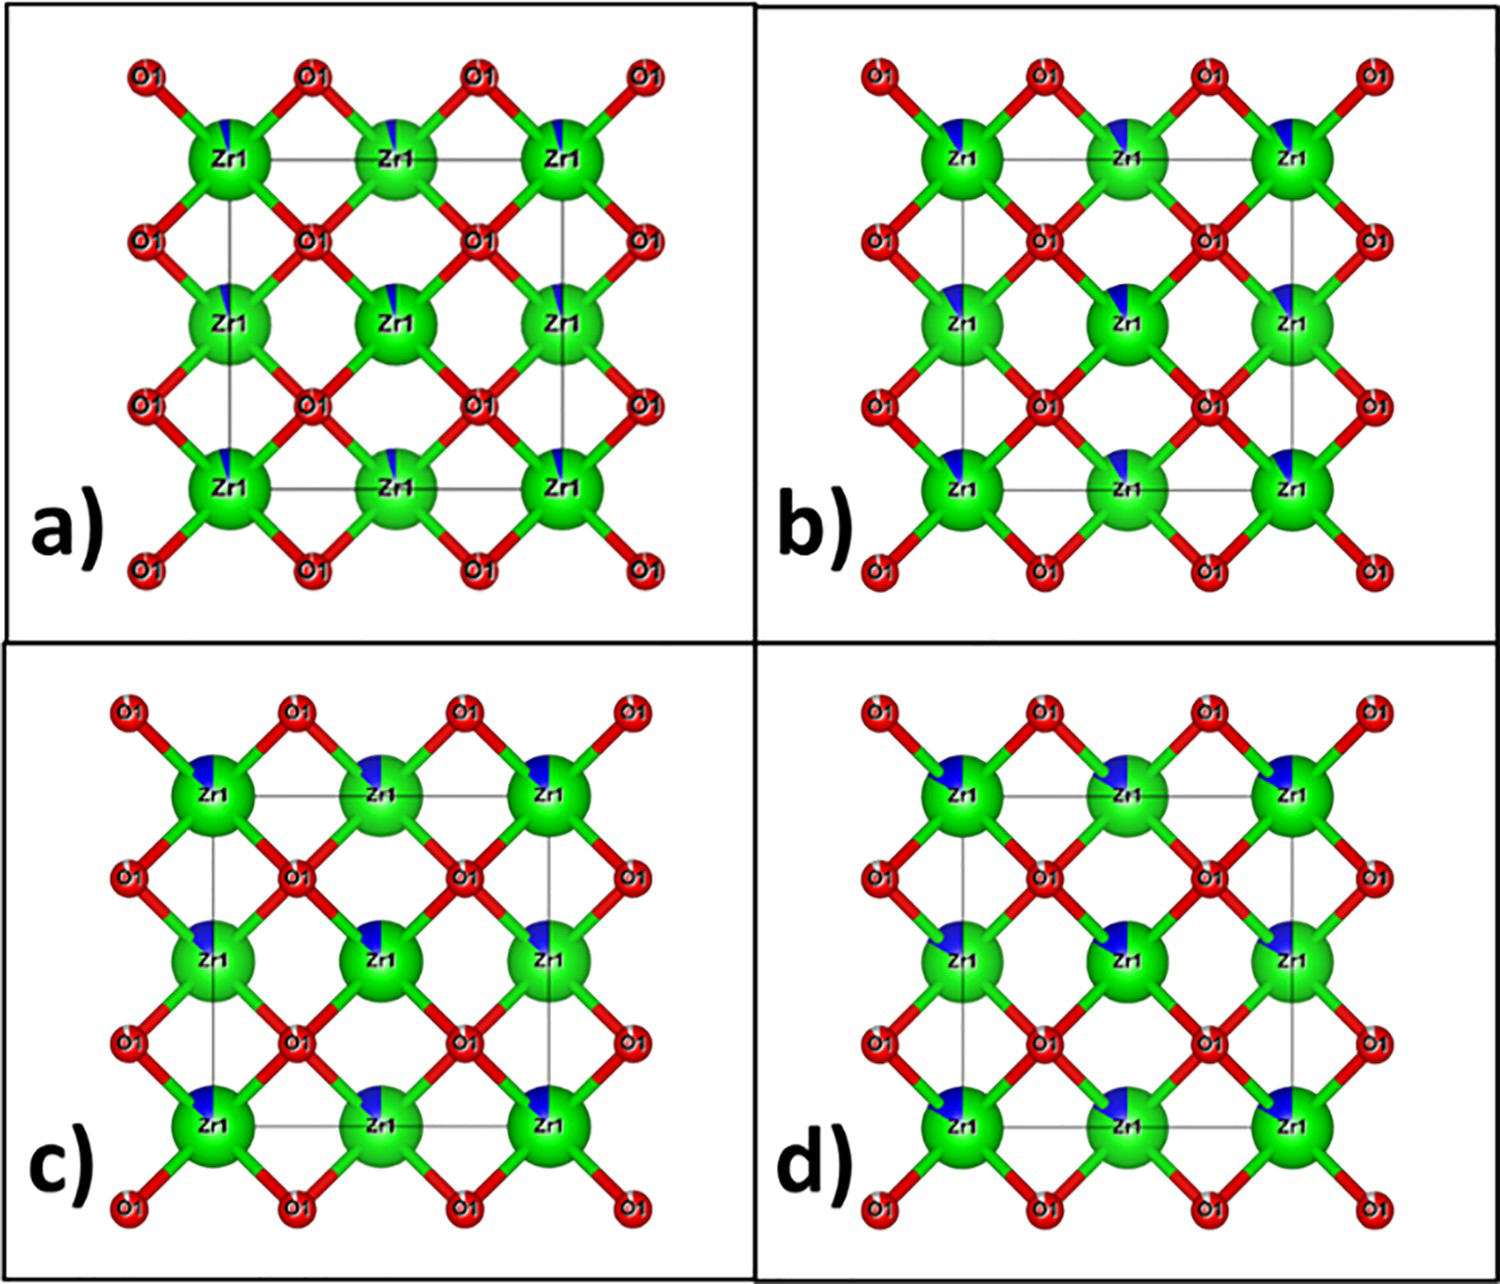
The atomic structure of the cubic zirconia built using VESTA. (a) Ca0.04Zr0.96O1.96 (b) Ca0.08Zr0.92O1.92 (c) Ca0.12Zr0.88O1.88 (d) Ca0.16Zr0.84O1.84. The green and red balls are Zr and O atoms, respectively. The blue colour represents the doping of the Ca atom and the light grey in O atoms represents the vacancy of O atoms. m (#225)), Zr occupies the position at (0 0 0), and O at (0.25 0.25 0.25). When zirconia is doped with calcium, it occupies the position of Zr and creates a vacancy at the position of the O atom. The cubic phase of the calcium-doped zirconia is shown in Figure 5. These atomic structures are in good agreement with the existing structures of zirconia.
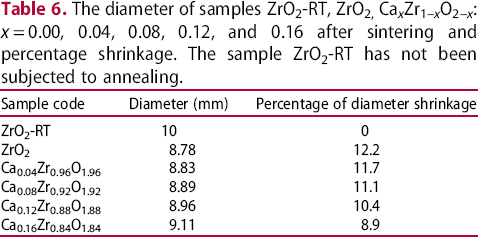
Shrinkage measurement
The shrinkage of the material after sintering affects its product quality and durability due to the change in the dimension of the product [47]. The diameter of all the samples is measured before and after the sintering process to determine the shrinkage. The percentage of the diameter reduction has been calculated by the following Equation (4),
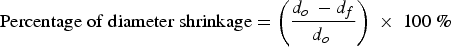
The diameter of the prepared pellet of all samples at room temperature is 10 mm. After sintering to 1400°C, the pellets get compressed due to the presence of voids. The percentage of diameter shrinkage is calculated using Equation (4), which is illustrated in Table 6. It has been observed that pure zirconia has highest shrinkage, whereas the percentage of shrinkage decreases with the increase of calcium doping in zirconia. The result shows that the 16% mol calcium-doped zirconia has least shrinkage. Figure 6 shows the percentage of diameter shrinkage and evolution of the cubic phase (deduced by experimental data and refinement studies) in zirconia as a function of calcium doping. As the cubic phase evolves, the sample shrinkage reduces. The least shrinkage of cubic stabilised zirconia makes it better for industrial applications.
The evolution of the cubic phase and sample shrinkage in zirconia as a function of calcium doping.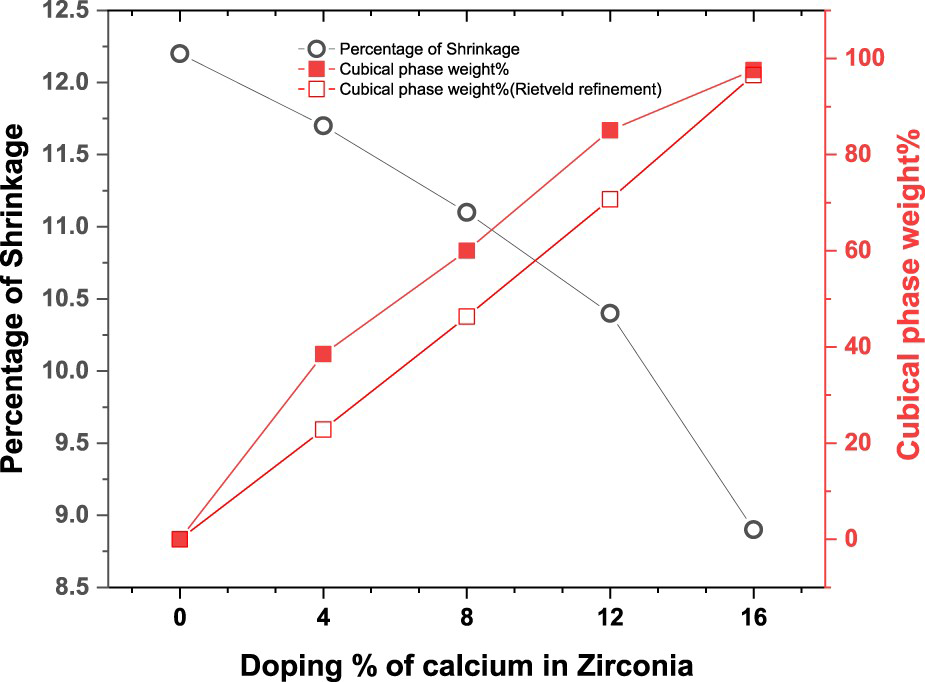
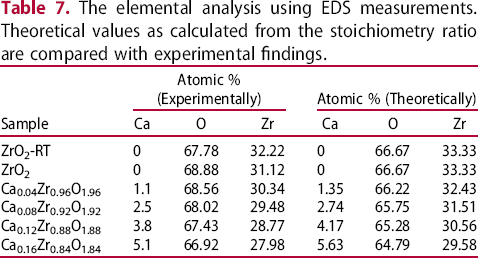
FESEM and EDS analysis
The imaging of surface microstructure and the elemental analysis of the samples have been carried out using FESEM and EDS and outputs are shown in Figures 7 and 8, respectively. The FESEM image of pure zirconia (Figure 7(a)) shows a broad grain size distribution and porosity is very much clear. Similar morphology of zirconia has also been reported in the published literature [48,49]. The average grain size is roughly calculated using the ImageJ software [50] (∼0.266 μm). After sintering at 1400°C, the observed morphology of zirconia is highly dense as compared to that of a pre-sintered sample with an average grain size of around 0.677 μm (Figure 7(b)). Similar dense grain size distribution is seen in calcium-doped zirconia after the sintering. The grain size in Ca0.04Zr0.96O1.96 (Figure 7(c)), Ca0.08Zr0.92O1.92 (Figure 7(d)), Ca0.12Zr0.88O1.88 (Figure 7(e)), and Ca0.16Zr0.84O1.84 (Figure 7(f)) is ∼ 0.583, 0.551, 0.620, and 0.586 μm, respectively. The stress developed by the incorporation of calcium and stress relieved during annealing as a statistical process determine the Ostwald ripening [51-53] and hence, the random grain sizes in the samples.
FESEM image of (a) ZrO2-RT (b) ZrO2 (c) Ca0.04Zr0.96O1.96 (d) Ca0.08Zr0.92O1.92 (e) Ca0.12Zr0.88O1.88 (f) Ca0.16Zr0.84O1.84. EDS elemental images (a) ZrO2-RT (b) ZrO2 (c) Ca0.04Zr0.96O1.96 (d) Ca0.08Zr0.92O1.92 (e) Ca0.12Zr0.88O1.88 (f) Ca0.16Zr0.84O1.84. The diameter of samples ZrO2-RT, ZrO2, Ca
x
Zr1–xO2–x: x = 0.00, 0.04, 0.08, 0.12, and 0.16 after sintering and percentage shrinkage. The sample ZrO2-RT has not been subjected to annealing.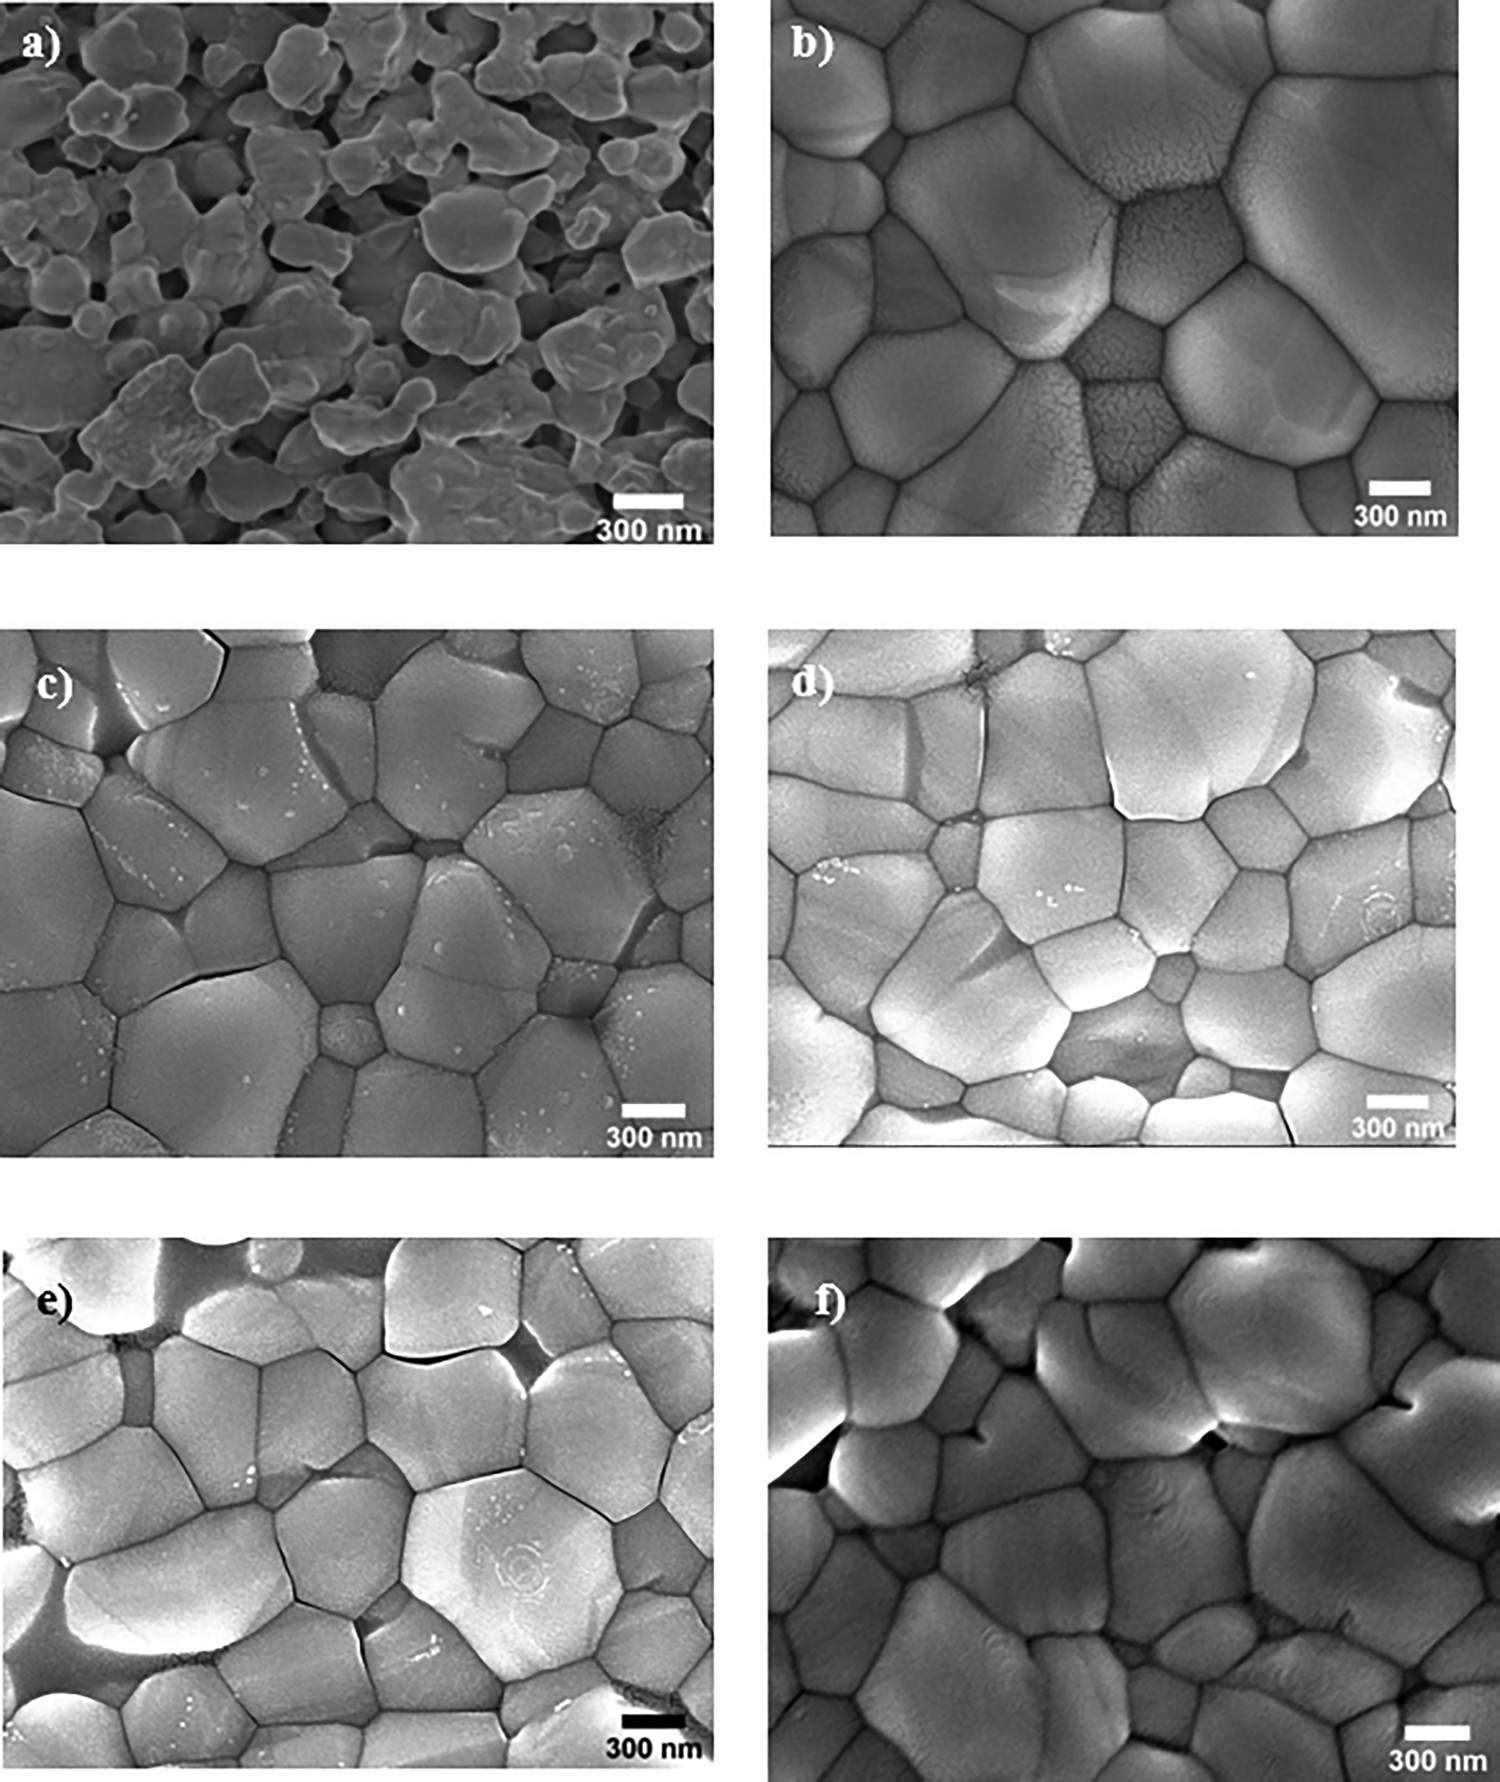
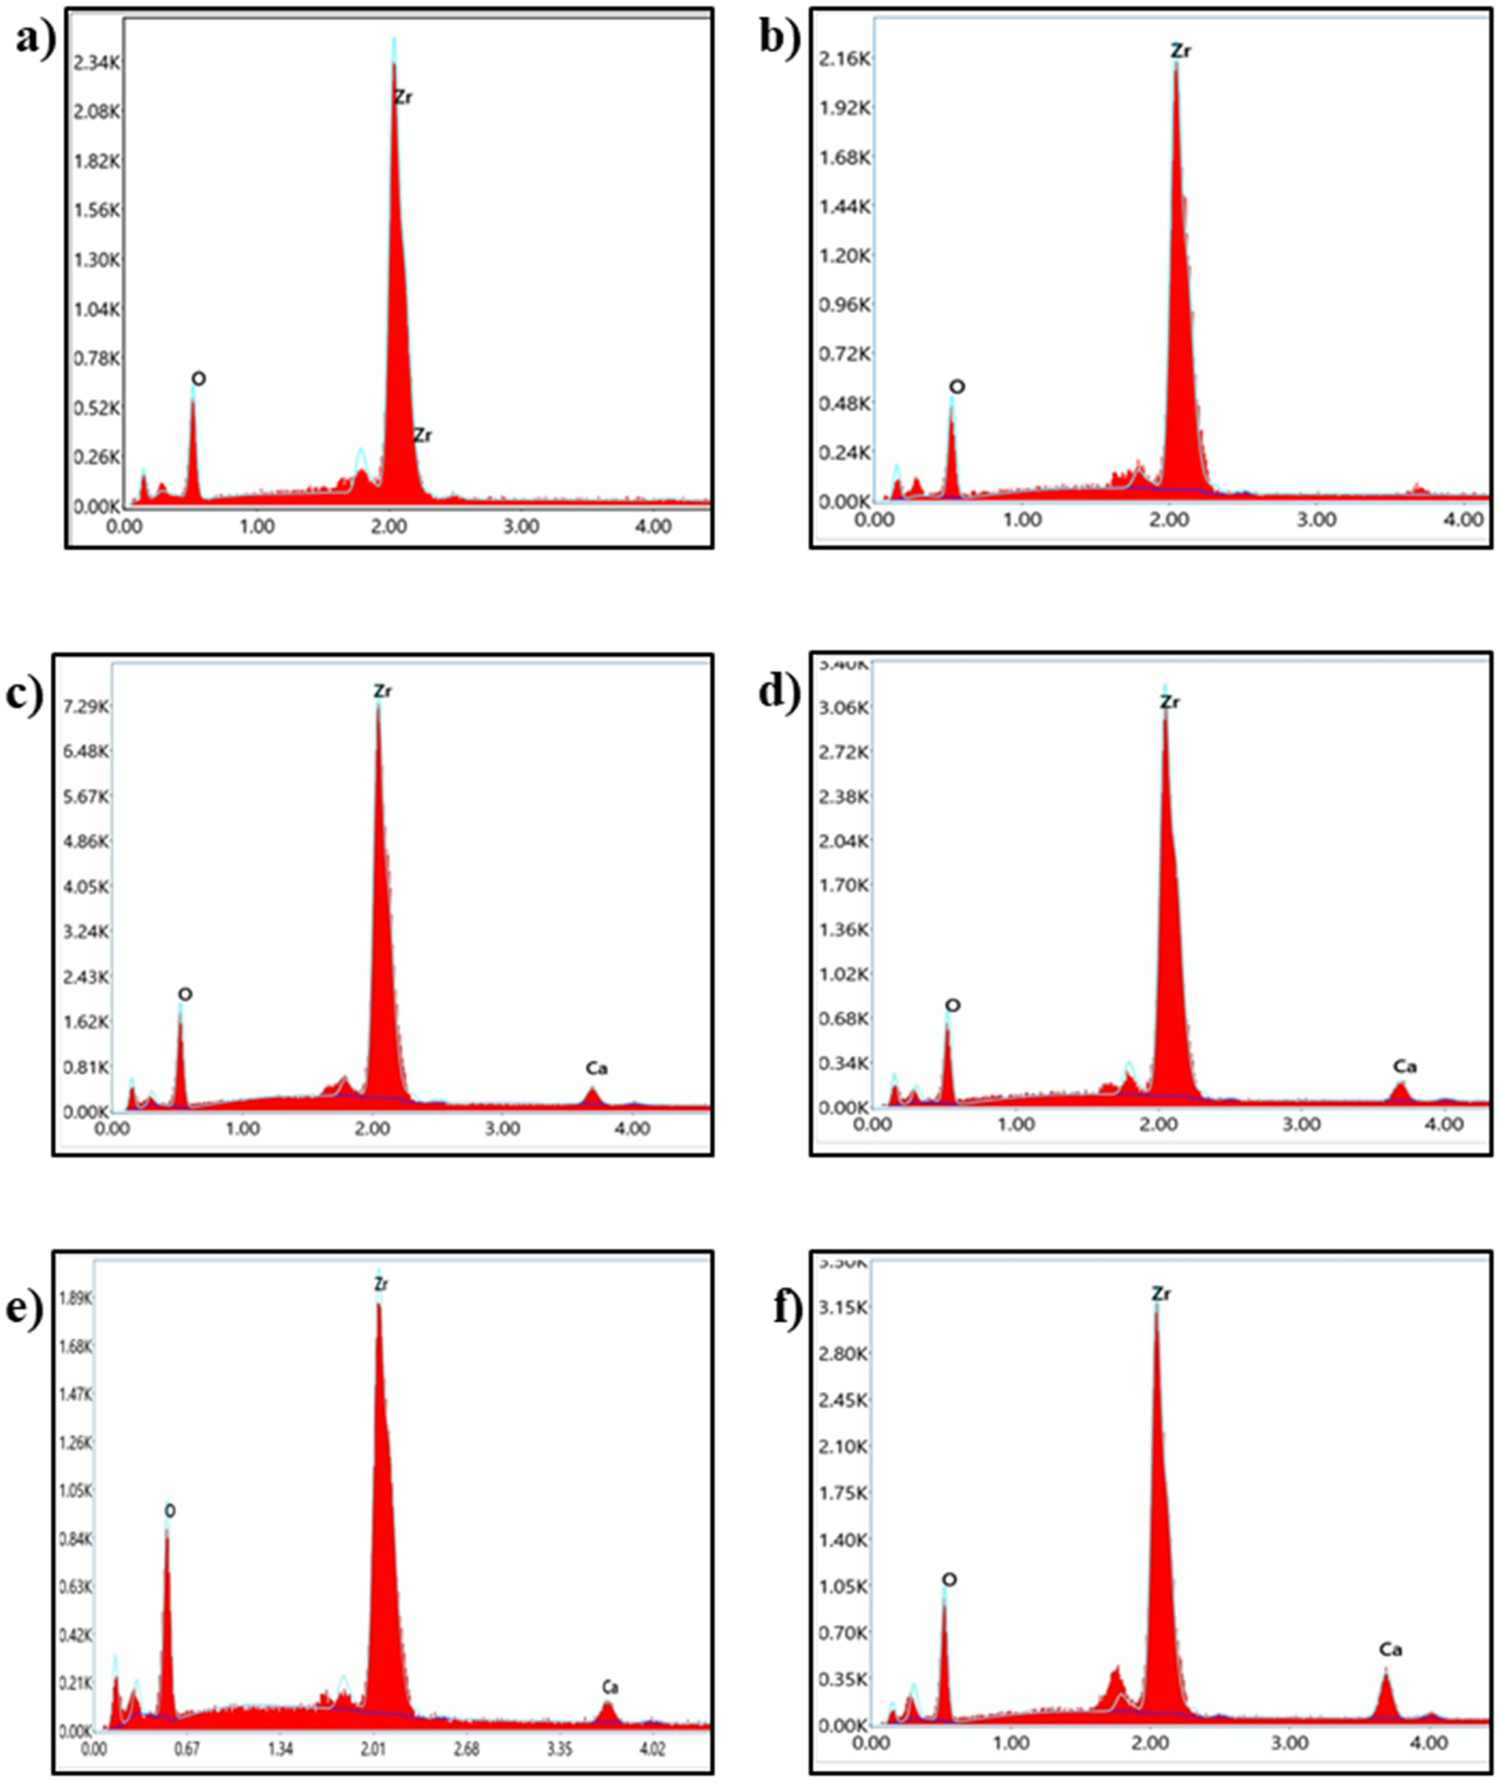
The elemental analysis using EDS measurements. Theoretical values as calculated from the stoichiometry ratio are compared with experimental findings.
Raman analysis
To investigate the local structural properties of zirconia after doping of calcium and sintering at 1400°C, Raman spectroscopy of samples was done. Figure 9 shows the Raman spectra of all samples under consideration of the present study. The pure zirconia has shown the complex spectrum in the presence of several vibrational modes, which matches with the monoclinic phase of zirconia [54-56] of CAS (Chemical Abstracts Service) Registry Number of 1314-23-4. The 14 Raman active bands (105.28, 179.46, 192.00, 223.95, 308.13, 335.55, 349.23, 384.69, 476.75, 503.64, 539.81, 559.83, 616.98, 639.47 cm−1) indicates the presence of monoclinic phase (
RAMAN spectra of samples ZrO2-RT, ZrO2, Ca
x
Zr1–xO2–x: x = 0.04, 0.08, 0.12, and 0.16. Inset: Enlarged view (range: 575–665 cm−1) of RAMAN spectra. ) of zirconia.
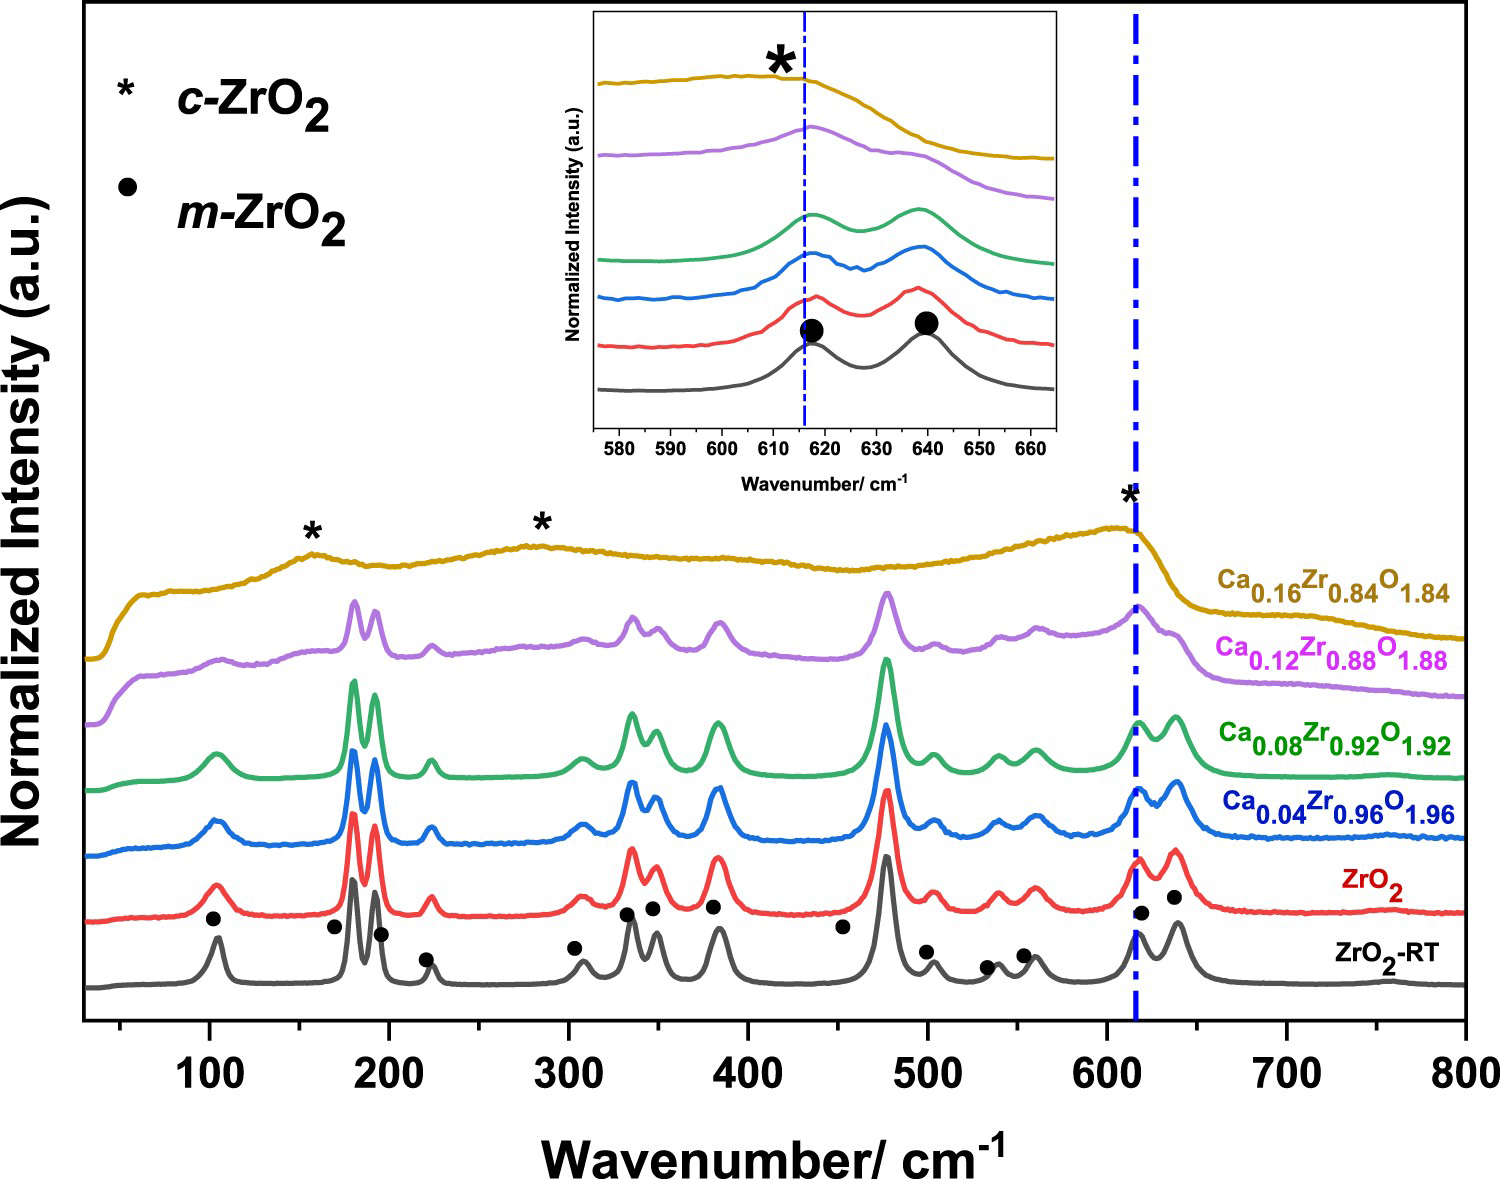
The general shape of the Raman spectrum of the cubic stabilised zirconia depends on the type and content of the incorporated cations. According to the literature data, the yttria-stabilised cubic zirconia presents [57,58] the most prominent band between 607 and 617 cm−1, whereas the material stabilised with calcium oxide shows the same band at a lower wave number, around 600 cm−1 [59]. Raman active bands (157.13, 276.48, 602.40 cm−1) in 16 mol-% calcium-doped zirconia resemble high symmetry cubic phase [60,61] with fluorite structure (
 ). The pure zirconia sintered at 1400°C shows a spectroscopic pattern similar to the pure zirconia at room temperature. With 4 and 8 mol-% calcium doping in zirconia, minor changes in the spectrum occur because the monoclinic phase dominates as compared to the cubic phase. The decrease in intensity of the major vibrational modes of the monoclinic phase and an increase in FWHM with increasing calcium content indicate the development of the cubic phase as already verified by XRD results.
A shift of the ∼ 639 cm−1 band (Eg) with increasing doping percentage of calcium represents the stretching of the Zr-OI bond [61]. As the calcium content is increased, FWHM of the ∼ 616 cm−1 band decreases, and the monoclinic component starts disappearing, and eventually, for 16 mol-%, the calcium-doped zirconia shows the spectrum of the cubic phase. As reported in the XRD analysis for Ca0.16Zr0.84O1.84 after sintering at 1400°C, it shows a fully stabilised cubic phase of zirconia and this conclusion is supported by Raman measurements as well.
Conclusion
From the present investigations of the phase transition in pure and 4–16 mol-% calcium-doped zirconia after sintering at 1400°C, and comparing the structural and morphological evolution with the undoped zirconia sample prepared at room temperature, it is concluded as under:
The XRD analysis shows that the pure zirconia (RT and sintered at 14000oC) exists in the monoclinic phase. With calcium doping in zirconia and sintering, the cubic phase starts developing and at 16% mole of calcium, a fully stabilised cubic phase (∼97%) is achieved. Rietveld Refinement studies support well the experimental XRD data with GOF less than 3. Furthermore, no secondary phase of calcium is found in Rietveld Refinement studies which confirms that Ca is mostly substituted at the Zr site. Doping with calcium stabilised the cubic phase of zirconia at room temperature because Ca2+ ion is larger than Zr4+ ion. The Raman measurements validate the findings of XRD. The percentage of diameter shrinkage of pellets of pure zirconia and 16 mol-% calcium-doped zirconia after sintered at 1400oC is 12.2 and 8.9, respectively. This indicates that with the increase in calcium content in zirconia, the shrinkage in the sample reduces. The surface morphology as imaged using FESEM shows a high packing fraction of grains in sintered samples as compared to as prepared. Elemental analysis done through EDS is in good agreement with the stoichiometric ratio of the sample.
Major research works published so far show phase stabilisation of zirconia with yttria and, therefore, the present study with calcium incorporation may open a new channel for technological/industrial applications of zirconia.
Footnotes
Acknowledgements
One of the authors, Ankit Kumar is thankful to the Council of Scientific and Industrial Research (CSIR) for providing the Senior Research fellowship under file no. 09/797(0017)/2018-EMR-I.
Disclosure statement
No potential conflict of interest was reported by the author(s).