
Abstract
This study investigated whether the lack of visual experience affects the ability to create spatial inferential representations of the survey type. We compared the performance of persons with congenital blindness and that of blindfolded sighted persons on four survey representation-based tasks (Experiment 1). Results showed that persons with blindness performed better than blindfolded sighted controls. We repeated the same tests introducing a third group of persons with late blindness (Experiment 2). This last group performed better than blindfolded sighted participants, whereas differences between participants with late and congenital blindness were nonsignificant. The present findings are compatible with results of other studies, which found that when visual perception is lacking, skill in gathering environmental spatial information provided by nonvisual modalities may contribute to a proper spatial encoding. It is concluded that, although it cannot be asserted that total lack of visual experience incurs no cost, our findings are further evidence that visual experience is not a necessary condition for the development of spatial inferential complex representations.
There is a general consensus on the crucial role of visual perception in guiding many of our daily movements in large- and small-scale environments. However, it is much less clear whether, and if so how, vision affects our construction of spatial representations, as it has been suggested that, when visual perception is lacking, skill in gathering environmental spatial information provided by nonvisual modalities may support the creation of highly sophisticated spatial representations (Millar, 1994). In this vein, studies on the spatial abilities of people with blindness can help clarify the issue.
There are several reasons to maintain that visual experience in humans has a privileged status over other sensory modalities and, perhaps, a primary influence on the system for encoding and processing spatial information. First of all, vision has been demonstrated to bias audition and proprioception in localization tasks (Pick, Warren, & Hay, 1969): based on these results, Pick et al. (1969) proposed that sighted people organize auditory and proprioceptive information according to a visual map, which represents an economical means of storage, condensing many different bits of information into a single frame. Secondly, vision allows the simultaneous perception of our environment, in the sense that it provides an understanding of space as a whole (Foulke, 1982; Millar, 1981a). Conversely, haptic perception allows for only one item to be processed at a time. Thirdly, visual perception enables us to extract more information from a surrounding layout than other modalities do (Foulke, 1982; Hausfeld, Power, Gorta, & Harris, 1982). In fact, all objects present visual features but do not necessarily, for example, emit sound. Even more importantly, vision allows us to perceive distant, out-of-reach objects, whereas haptic perception does not. Lastly, the visual modality lets us extract spatial invariants from a surrounding layout (Thinus-Blanc & Gaunet, 1997). In other words, vision has the advantage of stabilizing the environment through which we move as well as providing updated and precise information on the perceptual consequences of displacements (Honig, 1987).
Based on these premises, one could make the straightforward prediction that, if vision is required for the construction of spatial representations, persons with blindness should perform worse than sighted persons on spatial cognition tasks. Yet, no differences have been reported between the performance of persons with late blindness (who lose their vision in adulthood) and sighted controls in spatial cognition tasks. Therefore, in adulthood—that is, after spatial mechanisms have developed—people seem able to process both visual and nonvisual information, and acquired blindness produces no relevant effect. Thus, the issue of a vision effect should be considered with respect to the age of blindness onset. More specifically, does the lack of any visual experience during a critical time-locked period in infancy irremediably affect the establishment of the spatial-representation system, thereby determining some kind of future spatial inabilities? The current literature provides few clues on the role of visual perception in building up spatial representations. Indeed, studies comparing the performance of blindfolded sighted participants and participants with congenital or early blindness have provided conflicting results. Whereas several authors have reported that individuals with congenital or early blindness are seriously impaired versus sighted persons or persons with late blindness in spatial cognition tasks (Byrne & Salter, 1983; Dodds & Carter, 1983; Hollins & Kelley, 1988; Rieser, Guth, & Hill, 1982, 1986; Rieser, Hill, Talor, Bradfield, & Rosen, 1992; Veraart & Wanet-Defalque, 1987), other authors have failed to replicate these findings and have observed no differences between the two groups (Haber, Haber, Penningroth, Novak, & Radgowski, 1993; Klatzky, Golledge, Loomis, Cicinelli, & Pellegrino, 1995; Landau, 1986; Loomis et al., 1993; Ochaita & Huertas, 1993; Passini, Proulx, & Rainville, 1990; Worchel, 1951).
These discrepant results may help to better differentiate between spatial abilities that strongly rely on visual experience and other spatial abilities that do not. In fact, some authors have interpreted the apparently contrasting findings with careful consideration of the different task demands and the cognitive processes required to perform them (Dodds, Howarth, & Carter, 1982; Millar, 1981a, 1981b, 1985, 1994; Rieser et al., 1982, 1986; Thorndyke & Hayes-Roth, 1982). By adopting such a framework, a trend can be observed in the data: When researchers tested spatial relationships among previously experienced places, or when tasks did not require participants to update spatial layouts due to body displacement, persons with early or late blindness and blindfolded sighted participants performed equally well. Conversely, when tests required the computation of spatial relationships among landmarks that had not been directly linked by pathways during the learning phase (thereby requiring the participants to infer new spatial links based on those already known), or when the reorganization of spatial representations was required as a consequence of a (real or imagined) change in perspective, the performance of participants with early blindness had a higher probability of being impaired (see Thinus-Blanc & Gaunet, 1997, for a review). Although in principle these spatial problems can be solved in terms of Euclidean geometry or mathematically, apparently the difference between these two task categories concerns cognitive processes and representations that have also been studied with reference to the distinction between route and survey representations (Byrne, 1979; O'Keefe & Nadel, 1978; Thinus-Blanc & Gaunet, 1997). The former is characterized by encoding a serial record of the space between subsequent landmarks. Route knowledge is thus based on a ground-level perspective and uses the body as the stable reference. This type of knowledge has no plasticity (in the sense that it is not prone to reorganization, due to body displacement or changes of perspective during locomotion) and seems to suffice when we move through very familiar places presenting no obstacles along our path. By contrast, survey knowledge refers to knowledge of the topographic properties of the environment, such as the location of objects relative to an allocentric fixed coordinate system or straight-line distances. This type of representation encodes a spatial layout from an external perspective (an aerial or map-like view) and contains information not obtainable from direct environmental experience. Survey representation plays a crucial role in our ability to estimate the direction of places that lie outside of our field of vision, or when we must compute spatial relationships among places whose links have not been previously experienced.
Since congenital or early blindness affects both the feedback from external layouts in relation to body movements and the perception of invariant distal cues, people with blindness should have to rely on egocentric coding strategies. These strategies, in turn, are based on sequential proprioceptive and kinaesthetic information corresponding to the construction of route representations. Hence, the construction of efficient route spatial representations would not depend on blindness onset age. Conversely, the lack of visual information during infancy would affect children's opportunities to construct representations of their environment that are not directly experienced and would then impair the ability to develop effective survey representations. In fact these representations should be inferred, and the lack of experience with survey representations, in the case of the blind, could make these inferences difficult to be made.
A set of findings, however, provides evidence to the contrary and directly questions the supposed causal relation between visual experience and survey representations. For example, Loomis et al. (1993) failed to replicate the results of Rieser et al. (1986) concerning the worse performance of participants with congenital blindness than of participants with late blindness and sighted participants in survey representation-based tasks. Similarly, the performance of participants with congenital or early blindness in other studies requiring inferential abilities, such as triangle completion, was without impairment (Klatzky et al., 1995; Landau, Spelke, & Gleitman, 1984).
The sheer diversity of findings precludes any simple conclusion about the effects of early-blindness onset in spatial cognition. However, whereas the loss of visual experience in infancy does not appear to impair the construction of route representations, the role of vision in establishing survey representations is still unclear and the subject of debate. Furthermore, other factors have varied among studies, all of which could partially account for the lack of convergence among studies and have been indicated as possible sources of misleading interpretations—for example, different types of pathway training (Millar, 1994; Worchel, 1951), the type of response required for distance and direction estimates (Haber et al., 1993), varying mobility skill levels in participants with blindness (Loomis et al., 1993), and the relative simplicity of some inferential tasks, which are likely to result in ceiling effects (Loomis et al., 1993). In particular, the familiarity with the environmental configuration and its complexity may represent a critical factor for the performance of persons with blindness. In fact, persons with blindness are prevented from using vision that allows a simultaneous experience of many spatial cues. Instead, in collecting environmental information, they must rely on other nonvisual modalities (such as haptic perception) that provide only a sequential and more time-demanding exploration of the space. Hence, the more the layout is complex and unfamiliar (i.e., it can be difficult compared with previously learned pathways or shapes), the more nonvisual modalities should be unfit in order to properly encode large-scale environmental characteristics. By consequence, one could think that a lower performance of persons with blindness in spatial tasks should be more evident with complex and intricate configurations of unfamiliar environments.
The present study was aimed at investigating whether the lack of any visual experience in infancy affects the setting up of the system for encoding and processing complex spatial relationships of the type generally associated with survey representations. In particular we want to verify whether, in the absence of visual perception, skill in gathering and using environmental spatial information provided by nonvisual modalities is reliably effective and enables blind persons to reach good performance on spatial tasks. Moreover, the use of several spatial tasks should allow us to verify whether the availability of information from sources other than vision enables blind people to cope with different types of spatial inference.
We thus compared the performance of participants with congenital blindness with that of blindfolded sighted participants (Experiment 1) on three different inferential tasks, which have been considered in literature to be based on survey representation (Casey, 1978; Dodds et al., 1982; Klatzky et al., 1995; Landau et al., 1984; Loomis et al., 1993; Rieser et al., 1986, 1992; Rieser, Lockman, & Pick, 1980):
Walking through places not linked by pathways directly experienced during the learning phase; Direction estimates by pointing after locomotion and perspective change; Straight-line distance judgements.
A fourth final task was map drawing of explored pathways.
In order to assess the role of complexity and familiarity, all participants were tested in two pathways with different shapes varying in the degree of complexity and familiarity. We then repeated the same tests on different participants, introducing a third group of persons with late blindness (Experiment 2). This enabled us to better clarify the relative contribution of lack of visual experience as opposed to the habit of environmental exploration through haptic and proprioceptive perception in building survey representations.
Experiment 1
Method
Participants
The experimental group was composed of 20 participants with total congenital blindness 1 (10 men and 10 women, M = 39.3 years, SD = 13.5, age range = 20–68 years). Their blindness was due to various aetiologies: optic nerve atrophy (6 participants), congenital retinitis pigmentosa (3), congenital microphthalmy (2), retrolental fibroplasia (2), congenital glaucoma (2), childbirth trauma (2), congenital cataract (1), epithelial dystrophy (1), and retinoblastoma (1).
By “total blindness” we refer to a severe visual deficit, which impedes the perception of object shapes and positions as well as the distinction between light and shadow.
In no instance was blindness associated with central nervous system dysfunction, and all participants were self-sufficient in navigating their surroundings with a white cane.
The control group comprised 20 sighted persons (10 men and 10 women, M = 43 years, SD = 15.1, age range = 21–68 years). Controls were matched for education and age to participants with congenital blindness.
All participants gave informed consent and received no compensation for their participation in the study.
Materials
The experiment was conducted in a large room (10 × 12 m), in which two plywood pathways had been built (see Figures 1a and 1b). Pathway A was made up of four straight stretches: respectively, 1.55, 2.60, 4.70, and 1.70 m long; it was 1 m wide, and the plywood boards delimiting its borders were 0.30 m high. Overall length to be navigated was 10.55 m, including three right angles.
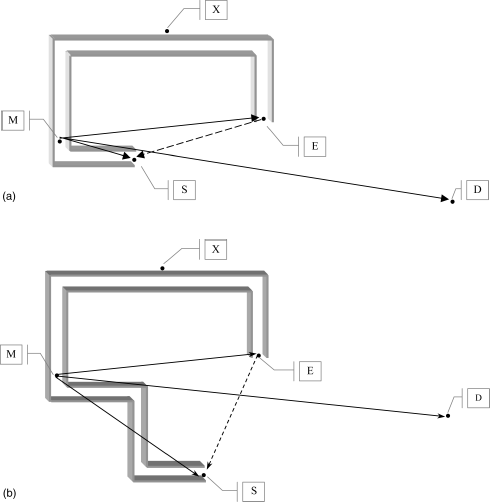
(a) Map reproducing Pathway A; (b) map reproducing Pathway B. Note: S = start, E = end, M = intermediate point, D = door, X = experimenter.
Pathway B was made up of six straight stretches: respectively, 1.57, 1.90, 2.05, 2.60, 4.70, and 1.70 m long. Pathway B was also 1 m wide and 0.30 m high. Overall length to be navigated was 14.52 m, including five right angles. Pathway B was thus more intricate and unfamiliar than Pathway A, as it included two extra lengths, two extra right angles, and an additional 3.97 m in length.
The start (S) and the end (E) of the pathways were indicated by two 30 × 30 cm squares marked on the floor. Another square of the same size (M) was placed at an intermediate point along each of the two pathways. The straight-line distance between point M and point S was 1.20 m for Pathway A and 3.80 m for Pathway B. For both pathways, straight-line distances were 4.90 m between point M and point E, 3.90 m between point E and point S, and 8.30 m between point M and the door (D).
The experimenter who read the instructions (X) was placed outside the pathway, in a position that was equidistant with respect to the final (E) and intermediate (M) points of the pathway.
Procedure
Participants were tested individually, and none of them had been in the experimental room before. The entire experiment lasted approximately 45 minutes and was divided into two sessions, one for each pathway. All participants walked both pathways. Half of the participants walked Pathway A in the first part of the experiment, and remaining participants started with Pathway B. There was an intersession interval of approximately 10 minutes. The instructions and procedure described below were identical for both pathways.
The sighted participants were blindfolded before entering the room where the experiment was to take place. In contrast with several prior studies, we excluded from our methodology any guided exploration of the environment in order to have the best approximation to the independent navigation that can be made even by sighted participants in an everyday context when vision is precluded (e.g., in a dark room or in a starless night). Accordingly, we offered to all participants a cane similar to the cane typically used by persons with blindness. We first showed them how to use the cane by moving it right and left on the floor and offering them the opportunity of practising with its use. After they learned that the cane allowed them to pick up information such as width of the pathway and the presence of turns, they began the training phase. In this pre-experimental training phase, both groups were asked to walk a pathway situated outside of the room, consisting of 15 m with three straight stretches and two right angles. The sighted blindfolded participants started the experiment only when they felt confident with the use of the white cane. Only 3 participants asked the experimenter to walk along the preexperimental pathway again.
The experiment began when participants stood in front of the door (D) of the experimental room and were asked to open it. Once they had entered the room, an experimenter led each participant in a straight line to the start of the pathway (S). At this point, another experimenter, waiting in the position indicated by X in Figures 1a and 1b, read the following instructions: “You are now at the beginning of a pathway delimited by plywood boards. Please move the cane left and right in order to determine the width of the pathway. Your task is to walk along the pathway until it ends. When you have reached the end of the pathway, I will tell you to stop. While you are walking the pathway, please count backwards aloud from one hundred.” Thus our participants explored autonomously the pathways and were not guided through them by the experimenter. Finally, the last instruction of counting backwards overtly was to prevent participants from forming a linguistic representation of the pathway by rehearsing and memorizing the various lengths walked in propositional form (e.g., “after five steps, turn left 90°, then right 90°, and so forth”).
Once they had arrived at the end of the pathway, the participants were asked to return from point E, where they were standing, to point S without walking backwards, but by the shortest way (indicated by the dashed line in Figures 1a and 1b). If they happened to touch the plywood in a different point from the final one, their pathways were considered concluded. Once they had reached what they considered the starting point, participants were brought back to point E and from there were told to walk a stretch of the pathway backwards and were made to stop at point M.
From this position, participants were asked to make several direction estimates and distance judgements. Direction estimates consisted in pointing (with a laser pointer) from their actual position (M) toward locations D, S, and E, respectively.
For distance judgements, participants were asked to judge straight-line distances between point M and each of the three remaining landmarks D, S, and E, in that order. Since there is evidence that persons with blindness have impaired conventional measure length use (Haber et al., 1993; Hollins & Kelley, 1988; Wanet & Veraart, 1985), all participants—both with and without blindness—were given a stick before performing distance judgements, were asked to explore it haptically, and were told that it was 1 m long. They were then asked to refer to the stick as a unit of measure for their distance judgements.
Lastly, at the end of the session, participants were asked to draw the pathway that they had walked. Participants with blindness were given a “rubber blueprint” for this task, given their greater familiarity with this tool. 2 Conversely, sighted participants used paper and pen to make their drawings, while still blindfolded.
This is a special board upon which a sheet of particular material is placed; with a proper pen, a raised drawing can be made.
In summary, the entire experimental session comprised the four following tasks:
Pathway completion (proceeding from point E to point S without walking the pathway backwards, but by following the shortest way); Direction estimates (M–D, M–S, M–E); Straight-line distance judgements (M–D, M–S, M–E); Pathway drawing.
Results
Pathway completion
Error rate was analysed by calculating the angular degrees of difference between the correct point (S) and the point in which participants stopped when asked to return from the end of the pathway (E) to the start (S) by the shortest way.
Overall, participants with congenital blindness performed better (M = 23.4°, SD = 24.92°) than sighted participants (M = 43.63°, SD = 42.5°). Figure 2 reveals that this difference was greater for Pathway B.
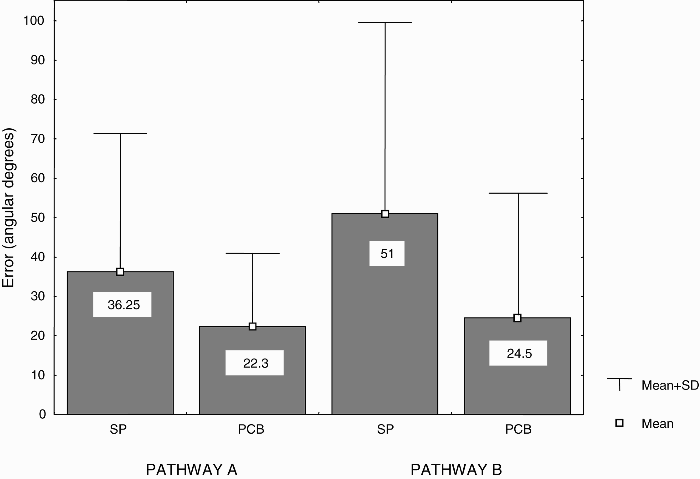
Mean angular degrees of error in the pathway completion task for blindfolded sighted participants and participants with congenital blindness as a function of the two pathways. Note: SP = blindfolded sighted participants, PCB = participants with congenital blindness.
A 2 × 2 analysis of variance (ANOVA) was conducted with one between-participants factor (group: participants with blindness vs. sighted participants) and one within-participants factor (pathway: A vs. B). Results showed a significant main effect of group, with participants with congenital blindness performing better than sighted participants, F(1, 38) = 5.42, p = .025. Although the Group × Pathway interaction did not reach statistical significance (p = .36), post hoc tests (Tukey HSD) were calculated for theoretical interest. Comparisons revealed that the difference between participants with blindness and blindfolded sighted participants was significant only for Pathway B (p = .043). No other post hoc contrasts were significant.
Direction and distance estimates
Figure 3 shows the vectorial representation of the responses for each participant and subgroup split up for both pathways as a function of the three direction and distance estimates (M–D, M–S, M–E).
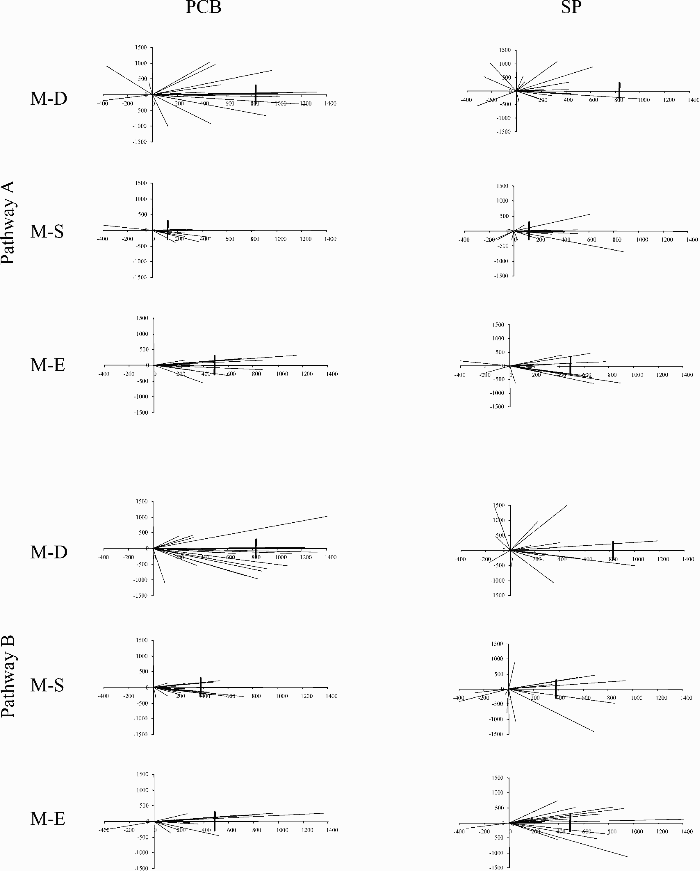
Vectorial representation of the responses for both pathways as a function of the three direction and distance estimates. Note: PCB = participants with congenital blindness, SP = blindfolded sighted participants, M–D = distance between M-point and door, M–S = distance between M-point and start, M–E = distance between M-point and end. The vertical line on the x-axis represents the correct distance.
Direction estimates
Performance was evaluated by analysing errors. Error rate was measured by calculating the angular degrees of difference between the point the participants indicated by laser and its real location in the environment layout, for each of the three direction estimates (M–D, M–S, M–E). Errors in every direction estimate were then averaged on each participant, thereby constructing an overall direction-estimate-error index for each participant.
Overall, participants with congenital blindness performed better (M = 31.43°, SD = 22.12°) than sighted participants (M = 47.6°, SD = 22.5°). Means for each subgroup and pathway (see Figure 4) were entered into a 2 × 2 ANOVA similar to the previous one, which treated group (participants with blindness vs. sighted participants) as a between-participants factor and pathway (A vs. B) as a within-participants factor.
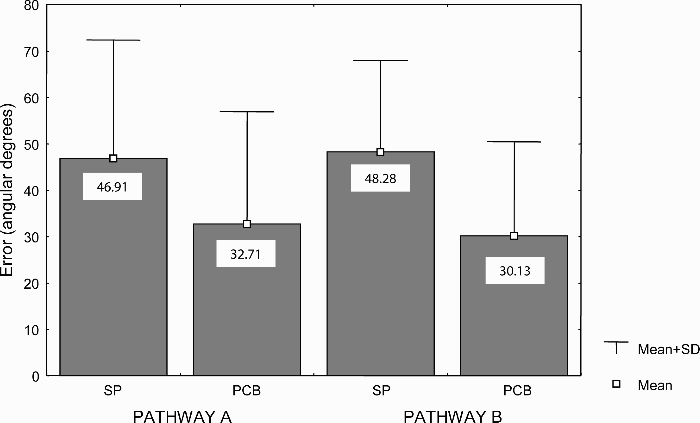
Mean angular degrees of error in direction estimates for blindfolded sighted participants and participants with congenital blindness as a function of the two pathways. Note: SP = blindfolded sighted participants, PCB = participants with congenital blindness.
A significant main effect of group was found, F(1, 38) = 7.22, p = .01, such that participants with congenital blindness made more accurate direction estimates than did sighted participants. Once again, although the interaction between the two main factors turned out to be nonsignificant, post hoc tests (Tukey HSD) were calculated showing a significant difference between groups only for Pathway B, p = .009.
Distance judgements
Errors in distance judgements were considered the dependent variable with which to compare the performance of participants with blindness and sighted participants. This measure was the absolute value of the differences between the distance that participants estimated, encompassing from point M (where they actually were) to the point that they were asked to consider, and the real distance between these two locations. Errors on each of the three distance judgements (M–D, M–S, M–E) were averaged over participants, and the resulting means showed that, overall, the performance of participants with congenital blindness (M = 282.25 cm, SD = 110.47) was better than that of sighted participants (M = 371.62 cm, SD = 170.26). Figure 5 shows that this effect was greater for Pathway B.
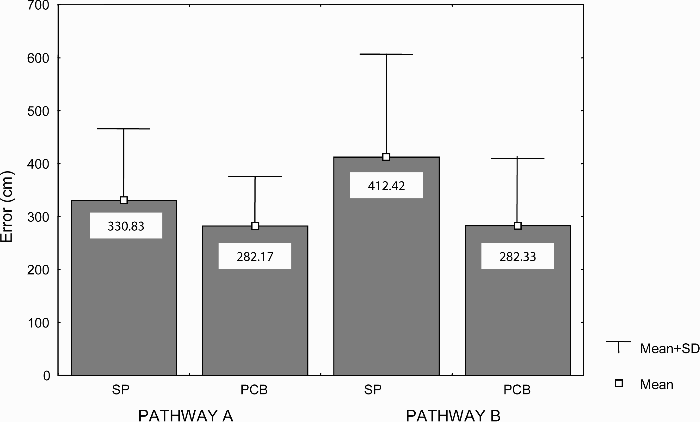
Mean centimetres of error in distance judgements for blindfolded sighted participants and participants with congenital blindness as a function of the two pathways. Note: SP = blindfolded sighted participants, PCB = participants with congenital blindness.
A 2 × 2 ANOVA conducted on these data revealed a main effect of group with a better performance in participants with congenital blindness, F(1, 38) = 4.84, p = .033, and a main effect of pathway, indicating that the Pathway B was more difficult than A, F(1, 38) = 4.44, p = .041. The interaction between group and pathway was also significant, F(1, 38) = 4.40, p = .043. Post hoc tests confirmed that the difference between groups was significant for Pathway B only, p = .001.
Drawing
Figure 6 reproduces some examples of the drawings made by participants with congenital blindness and control participants for both pathways.
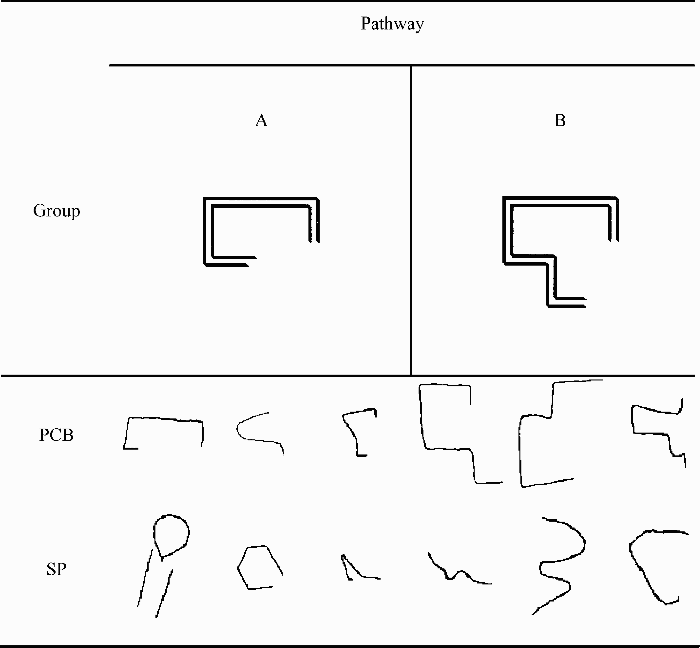
Examples of some drawings reproducing Pathways A and B made by blindfolded sighted participants and participants with congenital blindness. Note: PCB = participants with congenital blindness, SP = blindfolded sighted participants.
An examination of the sketches revealed that few participants were able to correctly reproduce the pathways, and those who did were consistently participants with congenital blindness. From an essentially qualitative analysis, it also emerged that, considering direction drawn as well as number of segments, participants with blindness seemed more precise. Furthermore, regarding the actual shape of the pathway, only two participants with blindness drew curves (which actually were not present along the pathways), whereas nearly half of the sighted participants drew curves.
Five independent judges were asked to rate each of the drawings on a 5-point Likert scale (where 1 stood for “very dissimilar” and 5 for “very similar” to the actual pathway layout). Judges were presented with the drawings individually and in random order with a picture of the real pathway for reference. There were no time constraints. Overall, participants with congenital blindness (Mdn = 3.7) were judged to be more accurate than sighted participants (Mdn = 2.55). Rates were analysed with a Mann–Whitney U test, which confirmed that the two groups differed significantly in drawing accuracy, U = 104, p = .026. As can be seen in Figure 7, this group difference was more evident for drawings of Pathway A. Thus, group performances on Pathways A and B were also compared separately.
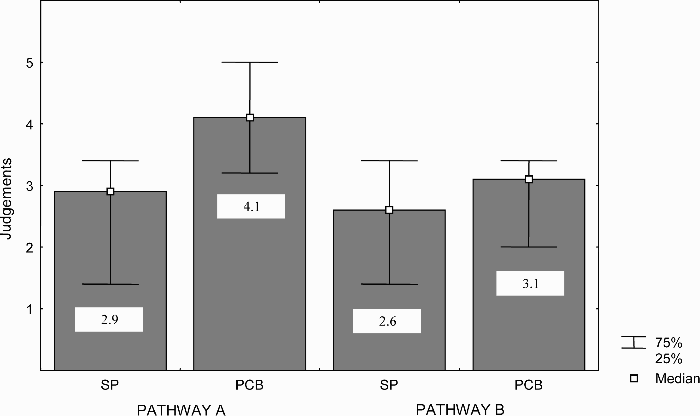
Judgements of drawing accuracy for blindfolded sighted participants and participants with congenital blindness as a function of the two pathways. Note: SP = blindfolded sighted participants, PCB = participants with congenital blindness.
Results of a Mann–Whitney U test conducted on drawings reproducing Pathway A were highly significant (U = 95, p = .004), whereas the test for Pathway B drawings were not (U = 150, p = .38).
Discussion
In this experiment we tested people with congenital blindness and blindfolded sighted participants on different tasks testing inferential information typically relying on survey representations of the space. Although the use of other nonsurvey spatial representations can not be ruled out in principle, a survey representation is the most likely for performing our tasks as suggested both by the past literature and by the actual experimental conditions. Indeed, other types of representation and strategy could be used for doing the tasks but, presumably, with higher cognitive costs and less accuracy in the responses. More specifically, participants might use other strategies such as a continuously updating an egocentric representation of the space or, alternatively, adopting Euclidean geometric or mathematical procedures. However, as the participants were required to counting backward, all these alternative strategies should turn to a memory overload (especially in our complex and unfamiliar pathways). Furthermore, since our participants did not know in advance the tasks required after the exploration, the continuous updating of this egocentric coding strategy would appear unmotivated.
The findings reported thus far seem to support a straightforward conclusion concerning our first main query: Visual deprivation in infancy apparently does not affect the setting up of survey representations. However, in contrast to other studies that have yielded similar interpretations about the role of early visual experience (Haber et al., 1993; Klatzky et al., 1995; Landau, 1986; Loomis et al., 1993; Ochaita & Huertas, 1993; Passini et al., 1990; Worchel, 1951), we also observed a between-group difference. Unexpectedly, our participants with congenital blindness performed better than (not as well as) blindfolded sighted controls in all the four tasks. These data cannot be explained simply by considering that sighted persons were blindfolded, since there is some evidence from spatial updating literature that shows that blind navigation is not a problem for sighted persons when they are asked to perform inferential tasks similar to those used here (Rieser et al., 1986; Worchel, 1951). Thus, these findings are more likely to be explained in terms of better than average performance of blind participants rather than poorer performance of sighted volunteers. Furthermore, this between-group difference was particularly evident with the more unfamiliar and difficult pathway, suggesting that the superiority of persons with blindness was not due to the use of an overlearned schematic representation of a well-known spatial pattern. Our results create problems for the aforementioned conclusion and force us to carefully consider other intervening experimental factors, which differ between groups and may be likely to account for this finding. Indeed, concluding that people with blindness encode and process spatial information in survey representations more efficiently than the sighted do would be counterintuitive and inconsistent with results from any prior study. Furthermore, this is also in contrast with our foregoing prediction that a lower performance of persons with blindness in spatial tasks should be more evident with complex and intricate configurations of unfamiliar environments. A possible intervening factor is that, in addition to the presence or absence of vision during infancy, participants with congenital blindness and sighted participants differ also in their habit of relying on other sensory modalities for spatial coding. As a consequence of lack of visual experience, children with congenital blindness learn to extract environmental spatial information from sources other than vision (such as proprioceptive and kinaesthesis information or haptic perception), which is not the case for sighted children. Perhaps the worse performance of our blindfolded sighted participants was determined by our unusual and difficult condition, consisting in a temporary lack of vision associated with their lack of skill in using other nonvisual modalities when the use of vision is prevented. Given this unbalanced situation, we cannot reach any clear conclusion from the results of Experiment 1, since the relative contribution of visual experience cannot be disentangled from the habit of using other modalities to explore environments when the use of vision is not possible.
In contrast to children with congenital blindness, children who acquired blindness later in life do experience (as sighted people do) visual feedback information—generated by locomotion—as well as the effect of simultaneity that vision provides. This sensitivity should remain even in adulthood, when, as a consequence of late-onset blindness, visual information is no longer available (Millar, 1994). Nonetheless, similarly to individuals with congenital blindness (and in contrast with blindfolded sighted persons), after vision loss, people with late blindness also learn to extract spatial information from haptic perception, audition, kinaesthesis, and proprioception. It thus follows that (a) persons with late blindness and sighted persons have the same experiences of visual perception in childhood but vary in their habit of using nonvisual modalities, and (b) individuals with late and congenital blindness both acquire the same skill in exploring the environment through nonvisual modalities but vary with respect to visual experience. Consequently, a comparison of the performance of participants with congenital blindness and blindfolded sighted participants with that of individuals with late blindness would allow us to account for the relative contribution of vision during infancy, as opposed to skill in relying on nonvisual channels in setting up survey representation. We therefore replicated Experiment 1, but with the inclusion of a third group of participants with late blindness in our sample.
Based on the above-presented premises, a number of hypotheses can be formulated about the outcome of this contrast: (a) If visual experience in infancy is necessary for proper spatial encoding in survey representation, a comparison of the performance of participants with congenital blindness with that of participants with late blindness should tilt significantly in favour of the latter group; if, conversely, we should observe no between-group difference, this would clearly confute the previous hypothesis; (b) if the habit of exploring and extracting spatial invariants through nonvisual modalities improves spatial performance, we should observe better performance in participants with late blindness than in blindfolded sighted participants; if not, the contribution of this factor could be judged as negligible; (c) finally, if both these factors—that is, visual experience and habit of exploring the environment through nonvisual modalities—necessarily determine the establishment of survey representations, participants with late blindness would be expected to perform significantly better than either of the other two groups.
Experiment 2
Method
Participants
The three subgroups were composed of 13 participants with total congenital blindness who did not participate in Experiment 1 (9 men and 4 women, M = 44.2 years, SD = 13.7, age range = 26–68 years), 13 participants with total late blindness (9 men and 4 women, M = 53.2 years, SD = 15.3, age range = 19–77 years), and 13 sighted persons (9 men and 4 women, M = 52.8 years, SD = 17.3, age range = 21–78 years). Congenital blindness was due to optic nerve atrophy (3 participants), congenital retinitis pigmentosa (3), congenital microphthalmy (2), retrolental fibroplasia (2), childbirth trauma (2), and congenital cataract (1). Late blindness was due to retinal detachment (7 participants), retinitis pigmentosa (4), glaucoma (1), and bilateral eye tumor (1). The group of participants with late blindness included persons who had been sighted until at least age 12.
In no instances was blindness associated with central nervous system dysfunction. All participants with blindness were self-sufficient in navigating their surroundings with a white cane.
The three subgroups were matched for education and age. All participants gave informed consent and received no compensation for their participation in the study.
Materials and procedure
The materials and procedure were the same as those used in Experiment 1.
Results
Pathway completion
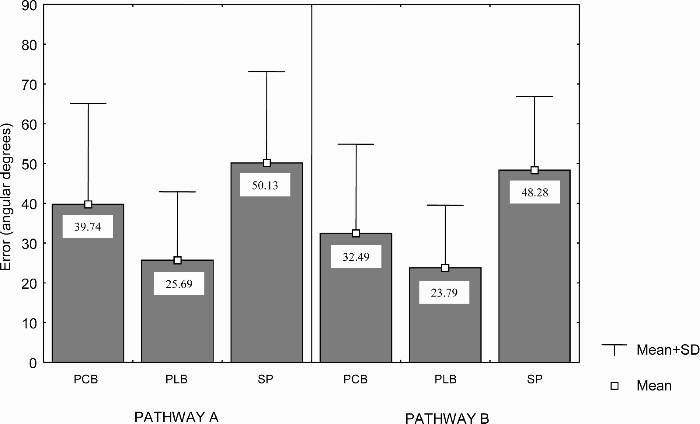
Overall, the performance of blindfolded sighted participants (M = 62.73°, SD = 51.7) was worse than that of both participants with congenital blindness (M = 26.81°, SD = 28.79) and those with late blindness (M = 29.15°, SD = 29.62), who, in turn, did not differ relevantly from each other in performance. As can be seen in Figure 8, this difference was higher for Pathway B.
Mean angular degrees of error in the pathway completion task for participants with congenital blindness, participants with late blindness, and blindfolded sighted participants as a function of the two pathways. Note: PCB = participants with congenital blindness, PLB = participants with late blindness, SP = blindfolded sighted participants.
A 3 × 2 analysis of variance (ANOVA) with group as the between-participants factor (sighted participants, participants with congenital blindness, and participants with late blindness) and pathway as the within-participants factor (A vs. B) was conducted on angular degrees of error. The ANOVA revealed a main effect of group, F(2, 36) = 7.14, p = .002. Post hoc tests (Tukey HSD) showed that participants with blindness performed better than sighted participants: sighted participants versus participants with congenital blindness, p = .005; sighted participants versus participants with late blindness, p = .009. Conversely, the difference between participants with congenital blindness and participants with late blindness was nonsignificant, p = .97. The effect of pathway did not approach statistical significance, but the interaction between the two factors was marginally significant, F(2, 36) = 3.07, p = .059, indicating that group differences were more evident for Pathway B than for Pathway A. Post hoc tests confirmed this conclusion, showing that persons with blindness (both congenital and late) performed reliably better than sighted participants in Pathway B and not in Pathway A (Pathway B: sighted participants vs. participants with congenital blindness, p = .009; sighted participants vs. participants with late blindness, p = .003). Post hoc comparisons between persons with congenital blindness and those with late blindness did not reach statistical significance for either pathway.
Direction and distance estimates
Figure 9 shows the vectorial representation of the responses for each participant and subgroup split up for both pathways as a function of the three direction and distance estimates (M–D, M–S, M–E).
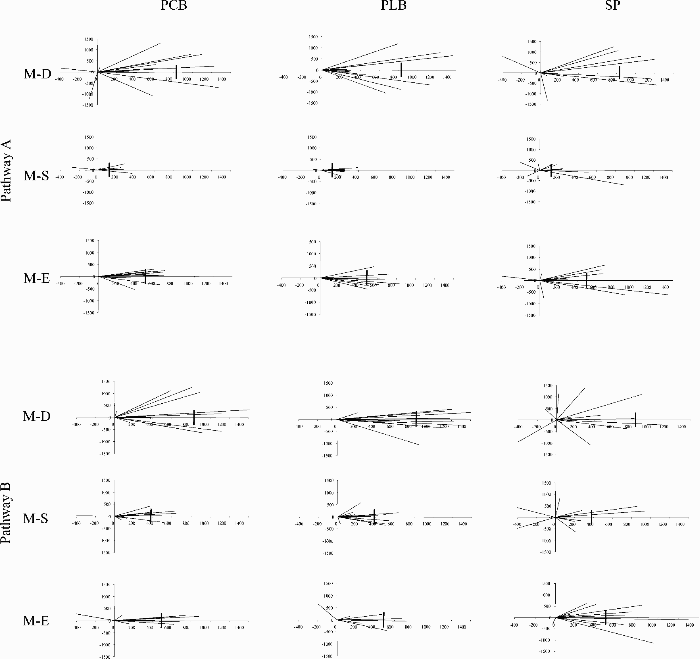
Vectorial representation of the responses for both pathways as a function of the three direction and distance estimates. Note: PCB = participants with congenital blindness, PLB = participants with late blindness, SP = blindfolded sighted participants, M–D = distance between M-point and door, M–S = distance between M-point and start, M–E = distance between M-point and end. The vertical line on the x-axis represents the correct distance.
Direction estimates
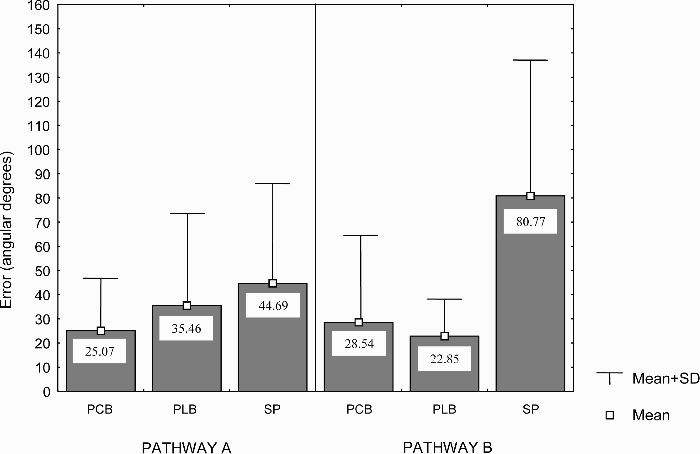
Overall, the performance of blindfolded sighted participants (M = 49.21°, SD = 20.47) was worse than that of both participants with congenital blindness (M = 36.12°, SD = 23.71) and those with late blindness (M = 24.74°, SD = 16.16). Figure 10 reports mean errors of the three groups split by pathway.
Mean angular degrees of error in direction estimates for participants with congenital blindness, participants with late blindness, and blindfolded sighted participants as a function of the two pathways. Note: PCB = participants with congenital blindness, PLB = participants with late blindness, SP = blindfolded sighted participants.
The ANOVA revealed a significant main effect of group, F(2, 36) = 6.57, p = .0037. Post hoc comparisons indicated that participants with late blindness performed reliably better than sighted participants (p = .003), whereas the contrast between participants with congenital and late blindness was nonsignificant, p = .23. There was no significant main effect of pathway and no significant Group × Pathway interaction.
Distance judgements
Overall, the performance of blindfolded sighted participants (M = 387.44 cm, SD = 141.05 cm) was worse than that of both participants with congenital blindness (M = 265.13 cm, SD = 87.3 cm) and those with late blindness (M = 278.19 cm, SD = 63.87 cm). Figure 11 shows that participants with blindness made more accurate distance judgements for both pathways than sighted participants did. Conversely, participants with congenital blindness and participants with late blindness reached approximately the same level of accuracy. 3
A person with congenital blindness was discarded from statistical analysis because of problems in recording his answers in Pathway A.
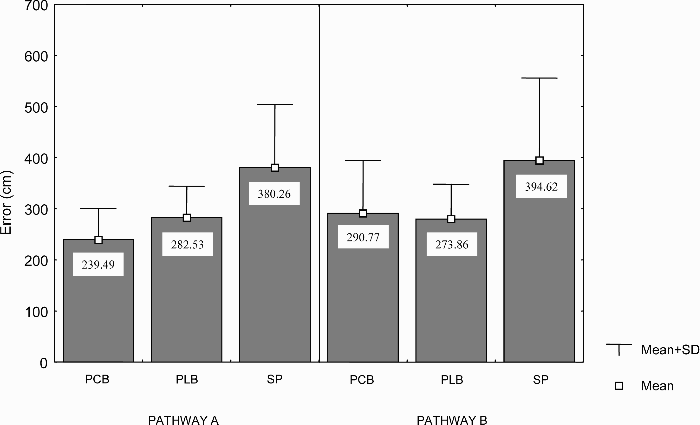
Mean centimetres of error in distance judgements for participants with congenital blindness, participants with late blindness, and blindfolded sighted participants as a function of the two pathways. Note: PCB = participants with congenital blindness, PLB = participants with late blindness, SP = blindfolded sighted participants.
The ANOVA confirmed a significant main effect of group, F(2, 35) = 6.197, p = .005. Post hoc testing revealed that participants with blindness performed significantly better than sighted participants (sighted participants vs. participants with congenital blindness, p = .007; sighted participants vs. participants with late blindness, p = .02). By contrast, the performance of participants with congenital blindness and that of participants with late blindness did not significantly differ, p = .94. The effect of pathway and the interaction between group and pathway were nonsignificant.
Drawing
Figure 12 reproduces some examples of the drawings made by sighted participants and participants with blindness for both pathways.
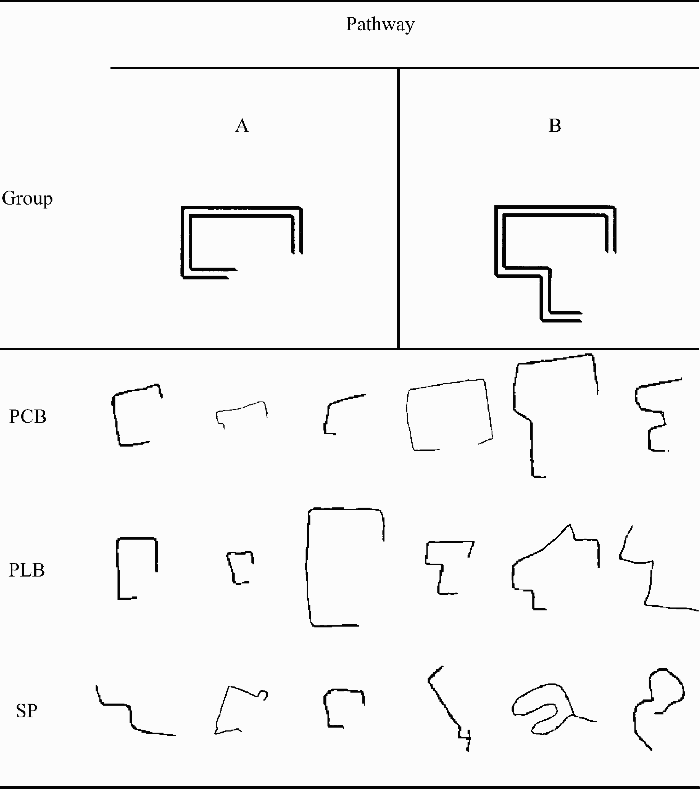
Examples of some drawings reproducing Pathways A and B made by participants with congenital blindness, participants with late blindness, and blindfolded sighted participants. Note: PCB = participants with congenital blindness, PLB = participants with late blindness, SP = blindfolded sighted participants.
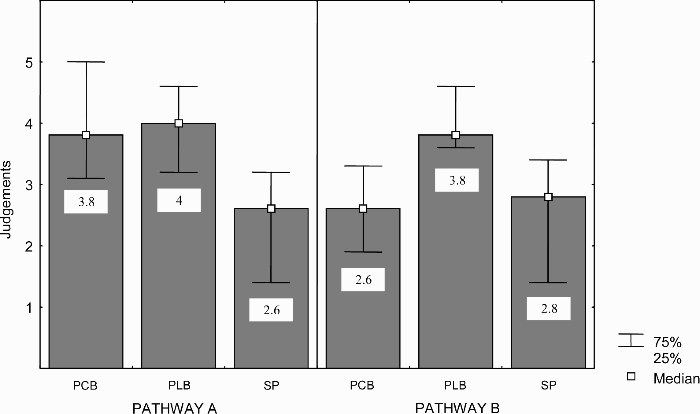
Overall, based on the same rating procedure as that adopted in Experiment 1, we found that the drawings of the participants with congenital (Mdn = 3.7) and late blindness (Mdn = 4.2) were judged to be more accurate than those of sighted participants (Mdn = 2.6). The Kruskal–Wallis test consistently showed significant differences among groups, H(2, N = 39) = 8.47, p = .015. Post hoc Dunnett comparisons confirmed that participants with late blindness performed better than sighted participants, p = .01. However, the difference between sighted participants and participants with congenital blindness, as well as the difference between participants with congenital blindness and participants with late blindness were both nonsignificant (respectively, p = .39 and p = .31). Since, as shown in Figure 13, the three groups performed quite differently with respect to the two different pathways, two separate Kruskal–Wallis tests were conducted with the aim of clarifying these discrepancies.
Judgements of drawing accuracy for participants with congenital blindness, participants with late blindness, and blindfolded sighted participants as a function of the two pathways. Note: PCB = participants with congenital blindness, PLB = participants with late blindness, SP = blindfolded sighted participants.
The first test compared judgements of drawings reproducing Pathway A and revealed significant group differences, H(2, N = 39) = 7.58, p = .02. Even though the difference between participants with congenital blindness and sighted participants approached statistical significance (p = .08), only the difference between participants with late blindness and sighted participants was clearly significant, p = .025. Conversely, the difference between participants with congenital blindness and participants with late blindness was nonsignificant, p = .99. The second Kruskal–Wallis test conducted on judgements of Pathway B drawings was also significant, H(2, N = 39) = 8.86, p = .012. Dunnett post hoc tests revealed that the drawings of participants with late blindness were considered more accurate than both those of participants with congenital blindness (p = .037) and those of sighted participants, p = .02.
Discussion
The present experiment replicates and extends the results of Experiment 1. This second experiment demonstrates that participants with late blindness performed better than blindfolded sighted participants in all tasks, whereas performance differences between participants with congenital blindness and participants with late blindness did not reach statistical significance in any of the tests (except for Pathway B drawing). We can account for the results of Experiment 2 as follows: Visual deprivation during infancy apparently does not affect the ability to develop sophisticated spatial inferences and does not prevent the construction of survey-type spatial representations, since our participants with congenital blindness were unimpaired in performing tasks that are facilitated by the availability of survey representation. Conversely, as shown by differences observed between our participants with late blindness and blindfolded sighted participants, when visual perception is lacking, skill in gathering and using environmental spatial information provided by nonvisual modalities is reliably effective and yields high performance levels.
In agreement with several prior studies (Haber et al., 1993; Klatzky et al., 1995; Landau, 1986; Loomis et al., 1993; Ochaita & Huertas, 1993; Passini et al., 1990; Worchel, 1951) the present findings show that vision is not strictly necessary for efficient spatial cognition. This is even more remarkable since our tasks required the representation of two pathways of different difficulties and having an unfamiliar configuration. Rather, it appears that spatial knowledge requires the convergence of different types of input from various modalities, which simultaneously experience environmental characteristics and environmental changes as a result of action. Nevertheless, we emphasize that this conclusion is not necessarily in contrast with other authors who claim that, under normal conditions, vision plays a calibration role in spatial encoding, by condensing many information into a single frame (Pick, 1974; Warren, 1974; Worchel, 1951). Neither are our findings in contrast with other results suggesting that vision typically provides spatial information in a more readable and ready-to-be-processed format. Instead, we argue that vision is not strictly necessary for setting up spatial coding mechanisms and, consequently, that its absence during infancy does not inevitably cause incomplete spatial development. More specifically, we suggest that, when visual experience is irremediably lacking, its calibrating role can be taken over by other nonvisual modalities (primarily, by haptic perception and proprioception). Another suitable possibility is that the overlap among the remaining types of input would rebalance the effect of visual deprivation, helping individuals with blindness rely on amodal representation to construct their spatial representations.
Experimental evidence from other areas of research support both of these possibilities. As far as the first possibility is concerned, Warren and Pick (1970) compared participants with congenital blindness, those with partial blindness, and blindfolded sighted participants in an audition-proprioceptive conflict situation. They found that in persons with congenital blindness, proprioceptive information strongly biased audition in pointing tasks. Kerr (1983) asked participants with congenital blindness to haptically explore objects and then tested mental imagery with a mental-scanning task, showing that the images of participants with blindness preserve metric spatial information regarding distance. Other studies on mental imagery demonstrated that participants with congenital blindness are able to mentally rotate an object previously experienced by touch (Marmor & Zaback, 1976) or to correctly draw it from a different perspective (Heller & Kennedy, 1990).
Carreiras and Codina (1992), in an effort to explain the lack of differences among participants with early blindness, participants with late blindness, and blindfolded sighted participants in spatial memory tasks, proposed that participants with blindness rely on amodal representation. Other more recent research has indicated that spatial representations constructed through different means (e.g., derived from vision, audition, touch, language, etc.) are functionally equivalent and perhaps even identical (Avraamides, Loomis, Klatzky, & Golledge, 2004; Bryant, 1997; Denis & Cocude, 1989; De Vega, Cocude, Denis, Rodrigo, & Zimmer, 2001; Loomis, Lippa, Klatzky, & Golledge, 2002). These findings suggest the existence of a common spatial representation system, which receives inputs from various channels and constructs amodal spatial representations. Furthermore, electroencephalographic (EEG) and event-related potentials (ERP) studies have documented that early visual deprivation modifies human brain functioning beyond visual areas in the occipital cortex, extending its effects to various associative regions in the parietal cortex (Kujala, Alho, Paavilainen, Summala, & Naatanen, 1992; Noebel, Roth, & Kopell, 1978; Wanet-Defalque et al., 1988). A modality-specific brain area that is totally deprived of its normal sensory input (such as occipital cortex of persons with blindness) becomes responsive to stimulation of other modalities (Kujala, Alho, & Naatanen, 2000). For instance, occipital cortex of the persons with blindness is activated by sound changes when participants are required to detect these changes (Kujala et al., 1995). Moreover, transcranial magnetic stimulation (TMS) applied to the occipital cortex of individuals with blindness results in distortions and omissions of letters in Braille text (Uhl, Franzen, Lindinger, Lang, & Deecke, 1991). Hence, there is evidence that nonvisual spatial information in individuals with early blindness and sighted individuals is already processed differently at the neuronal level. Although an unambiguous interpretation of these data is not quite yet at hand, neuroscientific researches suggest that compensatory functional mechanisms may occur at brain level and that processes could represent the neural underpinnings of behavioural strategies for coping with difficult spatial tasks on the cognitive level.
General discussion
The present study showed that, at least in terms of performance, a lack of early visual experience does not affect the survey-type spatial processing required in our tasks. Consistently, the comparison between congenital and late blind participants in Experiment 2 turned out not significant. It also shows that learning to rely on nonvisual modalities for spatial coding, when vision is not possible, may contribute to proper spatial cognition. Indeed, participants with late blindness, who get used during the years to collecting spatial information by nonvisual modalities, performed better than blindfolded sighted participants. Furthermore, our results indicate that the availability of information from sources other than vision allows spatially well-informed blind people to cope not only with specific tasks on which they have been trained, but also with different types of new spatial inference. Summing up, we conclude that visual deprivation during infancy does not necessarily cause incomplete spatial development and impair future spatial abilities. Our findings are of particular interest as some prior studies using similar inferential tasks reported that sighted participants outperformed blind participants, thereby indicating an opposite trend.
Therefore, how can we explain the aforementioned discrepant results found in the literature, obtained with participants with congenital blindness performing survey-representation-based tasks? Why have some authors reported that persons with early blindness are severely impaired, while other authors have not observed this effect? Several individual and experimental factors may be involved, which interact in complex ways and can account for these controversial outcomes.
Instead of attributing spatial deficits reported in some studies directly to blindness, we suggest that the lack of vision can impact aspecifically on spatial cognition, by delaying, for instance, the development of fully fledged spatial representational abilities, or by forcing the persons with blindness to rely on alternative strategies, requiring more computational efforts in terms of memory resources or time for information processing. Both of these possibilities have been contemplated to account for between-group differences. In research by Ochaita and Huertas (1993), whereas sighted adolescents were shown to have fully developed spatial skills by age 14, persons with blindness demonstrated delayed development, achieving spatial cognition maturity at approximately age 17. In the same vein, since early visual experience may help people manage a larger number of items simultaneously, longer reaction times of participants with blindness have been explained in terms of short-term working memory overload (Cornoldi, Cortesi, & Preti, 1991). Accordingly, during inferential tests, performance impairments in participants with early blindness have been more frequently reported when greater numbers of items must be processed. Thus, participants with congenital blindness deficits (when observed) are probably due to difficulties in learning efficient spatial-processing skills, as opposed to the absence of potentialities to do so. Therefore, visual deprivation, rather than directly preventing the setting up of the survey spatial system, forces people with blindness to develop compensatory processes by implementing specific strategies to cope with problems in organizing sequential features (more easily encoded in route representations) into actual spatial relationships (e.g., into survey representations). The effectiveness of these different strategies in dealing with external environmental space clearly depends on idiosyncratic factors, the most important being possibly the degree and type of motor education received by the person with blindness during childhood (Loomis et al., 1993; Ochaita & Huertas, 1993).
Regarding the influence of experimental factors, we point out that the studies that we have thus far discussed differ in many methodological aspects. Thus, it is difficult to properly compare these studies and to disentangle the characteristics that are likely to influence participants’ performance from factors that should most probably be considered irrelevant. Nonetheless, researchers have focused their attention on three experimental factors usually regarded as potential sources of variability and misleading interpretations: task difficulty, degree of familiarity with the experimental layout, and type of required response. The first two factors are clearly interconnected since a high degree of familiarity with the experimental layout decreases task difficulty for participants. Accordingly, as soon as participants are familiar with all pathways, even tests that are normally designed as inferential and survey based could be easily managed with the use of overlearned information. Moreover, although some studies used inferential tests in environments that were not previously explored, others involved computation based on pathways with familiar geometrical arrangements, such as triangle completion (Klatzky et al., 1995; Loomis et al., 1993; Worchel, 1951) or square completion (Millar, 1981b). It thus follows that, even in these instances, the participants’ performances were apparently facilitated, to some extent, by their previous knowledge of the spatial properties of the shapes of the pathways. In the present study, all of our participants were unfamiliar with the experimental room and explored two pathways of varying degrees of difficulty. Thus, our experimental design enabled us to directly assess the role of environmental layout difficulty, showing that blind people had a better opportunity of expressing their spatial competence in the difficult environment than in the easier one. Pathway complexity enhanced group differences, avoiding possible ceiling effects for tests that are too easy.
Another methodological factor is response type and its apparent role in determining performance levels. Typically, studies that are not specifically aimed at revealing the effect of response type on participants’ performance adopt a single modality of response for each task. Therefore, the specific weight of this factor in modulating performance levels remains unclear. Moreover, to our knowledge, no research has yet directly assessed the effect of different types of response in determining intergroup differences. As opposed to prior investigations, the present study measured direction estimates in two different ways: by asking participants to walk from location E to S (Task 1) and laser pointing (Task 2). Even in our procedure for collecting straight-line distance judgements, we aimed our efforts at reducing the impact of intervening sources of variability. In fact, participants with blindness were allowed to use a friendly measure of length. 4 The findings showed comparable results in all the tasks, independent of the response type required, thus suggesting that the role of response type may be overestimated, especially in terms of its effects in producing between-group differences (i.e., relative differences), as opposed to absolute differences in performance levels previously reported (Haber et al., 1993; Hollins & Kelley, 1988; Wanet & Veraart, 1985).
Note also that, since the stick was 1 m long, sighted participants could easily refer to a conventional and well-known unit of measure with no additional effort. Thus, although the method may possibly have helped participants with blindness, it did not bias sighted participants’ responses.