
Abstract
In the 2–4–6 rule discovery task, reasoners seek to discover a rule that governs the arrangement of three numbers (or triple). The to-be-discovered rule is “ascending numbers”. Upon being given the triple 2–4–6 as an initial example, however, reasoners tend to formulate algebraically specific hypotheses. Traditionally, this task is conducted primarily from an internal representation of the triples and candidate hypotheses. More recently, substantial representational effects have been demonstrated wherein an external representation of the dimensions of the problem space facilitated successful rule discovery. In the two experiments reported here, an interactive graphical representation was created by concurrently plotting each triple produced by the participants. In Experiment 1, participants who performed the task with this external representation were more likely to discover the rule than were a group of control participants. Experiment 2 replicated the effect but also assessed participants’ hypotheses for each triple generated. Results indicated that a graphical representation of the triples fostered the development of hypotheses that were less constrained by the implied algebraic specificity of the initial triple.
A common aphorism in reasoning and problem-solving research holds that a problem's representation is key to its solution (Simon, 1996). The physical presentation of a problem plays an important role in fostering a productive representation of its structure, possible operators, and candidate solutions (Ohlsson, 1984). Representational effects on problem-solving behaviour have been elegantly demonstrated by Norman (1993) and Zhang (1997; Zhang & Norman, 1994). These studies illustrate that the manner with which a problem is externally presented determines the cognitive strategies that reasoners employ to solve it and ultimately their success at finding a solution. For example, Zhang (1997) contrasted problem-solving behaviour in two task isomorphs: noughts and crosses and the “game of fifteen”. In the latter, two players take turn selecting integers from 0 to 9, with the goal of being first to select three that sum to 15 (Simon, 1996, chap. 5). At one level of analysis the game of fifteen is isomorphic to noughts and crosses since arranging the nine digits in a magic square amounts to each column, row, or diagonal summing to 15. While noughts and crosses is played on the basis of a rich external representation involving a visual display of the grid and a record of each player's move, the game of fifteen proceeds primarily from the players’ internal representation of the game. As a result, the game of fifteen fosters a poorer appreciation of the strategic imperative for a win or a draw than does traditional noughts and crosses. Such results illustrate that problem isomorphs may vary significantly in the richness of the information embedded in their physical representation and may vary in terms of their potential to shoulder some of the computational burden associated with sound reasoning (cf. Scaife & Rogers, 1996).
Wason's 2–4–6 Task
The experiments reported here examined hypothesis-testing behaviour using the 2–4–6 rule discovery task in conditions where reasoners were provided with a rich external representation of the problem. In the traditional 2–4–6 task, participants must infer the correct rule that governs the production of sequences of three numbers (triples). Participants are informed that the triple 2–4–6 confirms the rule and are instructed to generate new number sequences to test their hypotheses until they feel highly confident they have discovered the rule. The correct rule is “ascending numbers”. However, the initial 2–4–6 triple is critical in its transparent specificity: It encourages participants to formulate overly narrow hypotheses such as “even numbers increasing in twos”, “numbers increasing by a constant”, “third number = first number + second number”, that are too algebraically focused (see Cherubini, Castelvecchio, & Cherubini, 2005). The scope delineated by these hypotheses is much narrower than, and at times nested in, the one delineated by the correct hypothesis (viz., ascending numbers). As a result, the commonly adopted positive test strategy (Klayman & Ha, 1987) can lead participants to produce triples that receive positive feedback, which strengthens the perceived plausibility of these incorrect hypotheses. Unsurprisingly, the majority of participants in the 2–4–6 task fail to announce the correct rule on their first attempt. Nearly 80% of Wason's (1960) participants announced an incorrect rule on their first attempt, a finding much replicated since (e.g., Gale & Ball, 2006; Tweney et al., 1980).
The hypothesis-testing behaviour of participants engaging in the traditional 2–4–6 task is characteristically indolent and prosaic. That is, participants exhibit little diligence before announcing their best guess, testing on average five number sequences. Clearly, the need to work harder at discovering the rule is hampered by the abundance of positive feedback that participants invariably receive for these initial triples. Second, participants produce new number sequences that seldom depart from a relatively narrow range of possibilities. In other words, participants exhibit little creativity in the process of producing and testing new number sequences, consequently exploring but a very small region of the space of possible triples. Again, in light of the abundance of positive feedback, participants experience little pressure to explore different regions of that space. In scientific hypothesis testing there is no hard and fast method that guarantees inferential success. “Discovery is not subject to any fixed rule” (Duhem, 1962, p. 98), and this is certainly the case in the 2–4–6 task (cf. Gorman & Gorman, 1984). It is clear, however, that those who do succeed exhibit, in relative terms, considerably more diligence and creativity than those who do not, producing a significantly greater number of triples of a much broader variety before announcing their first guess (Gale & Ball, 2006; Vallée-Tourangeau, Austin, & Rankin, 1995).
Distributed Representation
In Wason's rule discovery task reasoners must map the scope and generalizability of their hypotheses, and as such this inferential challenge is representative of real-world hypothesis testing. What stretches its ecological validity, however, is the fact that the task, in its original formulation and many of its replications, proceeds primarily from an internal representation of the triples and possible hypotheses. To be sure, participants commit their triples on an answer sheet that provides an external record of past triples and associated feedback, and in that respect part of the hypothesis-testing process is externalized. Yet, real-world hypothesis testing proceeds from a close interaction between ideas and artefacts. For example, the process of building and tinkering with a three-dimensional model of the DNA molecule served as an important induction catalyst that encouraged the development of new hypotheses concerning its structure. Watson (1968, pp. 47–48) describes the hypothesis-testing methods of Linus Pauling this way:
The key to Linus's success was his reliance on the simple laws of structural chemistry. The α-helix had not been found by only staring at X-ray pictures; the essential trick, instead, was to ask which atoms like to sit next to each other. In place of pencil and paper, the main working tools were a set of molecular models superficially resembling the toys of pre-school children.
Vallée-Tourangeau and Krüsi Penney (2005) examined the influence of a richer distributed representation of the problem space on hypothesis-testing behaviour in a 2–4–6 task isomorph. In this version of Wason's task, number sequences could only be composed of digits ranging from 1 to 6. In a baseline condition, only 21% of the participants announced the correct rule (similar to the first announcement performance reported in Wason, 1960). Even though in this task isomorph the space of possible triples was shrunk considerably from the original—that is, there were “only” 63 or 216 possible triples—the correct rule remained elusive. In contrast, in the experimental group, participants created new number sequences by manipulating three traditional six-sided dice. Participants rotated the face of the dice or interchanged their order to produce new triples. As a result, some of the computational cost underpinning the hypothesis-testing process could be delegated to the positioning of external artefacts. Nearly two thirds of the participants in this experimental condition announced the correct rule. In contrast to control participants, experimental participants exhibited more diligent and more creative hypothesis-testing behaviour. That is, experimental participants produced a greater number of triples before announcing their best guess at the rule than did control participants, and the sample of triples they tested was more heterogeneous and hence more informative than the one generated by their control counterparts. It appeared that providing an external, manipulable representation of the dimensions of the space of triples made number permutations salient and easier for reasoners to implement.
Graphical Representation
In scientific hypothesis testing, data and data regularities can be represented graphically as well as mathematically. There is evidence to suggest that in scientific reasoning nonmathematical diagrammatic representations of these regularities can foster discovery. For example, Cheng and Simon (1992) argue that the discovery of the conservation of momentum by early physicists proceeded primarily through the judicious manipulation of diagrammatic representation of experimental set-ups and results. From a computational-modelling perspective, Cheng (1992) showed that a number of Galilean kinematic discoveries are more plausibly modelled using diagrammatic rather than mathematical representations.
Two important reasons explain why diagrammatic representations offer a fruitful medium that supports discovery (Cheng & Simon, 1995). For one, reasoners have the opportunity to exploit multiple mathematical as well as nonmathematical representations and switch from one representational medium to another as a means to navigate out of unproductive problem-solving paths. Second, diagrams are visual representations that afford perceptual inferences and reduce the computational costs of extracting regularities from mathematical expressions. Evidence from computational modelling suggests that the possibility of exploiting multiple representations can enhance creativity and successful problem solving (Cheng & Simon, 1995).
In the case of the 2–4–6 task, it is not that the numerical formalism employed to describe the task and the initial example is obscure or that the mathematics are intractable, in a manner that offers substantial conceptual and computational challenges (like those faced by early physicists). Rather, the majority of participants face an unexpected impasse when they announce an incorrect rule and grudgingly realize that they had been thinking about the problem in the wrong way. At that stage, if given the opportunity to continue with the task, some participants simply abandon the task, and many of those who continue keep exploring unproductive avenues. For example, it is not unusual to see participants produce a triple that appears to provide a positive test of a hypothesis that has just been disconfirmed.
In problem solving, impasses are overcome with a restructuring of the manner with which a problem is represented (Ohlsson, 1984). Participants in the traditional 2–4–6 task cannot exploit multiple representations of the data they have generated. Yet, multiple representations play an important role in scientific discovery. Indeed the recognition that one representational medium might be better suited to support reasoning and problem solving in a domain rather than another often marks important scientific progress (Cheng & Simon, 1995). Participants in the traditional 2–4–6 task are not offered multiple representations of the triples they generate, and it is likely that with such an artificial reasoning task, they are not motivated to elaborate alternative representations of the data they are examining. An important aim of the research reported here was to assess the impact of multiple representations on rule discovery.
More specifically, we sought to examine the impact of providing an interactive graphical representation of the triples generated. Participants formulated and tested each triple by entering a number sequence in a specially configured Excel worksheet that simultaneously plotted the triple as a continuous line on a grid, illustrating the linear relationship between numbers that made up the triple. Participants could delete and replace numbers at will, and each change to the number sequence was reflected in a synchronous adjustment to the graphical representation of the triple. Once a triple was generated and plotted, it remained in full view, and participants entered a new number sequence in an adjacent space in the worksheet. Thus, in addition to the usual numerical record, participants benefited from a graphical nonmathematical representation of the triples tested, offering multiple representations of the number sequences.
Graphs offer perceptually transparent representations of the simple linear relationships between consecutive numbers. They also offer a medium other than strings of numbers with which to formulate new hypotheses—that is, a medium where hypotheses can be expressed using more qualitative concepts as opposed to quantitative, numerical concepts. Since the target rule shuns the algebraic specificity implied by the initial triple, graphical representations of the triples tested may help reasoners by constraining the nature of the hypotheses entertained (Stenning & Oberlander, 1995).
The Wason task isomorph developed for the research reported here used integers ranging from 0 to 18, specifying a space of over 6,000 possible triples. In the experimental condition, the hypothesis-testing context was enriched with an external graphical representation of the triple tested. The task environment was automated in such a way that the triples were plotted simultaneously as participants generated them, and once the triple was produced, feedback was generated automatically when a keystroke was entered next to the feedback box. The graphical representation was interactive in that it synchronously reflected the selection of numbers in the creation of a test triple. Participants could alter their number selection more dynamically on the basis of the perceptual feedback.
Two experiments are reported in this paper. Experiment 1 employed a procedure wherein participants did not have to verbalize hypotheses before producing a test triple. In prior research with the 2–4–6 task (e.g., Vallée-Tourangeau et al., 1995; Vallée-Tourangeau & Krüsi Penney, 2005) we examined hypothesis-testing behaviour in the absence of overt verbalization (see also Gale & Ball, 2006). There is evidence in the problem-solving literature that verbalization may interfere with insightful problem restructuring (Schooler, Ohlsson, & Brooks, 1993). Thus Experiment 1 explored the impact of graphical representations on rule discovery success without forcing participants to explicitly formulate and verbalize their hypotheses as they engaged in the task. In light of the results from Experiment 1, however, it became apparent that data on participants’ hypotheses as they formulated and tested new triples would be likely to offer a richer characterization of the impact of graphical representations. Thus Experiment 2 forced participants to verbalize their hypotheses and examined the exact nature of the hypotheses formulated when the task environment was enriched with graphical representations of the number sequences.
Experiment 1
Method
Experimental Design and Procedure
Participants engaged in a task isomorphic with Wason's (1960) 2–4–6 rule discovery task where numbers could range only from 0 to 18. Their task was to discover the rule that governed the production of “correct” sequences of three numbers. They did so by producing new sequences that would be categorized as satisfying, or not, the to-be-discovered rule. As in the original Wason task, participants were informed at the outset that the triple 2–4–6 was a number sequence that satisfied the rule.
Participants were assigned to an experimental or a control group on a random basis. Participants engaged in the task using specially configured Excel worksheets carved into 12 rectangular spaces labelled “ATTEMPT” followed by the number corresponding to the number of each triple tested. Two worksheet tabs were provided, and participants could test up to 23 new sequences; the top left space in the first worksheet was used to show, and plot for the experimental participants, the initial triple 2–4–6 (see Figure 1; the label “ATTEMPT” was replaced with “Example”). In the experimental group, as participants entered a new three-number sequence, it was automatically and synchronously plotted on a two-axis grid, where the x-axis coded the number position in the triple (first, second, or third), and the y-axis ranged from 0 to 18. The task instructions in the experimental group were as follows:
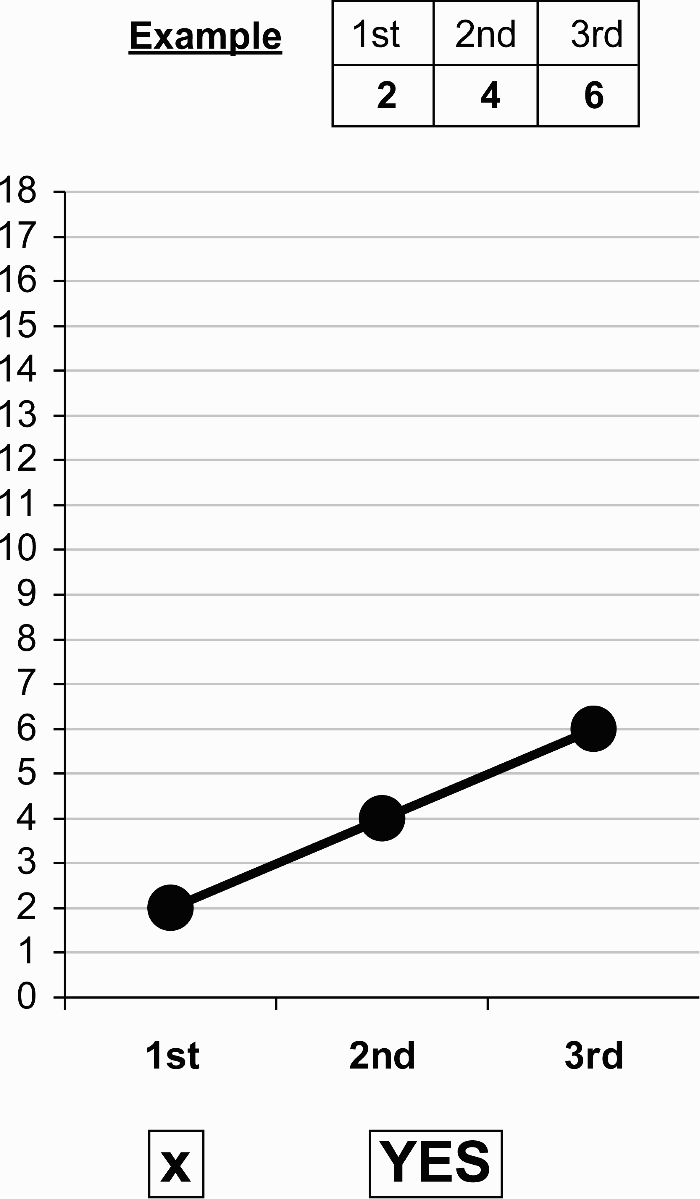
Participants tested a new triple by entering digits in the boxes labelled 1st, 2nd, and 3rd in a specially tailored Excel worksheet. In the experimental condition a line graph of the number sequence was created synchronously. Feedback was automated and was presented after the participant entered an “X” next to the feedback box. A worksheet contained 12 such testing areas. The figure shows the top left area of the worksheet in the experimental condition. Control participants were also given the 2–4–6 triple, but were not provided with a plot.
The present task consists in discovering why certain numbers go together in a sequence. To start you off, I can tell you that 2–4–6 is a sequence that satisfies the rule I have in mind. In order to discover my rule, you should produce new number sequences from 0 to 18 by typing your sequence into the relevant boxes.
These numbers will then be plotted on the individual graphs; to discover whether your sequence meets the rule input “x” into the bottom left hand box, the right hand box will then tell you whether your sequence meets the rule. You can produce as many or as few sequences as you wish, but proceed to tell me your best guess only when you feel highly confident that you have discovered the rule that I have in mind.
In the control group, the triples were not plotted, and hence participants proceeded to discover the rule in the absence of that external representation. The task instructions were the same as those for the experimental group with the omission of the phrase referring to numbers being plotted.
An important procedural feature involved the automation of feedback. In nearly all past versions of the 2–4–6 task, the experimenter provides feedback for each generated triple, a process that conspires to create a pupil–teacher communicative context that might enhance perceived accountability for triples produced (cf. Lerner & Tetlock, 1999). There is evidence to suggest that automating feedback using a computer-controlled version of the 2–4–6 task makes it substantially harder (e.g., Van der Henst, Rossi, & Schroyens, 2002, Exp. 2). In this experiment the feedback was generated by the computer and hence eliminated participant–experimenter interactions for each triple generated.
Measures
Hypothesis-testing behaviour was measured in a number of ways: first, the proportion of experimental and control participants who announced the correct “ascending numbers” rule; second, the number of triples generated before announcing the rule; and third, the number of nonincreasing triples—that is, triples that received negative feedback. The negative triples were categorized as either “descending” or “nondescending”. Using a, b, and c to represent the first, second, and third number of a triple, a descending negative triple is one where a > b > c, and a nondescending negative triple as one of the other seven types of triples that would receive negative feedback, namely (a) a > b < c, (b) a < b > c, (c) a = b = c, (d) a = b > c, (e) a = b < c, (f) a > b = c, and (g) a < b = c. The number of the different types of negative triples produced was also calculated. Finally, the proportion of positive triples that did not exhibit a constant increment—that is, where (b – a) ≠ (c – b)—was measured (we refer to these positive triples as variable positives). The number of triples tested is a measure of diligence whereas the number and nature of negative triples, as well as the proportion of variable positives, characterize the breadth of the exploration of the space of possible triples.
Participants
A total of 68 university undergraduates received course credits for their participation. Participants were assigned to either the experimental (N = 34) or the control (N = 34) group on a random basis. As a result, the experimental group was composed of 27 females and 7 males, with an overall mean age of 22 years, while the control group was composed of 29 females and 5 males with an overall mean age of 24 years.
Results
Correct Announcement
The frequencies, and proportions, of participants announcing the correct rule in both experimental and control conditions are reported in Table 1. A total of 15 (or 44%) of the experimental participants announced the correct rule while 7 (or 21%) of the control participants did so: a significant difference, χ2(1, N = 68) = 4.30, p < .05.
Hypothesis-testing profile of participants in the experimental and control groups in Experiment 1
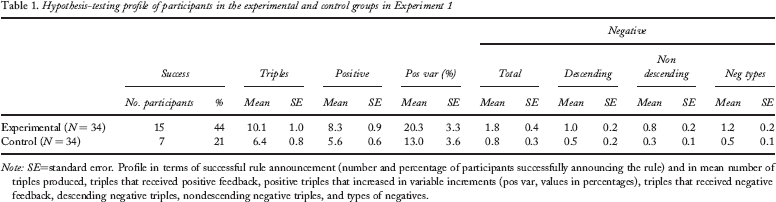
Note: SE = standard error. Profile in terms of successful rule announcement (number and percentage of participants successfully announcing the rule) and in mean number of triples produced, triples that received positive feedback, positive triples that increased in variable increments (pos var, values in percentages), triples that received negative feedback, descending negative triples, nondescending negative triples, and types of negatives.
Triples
The number and types of triples generated by the participants are reported in Table 1. Experimental participants tested significantly more triples (M = 10.1) than did control participants (M = 6.4), t(66) = 2.89, p < .006 (all tests two-tailed). Of the triples that received positive feedback, experimental participants produced a greater proportion that increased in variable increments (M = 20.3%) than did control participants (M = 13.0%), but that difference failed to reach significance, t(66) = 1.50, p < .14. Experimental participants tested significantly more negative triples (M = 1.8) than did control participants (M = 0.8), t(66) = 2.01, p < .05. Experimental participants did not test significantly more “descending” negative triples (M = 1.0) than did control participants (M = 0.5), t(66) = 1.46, p < .15, but produced significantly more “nondescending” negative triples (M = 0.8 vs. 0.3), t(66) = 2.25, p < .03. Overall, experimental participants tested significantly more different types of negative triples (M = 1.2) than did control participants (M = 0.5), t(66) = 2.79, p < .007.
Discussion
Participants in Experiment 1 engaged in a task isomorph of Wason's (1960) 2–4–6 task. The goal of the task was to discover the rule “ascending numbers” by using numbers ranging from 0 to 18. The resulting space of possible triples, while still large, was considerably smaller than the one specified in Wason's original task. Nonetheless, the task remained very hard. Of the 34 participants in the control group who engaged in the traditional version of the task, proceeding solely from a numerical representation of the triples, only 7 (or 21%) announced the correct rule. In the experimental condition, participants were exposed to multiple representations of the triples: A numerical representation was supplemented with a graphical representation that was automatically and synchronously created as participants entered a new sequence of numbers. The graphical representation of the linear relationship among adjacent numbers helped participants discover the rule: 15 out of 34 (or 44%) announced the correct rule.
The hypothesis-testing profile of the participants in both groups differed significantly in terms of diligence and creativity. Experimental participants tested significantly more triples than did control participants before making their announcement. They not only worked longer at the task, they also produced a more varied set of triples. This heterogeneity in triple production was evidenced in part by the marginally greater proportion of variable positive triples generated by the experimental participants but more strongly underscored by the greater number and variability of negative triples. Experimental participants produced a significantly greater total of negative triples, as well as more “nondescending” negative triples, than did control participants. They also examined a significantly greater number of different types of negative triples than did control participants. Thus, the exploration breadth of the triple space was greater in the experimental than in the control condition. As stated earlier, no hypothesis-testing strategy can guarantee that a reasoner will settle on the correct rule in the 2–4–6 task, but reasoners who work longer at the task and who test a more heterogeneous set of triples before making their announcement are more likely to discover the correct rule (Vallée-Tourangeau et al., 1995).
Vallée-Tourangeau and Krüsi Penney (2005) were able to elicit more diligence and more creativity by developing a 2–4–6 task isomorph where reasoners generated number sequences by manipulating dice or chips that corresponded to integers from 1 to 6. The 2–4–6 task isomorph developed for this experiment specified a much larger space of triples (over 6,000) but did not provide physical artefacts that could shoulder some of the triple generation process. Rather, experimental participants could exploit two different types of representation: numerical and graphical. The additional graphical representation encouraged participants to test a more varied set of triples and helped them discover the ascending numbers rule. It is plausible to argue that as participants in the experimental condition engaged in the task, they were more likely to formulate hypotheses that ignored the specific algebraic features of the initial triple 2–4–6 and hence were more likely to announce the correct rule. However, participants in Experiment 1 were not forced to explicitly formulate hypotheses as they generated each triple, and hence in the absence of any direct evidence, this argument remains speculative.
Experiment 2
The goal of the second experiment was to determine whether the graphical representation used in Experiment 1 encouraged the formulation of hypotheses that reflected a weakening of the algebraic specificity constraints implied in the initial 2–4–6 triple. Participants in Experiment 2 were thus forced to formulate a hypothesis before each triple they generated. In Experiment 1 participants were permitted only one announcement. If they announced an incorrect rule, they were not given the opportunity to continue. Clearly announcing an incorrect rule may significantly alter the nature of the hypotheses entertained. Hence, in Experiment 2, participants who announced an incorrect rule were invited to continue with the task, thus permitting an assessment of hypothesis-testing behaviour before and after a first announcement.
Method
Experimental Design and Procedure
The same Wason task isomorph developed for Experiment 1 was employed. Participants were assigned to an experimental or a control group on a random basis. Participants engaged in the task using specially configured Excel worksheets split into a top half where participants typed in their hypotheses (see Figure 2) and a bottom half where they entered new three-number sequences and then clicked on the feedback box to receive feedback. These halves were segmented with vertical dividing lines into separate columns each corresponding to a new hypothesis-testing attempt. The task instructions were the same as those in Experiment 1, with the following addition:
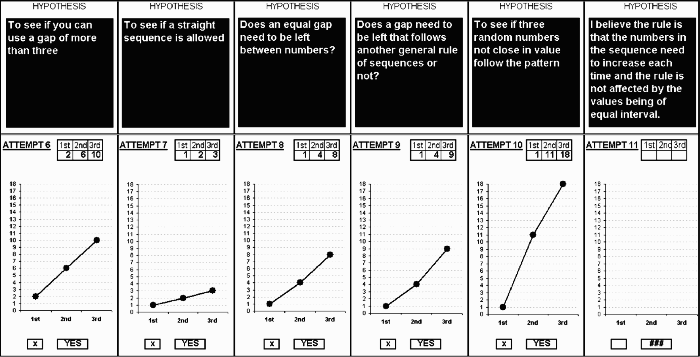
Actual protocol from Participant 2 in the experimental condition of Experiment 2. The participant announced the correct rule after generating 10 triples.
Before generating each number sequence please enter the reason for your choice in the blue box (type it in).
Measures
Hypothesis-testing behaviour was measured in three ways: first, the proportion of experimental and control participants who announced the correct hypothesis at the time of their first announcement and at any later announcements; second, the number and types of triples tested; third, the number and kind of hypotheses produced by participants. Hypotheses were coded in terms of algebraic specificity. Hypotheses low in algebraic specificity were those that did not stipulate explicitly a specific algebraic rule governing the composition of a number sequence. Thus, hypotheses such as “all even numbers” “random order”, “increasing sequence” were classified in the low algebraic specificity category. In turn, any hypotheses that referred to a quantity or specified a formula to produce number sequences such as “gap is 2”, “numbers add to 12”, “second number + first number = third number”, “three times table”, were classified in the high algebraic specificity category.
Participants
A total of 56 university undergraduates received course credits for their participation. Participants were assigned to either the experimental (N = 28) or the control (N = 28) group on a random basis. As a result, the experimental group was composed of 28 females and no males, with an overall mean age of 21 years, while the control group was composed of 27 females and 1 male with an overall mean age of 20 years.
Results
Correct Announcement
The frequencies and proportions of participants announcing the correct rule in both experimental and control conditions are reported in Table 2. On first announcement, 11 (or 39%) of the experimental participants announced the correct rule while 4 (or 14%) of the control participants did so. Of the 14 participants in the experimental group that continued with the task beyond the first announcement, 10 (or 71%) discovered the rule. Of the 19 participants in the control group who chose to pursue the task beyond the first announcement, 9 (or 47%) discovered the rule. Over all announcements, 21 (or 75%) of the experimental participants discovered the correct rule, while 13 (or 46%) of the control participants did so. Chi square analyses revealed that (a) a significantly greater number of participants in the experimental group than control participants announced the correct rule on their first attempt, χ2(1, N = 56) = 4.46, p < .05; (b) over all announcements a significantly greater number of participants in the experimental group discovered the rule, χ2(1, N = 56) = 4.70, p < .05; (c) but there was no significant difference in the rate of success beyond the first announcement, χ2(1, N = 33) = 1.91.
Hypothesis-testing profile of participants in the experimental and control groups in Experiment 2
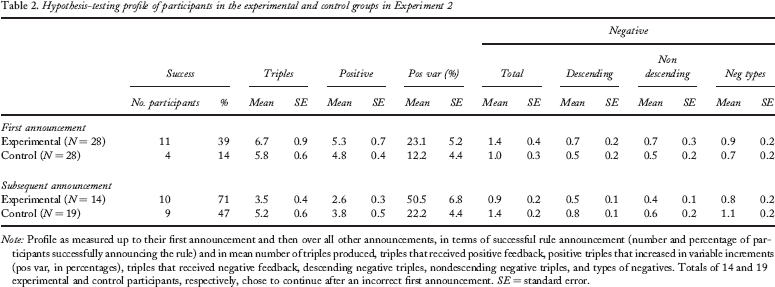
Note: Profile as measured up to their first announcement and then over all other announcements, in terms of successful rule announcement (number and percentage of participants successfully announcing the rule) and in mean number of triples produced, triples that received positive feedback, positive triples that increased in variable increments (pos var, in percentages), triples that received negative feedback, descending negative triples, nondescending negative triples, and types of negatives. Totals of 14 and 19 experimental and control participants, respectively, chose to continue after an incorrect first announcement. SE = standard error.
Triples
The number and types of triples generated by the participants are reported in Table 1. Leading up to the first announcement, experimental participants tested slightly more triples of a slightly greater variety than did control participants, but none of the group differences were significant. Over subsequent announcements, experimental participants tested fewer triples (M = 3.5 vs. M = 5.2), t(31) = 1.78, p < .09, and produced a significantly higher proportion of variable positive triples (M = 50.5%) than did control participants (M = 22.2%), t(31) = 2.73, p < .01; all other differences between groups were not significant.
Hypotheses
Over all announcements participants generated on average 6.35 hypotheses in the experimental group and 6.64 hypotheses in the control group, a statistically nonsignificant difference. However, examining the relative proportion of the types of hypotheses, important differences were observed (see Figure 3). Leading up to the first announcement, the vast majority of the hypotheses, 84%, offered by the participants in the control group were classified as highly specific compared with 64% in the experimental group. However, after announcing an incorrect rule, the nature of the hypotheses formulated changed substantially in both groups: Fewer specific hypotheses were formulated overall, although the proportion of algebraically specific hypotheses was lower in the experimental group (34%) than in the control group (56%).
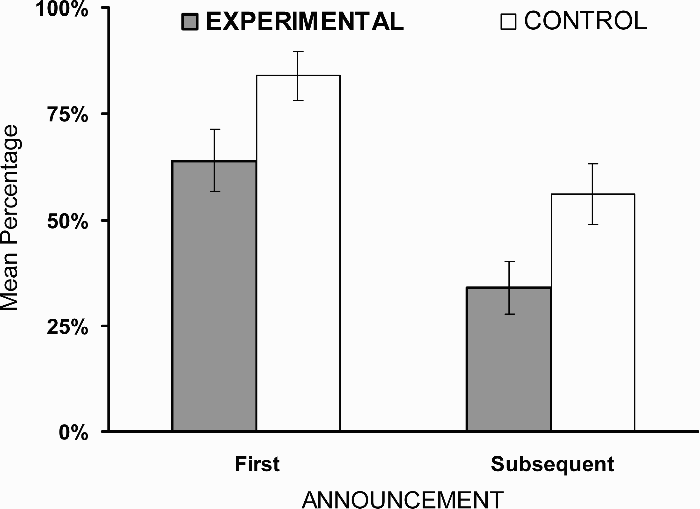
Mean percentage of hypotheses categorized as high in algebraic specificity up to the first announcement and over all subsequent announcements in the experimental (shaded columns) and control group (open columns).
A series of nonparametric analyses that compared the proportion of specific hypotheses between groups (Mann–Whitney), leading up to the first announcement and overall subsequent announcements, and within groups (Wilcoxon) across announcements confirmed these impressions (all tests two-tailed). Leading up to the first announcement, more algebraically specific hypotheses were formulated in the control than in the experimental group, Z = –2.12, p < .04, although this difference was not significant over subsequent announcements, Z = –1.57, p < .12. Within both the control, Z = –2.90, p < .005, and experimental group, Z = –2.30, p < .03, significantly more specific hypotheses were generated leading up to the first announcement than over all subsequent announcements.
Discussion
Experiment 2 used the same 2–4–6 task isomorph as that developed for Experiment 1 but forced participants to formulate a hypothesis before testing a triple. This explicit requirement did not make the task any easier. Of the 28 participants in the control condition, only 4 (or 14%) announced the correct rule on their first attempt. Of the 19 participants who continued with the task, only 9 announced the correct rule over their subsequent attempts. Thus the majority of control participants abandoned the task without discovering the correct hypothesis.
In the experimental condition, each triple was automatically and synchronously plotted as participants entered new sequences of numbers. As in Experiment 1, the graphical representation of the linear relationship among adjacent numbers helped participants discover the rule: 11 out of 28 (or 39%) announced the correct rule on their first attempt, and of the remaining 14 participants who persevered after making an incorrect first announcement, 10 announced the correct rule over subsequent attempts. Thus 75% of the experimental participants discovered the rule.
In terms of triples generation leading to the first announcement, it is important to note that the process of explicitly formulating hypotheses appeared to have narrowed the productivity and creativity gap between experimental and control participants. That is, while experimental participants produced more triples of a more varied kind than did control participants, these differences were not significant, unlike in Experiment 1. Still, the graphical representations helped experimental participants produce a significantly greater proportion of varied positive triples after a failed first announcement. Positive triples that increase in variable increments provide crucial evidence against a rule that specifies an invariant algebraic relationship among adjacent number, the very kind of rule that is naturally suggested by the initial triple 2–4–6.
The nature of the hypotheses formulated by experimental participants supports the contention that the graphical representation attenuated the tendency to think of algebraically specific candidate rules. Over all announcements, 70% of the hypotheses formulated by the control participants identified a specific algebraic feature, whereas 55% of those formulated by the experimental participants did so. The key to discovering the correct rule in the 2–4–6 task is to abandon the plausible algebraically specific hypotheses suggested by the initial triple. It is no surprise that the experimental participants did so much better in this 2–4–6 task isomorph.
Proceeding only on the basis of a numerical representation, reasoners in the control group could but formulate hypotheses that were highly specific algebraically; they could exploit no other representational medium in which to anchor the creation of hypotheses. Numbers naturally invite formulaic recipes that transform the first number of the triple into the second, and the second into the third. Given that the correct rule eschews such algebraic specificity, the representational medium of the task in the control group was not conducive to discovering the correct rule: “Discovery requires the right representation for success” (Cheng & Simon, 1992, p. 70).
In contrast, examining the nature of the hypotheses formulated in the experimental condition suggests that the additional graphical representation released participants from such a narrow numerical focus. The plotted lines encouraged the formulation of hypotheses that sought to capture the observed visual trend in simple nonalgebraic terms, thereby more naturally converging on the correct ascending numbers rule. To be sure, reasoners more expert at curve fitting and calculus might have formulated, for example, hypotheses that mathematically described negatively or positively accelerating curves. Had the experimental sample included such participants, it remains uncertain whether the graphical representations would have fostered such a high degree of successful rule discovery. Be that as it may, participants in either group never once formulated a hypothesis that could be considered an attempt at mathematically fitting a curve.
Cherubini et al. (2005) argue that the initial triple 2–4–6 in the traditional version of the task encourages participants to formulate a hypothesis that captures the relational regularities inherent to a sequence such as 2–4–6—that is, regularities that constrain the identity of the numbers in a sequence. Such relational regularities convey more information, in the sense of precisely identifying the nature of the second and third number in a sequence given the first, than do object regularities such as all numbers in the sequence are even numbers. Cherubini et al. argue that participants seek to generate highly informative hypotheses that capture the underlying relational structure in the initial triple, assuming that such a sequence was not randomly generated (cf. Van der Henst et al., 2002). The results of Experiment 2 suggest that the perception of regularities and the process of singling out the characteristic(s) of number sequences that are deemed most pertinent are significantly influenced by the manner with which the number sequences are represented. Participants in the experimental groups were more likely to formulate less algebraically specific hypotheses, hypotheses that were less informative in their exact specification of which numbers in the sequence followed the first one. As a result, experimental participants were more likely to discover the less specific ascending numbers rule.
General Discussion
Wason's 2–4–6 task has not been the workhorse of reasoning research that his card selection task proved to be. However, the hypothesis-testing profile derived from the original 2–4–6 task is commonly described in textbooks (e.g., Baron, 2000; Evans, 1989; Poletiek, 2001) and in popular science texts (e.g., Sutherland, 1992). Thus, much is made of people's lack of diligence and relative narrow-mindedness when engaging in the traditional version of Wason's task (e.g., Schustack, 1988). Yet, we would argue, it is useful to question which, if any, features of the inferential context shaped by Wason's original procedure grant the task such diagnosticity. In our opinion, there is nothing in the original procedure that endows the observed reasoning profile such representative value as to be covered extensively in reviews of hypothesis-testing research.
In addition to the representational effects reported in this paper and in Vallée-Tourangeau and Krüsi Penney (2005), dual-goal instructions (Gale & Ball, 2006; Tweney et al. 1980; Vallée-Tourangeau et al., 1995, Wharton, Cheng, & Wickens, 1993) have been shown to alter the representation of the task in a manner that sparks diligence and creativity in the exploration of the space of possible triples and leads to a significantly higher incidence of discovering the ascending numbers rule. Under dual-goal instructions, participants are instructed to discover two rules: one that describes positive triples and the other that describes negative triples. In some versions of this task isomorph, positive and negative triples are labelled DAX and MED, respectively, although the labelling as such is not the critical aspect of this manipulation (Gale & Ball, 2006). When the participants’ hypothesis-testing efforts are divided in this manner, they produce a greater number of number sequences that exhibit significantly more variability than when participants only seek to discover one rule.
On the basis of their work with dual-goal instructions, Gale and Ball (2006) argue that success at discovering the ascending numbers rule in the 2–4–6 task hinges on reasoners forming a productive contrast between ascending sequences that receive positive feedback and descending sequences that receive negative feedback. Of course, a triple that is not ascending need not be descending, and a triple such as 2–2–2 would receive negative feedback. Gale and Ball, however, suggest that it is the critical juxtaposition of ascending and descending sequences that is most conducive to successful rule discovery in the 2–4–6 task. They anchor this proposal in the fact that the production of negative triples, particularly descending triples, was the most significant predictor of successful rule announcement in their participants. The research reported here suggests that the heuristic properties of this contrast may be substantially influenced by a number of factors, namely (a) the graphical representation used to characterize triples tested, (b) the process of explicitly formulating hypotheses as the task progresses, and (c) the stage of the discovery process at which hypothesis testing is taking place. Let us take each in turn.
In Experiment 1, experimental participants were more successful than control participants at discovering the ascending numbers rule. Their exploration of the triple space was also broader, as measured by the greater number of variable positives and the greater number of negative triples produced. However, the experimental participants’ success cannot be directly traced to their production of more descending negative triples. Indeed, experimental and control participants produced a statistically equivalent number of such negative triples. What experimental participants did, however, was to produce a significantly greater number of nondescending negative triples and a greater number of different types of negative triples. These findings indicate a generally more creative exploration of the space of possible triples, not just of descending triples, and undermine somewhat Gale and Ball's (2006) proposal as applied to this particular version of the 2–4–6 task. Offering a graphical representation of the triples spurs on creative hypothesis testing.
Experiment 2 indicates that the process of formulating hypotheses may in itself substantially alter the inferential context. The robust difference in diligence and triple heterogeneity observed between experimental and control participants in Experiment 1 was weakened considerably in Experiment 2. For example, control participants were as likely to test variable positives or negative triples as were experimental participants. Yet experimental participants were still nearly three times more likely to announce the correct rule with their first announcement than were control participants. Gale and Ball (2006) based their conjecture on data obtained with an experimental procedure that did not solicit hypotheses prior to every triple tested. There is thus an important empirical question in replicating Gale and Ball's findings using a procedure wherein participants explicitly formulate a hypothesis prior to every test.
The data from Experiment 2 suggest another possibly important caveat to Gale and Ball's (2006) proposal. Participants in their study were not given the opportunity to continue formulating and testing hypotheses beyond an incorrect first announcement. In contrast, participants in Experiment 2 reported here were given the choice to continue after announcing an incorrect rule. The hypothesis-testing behaviour of these participants suggests that the production of variable positive triples became relatively more important in identifying the correct ascending numbers rule after a failed first announcement as reflected by the fact that the proportion of variable positive triples nearly doubled in both experimental and control conditions whereas the proportion of negative triples remained relatively constant. Thus, the heuristic value of identifying an ascending/descending contrast in homing in on the ascending numbers rule may not be invariant as the task progresses, especially after reasoners announce an incorrect rule.
Conclusions
The research reported in this paper derives its motivation in part from the argument that the original Wason procedure does not offer a privileged window onto hypothesis-testing behaviour. Our criticism is not aimed at the inferential challenge of discovering a rule, or the nature of the rule to be discovered or the initial triple provided as an example. Wason's 2–4–6 task as a rule-discovery problem does offer a very interesting tool with which to examine hypothesis-testing behaviour. Rather we wish to argue that fundamental questions about hypothesis testing should be asked using 2–4–6 task isomorphs implemented in different inferential contexts.
The data reported here along with those in Vallée-Tourangeau and Krüsi Penney (2005) provide a strong endorsement for the fruitfulness of a research programme aimed at exploring the external determinants of successful rule discovery. When the hypothesis-testing process is distributed over an internal representation of the task as well as a rich external representation of the triples, participants formulate more pertinent hypotheses and create a more informative set of number sequences that position them favourably to discover the correct rule. The fact that real-world hypothesis testing rarely proceeds solely on the basis of the reasoner's internal representation of the problem and test results, and frequently exploits multiple representations of the pertinent data, calls into question the representativeness of hypothesis-testing behaviour as observed in the traditional version of the Wason 2–4–6 task.