
Abstract
Four experiments with faces support the original interpretation of categorical perception (CP) as only present for familiar categories. Unlike in the results of Levin and Beale (2000), no evidence is found for face identity CP with unfamiliar faces. Novel face identities were shown to be capable of encoding for immediate sorting purposes but the representations utilized do not have the format of perceptual categories. One possibility explored was that a choice of a distinctive face as an end-point in a morphed continuum can spuriously produce effects that resemble CP. Such morphed continua provided unequal psychological responses to equal physical steps though much more so in a better likeness paradigm than for forced-choice recognition. Thus, researchers doing almost the same experiments may produce very different results and come to radically different conclusions.
Categorical perception (CP) is not just categorization. It implies a reorganization of representations within a common structure that allows a more pronounced boundary between exemplars from one category and exemplars from an otherwise perceptually adjacent category. CP results in a “qualitative difference in how similar things look or sound depending on whether or not they are in the same category” (Harnad, 1987, p. 2). As a procedure, it has been used to investigate several debates about categories—for example, their innateness (Bornstein, Kessen, & Weiskopf, 1976; Franklin & Davies, 2004; Roberson, Davies, & Davidoff, 2000) and whether they may be implicit as well as explicit (Roberson, Davidoff, & Braisby, 1999).
Etcoff and Magee (1992) were the first to apply CP to the study of faces. They took Ekman and Friesen (1976) pictures of expressive facial displays and converted them into line-drawings. In a sequential presentation of three stimuli X–A–B, the participant's task was to say whether the second or the third was identical to the target (X). Etcoff and Magee (1992) observed superior performance when A and B were pairs of faces that straddled the boundary between expression categories. Their technique of morphing face stimuli to investigate expression CP was rapidly taken up by other researchers (Bimler & Kirkland, 2001; Calder, Young, Perrett, Etcoff, & Rowland, 1996; de Gelder, Teunisse, & Benson, 1997; Roberson et al., 1999; Young et al., 1997) and extended to the case of facial identity (Beale & Keil, 1995) and species identity (Campbell, Pascalis, Coleman, Wallace, & Benson, 1997). The present study extends the work on the CP for facial identity with a major emphasis on the role of familiarity.
The effects of familiarity on face recognition are considerable in terms of both latency and accuracy (Ellis, Shepherd, & Davies, 1979) and, in particular, in degraded viewing conditions (Bruce, Henderson, Newman, & Burton, 2001). Familiar, but not unfamiliar faces, allow repetition priming (Bruce & Valentine, 1985; Campbell & de Haan, 1998) and are largely impervious to changes in expression (Patterson & Baddeley, 1977) and view (Roberts & Bruce, 1989). Presumably the rapid categorization possible for familiar but not unfamiliar faces stems from access to representations connected with the preferential selection of the internal aspects of faces (Ellis et al., 1979). These effects of familiarity are not achieved easily and certainly not by a small amount of exposure to an individual face (Clutterbuck & Johnston, 2005).
It is similarly assumed that CP for face identity reflects the result of lengthy experience with particular faces or with many exemplars from the same stimulus category (özgen & Davies, 2002). CP has been demonstrated for initially unfamiliar faces (Goldstone, Lippa, & Shiffrin, 2001; McKone, Martini, & Nakayama, 2001; Viviani, Binda, & Borsato, 2007) but training in McKone et al. (2001) was extensive (between 1,000–10,000 trials; 2–14 hr /participant/face pair) and considerable (15 min of similarity ratings plus 54 trials for each of four faces in a category learning task in Goldstone et al., 2001; thousands of preliminary identification trials on the morphed continua in Viviani et al., 2007). However, there are reports that brief exposure to unfamiliar faces can result in CP (Campanella, Hanoteau, Seron, Joassin, & Bruyer, 2003; Levin & Beale, 2000).
The rapid acquisition of CP found both by Levin and Beale (2000) and by Campanella et al. (2003) would have profound effects on how familiarity might affect the laying down of face memories. Levin and Beale (2000), for example, claim that the same reorganization in memory of the category exemplars proposed by Goldstone (1994a, 1994b) can be achieved by simple inspection of the end-points of a morphed continuum. Furthermore, they claim from their data that CP would be easily found for any novel stimuli including inverted faces. Subsequent work (Campanella et al., 2003; Angeli, 2004; McKone et al., 2001) has been unable to repeat that finding for inverted faces, and this is not further discussed. Campanella et al. (2003) also claim that the rapid acquisition of CP for unfamiliar faces is hard to explain within Valentine's model of face space organized around the similarity of exemplars (Valentine, 1991). Valentine's model successfully explains the easy recognition of distinctive faces and how CP might emerge from distortions in that face space. For example, representations could be perceived as “attractors” tending to gather exemplars close together (Tanaka, Giles, Kremen, & Simon, 1998). Although such a mechanism might plausibly affect novel as well as familiar faces, Campanella et al. instead suggest that morphing reduces the distinctiveness for the central items of the continuum and hence achieves the categorical effects found in Tanaka et al. (1998).
The purpose of the present paper is to consider methodological issues that may allow an apparent CP to emerge for unfamiliar faces. We respond, in particular to the data in Levin and Beale (2000). Campanella et al. (2003) used a same/different procedure unique in studies of CP, which needs a signal detection analysis to be confident of avoiding response biases. Also, the CP effects that they found for accuracy were not repeated in their latency analyses. We rather concentrate on whether CP for novel faces could arise through an inadvertent choice of distinctive faces.
In Experiment 1, using the design of Levin and Beale (2000), we contrast performance of a group that are familiar with the faces to that of a group for whom the faces are unfamiliar. In Experiments 2 and 3, we examine face continua that have a distinctive end-point comparing the better likeness procedure of Levin and Beale with the more classic forced-choice recognition. The present paper shows that rather small changes in the memory paradigm can produce different CP outcomes. In Experiment 4, we show that both procedures give the same outcome for familiar faces.
Experiment 1
Experiment 1 used the identical morphed stimuli for two groups of observers to examine the role of familiarity in CP. One group was familiar with the faces; the other group were not (see Valentine & Bruce, 1986, for a precedent). A better likeness task, called a discrimination task by Levin and Beale (2000), was used to examine CP. The critical issue was whether it was easier to make that decision for a pair of faces that straddled the boundary between two face categories. An identification task, called a classification task by Levin and Beale (2000), was used to determine the boundary. Any enhanced discrimination performance shown only by the familiar observers for the cross-boundary pairs could not, therefore, be attributed to a morph artefact selectively increasing the distance between morph faces in the central region of the continuum.
Method
Participants
A total of 41 Caucasians took part in the experiment. A total of 21 (16 females and 5 males, aged between 19 and 35 years) were from Goldsmiths’ College, University of London, UK, and were familiar with the faces (familiar group); the other 20 (13 females and 7 males, aged between 21 and 35 years) were from Trieste, Italy, and were unfamiliar with the faces (unfamiliar group). In order to recruit UK participants, 22 students were asked to evaluate, in a rating task, their level of familiarity with two famous faces (Jamie Theakston, a TV presenter, and Jason Donovan, a singer and actor). A 10-point scale ranging from 0 = “totally unfamiliar” to 10 = “familiar like my best friend” with Level 6 as the cut-off point was used to exclude participants. One person was excluded because she was familiar only with one of the two faces. For the 21included participants, the average familiarity score for the face of Jamie Theakston was 7; for Jason Donovan, it was 8.05. Thus, even if the two celebrities are not now at the height of their fame, they were sufficiently so when this experiment was carried out.
The unfamiliar group was presented with an instruction screen showing each face associated with a fictitious name. They were told that the two faces belonged to two students of another psychology department in Italy. They were informally asked whether those faces by any chance looked familiar to them (none of the participants reported this being the case).
Stimuli
Two neutral expressions of the faces of Jamie Theakston and Jason Donovan were chosen for the start and end images. The photographic-quality images were taken from magazines and scanned into a PC; they were then imported into a Power Macintosh computer and edited in Adobe® Photoshop® 5.5 at 300-dpi resolution. The two images were scaled to the same dimensions, aligned using the eyes and forehead-to-chin axes, put in grey-scale mode, and cropped so that only the full frontal face with both ears visible remained on a black background. Each face was then imported into Morph 2.5, and a linear continuum of 9 images was generated between the two faces.
The morphing process resembled very closely that used by Beale and Keil (1995). On each face about 350 control points were placed for a total of approximately 700 key-points; Morph automatically adds intermediate values. The continuum obtained consisted of 11 different morphs each separated by a 10% step. Instead of using 0% and 100% as stimuli, 1% and 99% were preferred for these exemplars in order to guarantee the same degree of processing to the whole set of stimuli (Beale & Keil, 1995). Each image was approximately 240 (h) × 290 (v) pixels and was presented in a 256-level grey scale. For Experiment 1, 20% steps were used, and those morph near-neighbours were used as pairs in the better likeness task. Five 20% steps in the continuum are illustrated in Figure 1.
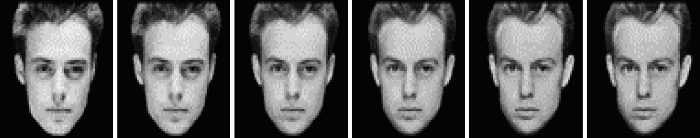
Examples from the face continuum used in Experiment 1; a 20% morph step separates the images. The third face from the left contains 60% of the start image and 40% of the end image.
Procedure
The experiment was run with SuperLab 1.68 on a Power Macintosh 6100 connected to a 12′ colour monitor set to 8-bit grey-scale mode. Viewing distance was approximately 60 cm. Stimuli measured 8 cm × 10.5 cm on the monitor.
The experiment included two sessions (a better likeness task followed by an identification task). The better likeness task (originally introduced by Beale and Keil (1995) in order to encourage the global processing of facial stimuli) preceded the identification task in order to minimize the learning of the faces on the continuum for the unfamiliar observers. The critical aspect of the better likeness task is for the observer to determine which of two morph near-neighbours better resembles one of the two remembered faces. An instruction screen preceded the better likeness task in order to familiarize the observers with the end-points generating the continua of stimuli. The two end-point faces were shown side by side, associated with their names. The unfamiliar observers were instructed to study the two faces and to remember their names. They were free to take as much time as they wanted though none took more than 1.5 min to study the display.
For both groups, the position of the two end-point faces was alternated by participant. For the familiar group, it was obviously not possible to counterbalance the name–face labelling—that is, to label Jason as “Jamie”; therefore, the same restriction was maintained in the unfamiliar group: The face of Jamie Theakston was always labelled as “Federico”, and the face of Jason Donovan was always labelled as “Filippo”. The remaining procedure of the experiment followed that in Levin and Beale (2000). Some training trials were administered for each participant to feel comfortable with the tasks (on average that took from 5 to 10 practice trials for each task). Participants were explicitly told that no response timing would be recorded and to try to be as accurate as possible. The experimental session lasted about 20 minutes.
For the better likeness task, the 11 morphed faces were used to generate 9 pairs separated by a 20% step of morph coefficient (1–20%; 10–30%; and so on). A pair of faces was then presented for 1 s, and the participant was given a question (visible for 1,800 ms); for example, for the familiar group, “which is more like Jamie?” After the faces disappeared, they were replaced by two numbers, “1” and “2”, corresponding to the response key labels. The number “1” was always on the left-hand side of the screen and of the keyboard, while the number “2” was always on the right-hand side. The side of the screen on which each image appeared and name was cued was counterbalanced. Each combination was presented twice resulting in 72 trials.
The better likeness task was followed by the identification task. At the beginning of the identification task, participants were shown again the initial display with the two faces paired with the corresponding names. The 11 morphs were then presented individually in a random order. The unfamiliar group were asked to identify each stimulus as “Federico” or “Filippo”. Familiar participants were asked to identify each stimulus as “Jamie Theakston” or “Jason Donovan”. All participants made their decision by pressing one of two labelled keys. The arrangement of the faces in the initial display (rating phase for the familiar group and learning phase for the unfamiliar group) determined the response-key labelling in the identification task. Each stimulus lasted for 750 ms. Each of the 11 faces was presented 9 times for a total of 99 trials, in contrast to Levin and Beale (2000) who only showed each morph face three times for a total of 33 trials.
Results
The identification task is analysed first because those data are required to find a transition from one identity to the other (i.e., to determine the boundary). The individual identification data were summarized by two parameters of the regression lines computed for each observer: The shape of the identification curve was described by its slope; the boundary location was described by the value on the morph continuum corresponding to the 50% performance in the identification task. The slope of the identification function was recovered from regression lines fitted through the five central morph faces (30%, 40%, 50%, 60%, and 70%) of the individual observer identification data. McKone et al. (2001) used sigmoid functions to fit the data but it is clear from Figure 2 that the central part of the curve is essentially linear. The individual slopes for the two groups were similar, t(39) < 1, with a trend towards a difference in boundary position, t(39) = 1.87, p = .07. Further analyses showed that the familiar observers’ boundary position (50.52%) did not differ from the morph continuum 50%, t(19) < 1, whereas the unfamiliar observers’ boundary position (53.2%) differed from the physical 50%, t(19) = 2.59, p < .02.
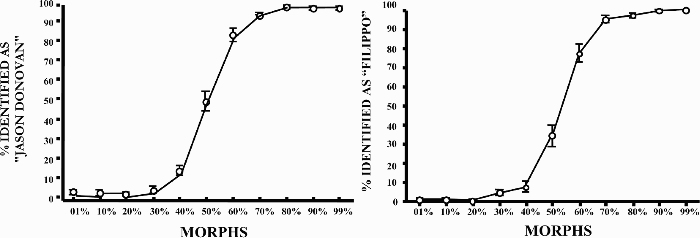
Mean % response “Jason Donovan” (familiar observers) and “Filippo” (unfamiliar observers) for the identification tasks in Experiment 1. Error bars are standard deviations.
Following the criterion used in previous studies (Beale & Keil, 1995; Etcoff & Magee, 1992; Levin & Beale, 2000), the mean scores obtained in the identification task were used in order to select the pairs of stimuli that straddled the boundary. The criterion used was that the pairs should have one face identified with one of the two end-points on more than 66% of trials and the other identified with the other end-point on more than 66% of trials. The data revealed that for both familiar and unfamiliar observers only one pair satisfied the criterion—that is, the pair 40–60%.
The better likeness task was used to compare performance on within- and cross-category pairs. Figure 3 illustrates the two groups’ performance in the better likeness task. A 2 (familiarity: familiar vs. unfamiliar) × 9 (pairs: 9 levels) analysis of variance (ANOVA) with repeated measures over the second factor was carried out on the percentage of correct responses for the better likeness task. There was no effect of familiarity (F < 1; familiar mean, 75.40% correct; unfamiliar mean, 75.07% correct). A main effect of pairs, F(8, 312) = 4.91, MSE = 343.8, p < .0001, was found in the context of its significant interaction with the factor familiarity, F(8, 312) = 2.17, MSE = 343.8, p < .03. To provide more direct evidence for the interaction, the average performance on within-category pairs was compared to the performance on the cross-boundary pair (Pair 5, for both groups of observers) in a 2 (familiarity: familiar vs. unfamiliar) × 2 (pair type: cross-boundary vs. within-category) ANOVA. A categorical boundary effect was found with the planned contrast only for the familiar group—that is, the cross-boundary pair was significantly better discriminated than the within-category pairs, F(1, 160) = 9.00, MSE = 384.8, p < .005. The same mean comparison was not significant for the unfamiliar group (F < 1; see Figure 4).
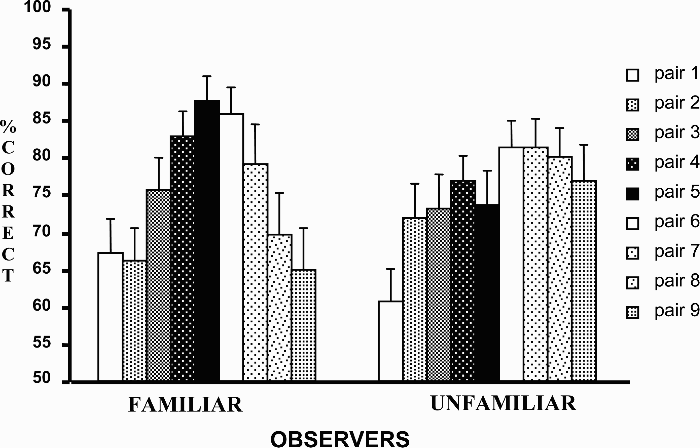
Mean correct and standard deviations for individual pairs of faces for familiar and unfamiliar observers in the better likeness task of Experiment 1.
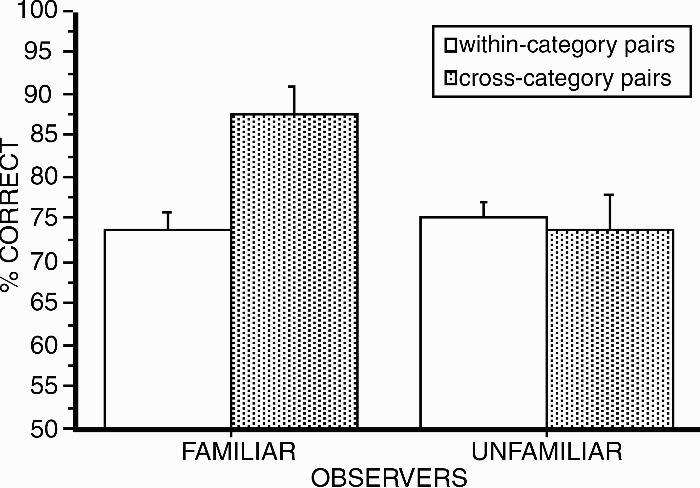
Mean correct and standard deviations for the cross-boundary pairs and the within-category pairs in the better likeness task for familiar and unfamiliar observers in Experiment 1.
One difference, for data analysis, between the better likeness paradigm and the forced-choice paradigm (e.g., the X–A–B) is that the critical contrast may depend on a single boundary-straddling pair. Therefore, on the assumption that the identification task might reflect the underlying categorical structure, we also ran correlations between the within-pair differences in classification and the performance in the better likeness task (Calder et al., 1996; Levin & Angelone, 2002). The correlation (r = .95; p < .01) was significant for the familiar group but the correlation for the unfamiliar group (r = .43) was not significant (p > .05).
Discussion
Only familiar observers perceived the morphed faces on the “Theakston–Donovan” continuum categorically. Unfamiliar observers, who had just a brief period of exposure to the two end-points of the continuum, although being able to correctly classify the individual morphs as belonging to two distinct classes (note the same basic shape of the identification curves in Figure 2) and having the same overall performance in the better likeness task, did not show a higher discrimination performance for the pair of faces that straddled the transition points between the two identities. Thus, we failed to replicate the essential finding of Levin and Beale (2000). The difference in performance between the two groups concerned the cross-boundary pair. Such a result would suggest that getting familiar with faces produces an expansion in the representational space corresponding to the boundary between the two identities (Goldstone, 1994a, 1994b) rather than a within-class compression as found in some other studies (Livingston, Andrews, & Harnad, 1998).
In summary, Experiment 1 clearly indicated the presence of a categorical boundary only for the familiar observers. However, given the claim of Levin and Beale (2000) for CP with unfamiliar faces, it was felt necessary to further investigate the continua between other unfamiliar faces.
Experiment 2
The familiar faces used in Experiment 1 are clearly typical faces, and Angeli (2004) reasoned that this might be important. Pursuing the possibility of categorical effects with unfamiliar faces, what looked like CP was found on one continuum out of the several examined for that effect. It happened to be a continuum where a rather distinctive face was used as an end-point. The effect of distinctiveness was therefore examined in depth to see whether that could be a contributing artefact for the production of CP.
Method
Participants
A total of 48 Caucasians (aged between 19 and 42 years; mean 26 years) took part in Experiment 2. A total of 13 were students from Goldsmiths’ College, London; 7 of them gained credits for a psychology course, and 6 volunteered. The remaining 35 observers were volunteer students from the University of Trieste. One observer was excluded from the analyses because he performed at chance.
Stimuli
A total of 25 photographs of faces of ex-students from the University of Trieste, University of Manchester, and Goldsmiths’ College, London, were edited in Adobe® Photoshop® 5.5 and were included in an oval frame to conceal their hair outline. Bruce, Burton, and Dench (1994) have shown that the actual “deviation” of the faces from the average in a set reasonably correlates with their rated distinctiveness only when their hair is concealed. For this reason, it was decided to leave visible only the internal features plus the chin outline of the faces to be rated. The ratings of distinctiveness were carried out by 17 Caucasian judges aged approximately between 19 and 36 years.
The ratings were carried out on printed versions. Distinctiveness of a face was operationalized as “how easy it is to spot the face in a crowd” (Valentine & Bruce, 1986) and was measured on a 7-point scale. Three faces (see Figure 5) were selected from the 25 faces in the set on the basis of their extreme ratings: The face rated as the most distinctive in the set (D: 6.41 on the 7-point scale), the face rated as the most typical (T1: rated 2.41), and the face rated as the second most typical (T2: rated 2.94). Differences in distinctiveness between the three selected faces were evaluated with paired t tests: The differences between T1 and D and between D and T2 were very marked: T1 vs. D, t(16) = 16.49, p < .0001; T2 vs. D, t(16) = 11.63, p < .0001. There was no difference in the distinctiveness ratings for the two typical faces (t < 1). 1
In response to a reviewer's request, assessment of typicality was also examined for an Italian population. The three faces were given in a balanced order to 18 Italian students and to a corresponding new group of 18 UK students. Both groups were asked to give typicality ratings to the three faces under the same instructions as those in the main study. A Group (English vs. Italian) × Face (T1 vs. T2 vs. D) revealed only a main effect of face, F(2, 68) = 21.57, p < .0001. Paired t tests revealed that the effect was entirely due to the distinctive face (rating 4.89) being rated higher than face T1 (rating 3.22) or face T2 (rating 3.36) with ps < .0001 in both cases. T1 did not differ from T2 (t < 1). The range of typicality ratings is reduced compared to the faces being seen within a larger group but clearly both groups see the D face as being more distinctive to an equal extent.
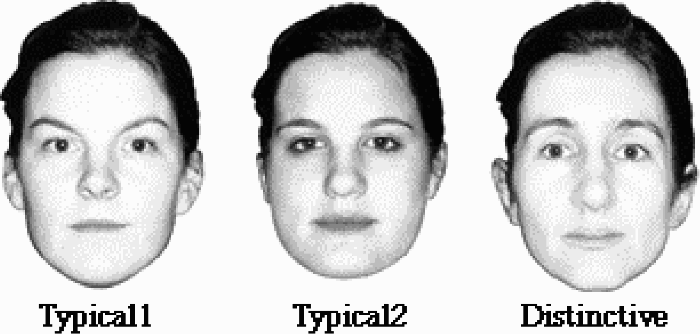
The three end-points used to create the three continua used in Experiment 2 (in the text they are referred to as T1, T2, and D, respectively).
The same hair was pasted onto the three faces to exclude any influence of external features. The three faces were morphed, on a white background, following the same procedure as that in Experiment 1 to create three continua: most typical–distinctive (T1–D); distinctive–second most typical (D–T2); and second most typical–most typical (T2–T1). Thus, a triangular series was created that allows D to be contrasted with two different typical end-points and the two typical end-points with each other. A set of 9 pairs of faces separated by a 20%-morph step was produced for the better likeness task. A set of 11 morph faces (including the end-points) separated by a 10%-morph step were produced for each continuum to be used in the identification task.
Procedure
The only departure from the procedure in Experiment 1 was that the left/right position of the end-points on the screen, as well as the fictitious names, was fully counterbalanced.
Results
The shapes and the positions of the psychometric functions were, as in Experiment 1, recovered, for each observer, from the regression lines fitted through the five central morph faces (30%, 40%, 50%, 60%, and 70%). The individual identification data were again summarized by two parameters of the regression lines computed for each observer: The shape of the identification curve was described by its slope; the boundary location was described by the value on the morph continuum corresponding to the 50% performance in the identification task. Two separate one-way ANOVAs with continuum (T1–D vs. D–T2 vs. T2–T1) as a between-subjects factor were run on the slopes and on the boundaries of the three continua. Performance was similar to that shown in Figure 2. There was no difference in the slopes between the three continua, F(2, 44) < 1. However, the position of the boundaries (T1–D = 51.89%; D–T2 = 46.61%; T1–T2 = 50.55%) on the three continua differed significantly, F(2, 44) = 7.58; MSE = 15.59, p < .002. Comparisons between pairs of continua revealed this to be due to the continuum D–T2: T1–D versus D–T2, F(1, 44) = 13.85, MSE = 15.59, p < .0007; D–T2 versus T2–T1, F(1, 44) = 7.98, MSE = 15.59, p < .008; but T1–D versus T2–T1, F < 1.
A one-sample t test was carried out on the individual boundary position of each continuum against the expected value of the boundary, 50%. On the continuum T1–D, the position of the boundary was slightly different from the value of 50%, t(14) = 1.84, p < .09. On the continuum D–T2, the boundary was significantly shifted towards the distinctive end-point, t(15) = 4.12, p < .0009. The position of the boundary on the continuum T2–T1 did not differ significantly from the 50% morph coefficient, t(15) < 1.
Considering the better likeness task, the average inspection time was 43.58 s (range 30–66 s; SD 7.57 s); a one-way (continuum: T1–D vs. D–T2 vs. T2–T1) ANOVA revealed no difference among the three continua (F < 1) in this respect. A 9 (pairs, 9 levels) × 3 (continuum: T1–D vs. D–T2, vs. T2–T1) ANOVA with repeated measures over the first factor was run on the percentage of correct responses. The difference between the three continua was significant: continuum, F(2, 44) = 3.23; MSE = 1,009.16, p < .05. The markedly significant interaction indicated that the discrepancy was substantially unevenly distributed among the different pairs, F(2, 44) = 9.26; MSE = 187.50, p < .0001. Hence, separate analyses were run on each continuum.
The average discrimination performance in the better likeness task on the continuum T1–D was 77.41%, SD = 17.03. A one-way (pairs, 9 levels) ANOVA carried out on the better likeness percentage of correct responses indicated that the pairs of faces differed in accuracy, F(8, 112) = 12.58; MSE = 243.28, p < .0001. The cross-boundary pairs for continuum T1–D were Pair 5 (40%–60%) and Pair 6 (50%–70%). When testing for the presence of a CP effect, the comparison between the cross-boundary pairs and the within-category pairs revealed a significant difference: F(1, 112) = 13.59, MSE = 243.28, p < .0005 (see Figure 6). However, there was no significant correlation between the within-pair differences in classification and the performance in the better likeness task (r = .48, p > .05).
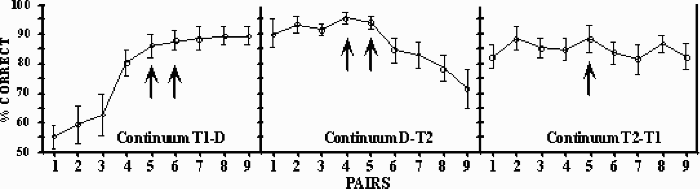
Mean correct better likeness curves on the three continua of Experiment 2. Arrows indicate the cross-boundary pairs. Error bars are standard deviations.
On continuum D–T2, the average performance in the better likeness task was 86.63%, SD = 15.01. A one-way (pairs, 9 levels) ANOVA revealed differences in accuracy, F(8, 120) = 6.19, MSE = 172.02, p < .0001. The cross-boundary pairs for continuum D–T2 were Pair 4 (30%–50%) and Pair 5 (40%–60%). The cross-boundary pairs were better discriminated than the within-category pairs: F(1, 120) = 14.95, MSE = 172.02, p < .0003 (see Figure 6). However, there was no significant correlation between the within-pair differences in classification and the performance in the better likeness task (r = .49, p > .05).
On the continuum T2–T1, the average accuracy in the better likeness task was 84.64% correct, SD = 16.01 (see Figure 6). A one-way (pairs, 9 levels) ANOVA revealed no difference in accuracy between the pairs of faces in the better likeness task (F < 1). Pair 5 (40%–60%) was the cross-boundary pair. The accuracy for Pair 5 was compared to the accuracy on the within-category pairs: The mean comparison was not significant, F(1, 120) = 1.59, MSE = 150.92, p = .21. There was also no correlation between the within-pair differences in classification and the performance in the better likeness task (r = –.11, p > .05).
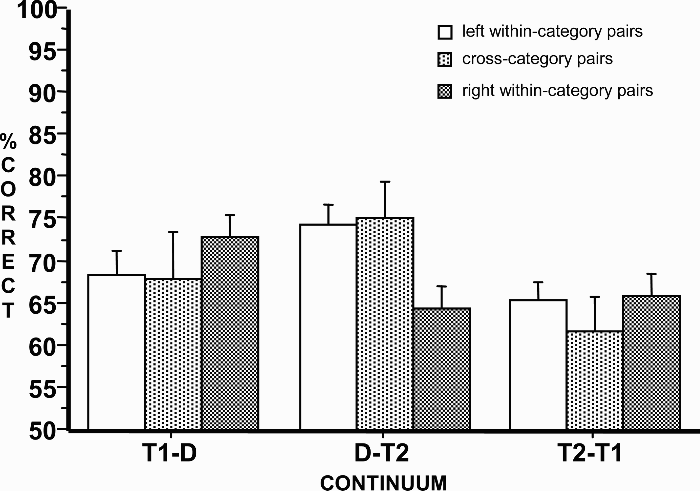
It is clear from Figure 6 that there is an asymmetry in performance for continua with distinctive end-points. While on the T2–T1 continuum the linear regression was essentially horizontal, t(8) = 0.61, p = .56, it was strongly slanted on T1–D, t(8) = 5.93, p < .0007, and D–T2, t(8) = 3.87, p < .007. Consequently, to show the effects of the asymmetry on CP, the data were reanalysed with within-category pairs divided into “within-category pairs to the right-hand side of the boundary” and “within-category pairs to the left-hand side of the boundary”. A 3 (continuum: T1–D, D–T2, T2–T1) × 3 (position: within-category pairs/left; cross-boundary pairs; within-category pairs/right) ANOVA with repeated measures over the second factor was run on the individual better likeness data. The results are graphically represented in Figure 7.
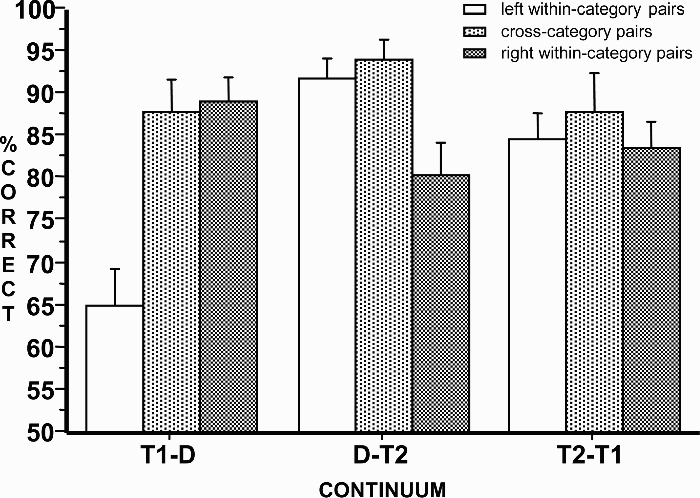
Mean correct (left within-category, cross-category, and right within-category) for the three continua in Experiment 2. Error bars are standard deviations.
The main effect of continuum was not significant, F(2, 44) = 2.34, MSE = 326.07, p = .11. The main effect of position, F(2, 88) = 11.62, MSE = 93.51, p < .0001, and its interaction with the factor continuum, F(4, 88) = 14.27, MSE = 93.51, p < .0001, were significant. The interaction was first examined by considering the two continua that have one distinctive end-point. In both cases, the cross-boundary pairs were significantly better discriminated than the within-category pairs on the typical side of the continuum: T1–D, contrast cross-boundary versus within-category pairs/left, F(1, 28) = 28.41, MSE = 138.60, p < .0001; D–T2, contrast cross-boundary versus within-category pairs/right, F(1, 30) = 17.54, MSE = 86.35, p < .0002, while the contrast between the cross-boundary pairs and the distinctive side within-category pairs was not significant (in both cases F < 1; Figure 7). Thus, for these two continua there was poorer discrimination of within-category pairs on the typical side while on the distinctive side the better likeness performance was equivalent to the performance on cross-boundary pairs. Considering only these two continua, the contrast between the performance on the cross-boundary versus the performance on the within-category pairs was extremely significant: F(1, 29) = 16.73, MSE = 256.89, p < .0001. However, a one-way ANOVA (position) run on the “typical–typical” continuum (T2–T1) showed that the cross-boundary pairs were not significantly better discriminated than the within-category pairs, F(1, 30) = 2.68, MSE = 58.59, p = .11.
Discussion
Two main results emerged from Experiment 2. First, on the typical–typical face continuum, the better likeness performance was equivalent for all the pairs. Second, cross-boundary pairs (as determined from identification data) were better discriminated than within-category pairs only for the two typical–distinctive continua.
The absence of CP on the typical–typical continuum replicates the result of Experiment 1 and is in sharp contrast to Levin and Beale (2000) but the “CP” found for the continua with distinctive end-points is congruent to their claim. However, the significant advantage of the cross-boundary pairs was associated with peculiarly shaped discrimination functions.
Figure 6 shows the markedly asymmetrical trend found in the better likeness curves on the typical–distinctive continua of Experiment 2; they could hardly be regarded as similar to the bell-shaped curve expected for familiar observers. On the typical–distinctive continua, the whole region contiguous to the distinctive face appeared to gain in discriminability. Furthermore, the compression effects found for the typical–distinctive continua were not the usual CP effects based on a within-class compression and/or the between-class expansion of otherwise linear physical continua. The nonlinear trend observed on the typical–distinctive continua of Experiment 2 might be better described as a strong within-class compression close to the typical end-point and of a strong within-class expansion close to a distinctive end-point. Thus, we are inclined to consider the typical–distinctive better likeness functions the result of an uneven perceptual spacing in the face space. The consequent statistical advantage of the cross-boundary pairs over the within-category pairs should be termed a “pseudocategorical effect” as it may be better explained on the basis of the typicality gradient between the two end-points rather than on the basis of the constitution of new perceptual categories for the identities of the two end-points.
There are several reasons why distinctive faces are better remembered. For instance, distinctiveness may induce a stronger memory trace of a newly learned face and increase its memorability (Bartlett, Hurry, & Thorley, 1984). Alternatively, and argued here, a distinctive end-point may correspond to a larger attractor field (Tanaka et al., 1998) in the representational face space and produce the observed shift of the boundaries on the typical–distinctive continua towards the distinctive end-point. Not least, distinctive faces are by definition located in a sparser region of the face space (Valentine, 1991); hence it is quite possible that it is easier to discriminate faces lying close to a distinctive end-point because they are distinctive themselves. It must be that some such mechanism is responsible for the CP for unfamiliar faces in Experiment 2. It is unlikely to derive from fast short-term learning as proposed by Levin and Beale (2000) because, if that were the case, CP would also have been found on the typical–typical continuum.
The examination of possible CP effects for unfamiliar faces found in Experiment 2 was continued by asking whether they would survive a change in procedure. Levin and Beale (2000) had replaced the classical two-alternative forced-choice (Harnad, 1987) procedure with the better likeness task. They did so because they wished to focus participants’ attention on the association between a name and its face in order to encourage the global processing of facial stimuli. Experiment 3 examined CP effects for the stimuli in Experiment 2 but with the classical procedure.
Experiment 3
The X–AX task, used in Experiment 3, is a variant of the classical two-alternative forced-choice discrimination task commonly used in the study of CP (Harnad, 1987) and the X–A–B task of Etcoff and Magee (1992). At each trial, a face X is presented, followed by the pair of faces (A and X) shown side by side. The observers have to decide which of A and X matches the face X. Contrary to the better likeness task, the X–AX discrimination task does not ask, at each trial, the observer to recall the distinctive end-point, and this, in turn, should reduce the effect of the distinctive end-point. We therefore examined whether the presumed pseudocategorical effects found in Experiment 2 would survive in the X–AX paradigm.
Method
Participants
A total of 48 different volunteer Caucasians from Goldsmiths, University of London, participated in the experiment (17 males, 31 females, aged between 18 and 46 years).
Stimuli
The stimuli were the same as those used in Experiment 2 but were presented on an iMac with a 15′ colour monitor set to an 8-bit grey-scale mode.
Procedure
The procedure for the most part, followed that in Experiment 2. However, the better likeness task was replaced with the X–AX discrimination task; this preceded the identification task. The X–AX discrimination task consisted of a two-alternative forced-choice task. In each trial, one morphed face (belonging to one of the stimulus pairs) was presented on the monitor for 1,100 ms, and, after a 600-ms blank interstimulus interval (ISI), the stimulus pair was presented and remained on the screen until the observer pressed a response key. The observer had to decide which one of the two faces in the pair was identical to the one presented at the beginning of the trial. The intertrial interval was 1,000 ms.
Results
The data were analysed as in Experiments 1 and 2. The slopes and the boundaries of the three curves were obtained from the regression lines fitted through the data for the five central morph faces of the individual identification data and were remarkably similar to those found for the data from Experiment 2.
As for the identification data of Experiment 2, two separate ANOVAs with continuum (T1–D vs. D–T2 vs. T2–T1) as a between-subjects factor were run, respectively, on the slopes and on the boundary values. While again there was no difference between the slopes, F(2, 45) = 1.65, MSE = 0.22, p = .20, the boundaries (T1–D = 56.23%; D–T2 = 45.16%; T1–T2 = 53.06%) differed in position on the three continua, F(2, 45) = 9.16, MSE = 56.77, p < .0006. A one-sample t test was carried out on the boundary position for each continuum against the expected value of the boundary (50%). The boundary position on the two typical–distinctive continua differed significantly, T1–D, t(15) = 2.52, p < .03; D–T2, t(15) = 3.75, p < .002, whereas the boundary on the typical–typical continuum did not, T2–T1, t(15) = 1.8, p = .09.
In Experiment 3, the cross-boundary pairs were: Pair 6 (composed of the morphs 50%–70%) on the continuum T1–D; Pairs 4 and 5 (30%–50% and 40%–60%) on the continuum D–T2, and Pair 5 (40%–60%) on the continuum T2–T1. The cross-boundary pairs, selected from identification data with the new participants, were the same as those found in Experiment 2, with the only exception that Pair 5 was also selected for the continuum T1–D.
A 3 (continuum: T1–D vs. D–T2 vs. T2–T1) × 9 (pairs, 9 levels) ANOVA with repeated measures over the second factor was run on the X–AX percentage of correct responses. Neither of the two main effects reached significance, continuum, F(2, 45) = 2.23, MSE = 518.28, p = .12; pairs, F(8, 360) = 1.58, MSE = 275.93, p = .13, but there was a significant interaction between the factors, F(16, 360) = 1.67, MSE = 275.93, p < .05 (see Figure 8). Separate analyses were hence run on the individual continua.
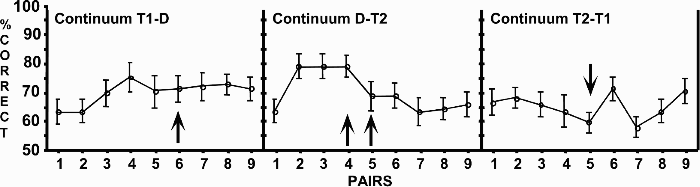
Mean correct X–AX discrimination on the three continua of Experiment 3. Arrows indicate the cross-boundary pairs. Error bars are standard deviations.
On the continuum T1–D (mean performance 69.71%), a test for a CP effect (cross-boundary pair 6 vs. other within-category pairs) produced F < 1. There was also no significant correlation between the within-pair differences in classification and the performance in the better likeness task (r = .43, p > .05). On the continuum D2–T (mean performance 70.05%), the comparison between the cross-boundary pairs 4 (30%–50%) and 5 (40%–60%) versus the other within-category pairs showed only a trend, F(1, 120) = 3.38, MSE = 269.46, p = .07, for better performance with cross-category pairs. There was also no significant correlation between the within-pair differences in classifications and the performance in the better likeness task (r = .39, p > .05). On the continuum T2–T1 (mean performance (65.02%) again there was no difference in accuracy on the cross-boundary pair (Pair 5; 40%–60%) to that of the within-category pairs (F < 1). There was also no correlation between the within-pair differences in classification and the performance in the better likeness task (r = –.20, p > .05).
Linear regressions revealed no significant effects for T2–T1, t(8) = 0.17, p = .87, and D–T2, t(8) = 1.54, p = .17, but there remained a small trend in the same direction as that in Experiment 2 for T1–D, t(8) = 2.49, p < .05. To compare the results to those of Experiment 2 and to ensure that any residual distinctiveness was not affecting CP, within-category pairs were divided into “within-category pairs to the right-hand side of the boundary” and “within-category pairs to the left-hand side of the boundary”. A 3 (continuum: T1–D, D–T2, T2–T1) × 3 (position: within-category pairs/left; cross-boundary pairs; within-category pairs/right) ANOVA with repeated measures over the second factor run on the individual X–AX discrimination data showed no main effects but a marginal interaction, F(4, 90) = 2.37; MSE = 152.91; p = .06. The interaction was examined in 3 one-way ANOVAs for each continuum. No effects (see Figure 9) were found on any of the continua between these unfamiliar faces: F < 1 on T1–D; F(1, 30) = 1.98, MSE = 164.14, p = .17 on D–T2; and F < 1 on T2–T1.
Mean correct (left within-category, cross-category, and right within-category) for the three continua in Experiment 3. Error bars are standard deviations.
Discussion
In Experiment 3, we obtained no CP effects for unfamiliar faces. Importantly, as shown in the fate of the within-category pairs on the typical side of the continuum (compare Figures 6 and 7 with Figures 8 and 9), the X–AX discrimination task proved largely immune to the perceptual nonlinearities on the typical–distinctive continua found in Experiment 2 with the better likeness task. Levin and Beale (2000) argued that lack of CP effects for unfamiliar faces occurs when insufficient time is allowed for the establishment of face identity. However, In Experiment 3, learning of the end-points was allowed and encouraged, but still no CP emerged.
In order to carry out the better likeness task, participants have to hold in short-term memory a trace of the end-points because at each trial they are asked to decide which of two faces resemble more one or the other of them. Distinctiveness can interact with the creation of the memory image of the two end-points during the learning phase and during the whole better likeness task. For example, distinctive features that distinguish the two end-points might be critically incorporated into the memory image. The X–AX task does not require that the end-points be held in memory. One can perform this task by simply comparing at each trial the image presented on the screen with the subsequent pair. In this sense, the representational warping in the face space produced by the distinctiveness of one of the end-points exerts a lesser influence in the trial-by-trial execution of the task. Therefore, the X–AX discrimination task would seem preferable to the better likeness task if one is interested in the underlying categorical organization for facial identity. However, it is first necessary to show that the X–AX procedure produces similar results to the better likeness task when using familiar face stimuli.
Experiment 4
In Experiment 1, the Theakston–Donovan continuum was perceived categorically by observers who were familiar with the two celebrities. In Experiment 4, it was now necessary to check whether the X–AX task could also be used to detect CP with familiar observers.
Method
Participants
A total of 20 different Caucasians from Goldsmiths, University of London, participated in the experiment (7 males, 13 females, aged between 18 and 48 years). Of these, 10 were paid, and the others volunteered. All the participants were familiar with the faces of Jamie Theakston and of Jason Donovan. One participant was excluded because she performed at chance.
Stimuli
The stimuli were those used in Experiment 1.
Procedure
The procedure followed that of Experiment 3 except that the participants were recruited on the basis of their familiarity with the two end-points (Jamie Theakston and Jason Donovan). Participants were asked to name the faces of the two celebrities printed on the monitor and whether they thought they were familiar with them. Only if that was the case were they selected to take part in the experiment. The counterbalancing followed the procedure in Experiment 1 (familiar group).
Results
Identification data and X–AX discrimination
The shape and the positions of the psychometric function along the continuum were computed by fitting a regression line through individual data in the region in which the identification decisions varied the most—that is, across the five central morph faces (30%, 40%, 50%, 60%, and 70%).
The slope of the regression curve was 2.75 (SD = 0.18), and its boundary location was 48.72 (SD = 3.31). A one-sample t test carried out on the boundary position found in Experiment 4 against the expected value of the boundary showed that, as in Experiment 1 (see Figure 2), it did not differ from the midpoint of the continuum—that is, 50%, t(18) = 1.69, p = .11.
On the basis of the identification data, Pair 4 (30%–50%) and Pair 5 (40%–60%) were selected as the cross-boundary pairs. While in Experiment 1 (familiar group) only Pair 5 straddled the categorical boundary, for the new set of participants Pair 4 also satisfied the criterion of having one face classified with one of the two end-points on more than 66% of trials and the other classified with the other end-point on more than 66% of trials. The average discrimination performance in the X–AX discrimination task on the Theakston–Donovan continuum was 71.86% correct (SD = 7.08). The percentage of correct responses from the X–AX discrimination task was analysed in a one-way (pairs, 9 levels) ANOVA. The means of the nine pairs differed significantly: F(8, 144) = 4.37, MSE = 217.69, p < .0001. The cross-boundary pairs (Pairs 4 and 5) were significantly better discriminated than were the other within-category pairs, F(1, 144) = 19.80, MSE = 217.69, p < .0001 (see Figure 10).
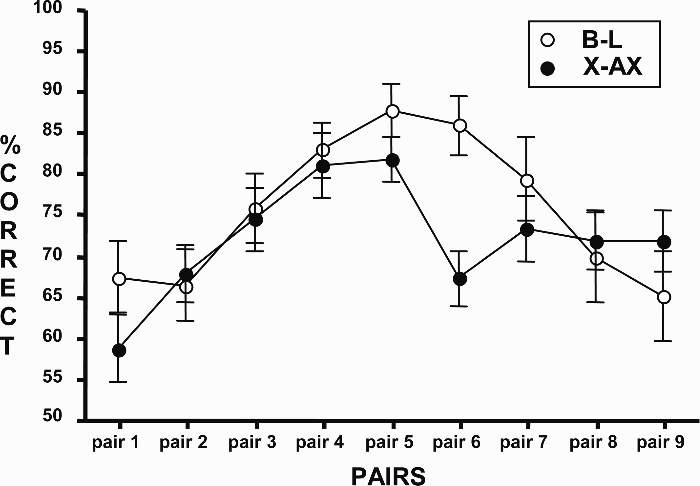
Mean correct scores for the better likeness task (B-L) and for the X–AX discrimination task by familiar observers. Error bars are standard deviations.
Better likeness and X–AX discrimination tasks
In Experiment 1, 21 familiar observers were administered a better likeness task on the same stimuli as those used in Experiment 4, in which 19 different familiar observers were given an X–AX discrimination task. It is therefore possible to compare the results obtained with the two different tasks. Figure 10 illustrates the almost overlapping curves obtained with the two tasks. However, as there might be some difference in performance on the two sides of the midpoint, especially at Pair 6, a 2 (task: better likeness vs. X–AX discrimination) × 3 (position: within-category pairs/left; cross-boundary pairs; within-category pairs/right) ANOVA was run with repeated measures on the second factor. The analysis confirmed a main effect of position, F(2, 76) = 18.38, MSE = 146.28, p < .0001, due to cross comparisons being more accurate than within left, F(1, 76) = 31.72, MSE = 146.28, p < .0001, and within right, F(1, 76) = 22.65, MSE = 146.28, p < .0001, and there being no difference between the two within conditions (F < 1). There was no effect of task, F(1, 38) = 1.28, MSE = 203.22, p = .26, and no interaction between task and position (F < 1). Familiar observers hence produced a noticeably similar performance on the same stimuli in the two discrimination tasks.
Discussion
The coherent results from the different paradigms—that is, the better likeness and the X–AX—bring convincing evidence in favour of the Beale and Keil (1995) findings concerning the role of familiarity in the categorical processes in face perception. These findings are taken further in the General Discussion.
General Discussion
Four experiments tested the view of Levin and Beale (2000) and Campanella et al. (2003) that CP can be demonstrated in an unfamiliar-face continuum. Direct evidence against that view comes from Experiment 1 where the same faces were used for two groups of which only one was familiar with the faces. It was only the familiar group that showed CP in the better likeness procedure of Levin and Beale (2000). At the very least, for these typical faces, familiarity is critical to produce CP. Experiment 2, by examining face distinctiveness, investigated one reason why unfamiliar faces may give rise to an apparent CP. A distinctive end-point could distort the linear spacing of the morphed continuum and thereby mimic a true CP. While it is not claimed that it was distinctiveness alone that produced CP in the studies that have found it for unfamiliar faces, it is therefore proposed at least as a factor that needs to be considered. Experiment 3 showed that replacing the better likeness procedure with the more classic X–AX design now no longer produced a CP effect for these same distinctive faces. Experiment 4 showed that both procedures produced CP for familiar faces.
We first comment on the strong categorical effects found in the identification components of all these experiments. Identification performance was classically used in the CP literature to predict the performance in the discrimination task (Liberman, Harris, Hoffman, & Griffith, 1957). In early models of CP, especially with research on phonemes, the two tasks were considered as equivalent; it was argued that observers could discriminate two stimuli only as long as they could label them differently (see Macmillan, 1987; Macmillan, Kaplan, & Creelman, 1977). Thus, the psychometrical sigmoid identification function (see Figure 2) was often taken to reflect the observers’ distorted perception of physically linear continua—that is, the expansion of differences around a category boundary and/or the compression of differences away from the boundary. However, as McKone et al. (2001) observed, “the fact that the 60% … image is classified as Face 2 on 100% of occasions does not necessarily indicate that the participant perceives the image as indistinguishable from Face 2 itself, nor does it necessarily show that it is perceived as more like the 80% image than the 40% image”. We would only add that the parameters of the identification curve are somewhat affected by the choice of end-points. Distinctiveness reliably shifted, if only a little, the position of the perceived mid-point between the two identities significantly towards the distinctive end-point.
Clearly, one should be cautious of any inference from the shape of the identification curve alone of either the presence (Kircher et al., 2001; Rossion, Schiltz, Robaye, Pirenne, & Crommelinck, 2001) or the absence (Tanaka et al., 1998) of categorical processes. Rather the psychometric S-shaped functions generally found in the literature as an output of such tasks are more to be seen as consequences of making a binary choice. Psychometric sigmoid identification functions are found here for unfamiliar face continua but these should not be taken as symptomatic of a true underlying categorical process. As Viviani et al. (2007) argue, it is only designs like the X–AX paradigm that can give unambiguous evidence in favour of CP. Thus, for the present data, one might even be reluctant to interpret the modest (but nonsignificant correlations) between the within-pair differences in classification and the performance in the better likeness task as reflecting a tendency towards CP for unfamiliar faces.
We next comment on the two tasks that are used to determine categorical discrimination. Experiments 3 and 4 confirmed that observers provided a very similar (categorical) performance in the discrimination tasks (better likeness and X–AX) for familiar faces. Observers of unfamiliar faces performed the two tasks very differently. First, the better likeness is an easier task for unfamiliar observers. Inspection of Figures 7 and 9 would suggest that the unfamiliar observers’ performance improved some 10% on the better likeness task. Second, the X–AX task is less sensitive to the typicality gradients that may arise on unfamiliar face identity continua as a consequence of having used a distinctive end-point. Both of these observations might relate to the functioning mechanisms of the better likeness task.
The better likeness task was originally introduced by Beale and Keil (1995) as a substitute for a variety of the X–AX discrimination task, in order to encourage the global processing of facial stimuli. With considerable training (McKone et al., 2001) or for familiar faces (Experiment 4), the two procedures produce similar outcomes. However, with limited exposure to a face, the better likeness task would appear to induce observers to focus on the perceptual aspects of a morph continuum. A probable reason is that the memory traces of the unfamiliar end-points are particularly sensitive to distinctive traits. With limited training, it is likely that the memory traces do not contain the configural aspects of faces that could be encoded from the multiple views encountered for familiar faces. The unfamiliar faces used in this and previous experiments are static and from a single view; they are more likely to be remembered for their featural aspects. The result is the establishment of confounding effects for the better likeness task mimicking the presence of perceptual discontinuities across the boundary region of the typical–distinctive continua. The reduced effect of the distinctiveness gradient on the X–AX discrimination performance might be explained in relation to its lesser involvement with the newly learned end-point memory trace. At each X–AX trial, the discrimination is made locally in relation to the fast decaying trace of face X, without a strong recall of any of the two end-points. Since 1995, better likeness has been the favoured task used to determine discrimination performance but our results indicate that it is not possible to use this methodological instrument without controlling for distinctiveness of the end-point faces.
Turning to the effects of distinctive end-points that produced asymmetric morphed continua, we note that Levin and Beale (2000) reported and discussed at length an asymmetry in their better likeness discrimination data. They noted that discrimination “accuracy was higher at the ‘beginning’ of the continua than at the ‘end’” (p. 390). Similar oddities in the better likeness task were reported occasionally in other studies (McKone et al., 2001). We raise the possibility that such asymmetrical increases in discrimination accuracy could be the unfortunate choice of distinctive end-points. For example, by inspection, some of the faces used in Campanella et al. (2003) look highly distinctive. All we can be definite about is that within the constraints of the paradigms used here, unfamiliar faces were not perceived categorically. The amount of training that would be required to produce CP and its interaction with distinctiveness would be a matter for future study. However, the demonstration of the artifactual CP from distinctive faces could have implications for the present uncertainty about whether other facial categories (e.g., race, sex) are represented categorically (Bülthoff & Newell, 2004; Campanella, Chrysochoos, & Bruyer, 2001; Levin & Angelone, 2002). These decisions could be made on the basis of distinctive features and could thereby not require familiarity as a mechanism for altering within- versus between-category distinctions (Goldstone, 1994a, 1994b). Thus, it is possible that the different outcomes of experiments on race and sex CP could have arisen from the different methodologies employed and particular faces chosen in the studies.
The present investigations, therefore, support the original interpretation of the CP phenomenon for face identity continua by Beale and Keil (1995). Novel face identities may be quickly encoded for immediate sorting purposes but the representations utilized do not necessarily have the format of perceptual categories. Indeed, in terms of CP, it would seem that the representations for a novel human face do not differ from those for a monkey face (Campbell et al., 1997). How familiarity, and how much familiarity, with a face achieves CP are still the critical questions to be answered in future research (see Viviani et al., 2007). One possibility from the current data is that familiarity makes a face more distinctive. Certainly, the choice of a distinctive face as an end-point in a morphed continuum can spuriously produce effects that resemble CP; in consequence, researchers doing almost the same experiments may produce very different results and come to radically different conclusions.