
Abstract
Perceiving someone's averted eye-gaze is thought to result in an automatic shift of attention and in the preparation of an oculomotor response in the direction of perceived gaze. Although gaze cues have been regarded as being special in this respect, recent studies have found evidence for automatic attention shifts with nonsocial stimuli, such as arrow cues. Here, we directly compared the effects of social and nonsocial cues on eye movement preparation by examining the modulation of saccade trajectories made in the presence of eye-gaze, arrows, or peripheral distractors. At a short stimulus onset asynchrony (SOA) between the distractor and the target, saccades deviated towards the direction of centrally presented arrow distractors, but away from the peripheral distractors. No significant trajectory deviations were found for gaze distractors. At the longer SOA, saccades deviated away from the direction of the distractor for all three distractor types, but deviations were smaller for the centrally presented gaze and arrow distractors. These effects were independent of whether line-drawings or photos of faces were used and could not be explained by differences in the spatial properties of the peripheral distractor. The results suggest that all three types of distractors (gaze, arrow, peripheral) can induce the automatic programming of an eye movement. Moreover, the findings suggest that gaze and arrow distractors affect oculomotor preparation similarly, whereas peripheral distractors, which are classically regarded as eliciting an automatic shift of attention and an oculomotor response, induce a stronger and faster acting influence on response preparation and the corresponding inhibition of that response.
Several studies have provided evidence supporting the view that gaze-cues (face stimuli with averted eyes) can produce a reflexive, automatic shift of attention in the direction of the gazed-at location (e.g., Bayliss & Tipper, 2006; Downing, Dodds, & Bray, 2004; Driver et al., 1999; Friesen, Moore, & Kingstone, 2005; Friesen, Ristic, & Kingstone, 2004; Quadflieg, Mason, & Macrae, 2004; Ristic & Kingstone, 2005; Sato, Okada, & Toichi, 2007; for a review, see Frischen, Bayliss, & Tipper, 2007a). Evidence for such automatic attention shifts has been obtained by comparing response times to peripheral targets in the presence of centrally presented gaze cues. In these experiments, faster reaction times (RTs) are observed when the eye-gaze is directed towards the target location (“congruent” condition) than for responses to targets in the opposite (“incongruent”) direction. Such benefits of congruent gaze cues are found when the cue is oriented equally often towards the target location as away from it (“unpredictive cues”) and even when the direction of gaze is more often away from the target than towards it (“counterpredictive cues”; Driver et al., 1999; Friesen et al., 2004; Tipples, 2008).
In addition to a facilitation of covert attention, seeing someone's gaze can also result in the automatic programming of an oculomotor (saccadic) response (Kuhn & Benson, 2007; Kuhn & Kingstone, 2009; Mansfield, Farroni, & Johnson, 2003; Nummenmaa & Hietanen, 2006; Ricciardelli, Bricolo, Aglioti, & Chelazzi, 2002; however, see Friesen & Kingstone, 2003). Evidence supporting this view was obtained in studies examining saccade error rates to a peripheral target in the presence of a task-irrelevant eye-gaze distractor located at fixation. More direction errors were observed when eye-gaze was incongruent with the direction of the peripheral saccade target, demonstrating an influence of eye-gaze on responses even when the gaze cue was unlikely to indicate the correct response (Kuhn & Benson, 2007; Kuhn & Kingstone, 2009). Further compelling evidence for automatic saccade preparation, which does not rely on trials in which participants make an error, has been obtained by studying the effects of irrelevant gaze cues on the deviation of saccade trajectories towards a target presented in a direction orthogonal to the cue (Nummenmaa & Hietanen, 2006). In their study, Nummenmaa and Hietanen (2006) asked participants to make saccades to a target appearing above or below fixation while, at the same time, or 100 ms before target onset, a gaze cue was presented at fixation. When the gaze cue was presented simultaneously with the saccade target, saccade trajectories were found to curve away from the direction of the cue. No such effect of perceived gaze on saccade trajectory deviations was found when the gaze distractor preceded the target by 100 ms. Interestingly, for a simultaneous onset of the gaze distractor and the target, the observed trajectory deviation was no different from that induced by a peripherally presented distractor.
A mechanism proposed to account for the deviation of saccade trajectories away from a distractor (or attended) location is illustrated in Figure 1. Here, the hypothesized activation of a two-dimensional saccade “motor map” is shown over time (see also Godijn & Theeuwes, 2004; Hermens, Sumner, & Walker, 2010; Tipper, Howard, & Houghton, 1998; Tipper, Howard, & Paul, 2001). Initially, the onsets of both the target and the distractor result in the automatic activation of the corresponding sites in the motor map (Figures 1A and 1B). However, because the observer is required to shift his or her gaze to the target and not to the distractor, top-down inhibition is applied to suppress the activation at the competing distractor location (Figure 1C). This presumed top-down inhibition, in addition to lateral inhibition between the neurons encoding the position of the target (which receives top-down activation for selection) and those encoding the distractor location, results in an overall suppression of the distractor-related activation below baseline (the resting state of the neurons). If the saccade is initiated at this stage, the initial direction deviates away from the inhibited distractor location (following the mean vector of activation, indicated by the white arrow in Figure 1D). Such an explanation is supported by findings from studies applying single cell recording or reversible deactivation techniques in monkeys to examine the influence of neural activity in oculomotor structures such as the superior colliculus (SC) and the frontal eye fields (FEFs) on saccade trajectories (Aizawa & Wurtz, 1998). The neurophysiological evidence shows that modulations of saccade trajectories occur when there are competing populations of activity encoding saccade direction (McPeek, 2006; McPeek, Han, & Keller, 2003; McPeek & Keller, 2002). Deviation of trajectories away from a competing location is found when activity is below the resting state activity at the distractor site (Aizawa & Wurtz, 1998; McPeek et al., 2003). Thus, saccade trajectory deviations have been regarded as a sensitive measure of the activity, or inhibition of activity, in oculomotor structures at the time a saccadic response is initiated.
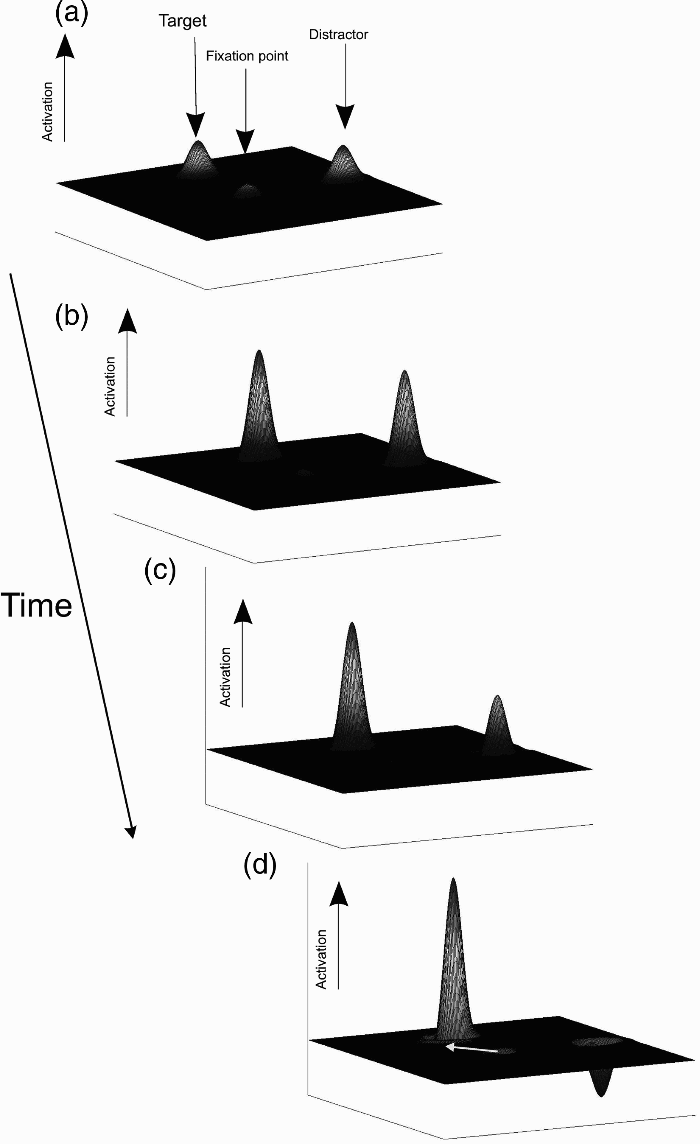
Illustration of a possible mechanism underlying the deviation of a saccade trajectory away from a distractor position. The subplots show the hypothesized activation of the saccade motor map over time following the onset of a target and distractor. (A) The target and the distractor are presented. The activity at the fixation point is suppressed. (B) Automatic (stimulus-driven) activation of the motor map at the target and distractor site. (C) Suppression of the distractor activity by top-down influences and lateral inhibition. (D) The activation at the target site reaches threshold. Activity at the distractor site has been suppressed below baseline. The saccade is started in the direction of the mean vector of activation in the map, resulting in an initial direction away from the target position (indicated by the white arrow).
Nummenmaa and Hietanen (2006) showed that saccade trajectories deviate away from the direction indicated by a simultaneously presented eye-gaze distractor, by an amount comparable to the deviation away from a peripheral distractor. They also showed that the effects of peripheral and gaze distractors were dramatically reduced when the distractor preceded the target by 100 ms. This suggests that the effects of the two types of distractors (gaze and peripheral onsets) on saccade programming are short-lived, which is one of the hallmarks of reflexive orienting, demonstrating a fast-acting but transitory process (Müller & Rabbitt, 1989). In terms of the proposed mechanism in Figure 1, the reduction of the effect of distractors that precede the target by 100 ms indicates that the activation produced by the distractor is quickly restored to baseline after it reaches its lowest value. In this respect, the effects of distractors on saccade programming appear to differ from those on response times, which have been found to last several hundreds of milliseconds after cue onset (e.g., Driver et al., 1999).
The latter difference between the implied time-course of saccade programming (based on saccade trajectory deviations) and covert attention (based on response times) is interesting, because it has been proposed that the two types of processes are strongly interrelated. For example, according to the premotor model of attention (Rizzolatti, Riggio, Dascola, & Umiltà, 1987) a shift of covert attention is preceded by the programming of an eye movement towards that location. Consistent with this view it has been shown that the detection of a target improved when it was presented at a location to which a saccade was programmed, indicating that not only the eye movement but also attention was directed to the target location (Deubel & Schneider, 1996; Hoffman & Subramaniam, 1995). In addition, research in monkeys showed that microstimulation of the FEFs improved performance on a target presented at the location to which a saccade would be directed if stimulation would have brought activity in the stimulated area above threshold (Moore & Fallah, 2001, 2004). Finally, several studies have found that eye movement trajectories curve away from an attended location (Sheliga, Riggio, Craighero, & Rizzolatti, 1995a; Sheliga, Riggio, & Rizzolatti, 1994; Van der Stigchel, Meeter, & Theeuwes, 2007b), indicative of the preparation of a saccade to this location.
Although it has been thought that gaze cues are special in their effects on attention and eye movements, recent evidence has shown that other, nonsocial cues can also influence attention and eye movement preparation. For example, response time benefits of spatially congruent arrow cues (Tipples, 2002) and words indicating a direction (Hommel, Pratt, Colzato, & Godijn, 2001) have been found, not only when these cues are unpredictive (Hommel et al., 2001; Tipples, 2002), but even when they are counterpredictive (Tipples, 2008) of the target location. Moreover, gaze and arrow cues were found to induce similar numbers of erroneous saccades in the direction of the cue (Kuhn & Benson, 2007; Kuhn & Kingstone, 2009; however, see Ricciardelli et al., 2002), suggesting that both types of cues exert similar influences on oculomotor preparation. Saccade trajectories have been found to curve away from the direction of a centrally presented direction cue (Sheliga et al., 1994; Van der Stigchel et al., 2007b) and from centrally presented masked arrows (Hermens et al., 2010), suggesting that nonsocial cues presented at fixation can also affect saccade preparation.
A number of studies have shown that both social and nonsocial cues may have similar effects on saccade preparation. However, as such studies often rely on an examination of direction errors (Kuhn & Benson, 2007; Kuhn & Kingstone, 2009), which do not occur very frequently, it would be desirable to use a technique that examines all of the data rather than just the error responses. Furthermore, an important omission from the literature on the effects of social cues is that almost no studies have directly compared the effects of arrow and gaze cues to those of peripheral distractors (however, see Bayliss, di Pellegrino, & Tipper, 2005). Such a comparison is important, because peripheral visual onsets are classically regarded as the type of stimuli producing an automatic shift of attention and, possibly, an unwanted oculomotor response (Jonides & Irwin, 1981; Müller & Findlay, 1988; Müller & Rabbitt, 1989; Theeuwes, Kramer, Hahn, Irwin, & Zelinsky, 1999; Yantis & Jonides, 1984), and the distinction between arrow and gaze cues establishes the importance of the social relevance of the cue. To further examine the automatic shift of attention with gaze cues, we here directly compare the deviations of saccade trajectories induced by centrally presented, task-irrelevant gaze (social) and arrow (nonsocial) cues with those from a peripheral distractor, all within the same experimental paradigm. In addition, we investigate the time-course of automatic oculomotor preparation by comparing distractors that are presented immediately before the onset of the target (stimulus onset asynchrony, SOA = 10 ms; Experiment 1) with distractors that precede the target by longer intervals (SOA = 100 ms, and SOA = 300 ms; Experiments 2 and 3). Finally, the influence of the spatial properties of the peripheral distractor (stimulus size and contrast) on saccade trajectory deviations is investigated (Experiment 4) to determine whether the differences found between the three types of distractors (gaze, arrow, and peripheral) could be explained by low-level spatial properties rather than their location (peripheral or central).
EXPERIMENT 1
Experiment 1 compared the effects of centrally presented gaze and arrow distractors and peripheral distractors on the deviations of saccade trajectories. The distractors were presented immediately before target onset (SOA = 10 ms). If gaze cues are special and induce automatic shifts of attention and oculomotor programming, just like peripheral onsets do, similar effects of a centrally presented gaze distractor and a peripheral distractor are expected, which differ from the effects of a centrally presented arrow distractor.
Method
Participants
A total of 18 participants (4 male, 14 female; between 18 and 40 years of age), including the two authors, took part in the Experiment 1. Except for the authors and 1 graduate student in the department, participants were undergraduate students at Royal Holloway, University of London and were paid £5 or received course credit for their participation. All participants gave their informed consent for participation in the study, which was approved by the local ethics committee.
Apparatus
An AMD Athlon 2400 PC presented the stimuli on a 21-inch CRT screen (refresh rate of 100 Hz) using the Experimental Builder software package (SR Research Osgood, ON, Canada. Available from http://www.sr-research.com/accessories_ELII_eb.html). Participants were seated at a distance of 57 cm from the screen with their head position restrained by a chin and forehead rest. Eye movements of both eyes were recorded using the Eyelink II video-based eye-tracker (SR Research Osgood, ON, Canada), attached to the chin and forehead rest, at a rate of 500 Hz. The recording was controlled by a second Pentium 4 PC connected via a local Ethernet connection. The spatial resolution of the Eyelink II is <0.01°, and its accuracy is <0.5°.
Stimuli
The stimulus sequence is illustrated in Figure 2. A fixation screen, consisting of a large, centrally presented, black ring with a diameter of 8.5° (serving as the outline of a face shape), two smaller, horizontally aligned, black rings with a diameter of 1° each (serving as the eye sockets of the face shape), and a smaller central black disc with a diameter of 0.3° (serving as the nose of the face shape and the fixation point) was presented for a random duration between 800 ms and 1,200 ms. After this interval, the distractor item appeared, immediately followed (SOA = 10 ms) by the target for 1,500 ms. The target was a black plus sign (1.7° in size), presented at a vertical distance of 10° above or below fixation. A filled black box at a horizontal distance of 11° either left or right from the centre (1.6° in size) served as the peripheral distractor. In the arrow distractor condition, the two rings were replaced by arrow heads, each consisting of two lines of 1° with a separation of 1.2° on one side, pointing to either the left or the right. In the gaze distractor condition, two filled black circles (diameter of 0.5°), representing the pupils of the eyes of the face appeared in the left or the right side of the rings representing the eye sockets (creating eyes that looked to the left or the right). Trials were separated by a blank screen presented for 500 ms. All stimuli, including those used for calibration of the system and drift correction, were presented on a white background.
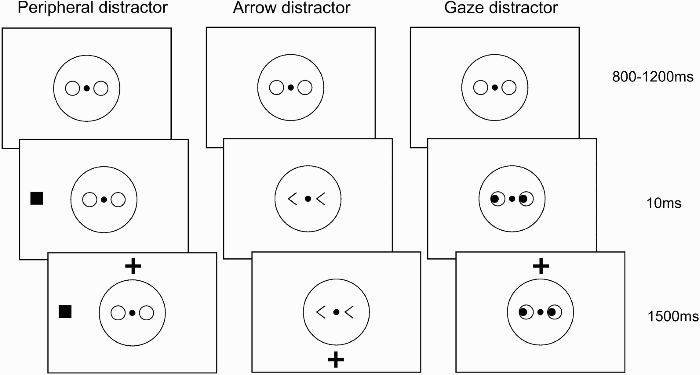
Illustration of the stimulus sequence in Experiment 1. A fixation screen consisting of a drawing of an outline of a face was presented for a random duration between 800 ms and 1,200 ms. After this interval, the distractor appeared (a peripherally presented filled square, or a centrally presented arrow or gaze cue), immediately followed (SOA = 10 ms) by the saccade target (a black plus sign) above or below fixation. A blank screen of 500 ms separated the trials (not shown).
Design
The experiment was run in five blocks of 64 trials each. These blocks consisted of four repetitions of the possible combinations of target position (above/below fixation), distractor direction or position (left/right), and distractor type (peripheral/arrow /gaze), as well as eight repetitions of the control conditions in which no distractor was presented when the target appeared above or below fixation. The order of the conditions was randomized across each group of 16 trials (containing all possible conditions).
Procedure
Before each experimental block, a 9-point calibration procedure was performed. Participants were asked to fixate 10 dots presented sequentially on a 3 by 3 grid (the first and last dot appeared at fixation). Once the recorded eye positions were aligned to this grid, and the positions of the first and last fixations overlapped, the calibration setting was accepted, and the experimental block was started. At the start of each experimental block and after each 16th trial, a drift correction was performed in which participants fixated a centrally presented dot while the experimenter pressed the space-bar to confirm the current fixation. This procedure served to correct the recorded eye positions for small head movements.
A practice block consisting of 10 trials was performed, together with five experimental blocks. Participants were instructed to fixate a centrally presented fixation point until the appearance of the target above or below fixation, to which they made an eye movement. Participants were told that distractor items could appear either at fixation or in the periphery, which were unrelated to where the target was going to appear. The experiment took approximately 30 minutes to complete.
Data analysis
Data from the right eye were used. Saccade onsets and offsets were detected with the Eyelink software, applying a 30°/s velocity and 8,000°/s acceleration criterion. Following saccade detection, the data were filtered for errors and problems with the recordings. Trials were removed from the analysis if: (a) saccades were initiated less than 80 ms after target onset, or more than three times the standard deviation from the mean response time, (b) the saccade contained a blink, (c) the saccade was of insufficient amplitude (less than 6°), (d) the saccade had a horizontal displacement of more than 3°, or (e) the peak deviation of the saccade was more than 60% of the saccade amplitude (turn-around saccades). These criteria led to the removal of on average 7.4% of the trials (standard deviation of 4.1%).
Saccade trajectory deviations were determined by taking the largest deviation of the saccade trajectory from the straight line connecting the start and end positions of the saccade trajectory and by dividing this peak deviation by the amplitude of the saccade (“average peak deviation”). Different measures, such as the average surface below the trajectory and the coefficient of a fitted polynomial (Ludwig & Gilchrist, 2002), yielded similar results and are therefore not reported here.
Unless stated otherwise, results of statistical tests present the outcomes of a univariate repeated analysis of variance (F values), or two-tailed paired t tests (t values).
Results
Figure 3a shows the average response time (RT) for the four distractor conditions, collapsed across the two saccade directions (upward and downward). Fastest response times were found for the condition in which no distractor was used, F(1, 17) = 12.59, p = .002, partial η2 = .43 (difference contrast of no-distractor RT against RTs of other conditions). Longer response times were obtained for the peripheral distractor than for the two central distractors, F(1, 17) = 6.40, p = .022, partial η2 = .27 (difference contrast of peripheral distractor against the arrow and gaze distractor). Although upward saccades yielded significantly faster response times than downward saccades, F(1, 17) = 14.05, p = .002, partial η2 = .45, the pattern of RTs for the two target directions did not differ for the different distractor types: interaction between saccade direction and distractor type, F(3, 51) = 0.11, p = .95, partial η2 = .007.
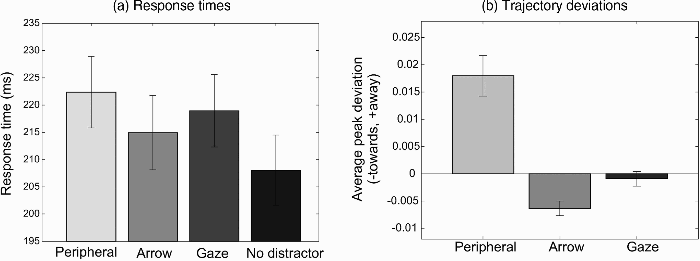
(a) Average response times across the 18 participants of Experiment 1 for the four distractor conditions (peripheral, arrow, gaze, no distractor). (b) Average saccade trajectory deviation away from the direction indicated by the distractor relative to baseline (no-distractor condition). Positive values indicate a deviation away from the distractor direction, negative values a deviation towards. Error bars show the standard error of the mean across participants.
Figure 3b shows the average peak deviation away from the direction of the distractor. Positive values in this plot indicate a deviation away from the distractor, whereas negative values represent a deviation towards. A large deviation away from peripheral distractors was found, t(17) = 4.82, p < .001. In contrast, the two central distractors showed either no significant trajectory deviation (gaze cues), t(17) = 0.68, p = .50, or a deviation towards the distractor (arrow cues), t(17) = 4.77, p < .001.
Although it is common practice in eye movement research to use data from both naive and non-naive participants, studies of social attention typically use data of naive participants only. To investigate the effect of the inclusion of the data of the 2 non-naive author participants in the present study, the data analysis was repeated using the data of the naive participants only. The exclusion of the author data did not change the pattern of results. The deviation of saccade trajectories for the peripheral distractor remained away from the distractor, t(15) = 4.10, p < .001, that for the arrow distractor remained towards, t(15) = 4.28, p < .001, and the absence of a significant deviation for the gaze distractors was maintained, t(15) = 0.50, p = .62.
Discussion
Experiment 1 compared the influence of gaze and arrow distractors on saccade trajectory deviations to the effects produced by a peripheral distractor onset that would be expected to reflexively capture attention. As observed in previous studies, a large deviation of saccade trajectories away from peripheral distractors was found. For arrow distractors, however, a small deviation towards the distractor direction was found, and no significant deviation towards or away from the cued location was observed for the gaze cue. However, because saccadic response times were slightly longer for the peripheral distractor condition, there is the possibility that the differences in trajectory deviations for peripheral and central distractors were due to differences in response times. This is because previous studies have shown that slow responses are more likely to result in a deviation of saccade trajectories away from a distractor and fast responses in a deviation towards (McSorley, Haggard, & Walker, 2006).
Although the deviations of saccade trajectories away from peripheral distractors are in agreement with the findings of Nummenmaa and Hietanen (2006), the lack of a significant deviation for the eye-gaze distractor is in clear contrast with their finding of large deviations away for gaze distractors. These differences in trajectory deviations could have been mediated by the response times for the different types of distractors. Whereas we found longer response times for peripheral distractors, Nummenmaa and Hietanen did not observe any significant differences in response times for the different types of cues. We can only speculate about the possible causes of these differences across studies, but it appears that the effects of gaze distractors on saccade trajectories are less robust than those of peripheral distractors. 1 Besides differences in response times across the conditions, our experiment differed in a few additional aspects from Nummenmaa and Hietanen's original study. In our study the distractor appeared 10 ms before the target onset, while target and distractor were presented simultaneously in the original study. Other small differences in our study were the inclusion of three rather than two types of distractor, one instead of two SOAs, and the inclusion of the control condition in the main block rather than at the end of the experiment. Although these factors may have contributed to differences between the two studies, it is suggestive that the effects of eye-gaze may not be as robust as those for peripheral distractors (the robustness of the effects for peripheral distractors is confirmed by Experiment 4 in the present study).
The conclusion that the effects of gaze cues on saccade are less reliable than those of peripheral distractors is supported by another, unpublished study by L. Nummenmaa (personal communication, October 6, 2009), which failed to find effects of perceived gaze on saccade trajectories in a comparison of exogenous and endogenous saccades.
Our results are consistent with the idea that peripheral distractors result in a fast initial build-up of activity followed by a quick suppression (McSorley et al., 2006). For arrow and gaze cues, saccade preparation may take more time (possibly because the cues first need to be interpreted), and therefore it could be expected that automatic activation and inhibition of the saccade programme is slower as well when these cues are used as distractors (see Bompas & Sumner, 2009, for a related issue in the remote distractor effect). A second experiment was therefore performed to investigate the time-course of the different distractor effects by using a longer SOA, which should allow distractor-related neural activity more time to develop before the saccade to the target is initiated. The longer SOA is predicted to result in a deviation of trajectory away from the distractor direction for all three types of distractors.
EXPERIMENT 2
In Experiment 2, the SOA between the distractor and the target was increased to 300 ms. If the hypothesis concerning the different time-course of activation and inhibition of distractor-related activity is correct, peripheral distractors should continue to show a deviation away from the distractor at the longer SOA. For arrow cues, a reduction of the deviation towards or a deviation away is predicted. Gaze-cues are expected to show a deviation away at the longer SOA.
Method
Participants
A total of 17 participants (3 male, 14 female; their age ranging from 18 to 33 years) took part in Experiment 2. Except for the first author, none of the participants had taken part in the first experiment. These new participants were all students at Royal Holloway, University of London and received £5 or course credit for their participation. All participants gave their informed consent.
Apparatus, stimuli, procedure, and data analysis
The methods were the same as those for Experiment 1 (shown in Figure 2), except that the stimulus onset asynchrony between the distractor and the target was 300 ms. The target and distractor then remained on the screen for a 1,500-ms response interval, as in Experiment 1. Participants performed four blocks of 64 trials, which took approximately 30 minutes to complete. Before the experimental blocks, participants performed 10 practice trials. A total of 12.6% of the trials (standard deviation of 6.2%) were excluded from the data because of outlier response times, erroneous saccades, or blinks.
Results
Average response times for the different distractor conditions (peripheral, arrow, gaze, no distractor) are shown in Figure 4a. Longer response times were found for the no distractor condition, F(1, 16) = 27.29, p < .001, partial η2 = .630 (difference contrast). No significant differences in response times between the three types of distractors (peripheral, arrow, gaze) were found, F(2, 32) = 0.751, p = .48, partial η2 = .045.
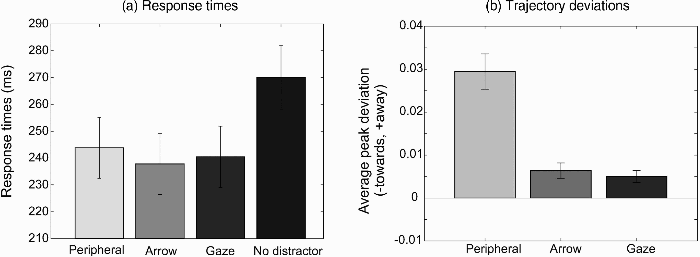
(a) Average response times for the different distractor conditions (peripheral, gaze, arrow, no distractor) in Experiment 2. (b) Average peak deviation away from the direction indicated by the distractor. Error bars show the standard error of the mean across the 17 participants.
Figure 4b shows the average peak deviation away from the direction indicated by the distractor relative to the baseline (no distractor) condition. As in Experiment 1, a large deviation away from the peripheral distractor was found, t(16) = 7.13, p < .001. Smaller, but significant deviations were found for the arrow distractors, t(16) = 3.57, p = .0026, and the gaze distractors, t(16) = 3.641, p = .0022. The deviations for the peripheral distractor were significantly larger than those for the arrow and gaze cues, F(1, 16) = 41.84, p < .001, partial η2 = .723; difference contrast. The deviations for the arrow and the gaze distractors did not differ significantly, t(16) = 0.63, p = .54.
Discussion
The time-course of the inhibition of a saccadic response following the presentation of a distractor stimulus was investigated by comparing the deviation of saccade trajectories at a long distractor to target SOA (300 ms, Experiment 2) to the deviation of those at a shorter SOA (10 ms, Experiment 1). Consistent with our interpretation that peripheral distractors lead to a faster suppression of the automatic response towards the distractor than centrally presented distractors, a large deviation away from the peripheral distractor was found at both SOAs. The deviation away at the 300-ms SOA also indicates that the peripheral distractors resulted in a sustained inhibition of activity at the distractor site. In agreement with the inhibition hypothesis, the deviations towards (arrow) and the absence of a deviation (gaze) changed into a deviation away for both types of centrally presented distractors at a longer SOA. Whereas for Experiment 1 the differences between the effects of the three types of distractors on saccade trajectories could have been related to the response time differences, such an explanation for the differences in trajectory deviations cannot be assumed for Experiment 2, as no differences in response times were found for the three types of distractors.
Consistent with previous findings (e.g., Walker, Kentridge, & Findlay, 1995), distractors presented 300 ms before target onset resulted in faster response times than when no distractor was presented, possibly because the distractor provided a warning signal for the temporal preparation of the saccade. In contrast, when the distractor was presented immediately before the target, slower response times were found in the presence of a distractor (Experiment 1), which indicates that the distractor at this temporal difference has not been processed sufficiently to serve as a warning signal. Instead it seems to act as a “remote distractor” for which slowing at short SOAs has been found before (Walker, Deubel, Schneider, & Findlay, 1997).
Although we used relatively abstract arrows (“less-than” and “greater-than” symbols: “<” and “>”), they were found to modulate saccade trajectories (see also Hermens et al., 2010). This is an unexpected result, as comparisons between gaze distractors and abstract arrows (Ricciardelli et al., 2002) and gaze and arrow cues that were more like those found in the “real world” (Kuhn & Benson, 2007; Kuhn & Kingstone, 2009) suggested that abstract arrows have much weaker effects on attention than more realistic arrows. In particular, more saccade errors have been observed for gaze cues than for abstract arrows (Ricciardelli et al., 2002), whereas more realistic arrows have been shown to result in comparable error rates to gaze cue conditions (Kuhn & Benson, 2007; Kuhn & Kingstone, 2009).
Several studies have related saccade trajectory deviations to covert shifts of spatial attention (Sheliga et al., 1994, 1995a). However, no study has directly compared the effects of social cues on saccade trajectories to those on response times, which are typically used to examine covert attention. Experiment 3 therefore compared response times and saccade trajectory deviations within the same paradigm. In addition, the experiment tested whether similar results are obtained when photos of faces (Experiment 3) are used instead of line drawings (Experiments 1 and 2). Furthermore, an additional SOA was tested to obtain a more fine-grained sampling of the time-course of inhibition for gaze cues.
EXPERIMENT 3
Experiment 3 directly compared the effects of gaze distractors on saccadic response times (assumed to measure overt attention shifts) and saccade trajectory deviations (assumed to measure saccadic response preparation, but also affected by attention) for photos of faces at three different SOAs (10 ms, 100 ms, and 300 ms).
Method
Participants
A total of 23 participants (3 males, 20 females; aged between 18 and 35 years) took part in the experiment. These participants were the first author, a graduate student in the lab (unaware of the purpose of the experiment), and 21 students at Royal Holloway, University of London. The students in the study received £5 or course credit for their participation. They all gave their informed consent for their participation. For 4 participants (1 male) the exclusion criteria (listed in the data analysis section of Experiment 1) led to the removal of more than 20% of the trials. Data of these participants were therefore removed from the data analysis. Of the remaining 19 participants, 5 had taken part in Experiment 1, and 2 had taken part in Experiment 2, whereas the others were new to the paradigm.
Stimuli
Figure 5 illustrates the stimulus sequence. The sequence started with a fixation screen showing a black-and-white photo of a face. To prevent a preview of eye gaze during the fixation period, the eyes of the face were occluded by an image of a pair of sunglasses. A fixation point was shown in between the two eyes, and two place-holders flanked the face.
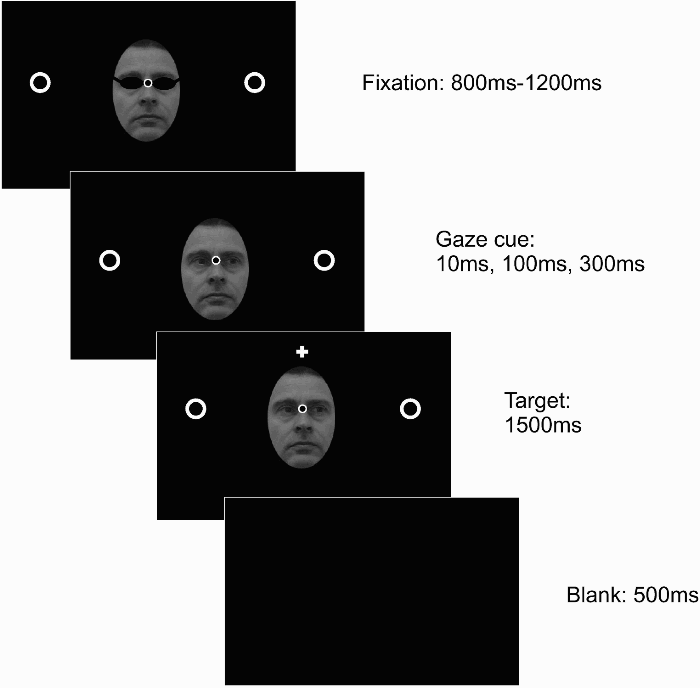
Stimulus sequence of Experiment 3. A fixation screen, showing a face with the eyes covered by sunglasses, a fixation point, and two place-holders, was presented for a random duration between 800 ms to 1,200 ms. Following this interval, the sunglasses were removed, and after 10 ms, 100 ms, or 300 ms the target was presented for 1,500 ms. A blank screen presented for 500 ms separated the trials. The face shown in this illustration (of author R.W.), was not used in the experiment, but instead four different face stimuli, from a standardized database, were used as distractor stimuli.
The face extended approximately 5° horizontally and 7° vertically. The place-holders were two white rings with a diameter of 0.6° at a distance of 7.2° from fixation. The fixation point was a black dot with a white edge measuring 0.4° in diameter. After a random interval between 800 ms and 1,200 ms, the sunglasses were removed. Following another delay of 10 ms, 100 ms, or 300 ms (the stimulus onset asynchrony, SOA), the target was presented for 1,500 ms. The target, a white plus sign of 0.4° in height and width, was presented either inside one of the place-holders (response times trials) or at a distance 6° above fixation (trials investigating saccade trajectory deviations). All stimuli, including those for the calibration of the system and drift correction, were presented on a dark background.
The faces, taken from a standardized database, were of two males and two females and were all unknown to the research participants.
Design
A 3 × 3 × 3 design was used, resulting in 27 conditions, which were repeated three times per block. The possible conditions consisted of a combination of three gaze directions (central, left, right), three target positions (left, right, above fixation), and three SOAs (10 ms, 100 ms, and 300 ms). The resulting 81 trials per block were presented in a random order. A drift correction was applied after each 9th trial. Four blocks were presented, each showing a different face (two female and two male), resulting in a total of 324 trials per participant, which took approximately 30 minutes to complete. The order of the blocks was varied across participants following a Latin square.
Procedure and apparatus
After calibration of the eye tracker, participants performed 10 practice trials and four experimental blocks. They were instructed to look at the central fixation point until the presentation of the target cross, after which they were required to shift their gaze to this peripheral target as quickly as possible, while avoiding looking at other parts of the screen first. Participants were told that a photo of a face would be presented in the background and that the gaze direction of this face would be unrelated to where the target was going to appear. Calibration was repeated before each experimental block.
Data analysis
As in Experiments 1 and 2, the data were filtered for inaccurate responses and outlier response times. A total of 4 participants, for whom more than 20% of the trials needed to be removed, were excluded from the data analysis. For the remaining 19 participants, on average 9.5% of their trials (standard deviation 9.3%) were removed from the analysis, which were mainly due to errors in the 300-ms SOA condition (18.8% for the 300-ms SOA vs. 6.1% and 3.5% for the 10-ms and 100-ms SOA, respectively).
Response times were computed for the horizontal and vertical saccades and peak deviations for the vertical saccades, following the same procedure as that in Experiments 1 and 2. Data were collapsed across the experimental blocks.
Results
Figure 6a shows the response times for horizontal saccades (connected data points on the left) and for vertical saccades (separate data points on the right). The response times for horizontal saccades were analysed in a 3 × 3 repeated measures analysis of variance (ANOVA), testing the effects of SOA (10 ms, 100 ms, 300 ms) and cue congruency (congruent, incongruent, neutral). A significant interaction between SOA and congruency was found, F(4, 72) = 6.48; p < .001, partial η2 = .27, as well as significant main effects of SOA, F(2, 36) = 65.75; p < .001, partial η2 = .79, and gaze congruency, F(2, 36) = 39.58; p < .001, partial η2 = .69. The main effect of SOA was the consequence of the slower response times for the 10-ms SOA than for the other two SOAs. When the 10-ms SOA condition was removed from the analysis, the interaction between SOA and congruency was no longer significant, F(2, 36) = 2.40, p = .11, partial η2 = .67, and neither was the main effect of SOA, F(1, 18) = 1.11, p = .31, partial η2 = .058. The effect of gaze congruency remained significant, F(2, 36) = 36.32, p < .001, partial η2 = .67. Post hoc tests demonstrated that within each SOA, the effect of gaze congruency was significant: SOA = 10 ms, F(2, 36) = 7.47, p = .002, partial η2 = .29; SOA = 100 ms, F(2, 36) = 17.44, p < .01, partial η2 = .49; SOA = 300 ms, F(2, 36) = 35.41, p < .01, partial η2 = .66.
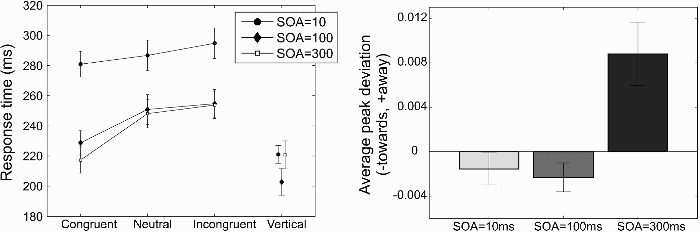
(a) Response times across 19 participants of Experiment 3. The connected data points show the average response times for horizontal saccades in which the direction of gaze indicated the target direction (“congruent”), away from it (“incongruent”), or straight ahead (“neutral”). The separate data points on the right show the response times for vertical saccades. (b) Average peak deviation away from the direction of the gaze cue at different stimulus onset asynchronies (SOAs). Error bars represent the standard error of the mean across participants.
The separate data points on the right of Figure 6a show the response times for vertical saccades. These saccades were initiated more quickly than the horizontal ones, possibly because of the appearance of a unique saccade target on vertical saccade trials. In contrast, on horizontal saccade trials, the target appeared inside a place-holder, which might have acted as a change of the stimulus rather than as the appearance of a new object. A small but significant difference between the 100-ms and the 10-ms and 300-ms SOA conditions was found: 10 ms versus 100 ms, t(18) = 4.70, p < .001; 100 ms versus 300 ms, t(18) = 3.98, p < .001, with faster response times for the 100-ms SOA. Response times for vertical saccades for the 10-ms and 300-ms SOAs did not differ significantly, t(18) = 0.047, p = .96. This means that any difference in saccade trajectory deviations for these latter two SOAs cannot be attributed to differences in response times.
Figure 6b shows the average peak deviation away relative to baseline (gaze distractor with the eyes looking straight ahead) for the three different SOAs. The deviation towards for the 10-ms SOA was not significantly different from baseline, t(18) = 1.07, p = .30. The deviation towards for the 100-ms SOA was only statistically significant in a one-tailed t test, t(18) = 1.78, p = .046 (one-tailed). At an SOA of 300 ms, a significant deviation away from the gaze direction was found, t(18) = 3.08, p = .0065. A direct comparison of the 10-ms and the 100-ms SOA revealed no significant difference in saccade trajectory deviations, t(18) = 0.69, p = .50.
To compare the saccade trajectory deviations for photos of faces (Experiment 3) and schematic faces (Experiments 1 and 2), data from participants who also took part in Experiments 1 or 2 were removed from the data set of Experiment 3, so that a between-subjects comparison could be made between each pair of experiments. This removal resulted in a comparison of 18 participants of Experiment 1 with 15 participants of Experiment 3 and in a comparison of 17 participants of Experiment 2 with 17 participants of Experiment 3. The analysis revealed no significant differences in saccade trajectory deviations for either SOA: SOA = 10 ms (Experiment 1 vs. Experiment 3), t(31) = 0.052, p = .959; SOA = 300 ms (Experiment 2 vs. Experiment 3), t(32) = 1.24, p = .23.
Discussion
The gaze distractors of Experiment 3 had a robust effect on saccadic reaction time, even though participants were informed that the gaze cues were nonpredictive of the target location. These results support those from earlier studies, in which manual and saccadic response times were found to be faster in the presence of congruent gaze cues than in the presence of incongruent ones, both when they were unpredictive (Bayliss & Tipper, 2006; Driver et al., 1999; Friesen & Kingstone, 2003; Friesen et al., 2005; Quadflieg et al., 2004) and when they were counterpredictive of the target location (Driver et al., 1999; Friesen et al., 2004; Tipples, 2008).
A dissociation between the effects on saccadic reaction times and saccade trajectory deviations was found. The trajectory deviations confirmed the results of Experiments 1 and 2. At short SOAs (10 ms and 100 ms), saccade trajectories did not significantly deviate from those in the baseline condition (eye-gaze straight ahead). At the longer SOA (300 ms), a significant deviation away was found. These findings, in combination with those of Experiments 1 and 2, suggest that the suppression of the saccade programme towards gaze cues takes time to build up. In contrast, effects of the gaze cue on response times were found across all SOAs, suggesting that covert attention (measured by response times) is sustained across a longer range of SOAs than response inhibition (measured by trajectory deviations).
The comparison between Experiment 3 and Experiments 1 and 2 showed no difference between trajectory deviations induced by line-drawings and photos of faces. This finding confirms that gaze-cueing effects of schematic faces are at least as strong as those induced by real faces (see also Hietanen & Leppänen, 2003). It also suggests that the effects do not depend on whether place-holders are used (Experiment 3 used place-holders, whereas Experiments 1 and 2 did not present any objects in the periphery for the gaze condition), which suggests that the effects of gaze cues are equally strong when the perceived gaze is directed to an object (Experiment 3) as when it is directed to an empty region of the screen or a location outside the visual display (Experiments 1 and 2). Moreover, it also indicates that the particular choice of the baseline condition (no onset of a distractor in Experiments 1 and 2 versus the onset of a gaze directed straight ahead in Experiment 3) did not play a role.
The experiments so far demonstrated large differences between peripheral distractors and centrally presented arrow and gaze distractors. However, because the peripheral distractor, consisting of a large filled square, was relatively salient compared to the central distractors consisting of either thin lines (arrow) or small circles (gaze), the strong effects on trajectory deviations from peripheral distractors compared to the central distractors could have been due to low-level factors such as stimulus size and contrast. In Experiment 4, we therefore investigated the importance of such spatial properties, by varying these aspects across different peripheral distractors.
EXPERIMENT 4
Experiment 4 served as a control experiment to test whether the differences between the peripheral and the central distractors found so far can be attributed to differences in the size and contrast of the stimuli used as distractors.
Three types of peripheral distractors were compared. The influence of the filled square, as used in Experiments 1 and 2, was compared to the influence of two other distractors that more closely resembled the size and surface area of the central distractors of Experiments 1 and 2. These were the outline of the square distractor, with features similar to those of the arrow cue, and a small filled square, which was more visually similar to the gaze cue (pupils of the eye).
Method
Participants
A total of 19 participants took part in Experiment 4. Except for the first author, none of the participants had participated in the previous experiments. These participants were all students and received £5 or course credit for their participation. All provided written consent. Data of 2 participants were removed from the data analysis because of large numbers of incorrect saccades (1 participant) or problems with the eye movement recordings (another participant), leaving data of 17 participants for the data analysis.
Stimuli
The stimulus sequence was the same as for Experiment 2 (i.e., an SOA of 300 ms was used between the distractor and the target). The arrow and the gaze distractors were replaced by two peripheral distractors (see Figure 7a), of which the first was an outline version of the peripheral distractor (line width: 1 pixel ≈ 0.038°) and the second a filled square of half the size (height = width = 0.8°).
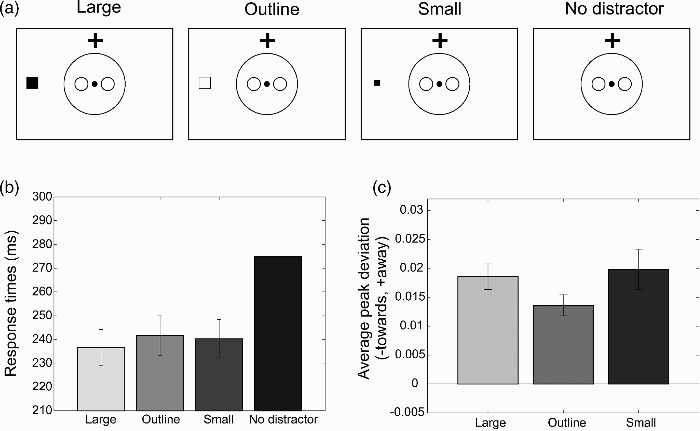
(a) Illustration of the different types of distractors used in Experiment 4 (“Large”, “Outline”, “Small”, and “No distractor”). (b) Response times in Experiment 4 for the different distractor conditions. (c) Peak deviation away from (positive values) or towards (negative values) the distractor location relative to baseline (“no distractor”) for the three types of distractor. Error bars show the standard error of the mean across participants.
Apparatus, design, procedure, and data analysis
Apparatus and design were the same as used in Experiment 2. The same exclusion criteria as those in the previous experiments led to the removal of, on average, 9.2% of the trials from the data of the remaining 17 participants in the analysis.
Results
Figure 7b shows the mean reaction times for each of the distractor conditions (large square, outline of the square, small square, no distractor). As in Experiment 2, which used the same SOA, significantly slower response times were found for the no-distractor condition, F(1, 16) = 32.62, p < .001, partial η2 = .671. No significant differences were found for the response times across the three distractors, F(2, 32) = 2.10, p = .14, partial η2 = .12.
Figure 7c shows the average peak deviation for the three types of distractors relative to baseline (the no-distractor condition). For all three distractors, large, significant deviations away from the distractor location were found: large filled square, t(16) = 8.12, p < .001; outline of the square, t(16) = 7.57, p < .001; small filled square, t(7) = 5.65, p < .001. The deviations for the outline square were significantly smaller than those of the filled small and large squares, F(1, 16) = 7.15, p = .017, partial η2 = .31. The deviations for the two filled squares did not differ significantly, t(16) = 0.42, p = .68.
Discussion
All three peripheral distractors produced significant deviations of trajectories away from the distractor location irrespective of the size and contrast of the distractor. Although significantly smaller deviations were found for the outline square, the modulation of saccade trajectory deviations for this distractor was much more similar to that of the large filled square than that observed for the arrow distractors of Experiment 2. This means that the differences in the effects of the central and peripheral cues of Experiment 2 may not be attributed to low-level stimulus features such as contrast or stimulus size.
Experiment 4 showed that the stimulus properties of the distractor only marginally influenced trajectory deviations. This means that, in contrast with what might be intuitively expected, larger and higher contrast distractor stimuli do not necessarily result in a stronger activation of the saccade motor map, especially for distractors that are presented remotely from the saccade target (McSorley, Haggard, & Walker, 2005, 2009; Van der Stigchel, Meeter, & Theeuwes, 2007a; Van der Stigchel & Theeuwes, 2005). In contrast, stimulus properties of distractors that are presented near the target have been shown to strongly influence saccade target selection (Findlay, 1982; Findlay, Brogan, & Wenban-Smith, 1993; Findlay & Gilchrist, 1997). Moreover, it also contrasts with the finding that the strength of the target-related signal influences its effect on saccade trajectories. In an experiment in which saccades towards the target (“prosaccades”) were compared to saccades away (“antisaccades”) and memory-guided saccades (Van Zoest, Van der Stigchel, & Barton, 2008), distractors more strongly affected saccade trajectories when the target signal was weak (antisaccades and memory-guided saccades) than when the target signal was strong (prosaccades).
GENERAL DISCUSSION
The present study investigated the automatic preparation of a saccadic response following the presentation of centrally presented arrow and gaze distractors and contrasted this with the effects of a peripheral distractor. Automatic oculomotor preparation was measured by comparing the trajectory deviations of saccades made to targets in the presence, or absence, of a competing distractor. The effects of centrally presented gaze and arrow distractors differed from those of peripheral visual onsets, which are usually regarded as the example type of stimulus inducing an automatic shift of attention (Müller & Rabbitt, 1989; Theeuwes et al., 1999; Yantis & Jonides, 1984). Interestingly, gaze and arrow distractors influenced saccade trajectories similarly, suggesting that gaze-cues are like other centrally presented cues in their tendency to induce the automatic preparation of a saccadic response. These findings are consistent with previous studies demonstrating similar effects of gaze and arrow cues on the number and direction of erroneous saccades (Kuhn & Benson, 2007; Kuhn & Kingstone, 2009) and response times (Tipples, 2008).
Experiments 1 and 2 examined the time-course of the effects of peripheral and central distractors. In these experiments, saccade trajectory deviations served as a proxy of oculomotor response preparation (McPeek, 2006) and distractor-related inhibition (Sheliga et al., 1994, 1995; Van der Stigchel et al., 2007b). Trajectory deviations away from the peripheral distractor were observed at a short SOA (10 ms) and at the longer SOA of 300 ms. The results therefore suggest that peripheral distractors result in a strong, fast-acting, sustained inhibition of distractor-related activity in the saccade motor map (Figure 1). In contrast, the build-up of inhibition (and the related deviation of saccade trajectories) with centrally presented distractors appears to evolve more slowly. Whereas the two types of central distractors resulted in similar trajectory deviations, small differences between the arrow and the gaze distractor were observed. For the arrow distractor, a small but significant deviation towards the arrow direction was obtained at the shorter SOA, whereas no such trajectory modulation was obtained for the gaze distractor. At the longer SOA, however, trajectory deviations did not differ significantly for the two types of central cue and were away from the distractor.
Some of the differences between peripheral and central distractors at the short SOA (Experiment 1) could potentially be attributed to differences in response times. At the 10-ms SOA, the central distractor conditions showed significantly shorter response times than the peripheral distractor condition. Previously, it has been shown that trajectory deviations are affected by response times (e.g., McSorley et al., 2006). Why this might be the case is illustrated in Figure 1. If the activation at the target site reaches the threshold to initiate the saccade early (for example, at a stage indicated by Figure 1C rather than Figure 1D), the activation at the distractor site will be relatively high (cf., Figure 1C) compared to when more time is needed for target-related activity to reach threshold. In the former case, the saccade trajectory will deviate in the direction of the distractor, whereas for more slowly initiated saccades it will deviate away (Figure 1D). There are, however, a number of reasons why a simple reaction time account is not likely to present the whole explanation for the differences between central and peripheral distractors. First, the differences in response times in Experiment 1 were very small, whereas large differences in trajectory deviations were found between the central and peripheral distractors. Second, response times were not different for arrow and gaze distractors at the 10-ms SOA. However, significant differences in trajectory deviations were found between these distractor types. Third, in Experiment 2, the response times did not differ significantly across the three distractor conditions. However, clear and significant differences in trajectory deviations were observed.
There are two possible explanations for the differences in trajectory deviations between central and peripheral distractors. First, the central distractors might result in a weaker activation of the oculomotor map encoding responses in the direction of the distractor. As a consequence, the suppression of the distractor-related activity would require less inhibition than for peripheral distractors, which produce a stronger initial activation (Ludwig & Gilchrist, 2003). This would explain why trajectory deviations were smaller for the two types of central distractors. Second, the time-course of activation and inhibition may be different for the different types of distractors. For peripheral distractors, a strong, but short-lived activation might have occurred, followed by an immediate and strong suppression below baseline. Such a pattern of activation and inhibition would be in agreement with the large deviation of saccade trajectories away from the distractor both at short and at long SOAs. For centrally presented distractors, activation and the related suppression of activity may take more time to build up, resulting in a deviation towards (or zero deviations) at the early, 10-ms SOA and a deviation away for the longer, 300-ms SOA. The proposed difference in the time-course of inhibition for central and peripheral distractors is consistent with studies showing that inhibition of return (IOR) for gaze distractors does not occur until more than 2,000 ms after cue onset, whereas IOR for peripheral onsets occurs much earlier, at SOAs around 200 ms to 1,000 ms (Frischen, Smilek, Eastwood, & Tipper, 2007b; Frischen & Tipper, 2004). If the time-course hypothesis is correct, deviations away from central distractors are predicted to increase at SOAs beyond 300 ms.
The main focus of interest here was the modulation of saccade trajectories by task-irrelevant distractors, which could indicate the direction of attention (Sheliga et al., 1994; Sheliga, Riggio, & Rizzolatti, 1995b; Van der Stigchel et al., 2007b). More typically, however, the direction of covert attention is measured by examining differences in response times made to targets in the presence of spatially congruent and incongruent cues. Experiment 3 provided a direct comparison of the two possible measures of attention (response times and saccade trajectory modulations) for eye-gaze stimuli. Effects of the spatial congruency of the cue were found on response times for all SOAs. However, significant effects of cues on saccade trajectory deviations were found only for the longer SOA. This suggests that cues influence saccade trajectories across a smaller range of SOAs than response times. Earlier comparisons of the two measures, using inhibition of return (IOR; Godijn & Theeuwes, 2004; Theeuwes & Van der Stigchel, 2009) and masked priming with briefly presented arrow cues (Hermens et al., 2010), provide support for this difference in the time-course. In IOR, saccade trajectory modulations were found only for short cue-to-target intervals, whereas response time inhibitory effects were only obtained for longer cue-to-target intervals (Godijn & Theeuwes, 2004; Theeuwes & Van der Stigchel, 2009). This suggests that saccade trajectory effects peak at an early SOA, whereas the effects on response times peak at a later SOA. Similarly, masked, but not always invisible, arrow cues (“primes”) resulted in faster response times when the direction of the prime and that of the target arrow were congruent. Such a facilitation effect only occurred for a short interval between the prime and the target. For the longer interval, the congruency effect reversed, and faster response times were found when the prime arrow pointed in the opposite direction of the target. Saccade trajectories, however, showed a deviation away from the arrow-cue for both interval durations. As for IOR and the present findings, the masked priming results suggest that inhibition involved in saccade trajectory modulations acts at shorter SOAs than that involved in response times, resulting in an earlier peak of maximum inhibition for saccade deviations than for response times.
Our findings have shown that the influence of task-irrelevant eye-gaze and arrow distractors is different to that produced by peripheral visual onsets. Such findings are in accordance with earlier observations by Bayliss et al. (2005), who demonstrated similar gender differences for gaze and arrow cues on manual response times, whereas peripheral onsets resulted in analogous cueing effects across the two genders. Whereas they relied on an indirect comparison across groups of participants, our study demonstrated similar effects for arrow and gaze cues, distinct from those from peripheral onsets, in a direct comparison within the same group of participants.
A possible confounding factor in making a direct comparison between arrow and gaze cues with peripheral onsets is the level of salience of the three types of stimuli. Because it is difficult to equate the salience of the different types of stimuli, a different approach was taken here to control for such factors. In a fourth experiment, the role of stimulus parameters, such as the luminance and the stimulus contrast, was investigated by comparing the effects of such stimulus properties for different peripheral distractors. The results indicated that the effects of peripheral distractors are largely independent of the stimulus parameters such as stimulus size and contrast. However, small differences could be observed between the outline stimulus, which served as the control for the arrow cue, and the large filled square stimulus, which was used as the peripheral distractor in Experiments 1 and 2. However, it is unlikely that this small difference for the two types of peripheral distractors accounts for the large difference between the arrow and the peripheral distractor of Experiments 1 and 2.
Our study adds to the increasing number of behavioural studies that have reported similar effects of arrow and gaze cues (e.g., Bayliss et al., 2005; Kuhn & Kingstone, 2009; Nummenmaa & Hietanen, 2009; Tipples, 2008). By contrast, some earlier studies showed that the effects of eye-gaze and arrow-cues can be dissociated. For example, Friesen et al. (2004) initially showed that counterpredictive eye-gaze cues, but not arrows, produced a shift of attention in the gazed-at direction. However, later studies (Kuhn & Kingstone, 2009; Tipples, 2008) demonstrated similar cueing effects for counterpredive arrow and gaze cues. A related pattern of similarities and differences between eye-gaze and arrow-cues has been found in neuroimaging studies. For example, Hietanen and colleagues (Hietanen, Nummenmaa, Nyman, Parkkola, & Hämäläinen, 2006) showed that a larger network of brain areas responded to arrow cues than to gaze cues, with arrow cues also activating frontal and supplementary eye fields. Their data were interpreted as evidence that cueing by arrows relies to a larger extent on voluntary shifts of attention, in contrast to gaze cues, which appear to activate a more reflexive mechanism. Interestingly, the coordinates reported for the frontal and parietal regions activated by gaze and arrow cues included areas associated with shifts of overt and covert attention (Corbetta, 1998). Whereas Hietanen et al. found evidence for differences between brain networks responding to arrow and gaze cues, Tipper, Handy, Giesbrecht, and Kingstone (2008) showed an involvement of a similar fronto-parietal network with both arrow and gaze cues, although greater brain responses were observed for the gaze cue condition. They attributed the discrepancy between their finding and the findings of Hietanen et al. to the use of a more sensitive event-related design instead of a blocked design as used in the earlier studies.
A recent meta-analysis of imaging studies of saccades, covert orienting, and the perception of eye-gaze has demonstrated the involvement of similar fronto-parietal brain areas in gaze perception and reflexive and voluntary orienting (Grosbras, Laird, & Paus, 2005). Interestingly, the greatest degree of overlap of the activation patterns was found when gaze perception was compared with reflexive, visually triggered orienting of attention. However, some differences between the networks involved in gaze perception and reflexive orienting have also been observed, suggesting that similar but not identical brain networks are involved.
The present study adds to the debate over the reflexive nature of orienting produced by eye-gaze and arrow cues. Both types of cue lead to saccade trajectory deviations away from the cued location, indicative of an automatic orienting response, but only at the longer (300-ms) SOA. However, there is evidence to suggest that, at least for gaze cues, these orienting responses are not entirely automatic. Itier and colleagues (Itier, Villate, & Ryan, 2007) showed that the first saccade towards a face stimulus is influenced by task demands. The first saccade landed more often on the eye region when a gaze judgement task had to be performed than when a head-orientation judgement was made, demonstrating that attention shifts following gaze cues are susceptible to top-down influences and therefore may not reflect a fully reflexive process (see also Itier & Batty, 2009).
To conclude, whereas peripheral distractors and centrally presented gaze and arrow distractors all appear to result in the automatic programming of a saccade in the direction of the distractor, the effects of peripheral distractors were quantitatively and qualitatively different from those of centrally presented arrow and gaze distractors, which affected saccade trajectories similarly. These effects may not be attributed to differences in stimulus properties such as size and contrast of the peripheral cues.