
Abstract
This study investigates to what extent visual perception integrity is necessary for visual mental imagery. Sixteen low-vision participants with severe peripheral visual field loss, 16 with severe central field loss, 6 left brain-damaged patients with right homonymous hemianopia, 6 right brain-damaged patients with left homonymous hemianopia, and 16 normally sighted controls performed perceptual and imagery tasks using colours, faces, and spatial relationships. Results showed that (a) the perceptual and mental imagery disorders vary according to the type of visual field loss, (b) hemianopics had no more difficulties imagining spatial stimuli in their contralesional hemispace than in their ipsilesional one, and (c) the only hemianopic participant to have perceptual and mental imagery impairments suffered from attentional deficits. Results suggest that (a) visual memory is not definitively established, but rather needs perceptual practice to be maintained, and (b) that visual mental imagery may involve some of the attentional–exploratory mechanisms that are employed in visual behaviour.
Keywords
Data available on the cognitive abilities of the visually impaired mainly derive from studies conducted to assess the consequences of blindness. Several authors agree on the fact that the mental images of blind people partly share the same structural and functional characteristics as those of sighted individuals, but with specific differences (for a review see Dulin, Hatwell, Pylyshyn, & Chokron, 2008). Early (before the age of three) blind individuals can generate and process visuospatial images but they do so by organizing haptic, vestibular, and verbal spatial information into a mental image (Dulin, 2008; Dulin & Hatwell, 2006; Hollins, 1986; Millar, 1994; Vecchi, Philips, & Cornoldi, 2001). In addition, a number of authors demonstrated that congenitally (from birth) and early blind individuals had specific difficulties only in certain visuospatial tasks (Gaunet & Thinus-Blanc, 1996).
As one might expect, there are differences in the cognitive abilities of blind and of visually impaired individuals (Cattaneo et al., 2008). Studies have suggested that the visually impaired may perform better than their visual acuity would suggest (Blanco & Traviesco, 2003). For example, Passini, Proulx, and Raiwille (1990) measured the spatiocognitive abilities of sighted, blindfolded sighted, congenitally blind, late blind, and visually impaired individuals in a series of spatial tasks. Participants were required to learn a complex maze and subsequently perform a series of different tests that measured their acquired knowledge (e.g., inverting a route, combining routes, learning models, choosing shortcuts, performing mental rotations). Visually impaired participants were able to understand the geometric features similarly to sighted individuals, although they encountered selective difficulties due to distance cues and visual reference points that were not accessible to them.
The fact that visually impaired individuals could perform better than totally blind individuals in a variety of spatial tasks should not lead us to forget the existence of different types of visual impairments regarding lesion location along the visual system. Indeed, at the first stage of visual perception, the distribution of the rods and cones in the retina highly influences our perception (Bullier, 1998; Delorme & Flückiger, 2003). The rods, which are numerous and found in the periphery of the retina, enable night vision, rough shape detection, and detection of movement. The cones are responsible for daytime vision, colour, and detail perception, but are principally found in the retina's central part called the fovea (found at the macula of the eye; Bullier, 1998). The macula of the human eye, about 6 mm in diameter, covers the central 10° of the visual angle (Jackson, Owsley, & Curcio, 2002). Therefore, macular vision (or central vision) enables the sharp perception of shapes and colours, whereas the visual inputs coming from peripheral regions of the retina (corresponding to the greater part of the visual field) play an essential part in motion detection, spatial orientation, and night vision (Post & Johnson, 1986; Tarita-Nistor, González, Markowitz, Lillakas, & Steinbach, 2008).
It has been shown, however, that visually impaired individuals with central scotoma can use peripheral vision to recognize colours, faces, objects, and natural scenes (Boucart, Despretz, Hladiuk, & Desmettre, 2008; Thorpe, Gegenfurtner, Fabre-Thorpe, & Bülthoff, 2001). Although psychophysical studies in colour perception and eccentricity were mainly concerned with colour sensitivity in relation to the distribution of red, green, and blue cones in the retina, some authors suggested that colour perception at large eccentricities is based on postreceptor (cortical) processes as it is better than what should be expected from the distribution of red, green, and blue cones in the retina, but all showed an accuracy decrease as eccentricity increased (Newton & Eskew, 2003; Sakurai, Ayama, & Kumagai, 2003).
Tejeria, Harper, Artes, and Dickinson (2002) explored the relation between performance on tasks of familiar face recognition and face expression difference discrimination with both perceived disability in face recognition and clinical measures of visual function in 30 subjects with central scotoma. They found that distance and reading visual acuity were closely associated with measured task performance in all the tasks. Therefore, it seems that despite several studies suggesting that individuals with macular scotoma can use eccentric viewing strategies to improve their performance in tasks that are dependent on the integrity of central vision, these individuals remain significantly impaired in all these tasks (Fletcher, Schuchard, & Watson 1999; Schuchard, Naseer, & de Castro, 1999; Sunness, Rubin, Zuckerbrod, Applegate, 2008; Trauzettel-Klosinski & Tornow, 1996).
Very few studies have been concerned with the effects of central versus peripheral visual loss on spatial performance. Millar and Al-Attar (2005) investigated how vision affects haptic performance when task-relevant visual cues are reduced or excluded. In this study, participants remembered the spatial location of six landmarks that were explored by touch in a tactile map. The authors used specially designed spectacles that simulate residual peripheral vision, tunnel vision, diffuse light perception (which provides no inputs for shape or spatial features), and total blindness. Results showed that (a) peripheral and tunnel vision were less accurate than full vision, but significantly more accurate than touch with diffuse light perception and touch alone, and (b) that peripheral and tunnel vision differed in location errors. According to the authors, the fact that peripheral and central vision differed in the production of location errors was potentially consistent with the fact that the two forms of residual vision provide somewhat different spatial information.
Other researchers observed how specific visual inputs relate to complex cognitive performance by investigating the effects of visual field loss due to occipital damage on mental imagery ability. Butter, Kosslyn, Mijovic-Prelec, and Riffle (1997) proposed the existence of a visual short-term memory deficit in the hemianopic field contralateral to the lesion. According to Butter and his coworkers, these data support the hypothesis that (a) the occipital cortex is needed for the short-term memory representations supporting the imagery task, and (b) visual mental images were displayed on a visual buffer consisting of topographically organized areas in the occipital lobe. Aiming to confirm that mental images occur in a spatially mapped (i.e., analogue, or array-format) representational medium as initially proposed by Kosslyn (1978), Kosslyn and his collaborators reported numerous neuroimaging studies that support the claim of occipital involvement in visual imagery (Kosslyn et al., 1993; Kosslyn & Thompson, 2003; Kosslyn, Thompson, & Ganis, 2006). However, as reviewed and discussed by Dulin et al. (2008), cases of cortically blind individuals with visual imagery preservation are not rare in the literature (Anton, 1899; Chatterjee & Southwood, 1995; Goldenberg, Mullbacher, & Nowak, 1995), and there is still a discussion about the possible dissociation between perceptual and representational deficits in brain-damaged patients.
The present study investigates how specific visual inputs relate to complex cognitive performance. In order to investigate the effects of visual field loss (due to visual or neurovisual disorders) on colours, faces, and visuospatial imagery abilities, we contrasted normally sighted individuals with low-vision participants suffering from different types of visual field loss: 16 visually impaired individuals with severe peripheral visual field loss (due to a retinitis pigmentosa), 16 with severe central visual field loss (due to a Stargardt dystrophy), and 12 with a visual hemifield loss (6 right and 6 left hemianopic patients) due to brain damage restricted to the occipital cortex of one hemisphere. We tested hemianopic participants because they had a degree of visual field loss found between that of participants with retinitis pigmentosa and that of participants with Stargardt dystrophy. All the participants completed a modified version of a battery of tests assessing visual and imagery abilities (Bourlon et al., 2009). The present version of the battery aimed to jointly test for visual perception and visual mental imagery by asking participants to perform perceptual and imagery tasks using colours, faces, and spatial relationships. In accordance with previous studies and with the organization of the visual system from the eye to the visual occipital cortex, we suggested that (a) retinal deficits of central vision led to poor performance on the colours and faces tests in perception and imagery conditions, (b) retinal deficits of peripheral vision led to deficits on faces and spatial tasks in perception and imagery conditions, and (c) hemianopics performed well on all tests. Overall, we inferred that deficits of visual imagery tended to mirror impairments of perception in patients with visual field loss, indicating that perceptual practice is necessary to maintain visual imagery.
Experimental Study
The tasks, goals, and procedures were explained before each experimental task. The experiments took place in a quiet room, with the participant sitting opposite the experimenter, and was conducted over three sessions. All individuals completed the inclusion tests (e.g., visual acuity, manual preference) on the first day, the mental imagery tasks on the second day, and all the perceptual tasks on the third day. The order of tasks was similar for all participants, and presentation duration and response time were not restricted. In accordance with French legislation, each participant (individuals with visual or neurovisual deficit and controls) completed an informed consent form before taking part in this study. All the participants were autonomous in their everyday life.
Experiment 1: Visual Perception
Method
Participants
Two groups of low-vision participants with retinal damage were compared to a control group of normally sighted individuals. Sixteen participants with retinitis pigmentosa (RP; 8 females, 16 right-handers, mean age ± standard deviation, SD = 39.1 ± 8.2 years, disease duration = 19.6 ± 5.3 years) were recruited to assess the effect of a severe peripheral visual field loss. Retinitis pigmentosa refers to a hereditary retinal degeneration with a prevalence rate of approximately 1 per 4,000. Characteristic symptoms include nyctalopia, impaired dark adaptation, and a progressive peripheral visual field loss that often leads to legal blindness. Advanced retinitis pigmentosa is characterized by a visual field of less than 20°, but there is often well-preserved central vision. Care was taken to include participants with severe peripheral visual field loss but a conserved central vision (Figure 1) despite visual acuity (corrected vision) below 4/10.
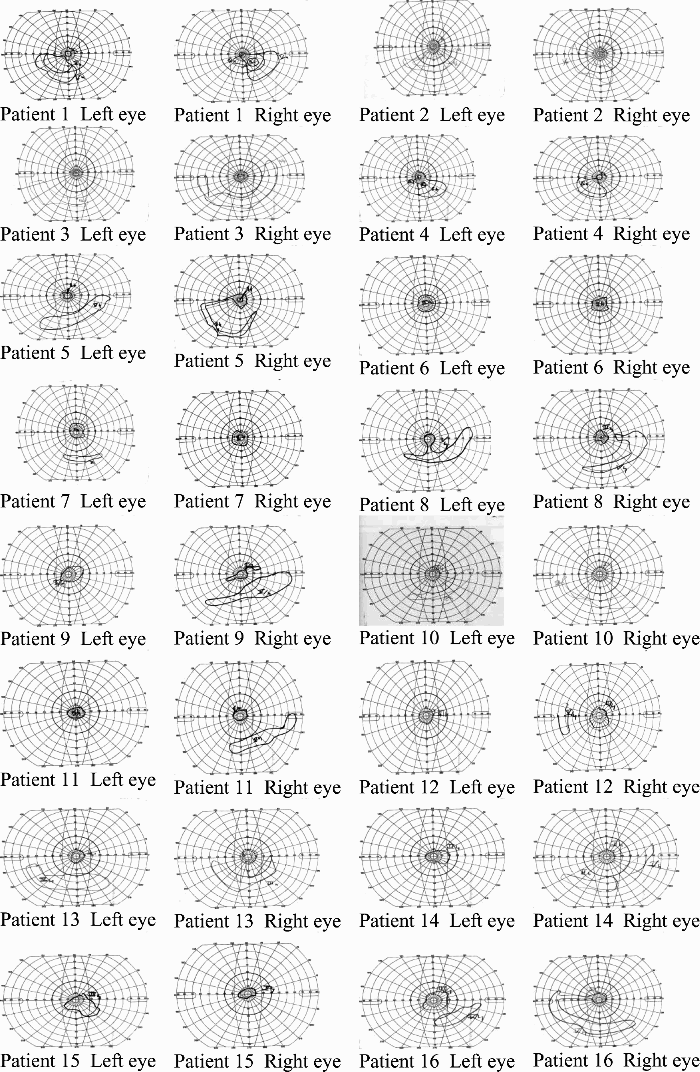
Kinetic visual fields in right and left eyes of visually impaired patients with retinitis pigmentosa.
Sixteen participants suffering from Stargardt dystrophy (SD; 8 females, mean age ± SD = 41.4 ± 9.4 years, disease duration = 21.6 ± 8.7 years) were recruited to assess the effect of a central visual field loss. This disease is one of the most common juvenile macular degeneration disorders and has an occurrence rate of 1 per 20,000 children over the age of six. In contrast to retinitis pigmentosa, Stargardt dystrophy affects the macula and surrounding retina. Thus, damage to the macula results in loss of visual acuity or sharpness of vision, decreased colour vision, and central scotoma. Care was taken to include individuals with absolute central scotoma, a preserved peripheral vision, and a visual acuity (corrected vision) of ≤1/20. All the participants in these two groups (RP and SD) had an ophthalmologic diagnosis of visual impairment due to retinitis pigmentosa or Stargardt dystrophy without glaucoma and cataract or any neurologic diseases that could affect vision or the capacity to perform the tests. Moreover, visual fields were obtained for each eye using a Goldmann perimeter with II-2-e, II-4-e, III-4-e, IV-4-e, and V-4-e test targets. The targets were moved from nonseeing to seeing regions. All of the above targets were not necessarily used on each participant.
A third group of 16 sighted participants (Control 1; 8 females, 16 right-handers, mean age ± SD = 38.8 ± 10.2 years) was also recruited. They had a visual acuity (normal or corrected-to-normal vision) superior to 7/10 and a normal visual field. The visual acuity of all the participants was measured (Essilor lab test) before starting the experimental procedure. Demographic and clinical data are provided in Table 1.
Demographic and clinical data
M: male; F: female; CS: central scotoma; PS: peripheral scotoma.
Mean for the two eyes.
For two eyes.
One-way analyses of variance (ANOVAs) performed for each measure revealed that these three groups were matched for age, gender, and educational level. However, as expected, the Control 1 group (M = .94; SD = .08) had a better visual acuity, F(1, 30) = 1,059.444, p < .01, than the RP (M = .15; SD = .04) and the SD groups, F(1, 30) = 1,581.346, p < .01. We observed as well that the RP group's visual acuity was better, F(1, 30) = 40.275, p < .01, than that of the SD group (M = .04; SD = .01).
Two groups of low-vision participants with damage restricted to the occipital cortex of one hemisphere were compared to another control group of normally sighted individuals. Six participants suffering from a complete right homonymous hemianopia (RHH; 3 females, 3 left-handers, mean age = 64.2 ± 8.1 years) and 6 participants suffering from a complete left homonymous hemianopia (LHH; 3 females, 3 left-handers, mean age 66.6 ± 12.7 years) were recruited to assess the effect of a visual hemifield loss. The performances of these participants were compared to that of 12 normally sighted participants (Control 2; 6 females, 6 left-handers, mean age 59.8 ± 9.6 years). The sighted participants tested in Control 1 and Control 2 groups were different. Each participant of the RHH, LHH, and Control 2 groups received an assessment of visual acuity (Essilor lab test), manual preference questionnaire (Dellatolas et al., 1988), verbal digit span (Wechsler Adult Intelligence Scale–Third Edition; WAIS–III), and oral comprehension (Blanche Ducarne de Ribaucourt inventory, 1988). The Mini Mental State Examination (MMSE; Folstein, Folstein, & McHugh, 1975) was also administered. The demographic and clinical characteristics of these three groups are presented in Tables 2 and 3 and Figure 2 (for detailed presentation of RHH and LHH hemianopic participants).
Demographic and clinical characteristics of the RHH, LHH, and matched control groups
Note: F: female; M: male. RHH = right homonymous hemianopics; LHH = left homonymous hemianopics; Control 2 = matched control group. MMSE = Mini-Mental State Examination. Standard deviations are indicated in parentheses.
Detailed clinical characteristics of patients suffering from either a left or a right hemianopia
Note: M: male; F: female; R: right-handed; L: left-handed: I: ischemia; H: haemorrhage; PCA: posterior cerebral artery; occ: occipital; temp: temporal; inf: inferior; int: internal; post: posterior; junc: junction.
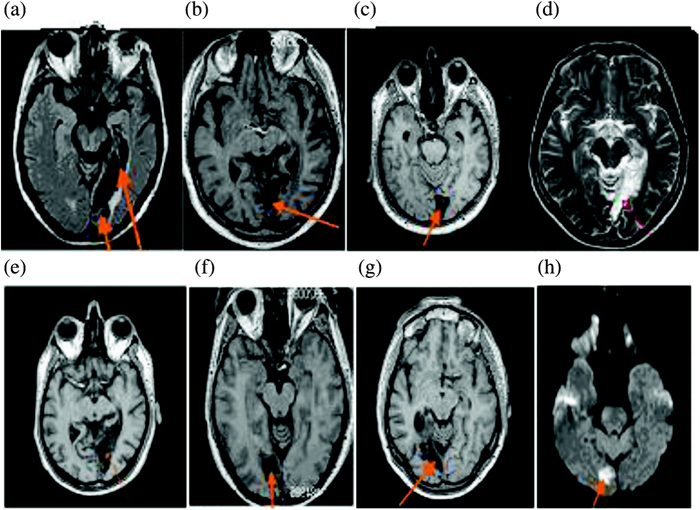
Slices from the magnetic resonance imaging (MRI) scan for patients (a) G.L., (b) M.C., (c) F.D., (d) G.S., (e) M.L., (f) C.G., (g) S.A., and (h) F.S. T1-weighted MRI scan. Transversal section. To view a colour version of this figure, please see the online issue of the Journal.
One-way ANOVAs performed for each of the above-mentioned measures revealed that the three groups were matched for age, gender, educational level, manual preference, visual acuity, verbal digit span, and oral comprehension. Significant group effects were observed for the MMSE total score, F(2, 21) = 6.32; p < .01. LHH participants (MMSE score = 26.66 ± 2.58) had lower scores than both of the other groups (Controls 2: MMSE score = 29.16 ± 1.02; RHH participants: MMSE score = 28.66 ± .81; post hoc analyses, least significant difference, LSD tests, p < .05). Detailed examination of the MMSE data revealed that the degraded skills of the LHH group resulted from lower scores in the Attention subtest of the MMSE. Thus, the observed defect in the LHH group may be related to visual impairment instead of dementia. One LHH participant, F.D., appeared to be the outlier in the group and probably responsible for the group effect regarding the Attention subtest score. Indeed, when his data were excluded from analyses, the significant group effect was no longer observed on the Attention subtest, F(1, 15) = 2.52, p = .18. This participant was the only one in which attention disorders were diagnosed in our study as well as in previous tests.
Material
The visual perception experiment consisted of four tasks using stimuli presented aligned to each participant's midsagittal plane. Participants could use the visual strategies they wanted (gaze displacements, as well as head, upper, or even entire body exploratory behaviours). RP individuals were asked to use only their central vision to analyse stimuli and could not approach the stimuli at less than 50 cm. This distance, selected during pretests, enabled them to see the stimuli (similar to those presented in this study) thanks only to the acuity of their central vision (the acuity of their peripheral vision being too weak). SD participants were asked to use their preferred retinal location, whereas the RHH and LHH groups could use their remaining central and peripheral vision.
Colour-Naming Task
In this task (Bartolomeo, Bachoud-Lévi, & Denes, 1997), the participants were required to name the colour of 11 boards (14.8 × 10.5 cm, portrait orientation) of different colours (beige, black, brown, green, grey, maroon, orange, pink, red, yellow, and white) presented individually. One point was given for each correct denomination, which made a total of 11 points.
Colour Hue Comparison Task
Eighteen different boards (14.8 × 10.5 cm, portrait orientation) were successively presented by pairs of similar colour (black, brown, green, grey, orange, pink, red, yellow, and white) but in two different hues. Participants were asked to verbally indicate which of the two boards was the brightest. One point was given for each correct response for a possible total of 9 points.
Famous-Face Recognition Task
In this task (Behrmann, Moscovitch, & Winocur, 1994), twenty colour photos (6 × 6 cm) of French and internationally famous people's faces (actors/actresses, singers, humorists, politicians, and athletes) were successively presented. Individuals were asked to either identify each person or to indicate why he or she is famous. One point was given for each correct response for a possible total of 20 points.
Direction Judgement Task
In this task (Butter et al., 1997; Finke & Pinker, 1982), 32 pages (21 × 29.7 cm, landscape orientation) presenting three or four dots (4 mm in diameter; 16 trials per dots number) and an arrow (2.3 cm long), oriented or not towards one dot, were successively presented. In 16 trials, the arrow pointed leftward, and in 16 trials it pointed rightward. Participants were required to indicate whether the arrow was oriented toward a dot or not. One point was given for each correct response for a possible total of 32 points.
Results
All the analyses were performed using the Statistica software package. The alpha level was set to 5%. The different age profiles of the participants with retinal damage and the ones with cortical lesion led us to consider these two groups separately and compare them against separate control groups.
The RP group performed significantly worse than the Control 1 and the SD groups in the direction judgement task, F(1, 30) = 6.032, p = .02, and F(1, 30) = 4.329, p = .04, respectively. They also had a poorer performance than the Control 1 group in the famous-face recognition task, F(1, 30) = 234.782, p < .01. Detailed performance scores of these groups and results of analyses are presented in Tables 4 and 5.
Mean correct responses of the RP, SD, and Control 1 groups in all the perceptual tasks
Note: RP = retinitis pigmentosa. SD = Stargardt dystrophy. Max. = the maximum score per task. Standard deviations are in parentheses.
Results of analyses of retinitis pigmentosa versus Control 1, Stargardt dystrophy versus Control 1, and retinitis pigmentosa versus Stargardt dystrophy in all the perceptual tasks
Note: RP = retinitis pigmentosa. SD = Stargardt dystrophy.
Significant effect: p < .05.
The SD group performed significantly worse than the Control 1 and the RP groups in the colour-naming task, F(1, 30) = 315.656, p < .01, and F(1, 30) = 367.787, p < .01, respectively, and in the colour hue comparison task, F(1, 30) = 25.344, p < .01, and F(1, 30) = 40.825, p < .01, respectively. They also had a poorer performance than the Control 1 group, F(1, 30) = 234.782, p < .01, in the famous-face recognition task.
No significant group effect was observed for either task (one-way ANOVAs, all p > .10) between the RHH, LHH, and Control 2 groups. Overall, these three groups performed similarly in the colour-naming, colour hue comparison, famous-face recognition, and direction tasks. Detailed performance scores of these groups and results of analyses are presented in Table 6.
Mean performance of the RHH, LHH, and Control 2 groups in the different perceptual tasks and results of analyses
Note: RHH = right homonymous hemianopics; LHH = left homonymous hemianopics; Control 2 = matched control group. Analysis results: one-way analyses of variance (ANOVAs) with the three groups as between-subject factor. Max. = the maximum score per task. Standard deviations in parentheses.
ns: nonsignificant main group effect (p > .10).
Nevertheless, in the LHH group, one participant presented a particular performance pattern. The participant FD showed poorer performance than the control group in colour-naming (F.D.: 8; Control 2: 10.41 ± 0.66; maximum: 11); t(11) = 3.47, p < .01; colour hue comparison (F.D.: 7; Control 2: 8.66 ± 0.49; maximum: 9) t(11) = 3.25, p < .01; and famous-face recognition (F.D.: 10; Control 2: 17.16 ± 1.11; maximum: 20); t(11) = 6.17, p < .01, tasks.
Discussion
Overall, our results suggest that the damage of visual perception (of colour, face, and direction judgement) depends upon the type of visual field loss. A central scotoma due to a Stargardt dystrophy affected colour and face perception but not direction judgement, whereas a severe peripheral visual field loss due to a retinitis pigmentosa impaired face and direction judgement perception but not colour perception. Finally, the sparing of a hemifield (with partial or complete macular sparing) seemed to preserve the performance in all the tasks, except in the only individual with attentional disorders.
Experiment 2: Mental Imagery
In this experiment, we investigated whether visual inputs from central versus peripheral regions of the retina affect performance on complex colours, faces, and spatial tasks differently.
Method
Participants
The SD, RP, Control 1, RHH, LHH, and Control 2 groups consisted of the same participants as those in Experiment 1.
Material
The experiment consisted of three mental imagery tasks used previously in numerous studies: a mental hue comparison task (Bartolomeo, Bachoud-Lévi, Chokron, & Degos, 2002; De Vreese, 1991), a famous-face imagery task (Bartolomeo et al., 1998; Young, Humphreys, Riddoch, Hellawell, & de Haan, 1994), and a direction judgement imagery task (Butter et al., 1997; Finke & Pinker, 1982), presented in a counterbalanced order. All mental imagery tasks were performed blindfolded (except for the direction judgement task).
Mental Hue Comparison Task
In this task (Bartolomeo et al., 2002; De Vreese, 1991), the experimenter announced a pair of stimuli (foods, animals, vegetables), and participants were required to indicate which of them was the brightest. In a first subtest, 20 different pairs of stimuli were presented and concerned the colours brown (e.g., nuts vs. chickpea), green (e.g., parsley vs. kiwi flesh), orange (e.g., apricot vs. mango flesh), pink (e.g., smoked salmon vs. smoked ham), red (e.g., tomato vs. ruby), and yellow (e.g., lemon vs. daffodil). In a second subtest, 10 different pairs of stimuli concerning only grey-level colour (e.g., ash vs. coal) were presented. One point was given for each correct response for a possible total of 20 points for the first subtest and 10 for the second.
Famous-Face Imagery Task
In this task (Bartolomeo et al., 1998; Young et al., 1994), 20 famous faces (actors/actresses, singers, humorists, politicians, and athletes) were selected for one of their facial features: global face shape (n = 10), nose (n = 4), or lips (n = 6). The experimenter announced one celebrity's name and then asked the participant whether his/her face was long or round, or whether his/her nose was thin or large, or whether his/her lips were thin or thick. One point was given for each correct response, which made a total of 10 points for the global face form subtest, 4 points for the nose subtest, and 6 points for the lip subtest.
Direction Judgement from Imagery Task
In this task (Butter et al., 1997; Finke & Pinker, 1982), the experimenter first presented a page with 3 or 4 dots for 10 s, then a blank page for 2 s, and finally a page with the arrow. Here again, participants were required to indicate whether the arrow was oriented towards a dot or not, and in 16 trials the arrow pointed leftward, and in 16 trials it pointed rightward. However, this time they were also asked to point to each dot when the first page was presented (to ensure that all dots were perceived). Again, the overall maximum score was 32 points.
Results
The different age profiles of the participants with retinal damage and the ones with cortical lesion led us to consider these two groups separately and compare them against separate control groups.
ANOVAs showed that the RP group made more errors than the Control 1 group in all the subtests of the famous-face recognition task: face form recognition, F(1, 30) = 4.919, p = .03; nose form recognition, F(1, 30) = 5.00, p = .03; lip form recognition, F(1, 30) = 8.601, p < .01. The RP group performed similarly to the Control 1 group in all the other tasks (all p > .27). Detailed performance scores of these groups and results of analyses are presented in Tables 7 and 8.
Mean correct responses of the RP, SD, and Control 1 groups in all the imagery tasks
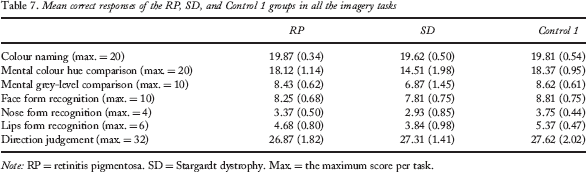
Note: RP = retinitis pigmentosa. SD = Stargardt dystrophy. Max. = the maximum score per task.
Results of analyses of retinitis pigmentosa versus Control 1, Stargardt dystrophy versus Control 1, and retinitis pigmentosa versus Stargardt dystrophy in all the imagery tasks
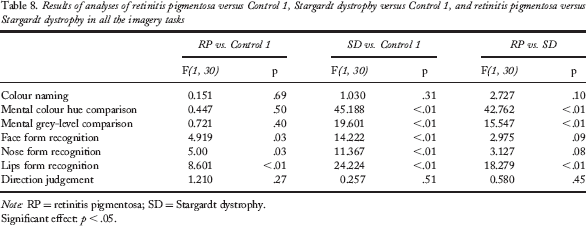
Note: RP = retinitis pigmentosa; SD = Stargardt dystrophy.
Significant effect: p < .05.
The SD group made more errors than the RP and Control 1 groups in the colour hue comparison task, F(1, 30) = 42.762, p < .01, and F(1, 30) = 45.188, p < .01, respectively, and in the grey-level comparison task, F(1, 30) = 15.547, p < .01, and F(1, 30) = 19.601, p < .01, respectively. ANOVAs also showed that the SD group performed worse than the Control 1 group in all the subtests of the famous-face recognition task: face form recognition, F(1, 30) = 14.222, p < .01; nose form recognition, F(1, 30) = 11.367, p < .01; lip form recognition, F(1, 30) = 24.224, p < .01. No difference was observed between the SD group and the two other groups on the direction judgement task (all p > .45).
The RHH, LHH, and Control 2 groups had similar skills in the colour hue comparison, the grey-level comparison, face form recognition, nose form recognition, lip form recognition, and direction judgement tasks (two-way ANOVA, all p > .10). Detailed performance of these three groups and results of analyses are presented in Table 9.
Mean performance of the RHH, LHH, and Control 2 groups in mental imagery tasks and results of analyses
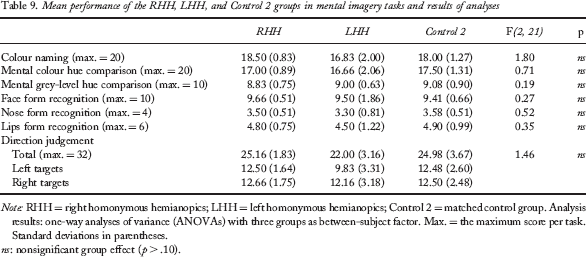
Note: RHH = right homonymous hemianopics; LHH = left homonymous hemianopics; Control 2 = matched control group. Analysis results: one-way analyses of variance (ANOVAs) with three groups as between-subject factor. Max. = the maximum score per task. Standard deviations in parentheses.
ns: nonsignificant group effect (p > .10).
Here again, FD showed a specific profile. He had poorer performances than the control group in the nose form recognition (FD: 2; Control 2: 3.58 ± 0.51; maximum: 4); t(11) = 2.95, p < .02, the mental hue colour comparison (FD: 13; Control 2: 17.50 ± 1.31; maximum: 20); t(11) = 3.28; p < .01, and the grey-level comparison (FD: 6; Control 2: 9.08 ± 0.9; maximum: 10); t(11) = 3.51, p < .01, tasks.
Regarding the direction judgement task, the RHH group did not differ from the Control 2 group when stimuli were oriented rightward, F(1, 16) = 0.61, p > .10. Similarly, no difference between the LHH group and the Control 2 group was observed when stimuli were oriented leftward, F(1, 16) = 0.01, p > .10. Nevertheless, overall, the RHH performed better than LHH, F(1, 10) = 4.50, p = .05, in the direction judgement task.
Summary
Overall, our results suggest that the different types of visual field loss may impair colour, face, and direction judgement imagery according to the lesion extent and location along the visual system. Results show that in patients with retinal damage, colour imagery is impaired by a central scotoma, yet not by a peripheral scotoma. Face imagery is affected by both types of visual field loss, whereas direction judgement imagery is not impaired whatever the type of scotoma. In addition, in hemianopic patients (after a unilateral occipital lesion), the sparing of a hemifield (with partial or complete macular sparing) seemed to preserve the performance in all the tasks, except in individuals with attentional disorders. Finally, we observed, on the one hand, that the left hemianopic participants performed worse than the right ones in the direction judgement task and, on the other hand, that the right and left hemianopic participants had preserved mental imagery abilities for their contralesional blind visual field in this task.
General Discussion
Our results suggest that perceptual and visual mental imagery impairments vary according to the lesion location (retinal or visual cortex) and whether the lesion is at the peripheral or central retinal tissue (in case of retinal lesion) or in the left or right hemisphere (in case of a cortical lesion). Results are discussed below regarding the type of visual deficit (retinal vs. occipital lesion, central vs. peripheral visual field loss).
Perceptual Performance in Patients with Central versus Peripheral Retinal Damage
The results in the colour-naming and colour hue comparison tasks are consistent with models of central and peripheral processing. Indeed, the impaired performance in the SD group and preserved skills in the RP and both hemianopic groups in these perceptual tasks confirm that the P pathway is responsible for colour perception. These results therefore show that even if the low-vision individuals with macular scotoma can use eccentric viewing strategies to perform tasks that depend on useful central vision, they remain significantly impaired in these tasks. The face perception and the direction judgement tasks used in our study also require high visual resolution, because they respectively involve the detection of finer features and motionless dots and arrows. Nevertheless, we observed that a central scotoma (SD group) does not affect direction judgement, while tunnel vision (RP group) impairs face and direction judgement perception. The performance of the SD group in the spatial perception task highlights the use of eccentric viewing with appropriate low-vision devices, which allows them to detect the dots and the arrows. Nevertheless, many SD participants reported that low-vision aids (optical and electronic devices), which had enabled them to see the dots and the arrows on the different sheets and the shape of faces, as well as certain features in the photographs in the face perception task, were of no help for recognizing famous faces in this task. They also reported that they did not use low-vision aids regularly because they found them to be “expensive and cumbersome devices, which were not always handy”. The poor performance by SD participants on the face perception task is probably explained by the lack of repeated exploration of famous faces (even if they knew the famous faces before their acuity loss). Nevertheless, we cannot rule out that the performance might have been spared in a task involving global processing (e.g., gender). The impaired performance of the RP group in the face perception and the direction judgement tasks could be explained by the narrowness of their residual central visual field. Indeed, even if the perception of finer details is mainly conveyed by the P pathway, the sequential processing (due to the small perceptual field of the RP participants) seems to interfere with the detection of dots and arrows in the judgement direction task and overload attention and working memory in the face recognition task (which requires the perception and memorization of many physical details to form a unitary image). This hypothesis seems to be confirmed by the fact that (a) the SD group succeeded better in the direction judgement task than the RP group, despite a significantly lower visual acuity (but with wider visual field), and (b) that hemianopic individuals, participants with central vision and half of their peripheral vision, have a preserved performance in the colour, face, and direction judgement tasks.
Overall, these results suggest that the location of the scotoma is not the only factor determining performance in perceptual tasks, but rather the extent of the residual visual field is critical as well (Rieser, Hill, Talor, Bradfield, & Rosen, 1992). Current results suggest that according to the extent and the location of the visual field loss, the visual disorder could be compensated for by attentional processes allowing the setting up of operating visual strategies (gaze displacements, fixation, as well as head, upper or even entire body exploratory behaviours), yet these processes seem to have but little effect on the severe visual field deficits.
Dissociation between Perceptual and Mental Imagery Performance
Although we did not observe severe deficits in the hemianopic group, confirming the dissociation between perceptual and mental imagery impairments (see for discussion Bartolomeo, 2008, and Dulin et al., 2008), participants did not show any imagery impairments without perceptual deficits except in the RP group within the visuospatial domain. In RP patients, we can infer that their preserved performance in the direction judgement task relies on the use of two sensory modalities (visual and haptic) instead of just one (visual) in the perception task. In the imagery task, participants were required to point to each dot (incorporating a haptic cue) before completing the trial. Therefore, we can suggest that, as already shown in brain-damaged individuals (Bartolomeo et al., 2002; Sirigu & Duhamel, 2001), the haptic modality seems able to modulate certain disorders observed in participants suffering from a visual impairment. This hypothesis raises important questions for theories of sensory integration and methods of education (Fredembach, de Boisferon, & Gentaz, 2009) and rehabilitation in patients with visual field defects (Bartolomeo et al., 2002). Nevertheless, future studies should thoroughly test this hypothesis.
The LHH group's poorer performance in the direction judgement tasks, compared with the RHH group, is broadly consistent with the classical assumption that the right hemisphere is predominant for visuospatial information processing (Bradshaw & Nettleton, 1990; Cohen, 1973; Kimura, 1987). One must take into account that the hemianopic participants' skills in this task were in contrast with the findings by Butter et al. (1997), who demonstrated that hemianopics had more difficulties in imagining visual stimuli in their blind visual field than in their healthy visual field. In the present research, all the hemianopic participants had unilateral damage in the occipital cortex confirmed by neuroimaging study, which was not the case for 3 out of 8 participants tested by Butter et al. Thus, we suggest that the difference between findings may be explained by the fact that individuals with impaired imagery in the Butter et al. study might have had lesions extending beyond the occipital cortex (Bartolomeo, 2002). Other detailed anatomical studies of cases of imagery deficits should be realized in order to better identify the neural correlates of “the mind's eye” (Bartolomeo, 2008). Finally, the presence of perceptual and mental imagery impairments in the only hemianopic participant with attentional deficit confirms as previously suggested by some of us (see Dulin et al., 2008, for discussion) that attentional mechanisms in vision could also exist in mental imagery and emphasizes that the complex interaction between vision, attention, and mental imagery needs to be further investigated (Bartolomeo et al., 2005; Chokron, Colliot, & Bartolomeo, 2004).
In conclusion, the present results (a) suggest that perceptual and visual mental imagery impairments vary according to the lesion location (retinal or visual cortex) and whether the lesion is at the peripheral or central retinal tissue (in case of retinal lesion) or in the left or right hemisphere (in case of a cortical lesion), (b) suggest that visual mental imagery may involve some of the attentional–exploratory mechanisms that are employed in visual behaviour, and (c) place a stronger emphasis on other attentional processes than many researchers have previously recognized.