
Abstract
The difficulty in processing fractions seems to be related to the interference between the whole-number value of the numerator and the denominator and the real value of the fraction. Here we assess whether the reported problems with symbolic fractions extend to the nonsymbolic domain, by presenting fractions as arrays of black and white dots representing the two operands. Participants were asked to compare a target array with a reference array in two separate tasks using the same stimuli: a numerosity task comparing just the number of white dots in the two arrays; and a proportion task comparing the proportion of black and white dots. The proportion task yielded lower accuracy and slower response, confirming that even with nonsymbolic stimuli accessing proportional information is relatively difficult. However, using a congruity manipulation in which the greater numerosity of white dots could co-occur with a lower proportion of them, and vice versa, it was found that both task-irrelevant dimensions would interfere with the task-relevant dimension suggesting that both numerosity and proportion information was automatically accessed. The results indicate that the magnitude of fractions can be automatically and holistically processed in the nonsymbolic domain.
The ability to understand and interpret proportions represented in the x/y format is crucial in the daily lives of adults in a numerate society. It is needed for time and money management—for example, to estimate the value of discounts, interest rates, and quantities of goods (see McCloskey, 2007). However, learning the concept of a fraction is known to be difficult (e.g., Bright, Behr, Post, & Wachsmuth, 2008; Hartnett & Gelman, 1998; Mack, 1995; Smith, Solomon, & Carey, 2005). The difficulty seems to be related to the stepping away from the magnitude conveyed by each of the operands (Stafylidou & Vosniadou, 2004). Thus the child has difficulty with symbolic fractions, first because the value of the fraction is real—that is, continuous—but the components are whole numbers, and second because whole numbers are more familiar to learners through the practice of counting sets (Ni & Zhou, 2005, for a review). Even after instruction, children's errors are typically whole number intrusions (Mack, 1995; Smith et al., 2005). The tendency to use the single-unit counting scheme to interpret fractions and the difficulty in perceiving whole numbers as decomposable units has been referred to as the whole number bias (Ni & Zhou, 2005).
Contrary to the widely held belief that the whole number bias is specific to children, it appears that this bias is largely carried on into adulthood, as reported by Bonato, Fabbri, Umiltà, and Zorzi (2007) in the first behavioural study on this topic. Thus, the acquisition of the concept of rational number and the mastery of procedures for operating with fractions do not seem to be mirrored by a significant change in how the magnitude of fractions is mentally represented. Bonato and colleagues showed that even highly skilled participants processed fractions componentially without accessing the denoted numerical value (i.e., the real number). Subsequent studies that investigated the processing of symbolic fractions in adults suggested that the magnitude of the whole fraction is not automatically accessed (Kallai & Tzelgov, 2009) and that the componential strategy is routinely used (Meert, Grégoire, & Noël, 2009), even though access to the magnitude of the whole fractions seems possible under specific experimental conditions (Iuculano & Butterworth, 2011; Meert et al., 2009; Schneider & Siegler, 2010; Sprute & Temple, 2011). Finally, the use of a hybrid strategy, between componential and holistic, has been reported in a magnitude comparison task on symbolic fractions (Meert, Grégoire, & Noël, 2010).
These behavioural studies indicate that the processing of symbolic fractions changes in relation to stimuli and strategies prompted, but it is still unknown whether the problem with fractions resides in the format of presentation, or whether there is something intrinsically difficult about the concept.
Here we aimed to address this issue by investigating the representation of nonsymbolic proportions. In particular, we measured the degree to which judgement of proportions was influenced by the processing of numerosities. To do this, we constructed stimulus arrays of black and white dots against a grey background corresponding to the numerator and denominator of a fraction. In the numerosity task, participants had to compare the magnitude of the numerators of the reference and the target fractions; in the proportion task, participants had to compare the proportions of black and white dots. We measured the relation between numerosity and proportion judgements by manipulating the congruity of the response in the two tasks: In congruent trials the response was the same in the two tasks whereas in incongruent trials the response was the opposite. An effect of congruity would suggest that the dimension of the array irrelevant in the task was automatically processed and influences the other process. To further investigate the effect of integer numerosities on proportional judgement in the nonsymbolic domain, we conducted regression analyses to investigate whether participants used the componential or the holistic strategy to deal with nonsymbolic proportions.
Finally, we investigated whether the use of perceptual variables influences the results during numerosity and proportional judgements. To do this, in Experiment 1 the size of the dots was always the same, so that decisions could be made by tracking the overall quantity of black or white, while in Experiment 2, the size of dots was varied so this perceptual strategy would not be effective.
Experiment 1
Method
Participants
Sixteen participants (8 female and 8 male), one left-handed, aged between 23 and 30 years (mean age 24.94 years) were tested individually. They all reported normal or corrected-to-normal vision.
Stimuli
Stimuli were random arrays of white and black dots (0.63° visual angle) presented on the computer screen. Viewing distance was 60 cm. Each array represented a fraction where the number of white dots was the numerator, and the number of black dots was the denominator (e.g., the fraction 1:2 was represented by 1 white dot and 2 black dots). The fractions used were 1:2, 1:3, 2:3, 3:2, 3:7, 4:2, 4:3, 4:7, 4:8, 5:5, 6:2, 6:3, 6:7, 6:8, 7:3, 7:8, 8:7, 9:7, and 9:8.
Procedure
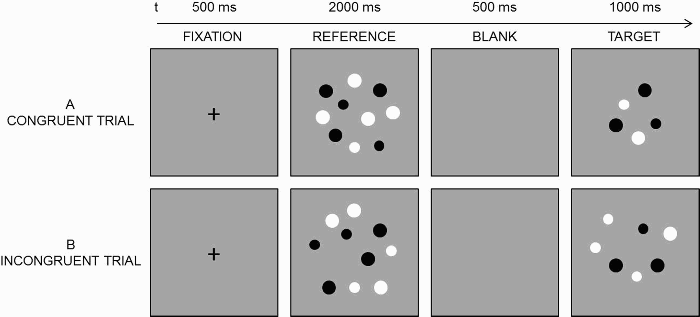
Participants performed two separated tasks in a counterbalanced order. In each task, participants had to compare the target with the reference array (see the trial sequence in Figure 1). The reference stimulus was fixed to 5 white and 5 black dots, whereas the target stimulus varied in the range reported in the Stimuli section (excluding 5:5). In the numerosity task, participants were specifically asked to judge whether the number of white dots was bigger or smaller in the target than in the reference. In the proportion task, participants were specifically asked to judge whether the proportion of white compared to black dots was bigger or smaller in the target than in the reference, performing a part–part proportion judgement. In relation to the responses in the two tasks, half of the trials were congruent (Figure 1A), when the correct response in the two tasks was the same (e.g., for the fraction 2:3 the correct response is smaller both in the numerosity, since 2 is smaller than 5, and in the proportion task, since 2:3 is smaller than 5:5), and the other half were incongruent (Figure 1B), when the correct response in the two tasks was different (e.g., for the fraction 4:3, the correct response is smaller in the numerosity task and bigger in the proportion task). Because there were twice as many congruent than incongruent stimuli, each incongruent stimulus was repeated 8 times instead of 4, for a total number of 96 trials for each task.
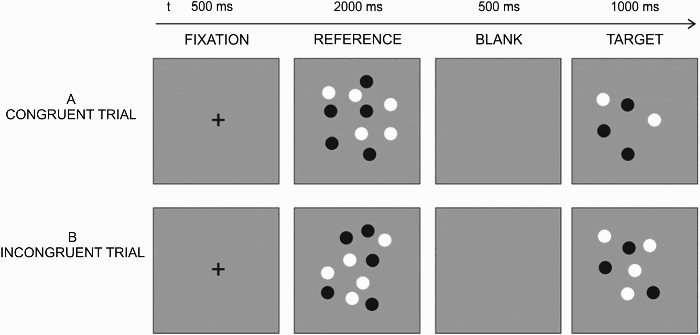
Trial sequence. A. Example of a congruent trial: The correct response to the target stimulus is the same in the numerosity (smaller) and in the proportion (smaller) task. B. Example of an incongruent trial: The correct response is different in the numerosity (smaller) and in the proportion task (bigger).
In both tasks, participants were required to respond as fast and as accurately as possible by pressing one of two response keys on the keyboard. In half of the participants, key assignment was to press “f” to answer smaller and “j” to answer larger, whereas the other half used the reversed key assignment.
Results and discussion
Accuracy
Numerosity task was performed more accurately than proportion task. In the numerosity task, mean error rate was 3.39% (range 0% to 7.29%) and 0.27% (0% to 2.20%) for missed responses. In the proportion task, mean error rate was 16.60% (9.38% to 27.37%) and 1.42% (0% to 7%) for missed responses.
The percentage of correct responses was analysed in a 2 (key assignment: smaller–left hand, bigger–right hand vs. smaller–right hand, bigger–left hand) × 2 (task order: numerosity first vs. proportion first) × 2 (task: numerosity vs. proportion) × 2 (congruity: congruent vs. incongruent stimuli) analysis of variance (ANOVA). Key assignment and task order were between-subject factors. The numerosity task was performed better than the proportion task (numerosity 96% > proportion 83%), as revealed by the main effect of task, F(1, 12) = 104.7, MSE = .003, p < .001. Accuracy was influenced by congruity, F(1, 12) = 59.8, MSE = .004, p < .001, indicating that accuracy was lower for incongruent trials than for congruent trials (see Figure 2; congruent 96% > incongruent 84%). Congruity differently influenced accuracy in the two tasks, as shown by the significant interaction between task and congruity, F(1, 12) = 40.6, MSE = .005, p < .001. In particular, congruent stimuli yielded a better performance only in the proportion task, t(15) = 7.4, p < .001, while no effect of congruity was present in the numerosity task, t(15) = 1.0, ns. This pattern of results indicates that the information about numerosity of the dots influenced accuracy during proportion judgements. Task order, F(1, 12) < 1, as well as key assignment, F(1, 12) = 1.7, MSE = .005, ns, were not significant.
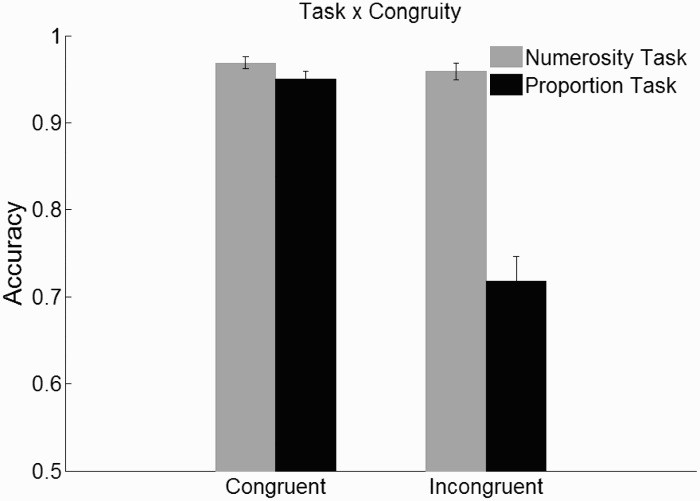
Accuracy in Experiment 1 during numerosity and proportion tasks, depicted in grey and black, respectively, as a function of congruity.
Reaction times
Reaction times were analysed in a 2 (key assignment) × 2 (task order) × 2 (task) × 2 (congruity) ANOVA, where key assignment and task order were between-subject factors. The main effects of task, F(1, 12) = 99.5, MSE = 10,883.2, p < .001 (678 ms for numerosity vs. 938 ms for proportion) and congruity, F(1, 12) = 58.9, MSE = 1,910.5, p < .001 (766 ms for congruent vs. 850 ms for incongruent) were significant. This indicates that participants were slower to perform the proportion task than the numerosity task; they were also slower during incongruent than during congruent trials (see Figure 3). The interaction between task and congruity was significant, F(1, 12) = 15.7, MSE = 2,892.9, p < .05, suggesting that irrelevant information was automatically processed. This interaction was qualified by a significant second order interaction, Congruity × Task Order × Task, F(1, 12) = 5.1, p < .05, indicating that the processing of irrelevant information was influenced by task order. Key assignment and task order were not significant, Fs < 1.
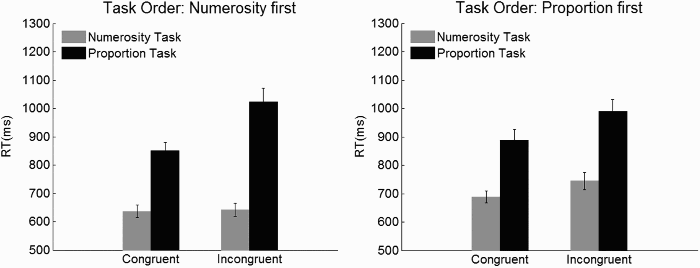
Reaction times (RTs) in Experiment 1 during numerosity and proportion tasks, represented in grey and black, respectively, as a function of congruity separated for task order (numerosity first = numerosity task followed by proportion task; proportion first = proportion task followed by numerosity task).
The three-way interaction was further explored in separate ANOVAs for each of the two task orders. When the numerosity task was performed first, the main effect of task was significant, F(1, 7) = 48.8, MSE = 14,584, p < .001 (639 ms for numerosity vs. 938 ms for proportion). The main effect of congruity was significant, F(1, 7) = 30.1, MSE = 2,124.5, p < .01 (744 ms for congruent vs. 833 ms for incongruent). The interaction between task and congruity was also significant, F(1, 7) = 22.2, MSE = 2,521.1, p < .01. In particular, the congruity effect was significant for the proportion task, F(1, 7) = 26.4, MSE = 4,528.1, p < .001 (851 ms for congruent vs. 1,024 ms for incongruent) but not for the numerosity task, F(1, 7) = 1.1, MSE = 117.4, ns (636 ms for congruent vs. 642 ms for incongruent).
When the proportion task was performed before the numerosity task, the effect of task was significant, F(1, 7) = 36.6, MSE = 10,772.5, p < .01 (717 ms for numerosity vs. 939 ms for proportion). Congruity was also significant, F(1, 7) = 29.9, MSE = 1,641.7, p < .01 (788 ms for congruent vs. 867 ms for incongruent). Notably, there was no significant interaction between task and congruity, F(1, 7) = 1.3, MSE = 3,174.9, ns. The simple main effect of congruity was significant in the proportion task, F(1, 7) = 16.5, MSE = 2,490.4, p < .01 (congruent = 887 ms; incongruent = 989 ms), but it was only close to significance in the numerosity task, F(1, 7) = 5.3, MSE = 2,326.3, p = .056 (congruent = 689 ms; incongruent = 744 ms). Thus, to further investigate the interaction between congruity and task, we assessed the evidence in favour of the null hypothesis (i.e., no interaction) using the Bayesian method described by Masson (2011). The posterior probabilities for the interaction model were pBIC(H0|D) = .37 and pBIC(H1|D) = .63, which is positive evidence in support of the null hypothesis. According to the categorization proposed by Raftery (1995), the posterior probability of the alternative hypothesis is insufficient to support the presence of an effect. This additional analysis confirms that congruity had a similar effect across tasks when proportion task was performed first.
The congruity effect suggests that the task-irrelevant information is processed along with task-relevant information and indeed interferes with it. However, task order seems to modulate the effect of task-irrelevant information, such that proportion information interfered with numerosity judgements only when the participant had already been engaged in the proportion task. By contrast, numerosity information always interfered with proportion judgements.
Componential versus holistic strategy
To investigate whether the use of the componential strategy reported by Bonato et al. (2007) was adopted in dealing with nonsymbolic proportions, we ran regression analyses on reaction time data. In particular, separate hierarchical regressions were run for pairs of predictors, where congruity was always entered first, while the second predictor varied. The latter was one of the following: (a) the absolute difference between the number of white dots in the target fraction (numerator) and the 5 white dots in the reference, (b) the absolute difference between the number of black dots in the target fraction (denominator) and the 5 black dots in the reference, (c) the absolute difference between the number of white dots and the number of black dots within the target array, and (d) the absolute difference between the real values of the target and the reference fraction. In order to test whether the effect of task order influenced not only reaction times but also the strategy used to perform the task, we conducted two regressions separately for the two task orders.
In the numerosity task, the congruity predictor (entered first) was not significant irrespective of task order (see Table 1; note the much higher beta coefficient in proportion first, in line with the ANOVA results). Among the second-step predictors, the best predictor of reaction times (RTs) in the numerosity task was the difference between numerator of the target and the reference irrespective of task order. The difference between the numerator and the denominator was also significant for both task orders, although the fit was much poorer. In the proportion task, the congruity predictor (entered first) was significant irrespective of task order. Among the second-step predictors, the only one that reached significance was the difference between the real values of the target and the reference fractions. The other predictors did not significantly increase the variance accounted for in the regression model, with changes in R2 change between .001 and .0113 (all ps > .14).
Summary of the regression analyses results in Experiment 1
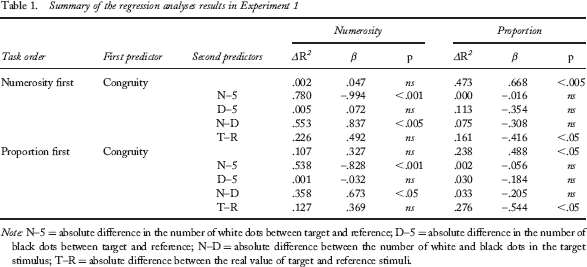
Note: N–5 = absolute difference in the number of white dots between target and reference; D–5 = absolute difference in the number of black dots between target and reference; N–D = absolute difference between the number of white and black dots in the target stimulus; T–R = absolute difference between the real value of target and reference stimuli.
These results suggest that in the numerosity task, participants compared the number of white dots in the target with the number of white dots in the reference (i.e., 5). Interestingly, the componential strategy, represented by the difference between the numerosity of white and black dots in the target fraction, was not the best predictor of RTs in the proportion task. Instead, the difference between real values of the target and the reference fractions was a better predictor of performance in the proportion task, suggesting that participants solved the task by the use of information related to the real magnitude of the nonsymbolic fraction. The same results in the regression analyses for both task orders suggest that the type of strategy used did not depend on the order of the tasks.
The results of Experiment 1 show that participants can accurately process nonsymbolic proportions, even if comparing proportions is slower and less accurate than comparing numerosities. Moreover, we reported that the magnitude of the operands of the nonsymbolic fractions were automatically accessed and interfered with the proportion judgement. These results are in line with proposals that extracting the numerosity parameter from an array is automatic (e.g., Pavese & Umiltà, 1998) and indeed is a primary visual property of the environment (Burr & Ross, 2008; Stoianov & Zorzi, 2012). Interestingly, also task-irrelevant proportion information influenced numerosity judgements when participants have already been engaged in proportional judgements, indicating that proportion might be automatically processed if this information had been recently activated. Finally, our results showed that the magnitude of nonsymbolic proportion can be holistically accessed.
Experiment 2
In Experiment 1, the size of dots was kept constant, and therefore participants' responses in both tasks might have relied on the cumulative surface areas occupied by white and black dots. Though the presence of numerosities within the subitizing range (i.e., 1–4) makes the use of a non-numerical strategy unlikely, in Experiment 2 we discouraged participants from attending to cumulative area by randomly varying the size of the dots within each array. With this manipulation, the strategy to rely on cumulative area to perform the numerosity task was not efficient given that the relation between total area and numerosity could covary in some but not in all trials (see Stoianov & Zorzi, 2012, for discussion of the relation between numerosity and cumulative area).
Method
Experiment 2 was identical to Experiment 1, except for the following changes. Sixteen participants (8 female and 8 male), one left-handed, aged between 19 and 29 years (mean age 23 years) were tested individually. They all reported normal or corrected-to-normal vision. The size of the dots varied randomly from 0.47° to 0.78° of visual angle within each stimulus (see Figure 4). This ensured that cumulative surface area was not systematically related to numerosity (see Piazza, Izard, Pinel, Le Bihan, & Dehaene, 2004, for a discussion). Therefore, a surface area strategy would not be effective.
Trial sequence during congruent (A) and incongruent trials (B) in Experiment 2, in which dot size varied within each stimulus.
Results and discussion
Accuracy
As in Experiment 1, numerosity task was performed more accurately than proportion task even if the percentage errors slightly increased. In the numerosity task, mean error rate was 2.9% (range 0% to 14.6%), whereas in the proportion task, mean error rate was 15.6% (0% to 45.8%).
The main effects of task, F(1, 12) = 77.9, MSE = 33.1, p < .001, and congruity, F(1, 12) = 19.3, MSE = 46.4, p < .01, were significant, revealing that participants were more accurate during the numerosity than during the proportion task (numerosity 97.1% > proportion 84.4%). and during congruent than during incongruent trials (congruent 94.5% > incongruent 87.0%; see Figure 5). The interaction between task and congruity was significant, F(1, 12) = 18.2, MSE = 36.6, p < .01; in particular, congruent stimuli yielded a better performance only in the proportion task, t(15) = 4.6, p < .001, while no effect of congruity was present in the numerosity task, t(15) = 1.8, ns. Task order and key assignment were not significant (Fs < 1). Given the similarity of the accuracy patterns during Experiments 1 and 2, the manipulation of dot size seems not to have affected accuracy.
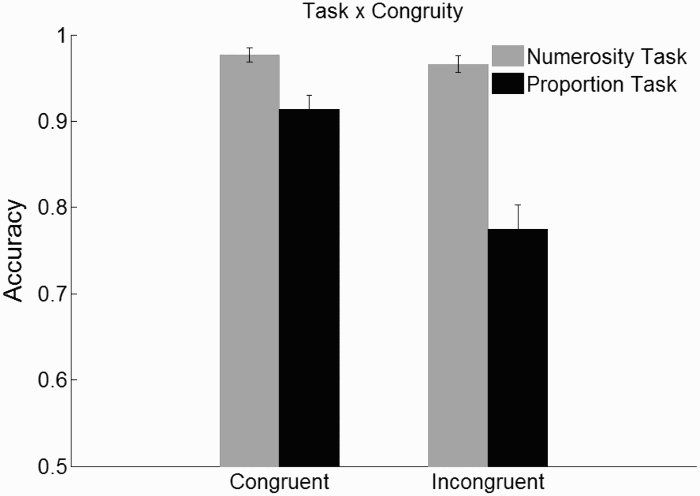
Accuracy in Experiment 2 during numerosity and proportion tasks, depicted in grey and black, respectively, as a function of congruity.
Reaction times
Figure 6 shows that the main effects of task, F(1, 12) = 44.6, MSE = 40,675.8, p < .001 (697 ms for numerosity vs. 1,034 ms for proportion) and congruity, F(1, 12) = 35.6, MSE = 3,209.1, p < .001 (823 ms for congruent vs. 908 ms for incongruent) were significant, indicating that participants were slower in the proportion task than in the numerosity task and during incongruent than during congruent trials. The pattern of results was the same during both tasks irrespective of task order, as showed by the nonsignificant interaction between task and congruity, F(1, 12) = 2.7, MSE = 2,539.1, ns, and by the nonsignificant second-order interaction (Congruity × Task Order × Task, F < 1). Task order was not significant, F(1, 12) = 2.8, ns, and nor was key assignment (F < 1). As in Experiment 1, we further investigated the relation between task and congruity by assessing the simple main effect of congruity for each task and separated for each task order. When numerosity was the first task, congruity was significant for the proportion task, F(1, 7) = 18.7, MSE = 2,320.9, p = .003 (871 ms for congruent vs. 975 ms for incongruent), as well as for the numerosity task, F(1, 7) = 7.9, MSE = 868.6, p = .026 (675 ms for congruent vs. 717 ms for incongruent). When proportion was the first task, congruity was significant for the proportion task, F(1, 7) = 11.3, MSE = 3,974.5, p = .012 (1,091 ms for congruent vs. 1,197 ms for incongruent), and close to significance for the numerosity task, F(1, 7) = 5.1, MSE = 5,809, p = .058 (655 ms for congruent vs. 741 ms for incongruent). To further investigate the interaction between congruity and task, we assessed the evidence in favour of the null hypothesis (i.e., no interaction) using the Bayesian method described by Masson (2011) that we used also in Experiment 1. This analysis confirmed only partially the results of the ANOVAs: When numerosity was performed first, the posterior probability of the alternative hypothesis was high, pBIC(H0|D) = .024, and pBIC(H1|D) = .98, in favour of an interaction between task and congruity, while the same probability was low when proportion was executed first, pBIC(H0|D) = .78 and pBIC(H1|D) = .22, indicating no interaction between the two factors.
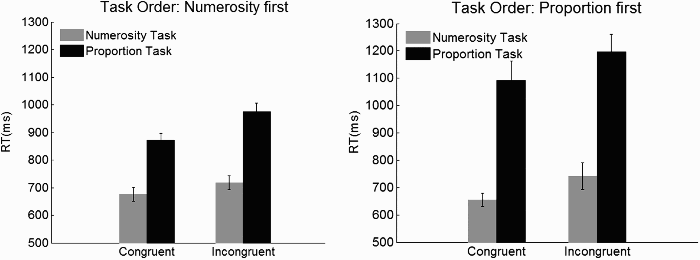
Reaction times in Experiment 2 during numerosity and proportion tasks, represented in grey and black, respectively, as a function of congruity separated for task order.
In contrast to Experiment 1, the manipulation of congruity influenced RTs also during the numerosity task. Results from the ANOVAs indicate that this effect is present irrespective of task order. However, the test of the posterior probability of the null hypothesis suggests that congruity had a stronger influence on RTs when proportion task was performed first.
These results suggest that, when participants cannot rely on perceptual variables to solve the numerosity task, the information about proportion interferes with the numerosity judgement.
Componential versus holistic strategy
In order to test whether the manipulation of perceptual variables influenced the strategy that participants adopted in Experiment 1, we ran the same regression analyses on RTs as that in Experiment 1. There was no significant second-order interaction between task, congruity, and task order in Experiment 2, and this indicates that the pattern of RTs did not depend on task order, so we conducted two regression analyses separating numerosity and proportion tasks but collapsing data for numerosity first and proportion first. In the numerosity task, the congruity predictor missed significance (see Table 2). Among the second-step predictors, the best predictor of RTs was the difference between numerator of the target and the reference. The difference between the numerator and the denominator was also significant, although the fit was much poorer. The other predictors did not significantly increase the variance accounted for in the regression model, with changes in R2 change between 0 and .046 (all ps > .72).
Summary of the regression analyses results in Experiment 2
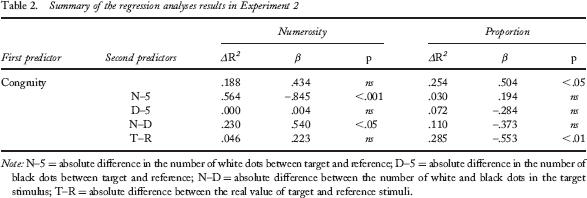
Note: N–5 = absolute difference in the number of white dots between target and reference; D–5 = absolute difference in the number of black dots between target and reference; N–D = absolute difference between the number of white and black dots in the target stimulus; T–R = absolute difference between the real value of target and reference stimuli.
In the proportion task, the congruity predictor was significant. Among the second-step predictors, the only one that reached significance was the difference between the real values of the target and the reference fractions. The other predictors did not significantly increase the variance accounted for in the regression model, with changes in R2 between .030 and .110 (all ps > .13).
These analyses show that participants computed the real value of the fractions, and that the real value interfered with numerosity estimation in the numerosity task. Moreover, the use of the same strategies during Experiments 1 and 2 indicates that participants were unlikely to use perceptual variables (such as cumulative surface area) to perform the tasks because the cumulative area was an unreliable cue: The size of dots varied randomly so that total area and numerosity of dots could covary in some trials but not in others.
In Experiment 2, variable dot size within the stimulus arrays appeared to magnify the effect of proportion information on numerosity judgement. This suggests, first, that proportion is computed even when it is task irrelevant; and second, that removing perceptual cues to proportion does not change the strategy used to perform numerosity and proportion judgements.
General Discussion
The first aim of this study was to investigate the relation between the processing of numerosity and proportion in the nonsymbolic domain. In two experiments, we showed that participants can readily and accurately compute the real value of fractions in a nonsymbolic format. Nevertheless, the numerosity task was performed better than the proportion task. The present findings confirm previous research showing that fractions are relatively difficult to process even when presented nonsymbolically: Judgements are slower and less accurate than judgements of numerosity, suggesting that accessing numerosity information is “more natural” than accessing information about proportion (Butterworth, 2001). They thus present a challenge to the proposal that a major source of difficulty for children lies in using the same symbols for both whole numbers and fractions (Mix, Levine, & Huttenlocher, 1999). Moreover, we measured an interference effect of the magnitude of the operands on the proportion judgement, compatible with the hypothesis that the difficulty in processing fractions relies on the stepping away from the magnitude of the components (Stafylidou & Vosniadou, 2004).
We also measured the influence of the magnitude of the proportion on the numerosity judgement, under specific conditions. In Experiment 1, when numerosity followed proportion task, proportion information was extracted even if it was task irrelevant, and this information interfered with numerosity judgement. Experiment 2 showed that the manipulation of the size of the dots in the array boosted the automatic access to the magnitude of the proportions since this information interfered with numerosity judgements irrespective of task order.
It is worth noting that results of the regression analysis show that in Experiment 1, the processing of numerosity (in terms of the influence of congruity) explained a large amount of RT variance in the proportion task. By contrast, the processing of proportion did not explain the variance of RTs in the numerosity task. However, this asymmetry disappeared in Experiment 2.
Although the congruity predictor was not significant in the regression analysis of the numerosity task, the beta weight and the R2 were similar to those obtained in the analysis of the proportion task. These findings indicate that the extraction of both numerosity and proportion information can be carried out automatically in the nonsymbolic domain. We believe that our experiments show for the first time a mutual influence between numerosity of the operands and magnitude of the fraction. Since previous studies were conducted with symbolic fractions, it might be possible that this result is highly related to the format of representation, suggesting an interesting difference between symbolic and nonsymbolic fractions. Further studies that directly compare these two formats will be needed to address this issue.
The second aim of this study was to reveal the strategy used by participants during the processing of fractions when they are represented in the nonsymbolic format. Bonato et al. (2007) addressed the same question in the symbolic domain (i.e., regular format of fraction with Arabic digits displayed in the form x/y) and reported that participants accessed to the magnitude of the integer components when they were asked to evaluate the magnitude of the fraction. Other studies suggested that the strategy used in dealing with symbolic fraction might vary in relation to the context. For example, Meert and colleagues (2009) observed that access to the magnitude of symbolic fractions was determined by the congruity or incongruity between the value of the single components and the value of whole fraction. In particular, when the magnitude of the operand was congruent with the magnitude of the whole fraction (i.e., fraction with common denominators, like 3/7 and 5/7), participants typically used a componential strategy. Instead, when the value of the operands was incongruent with the value of the whole fractions (i.e., fraction with common numerators, like 2/5 and 2/3), participants used the componential strategy. Moreover, when participants had to deal with fractions without common operands, like 6/11 and 3/8, the componential strategy became too complicate to execute, and participants tried to access the real value of the fraction. In a subsequent study, Meert et al. (2010) proposed a hybrid model that used both componential and holistic strategies.
Our study investigated this issue with nonsymbolic fractions for the first time, and results from both experiments clearly show that participants access to the magnitude of the fraction holistically—that is, comparing the real magnitude of the target and the reference array. The use of the holistic strategy to process nonsymbolic proportions suggests that the magnitude of the components does not play a crucial role during the processing of nonsymbolic proportions, in line with evidence of the early ability to extract ratio information in 6-month-old infants (McCrink & Wynn, 2007). Participants in our experiments performed proportion and numerosity comparisons on exactly the same stimuli, an experimental design that we believe has never been used in any previous study. Moreover, since we used nonsymbolic proportions, our findings are not affected by the potential confound of the relative familiarity of digit symbols representing whole numbers versus representing components of fractions.
Overall, our results show that fraction information can be automatically and holistically accessed in the nonsymbolic domain, in line with the proposal of an automatic and abstract representation of ratio magnitudes (Jacob & Nieder, 2009a, 2009b).