
Abstract
In list memory, access to individual items reflects limits of temporal distinctiveness. This is reflected in the finding that neighbouring list items tend to be confused most often. This article investigates the analogous effect of spatial proximity in a visual working-memory task. Items were presented in different locations varying in spatial distance. A retro-cue indicated the location of the item relevant for the subsequent memory test. In two recognition experiments, probes matching spatially close neighbours of the relevant item led to more false alarms than probes matching distant neighbours or non-neighbouring memory items. In two probed-recall experiments, one with simultaneous, the other with sequential memory item presentation, items closer to the cued location were more frequently chosen for recall than more distant items. These results reflect a spatial transposition gradient analogous to the temporal transposition gradient in serial recall and challenge fixed-capacity models of visual working memory (WM).
Different traditions of research on working memory (WM) have built on different preferred paradigms. Much research over the last five decades has used memory for lists of sequentially presented (mainly verbal) stimuli (for a review see Lewandowsky & Farrell, 2008). In recent years there was a surge of interest in WM for simultaneous displays of visual–spatial information (e.g., Luck & Vogel, 1997). The goal of the present study is to investigate commonalities between the two paradigms. In particular, we are interested in the role of contextual distinctiveness. In serial recall, temporal distinctiveness between successive list items plays a major role for memory performance. Here we ask whether spatial distinctiveness plays an analogous role in simultaneous-display paradigms.
Distinctiveness in time and space
Serial-order tasks are frequently used to investigate short-term or WM phenomena (Farrell & Lewandowsky, 2004; Henson, Norris, Page, & Baddeley, 1996; Nairne, 1988). In those tasks, items are presented sequentially and have to be recalled in the order of presentation. Among the most frequent errors are transpositions—that is, recall of items in the wrong list positions. Transpositions follow the locality constraint: Items are more likely to be displaced to locations close to their original position (in particular neighbouring positions) than to more distant positions (Henson et al., 1996; Lewandowsky & Farrell, 2008; Murdock & vom Saal, 1967).
The locality constraint can be explained by limited distinctiveness of WM representations on the time dimension. The most successful explanation for the locality constraint builds on the assumption that items are associated to position markers (i.e., representations of their list positions), and the position markers overlap to the extent that they are close in time (Lewandowsky & Farrell, 2008). Due to these overlapping position markers, items are bound not only to the marker of their actual position but also to some extent to markers of neighbouring positions. Hence, when using list position as retrieval cue to retrieve the corresponding item, the position markers also cue incorrect items to the degree that their positions overlap with the current position. As a consequence, people frequently transpose items with other items, and the proportion of such transpositions falls off with positional distance. The decline of transposition probability with distance is referred to as the transposition gradient.
In a typical visual WM task (e.g., Luck & Vogel, 1997; Zhang & Luck, 2008), several visual objects are displayed simultaneously in different locations. Participants are required to memorize objects together with their spatial locations to later compare them to a probe display, or to recall the object associated with a certain position in space. Hence, in these tasks, spatial location often serves as a retrieval cue, thus motivating the question of whether there are transpositions in space similar to the temporal transpositions in serial-order tasks. Bays, Catalao, and Husain (2009) showed that confusions between objects explain a substantial proportion of errors in recall of items from simultaneous displays, but they do not assume a spatial gradient of distinctiveness between them. Our question is whether there is a locality constraint for confusions on the spatial dimension, equivalent to the locality constraint on the time dimension (Henson et al., 1996).
Ordinal or metric distinctiveness?
In the serial-order literature, there is a debate on whether the temporal context is metric or ordinal (for a review see Morin, Brown, & Lewandowsky, 2010): The event-based approach favours the assumption that the temporal context advances only when a new event (e.g., a new list item) is encoded into WM, such that successive positions only reflect the order of events (Lewandowsky & Brown, 2005; Lewandowsky & Farrell, 2008). In contrast, the time-based approach assumes that the context advances as a function of time, such that the relative lengths of the time gaps between successive items is reflected in different degrees of temporal distinctiveness between them (Brown, Neath, & Chater, 2007). Morin et al. (2010) summarize evidence for the importance of metric temporal distinctiveness in most paradigms of serial-order memory, with forward serial recall as a possible exception (see also Farrell, Wise, & Lelièvre, 2011). By analogy, the spatial effects in visual WM could be ordinal, reflecting only neighbourhood relations between items, or metric, reflecting their relative distance in space. Here we investigate whether metric spatial distance affects the distinctiveness between representations in WM over and above the topological relation of neighbourhood.
Experiments 1A AND 1B
We used a local-recognition paradigm to investigate the effect of spatial proximity on false alarms. After encoding a display of six colour items, participants were cued to the location of one item (the target) that they were to compare to a probe. Intrusion probes were probes that mismatched the target item but matched one of the other five memory items; these probes were to be rejected. We investigated whether the rate of false alarms to intrusion probes increases with the proximity between the target and the item matching the intrusion probe. If representations in WM are spatially imprecise and overlapping, spatially close items should be more difficult to distinguish from the target than more distant items. Hence, intrusion probes matching close neighbours of the target should cause more interference than far neighbours, and far neighbours should cause more interference than non-neighbours. To examine whether this is the case, we manipulated the spatial distance between neighbouring objects in the memory display.
Method
Participants
Thirty students (11 male) participated in Experiment 1A (mean age 25 years, range: 19–32). In Experiment 1B, 30 students (3 male) participated (mean age 22 years, range: 18–35). Participants received financial compensation or course credit. Four participants of Experiment 1B were excluded due to bad performance (<65% correct). 1
Analyses including all participants showed the same data pattern as the analyses with subjects excluded.
Materials and procedure
Experiments were programmed in MATLAB, using the Psychophysics Toolbox (Brainard, 1997; Pelli, 1997).
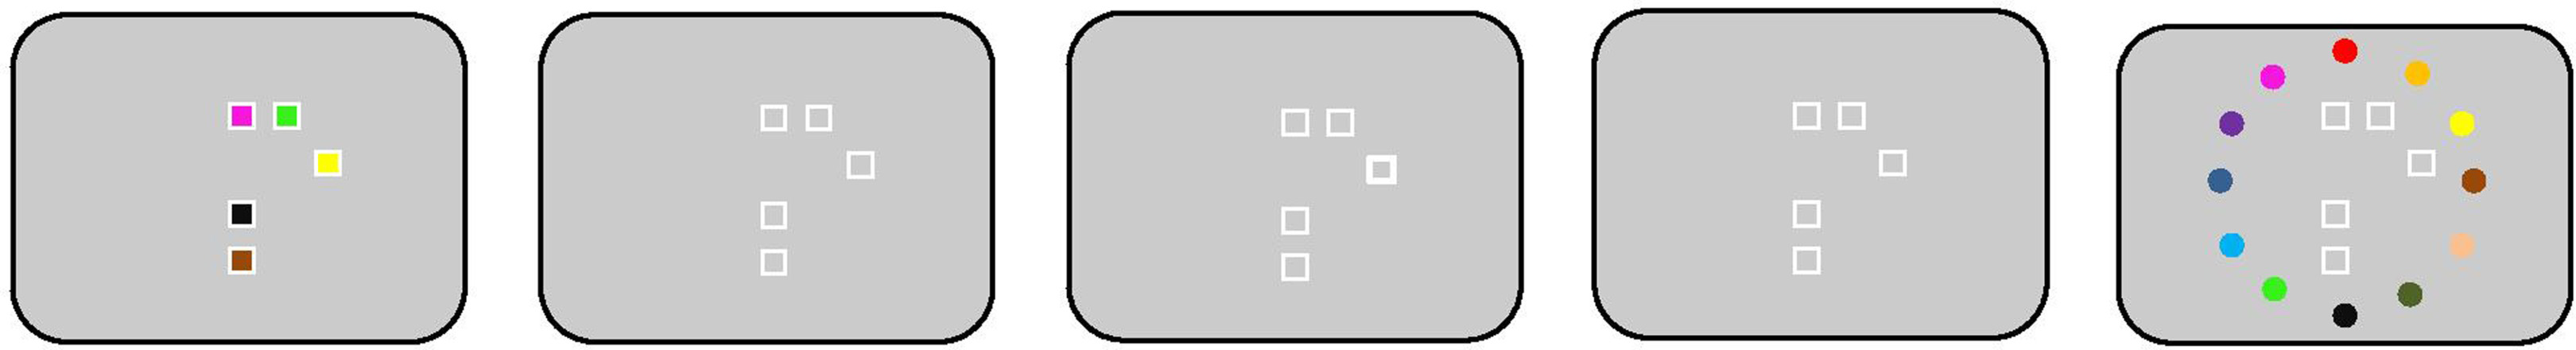
Participants completed a local recognition task, requiring them to compare one object from a multistimuli memory display to a central probe. Each trial started with a memory display containing six coloured circles on a grey background, arranged on an imaginary circle around the screen centre. Of the six distances between neighbouring stimuli, three were close (40° on the imaginary circle), and three were far (80°), randomly allocated to neighbour pairs. After the memory display had been presented for one second, the screen turned grey for 700 ms. Then a white arrow (i.e., the retro-cue) identified the relevant memory item by pointing to one of the six former stimulus locations. The cue was centrally presented for 100 ms. After a grey postcue interval of 700 ms, the probe display was shown, containing one coloured circle, which had to be compared to the cued item. The probe remained on screen until the participant pressed the left arrow key for a match, or the right arrow key for a mismatch. Performance feedback was provided visually for 500 ms and was followed by a grey intertrial interval of 1.5 s (see Figure 1).
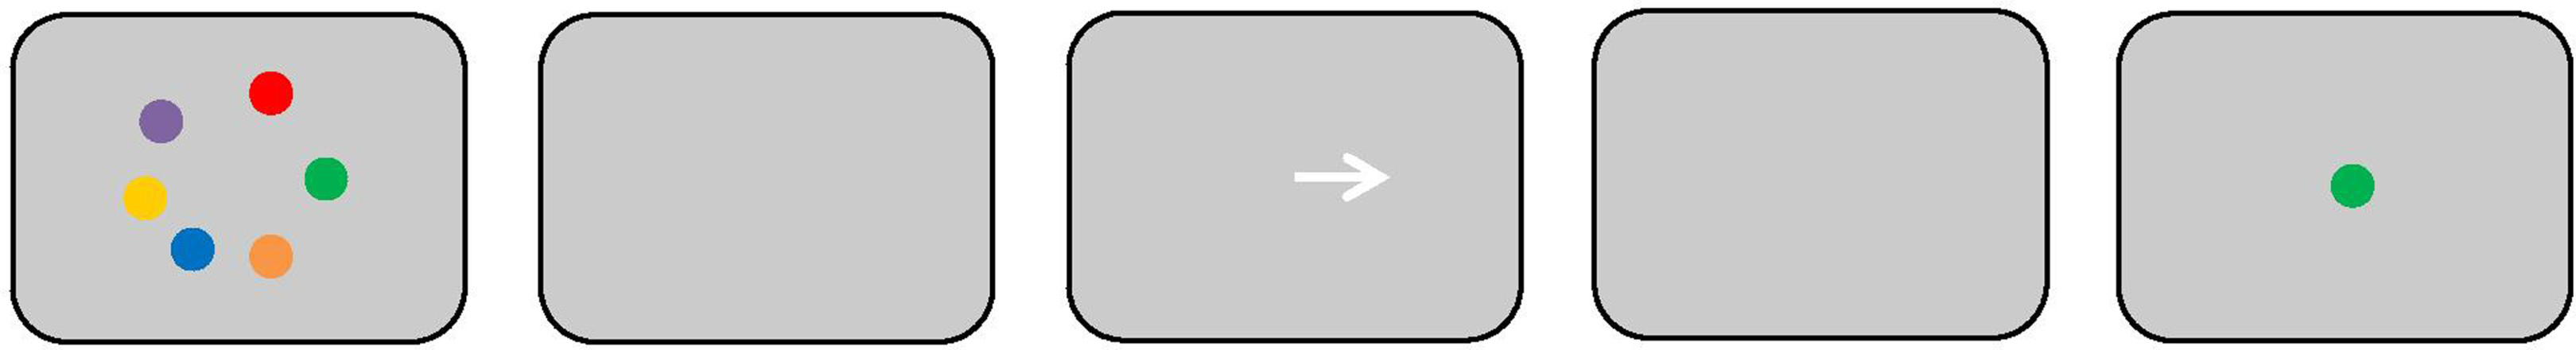
Description of a trial from Experiment 1A. The probe stimulus is a far neighbour in this example. The stimuli were presented on a grey background, and the cues were presented in white. In Experiment 1B, white frames were presented around each memory stimulus, and those frames remained on screen throughout each entire trial. Furthermore, the probe stimulus was surrounded by a white frame. To view a colour version of this figure, please see the online issue of the Journal.
Experiment 1B was conducted to investigate whether the effect of spatial proximity observed in Experiment 1A was due to the inability to correctly identify the cued location. We replicated Experiment 1A with the only difference that white frames around each former stimulus location were presented throughout each trial, leaving no uncertainty about which location the cue pointed to and which item was the target for comparison.
Each participant completed 10 practice trials prior to the test phase. The test session consisted of 500 trials, split into 10 blocks. Fifty percent of trials were match trials. In mismatch trials, the probe was an intrusion probe (i.e., one of the not-cued memory items); either it was an item not neighbouring the cued item (30% of trials) or it was a direct neighbour (20% of trials, with equal probabilities of close and far neighbours). Participants were instructed to respond as fast as possible without sacrificing accuracy.
Results
The average percentage correct was 84.5% (SD = 6.3) for Experiment 1A and 79.6% (SD = 4.3) for Experiment 1B. Trials associated with responses faster than 100 ms and slower than 7 s were excluded from reaction time (RT) analyses, as were error trials. RTs were log-transformed to reduce the skew of the distributions. Intrusion trials were sorted into non-neighbours, far neighbours, and close neighbours. Match trials were omitted from analysis because they required a different response and are not of interest for the question investigated. When the sphericity assumption was violated, corrected Greenhouse–Geisser degrees of freedom (noninteger values) are presented.
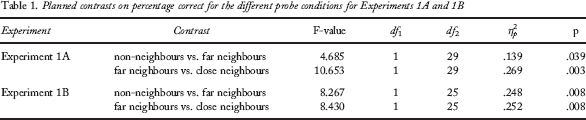
A repeated measures analysis of variance (ANOVA) on percentage correct revealed an effect of probe condition for Experiment 1A, F(2, 58) = 15.342, p < .001, η2p = .346, and Experiment 1B, F(2, 50) = 20.281, p < .001, η2p = .448. Planned contrasts showed the same picture for both experiments: Non-neighbour probes were rejected with higher accuracy than far-neighbour probes, and far neighbours were rejected better than close neighbours (for statistics, see Table 1 and Figure 2).
Planned contrasts on percentage correct for the different probe conditions for Experiments 1A and 1B
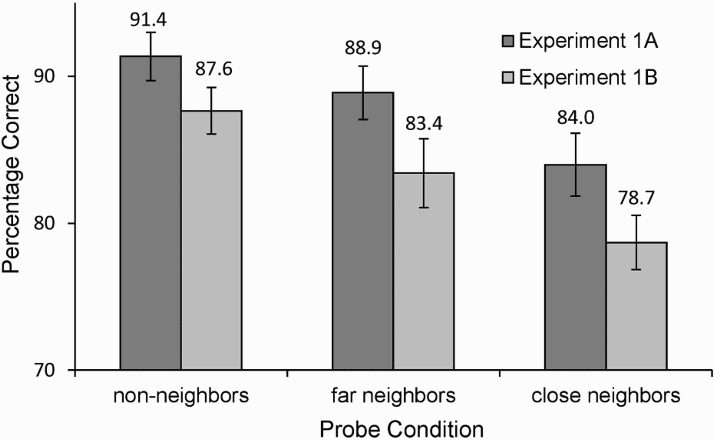
Accuracy data for the probe conditions in Experiments 1A and 1B. Error bars represent within-subject confidence intervals (95%).
The corresponding ANOVA for log-transformed RTs showed a significant effect of probe condition, F(2, 58) = 4.122, p = .021, η2p = .124, for Experiment 1A, and a nonsignificant effect for Experiment 1B, F(1.620, 40.492) = 2.227, p = .130, η2p = .082. Only the comparison between far and close neighbours in Experiment 1A reached significance in planned contrasts (far: 0.666 s, SD = 0.177; close: 0.692 s, SD = 0.169; see Table 2 for statistics and Table 3 for means).
Planned contrasts on log-transformed RT data for the different probe conditions for Experiments 1A and 1B
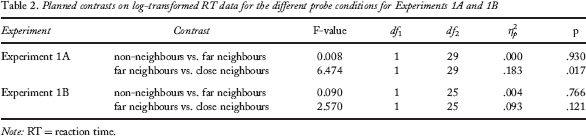
Note: RT = reaction time.
Mean RTs for Experiments 1A and 1B
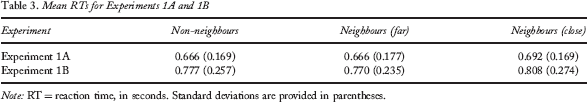
Note: RT = reaction time, in seconds. Standard deviations are provided in parentheses.
To test whether the distance effect is influenced by the metric distance or by the ordinal distance between items, we compared trials to each other, which differed in their ordinal distance, but were equal regarding their metric distances. For this purpose, we compared intrusion probes matching neighbours separated from the target item by a wide gap (80°) to intrusion probes matching non-neighbours separated from the target by two small gaps (40°). These two conditions differ only in one regard: There is an intervening item between the non-neighbour and the cued position in the non-neighbour small-gap condition [Experiment 1A (E1A): mean accuracy = 88.91% (SE = 1.488) and mean RT = 0.686 s (SE = 0.034); Experiment 1B (E1B): mean accuracy = 86.05% (SE = 1.907) and mean RT = 0.787 s (SE = 0.054)], but no intervening item in the neighbour wide-gap condition [E1A: mean accuracy = 88.89% (SE = 1.580) and mean RT = 0.666 s (SE = .032); E1B: mean accuracy = 83.42% (SE = 1.491) and mean RT = 0.770 s (SE = 0.046)]. Paired t tests for accuracy [E1A: t(29) = 0.011, p = .991; E1B: t(25) = 1.392, p = .176] and RTs [E1A: t(29) = 0.866, p = .394; E1B: t(25) = 0.759, p = .455] were nonsignificant. To provide direct support for the null hypothesis, we calculated the likelihood ratios, the Bayes factors, and the posterior probabilities in favour of the null hypothesis for both experiments (Masson, 2011). All of these indicators provide consistent support for the null hypotheses. These values are summarized in Table 4 for accuracy and Table 5 for RTs.
Likelihood ratio, Bayes factor, and posterior probability in favour of the null-hypothesis for accuracy in Experiments 1A and 1B
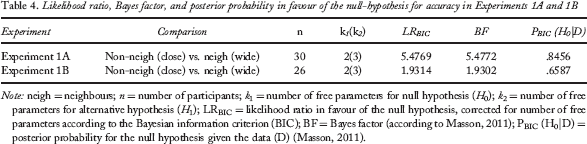
Note: neigh = neighbours; n = number of participants; k1 = number of free parameters for null hypothesis (H0); k2 = number of free parameters for alternative hypothesis (H1); LRBIC = likelihood ratio in favour of the null hypothesis, corrected for number of free parameters according to the Bayesian information criterion (BIC); BF = Bayes factor (according to Masson, 2011); PBIC (H0|D) = posterior probability for the null hypothesis given the data (D) (Masson, 2011).
Likelihood ratio, Bayes factor, and posterior probability in favour of the null-hypothesis for RTs in Experiments 1A and 1B
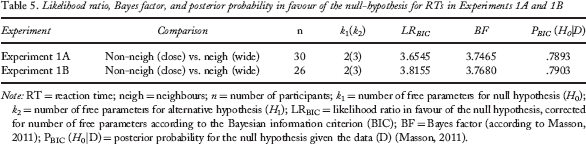
Note: RT = reaction time; neigh = neighbours; n = number of participants; k1 = number of free parameters for null hypothesis (H0); k2 = number of free parameters for alternative hypothesis (H1); LRBIC = likelihood ratio in favour of the null hypothesis, corrected for number of free parameters according to the Bayesian information criterion (BIC); BF = Bayes factor (according to Masson, 2011); PBIC (H0|D) = posterior probability for the null hypothesis given the data (D) (Masson, 2011).
Discussion
The spatial closeness of the target item to the location of origin of an intrusion probe affects performance in a recognition task. This finding supports the assumption that spatial context representations in WM overlap as a function of their metric distance. Experiment 1B replicated the effect of spatial distance on accuracy observed in Experiment 1A, thereby ruling out the possibility that this effect was caused by an inability to correctly identify the cued location.
Experiment 2
In Experiment 2, we tested the analogy between spatial and temporal transposition errors more directly: We used a recall task, rendering Experiment 2 more similar to serial-recall experiments finding temporal transposition errors. Furthermore, we trace more precisely the recall probability as a function of Euclidian distance between the cued location and the recalled item. Participants saw a memory display with five coloured stimuli, upon which one position was cued for recall. Participants selected the colour of the cued item from an array of 12 colours. Two kinds of mistakes can be distinguished: transpositions and extralist intrusions. Extralist errors reflect the selection of a colour not included in the memory display, whereas transpositions refer to the selection of another colour from the memory display. We expect that transpositions are more frequent than extralist errors, and that transpositions more frequently reflect the selection of items spatially close to the cued location than the selection of items further away.
In Experiment 2A, memory items were presented simultaneously, and in Experiment 2B they were presented sequentially. Sequential presentation served to test the possibility that spatial effects are caused by interference of spatially close items during encoding, rather than a spatial gradient of WM precision. For instance, perceptual crowding reduces the spatial resolution of individual items in dense arrays of multiple items, accounting for performance impairments in perception tasks (Cavanagh, 2004). If we find evidence for a spatial gradient with the sequential presentation, which removes any interference between items at encoding, the spatial distance effect cannot be attributed to encoding.
Method
Participants
Seventeen students (16 female, mean age = 23 years, range 20–30) participated in Experiment 2A, and 16 students (all female, mean age = 24 years; range: 21–30) in Experiment 2B.
Materials and procedure
The memory display consisted of five coloured squares placed in five cells of an invisible 9 × 9 grid on a grey background. The locations were selected at random with the constraint that summed horizontal and vertical distance between any two locations (i.e., their city-block distance) did not exceed 9 grid cells. The colours were selected at random from 12 colours (red, orange, yellow, brown, beige, olive, black, green, turquoise, blue, violet, pink), which were chosen to be easily distinguishable. Each colour square was surrounded by a thin white frame. The only difference between Experiments 2A and 2B was the presentation of memory items: In Experiment 2A, all five memory items were presented simultaneously for one second, and in Experiment 2B, memory items were presented each for 500 ms sequentially, so that only one item was visible on screen at any time. Following the presentation of the memory items, a grey screen with only the five white frames was shown for another second. After this retention interval, one of the frames was cued for recall by a thicker white frame for 100 ms, followed by a further one-second interval during which only the frames were visible. Then a palette of 12 colours was presented, arranged equidistantly on a virtual circle around the grid area. Participants had to select by a mouse click the colour that had been presented in the cued location. Feedback was provided visually for 500 ms and was followed by the instruction to press the space bar to continue. Another 500 ms after pressing the space bar the next trial began. Participants were instructed to answer as accurately as possible; speed was not emphasized. Figure 3 shows an example trial. Each participant completed two (Experiment 2A) or three (Experiment 2B) test sessions, including 24 practice trials prior to the first and 4 prior to the following session(s). The first test session comprised 400, the second 420 trials in Experiment 2A; in Experiment 2B all test sessions comprised 300 trials.
Flow of events of a trial from Experiment 2A. Stimuli were presented on a grey background, and the frames as well as the cue (thicker frame) were presented in white. In Experiment 2B, stimuli were presented sequentially, one after the other, with an intertrial interval of 500 ms. The consequence was that at any one time, only one stimulus was visible in the memory display. To view a colour version of this figure, please see the online issue of the Journal.
Results
On average, participants in Experiment 2A committed a transposition error on 17.6% (SD = 8.3), and an extralist intrusion on 13.0% (SD = 5.5) of trials. In Experiment 2B, transposition errors occurred in 23.6% (SD = 6.4) and extralist intrusions in 10.3% (SD = 4.8) of trials. Correctly answered trials were omitted from analyses. Analyses were conducted separately for both experiments.
The colour palette contained 12 colours, one corresponding to the correct response, four to possible transpositions, and seven to possible extralist errors. If error responses reflected selection of any of the 11 incorrect colours at chance, without any tendency to prefer transpositions over extralist errors, then we would expect transpositions and extralist errors to occur at a ratio of 4:7. To correct for the unequal proportions of the two kinds of errors expected by chance, we divided the observed percentage of each error category by the number of possibilities for that error category (i.e., 4 for transpositions, and 7 for extralist intrusions). The corrected percentage shows a clear preponderance of transposition errors (mean = 4.39, SD = 2.08) over extralist errors (mean = 1.85, SD = 0.78) in Experiment 2A. This difference was significant, t(16) = 5.058, p < .001. Experiment 2B replicated this pattern, revealing significantly more transposition errors (mean = 5.89, SD = 1.59) than extralist errors (mean = 1.47, SD = 0.69), t(15) = 12.802, p < .001.
To analyse whether the relative spatial distance between the cued location and the selected item affects performance, we calculated the Euclidian and the city-block distance between the cued item and the selected item for all transposition errors, resulting in 27 transposition distances for the Euclidian metric and 9 for the city-block metric.
Because on each trial the locations of the five memory items were chosen at random, the chances of errors in each distance class were not equal. To assess how frequently errors in each distance class, together with the class of extralist errors, would be expected by chance (that is, if error responses reflected no tendency towards any distance class or error class), we ran a simulation for each participant's error trials, choosing among the 11 possible errors (i.e., the 12 colours except the correct one) with equal probability. Repeating the simulation 5,000 times generated a distribution of proportions of errors in each class of errors, which reflects the expected distribution for each class of errors under the null hypothesis that, on error trials, selections occur at random. To correct the observed data for chance, we divided the observed proportions of errors in each class for each participant by the corresponding mean proportion from the simulations, resulting in the corrected proportion of errors per class (Figure 4 for Experiment 2A and Figure 5 for Experiment 2B; upper panels for observed data and simulated chance data, and lower panels for the corrected proportions of errors). 2
One reviewer asked why we controlled for chance by dividing the observed proportion of errors by the proportion expected by chance, rather than subtracting the latter from the former. We opted for a ratio rather than subtractive correction because the former is more conservative. For illustration, imagine a simplified scenario: Across all trials, a participant had 100 opportunities for committing a transposition error (i.e., there were 100 colours in the response panel that, if chosen, would constitute a transposition error), and 100 opportunities to commit an extralist intrusion. Imagine further that the person has a higher probability of committing a transposition error (p = .3) than committing an extralist intrusion error (p = .1), perhaps because list objects are more familiar than extralist items, regardless of their spatial proximity to the tested object. Let the transposition error opportunities be unevenly distributed across distances to the tested object's location: close (50), intermediate (30), and far (20). The person would be expected to commit the four kinds of errors with the following frequency: close (15), intermediate (9), far (6), extralist (10). By chance, the person would be expected to commit each kind of error with an equal probability, so that their expected frequencies are a constant proportion of the opportunities (i.e., p = .2): close (10), intermediate (6), far (4), and extralist (20). If we subtracted the frequencies expected by chance from the observed frequencies, we would obtain an artefactual spatial gradient: close (5), intermediate (3), far (2), extralist (–10). If instead we correct by calculating the ratio of observed to expected frequencies, we would obtain an elevated level of transpositions independent of distance: close (1.5), intermediate (1.5), far (1.5), extralist (0.5).
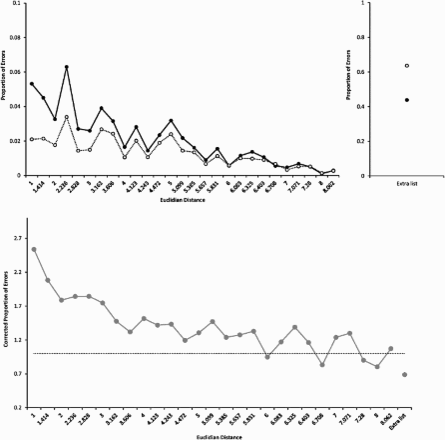
The graphs show the data for Experiment 2A. The x-axis shows the 27 Euclidian distance categories for transposition errors increasing from left to right. Extralist errors are shown separately in the upper right panel. The upper panel shows the raw data (black dots) and the simulated chance data (white dots). The lower panel shows the proportion of errors corrected for chance as a function of spatial distances for transpositions and for extralist errors. The black dashed line in the lower panel represents performance predicted by chance.
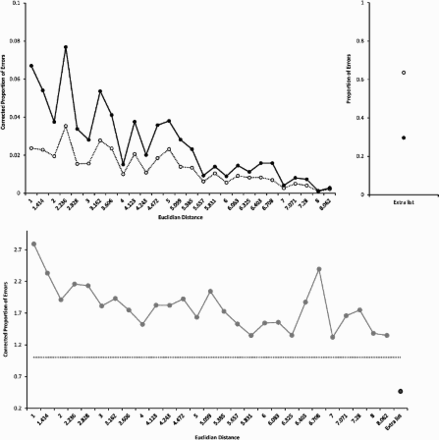
The graphs show the data for Experiment 2B. The x-axis shows the 27 Euclidian distance categories for transposition errors increasing from left to right. Extralist errors are shown separately in the upper right panel. The upper panel shows the raw data (black dots) and the simulated chance data (white dots). The lower panel shows the proportion of errors corrected for chance as a function of spatial distances for transpositions and for extralist errors. The black dashed line in the lower panel represents performance predicted by chance.
We tested three linear mixed-effect regression models to predict the corrected proportions of transposition errors by their transposition distance. 3
We used linear regression as a proxy to capture the hypothesized monotonic trend without committing to a particular function form, for which we see no theoretical basis.
The best fit, as reflected by the smallest BIC value, was obtained for the model relying on Euclidian distance only (see Table 6). We calculated the p-values for the predictor (Euclidian distance) of this model, separately for Experiments 2A and 2B. In both cases, the p-values were .001 for the fixed factor Euclidian distance, indicating that Euclidean distance accounts for a significant share of the variance in corrected error proportions. Extralist errors occurred significantly less than predicted by chance, which was confirmed by a significant t test, comparing the corrected proportion of extralist errors to chance performance (1), t(16) = –6.041, p < .001 for Experiment 2A and t(15) = –17.482, p < .001 for Experiment 2B.
BIC and AIC values for the six models examined for Experiments 2A and 2B
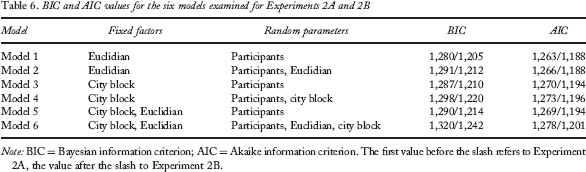
Note: BIC = Bayesian information criterion; AIC = Akaike information criterion. The first value before the slash refers to Experiment 2A, the value after the slash to Experiment 2B.
Discussion
Our results show that when items in WM are cued for recall by their spatial location, they are more likely to be transposed with close than with far neighbours, as shown by the spatial transposition gradients in Figures 4 and 5, lower panels. The spatial gradient was obtained for Experiments 2A and 2B, thereby ruling out the explanation that the gradient was caused by interference during encoding. As such, our results contradict the conclusions of Emrich and Ferber (2012). In their experiments with simultaneous displays, they found a higher prevalence of transposition errors when items were presented in closer spatial proximity, and they attributed this effect to competition between items at encoding. In their third experiment, they intended to rule out the possibility that the distance effect is a WM phenomenon by comparing sequential and simultaneous item presentation conditions to each other. Their results showed fewer transposition errors for sequential item presentation than for simultaneous presentation. However, they did not manipulate spatial distance in this experiment. Moreover, their sequential presentation split the memory display into two halves at the largest gaps, thereby leaving the smallest distances, which should create the most competition at encoding, unchanged. Therefore, the advantage for sequential presentation was most likely due to other factors than the reduction of competition at encoding. Hence, the findings of Emrich and Ferber (2012) do not rule out an effect of spatial proximity arising from spatially overlapping memory representations. Our finding of a spatial gradient for sequentially presented memory items provides compelling evidence that the transposition gradient is not caused merely by interference at encoding.
The spatial gradient was better described as a decline of transposition likelihood with increasing Euclidean distance, rather than city-block distance. In addition, transposition errors occurred more often, and extralist errors occurred less often, than would be expected by random guessing on error trials, consistent with the observation of Bays et al. (2009) that a substantial proportion of errors in visual WM tasks reflect retrieval of the wrong memory item, rather than random guessing.
General Discussion
Cue-based retrieval is among the best established principles in memory research (Surprenant & Neath, 2009), and our data show that visual WM is no exception. Similarity between retrieval cues is a major cause of erroneous retrieval because competing retrieval candidates are less distinctive if they are associated to overlapping cues (Brown et al., 2007). When memory items are displayed in different locations, and location cues are used to identify the item to be retrieved, then spatial location is the context cue for retrieval. As a consequence, spatial proximity plays the role of cue overlap and as such influences the likelihood of confusions between memory contents. These confusions could occur for whole objects or for individual object features to be retrieved at test. A recent study by Bays, Wu, and Husain (2011) showed that transposition errors occur independently for individual features of the same object. This observation is best explained by assuming that confusions occur during retrieval, such that each time an object's feature is cued for retrieval by the object's location, there is an independent chance of confusing the requested feature with the corresponding feature of a spatially close object.
More specifically, our results show that metric distance, not just ordinal distance, affects the likelihood of confusions between items bound to different locations. This finding is analogous to the finding that temporal distance, not just ordinal distance, affects retrieval accuracy in many, though not all, paradigms testing memory for serial order (Morin et al., 2010).
In sum, retrieval for recall and for local recognition is influenced by contextual cues, and these cues overlap, so that they cue, to some extent, other items than the correct one. Depending on which dimension serves to discriminate the cues for the target item from cues to other, competing items, the relevant overlap can occur in time, in space, or in any other dimension. As a consequence, transpositions along the dimension that discriminates retrieval cues are an important source of error in WM. This source so far plays no role in an influential model of visual WM, the slot model (Luck & Vogel, 1997; Zhang & Luck, 2008, 2011). This model assumes that each representation of an item either is stored in one of a limited number of discrete slots, or else is completely lost to WM. The slot model has frequently been applied to paradigms testing memory for a single item identified by its spatial position (Zhang & Luck, 2008, 2011). In these applications, all responses not reflecting memory for the item in the probed position have been regarded as random guesses. Our results show that when items are probed by their spatial location, a substantial number of spatial transposition errors occur. Transposition errors result in responses that do not reflect information about the probed item but instead reflect information about another item of the memory display (e.g., people report the colour of a neighbour of the probed item, rather than the colour of the probed item). These responses would be misattributed to random guessing by the slot model. Errors reflecting information about other items than the probed one have already been reported by Bays et al. (2009). Those authors have not identified the source of this kind of error. Here we showed that erroneous reports reflecting nonprobed memory items arise systematically from the spatial imprecision of memory for each item's location. As a consequence of misattributing such errors to random guessing, applications of the slot model to paradigms testing memory for items in specific locations underestimate the capacity of visual WM.
One way to augment the slot model to incorporate transposition errors is to assume that every item stored in a slot is stored with a certain degree of imprecision not only for the feature to be recalled (e.g., colour), but also for the feature that serves as a retrieval cue (e.g., spatial location). Retrieval of the content of a slot could then be described as a two-stage retrieval process (cf. Henson, 1998). In the first stage, the spatial location cue would be matched against the spatial features of the items stored in every slot. The slot with the highest match would be selected for read-out. In the second stage, the to-be retrieved feature (e.g., colour) would be reported from the selected slot according to that feature's precision. Transposition errors occur in the first stage when, due to the imprecision of spatial information in the slots, the wrong slot is selected for read-out.
Footnotes
Acknowledgements
This research was supported by a grant from the Swiss National Science Foundation (Project 100014_126766/1). We thank Iliana Karipidis and Matthias Hartmann for collecting the data.