
Abstract
Recent research has found a positive relationship between people's working memory capacity (WMC) and their speed of category learning. To date, only classification-learning tasks have been considered, in which people learn to assign category labels to objects. It is unknown whether learning to make inferences about category features might also be related to WMC. We report data from a study in which 119 participants undertook classification learning and inference learning, and completed a series of WMC tasks. Working memory capacity was positively related to people's classification and inference learning performance.
In classification tasks, people learn to assign category labels to objects that vary on one or more features (Markman & Ross, 2003). In a second type of category learning, termed inference learning, people instead learn to make inferences about the features of category items. In inference learning tasks, participants are typically presented with a category label, along with an object that has one or more features missing. Participants are to determine the value of the missing feature. Despite being less extensively studied, learning to make inferences about category features is a key function of categorization that allows people to make predictions about the characteristics of newly encountered category members (Markman & Ross, 2003).
Despite the surface similarities between inference and classification tasks, some researchers have suggested that the two tasks may be approached in psychologically distinct ways (e.g., Love, Medin, & Gureckis, 2004; Yamauchi & Markman, 1998, 2000; and see Markman & Ross, 2003, for a review). It has been suggested that during classification learning, people may seek simple rules that differentiate categories based on single features, whereas during feature-inference tasks, people may develop prototypical representations so as to gain an understanding of the internal structure of categories (Markman & Ross, 2003; Yamauchi & Markman, 1998, 2000). In support, Yamauchi and Markman (1998) found that participants who performed inference learning were more likely than classification learners to make prototype-consistent inferences about category features.
There has been recent interest in how working memory (WM), the system responsible for the storage and processing of active information, relates to category learning (Blair et al., 2009; Craig & Lewandowsky, 2012; DeCaro, Carlson, Thomas, & Beilock, 2009; DeCaro, Thomas, & Beilock, 2008; Erickson, 2008; Lewandowsky, 2011; Lewandowsky, Yang, Newell, & Kalish, 2012; Sewell & Lewandowsky, 2012). One reason for this growing interest is that the relationship between working memory capacity (WMC) and categorization may have implications for theories of both categorization and working memory capacity. For example, in some multiple-systems theories of categorization (Ashby, Alfonso-Reese, Turken, & Waldron, 1998; Ashby & O'Brien, 2005; DeCaro et al., 2008), WMC is thought to be involved in some category learning tasks but not in others. Due to its declarative nature, some have suggested that WMC might only assist with tasks that can be solved by verbalizable rules (Ashby et al., 1998; Ashby & O'Brien, 2005; DeCaro et al., 2008). Conversely, it has been suggested that WMC might not help with categorization that requires more abstract processing of stimuli based on their “family resemblance”. Instead, in such multiple-systems theories, family-resemblance-type classification is said to be aided by nondeclarative, procedural, memory systems that categorize items by forming associations between stimuli and categories. In support of this contrasting relationship between WMC and different types of categorization tasks, Waldron and Ashby (2001) found that performing a WM task at the same time as a categorization task inhibited the learning of classification structures that required learning simple rules but did not inhibit the learning of structures that required integrating information across multiple dimensions. In light of suggestions that classification learning tasks lead to more rule-based processing than inference learning tasks do (Markman & Ross, 2003; Yamauchi & Markman, 1998, 2000), multiple-systems theories should predict that WMC will not be associated with inference learning as it is with classification learning.
Given that the distinction between rule-based and family-resemblance processing meshes well with the sometimes presumed psychological differences between inference and classification tasks, it follows that an examination of WMC may provide an opportunity to further differentiate between these two types of task. The aim of the present study was to determine whether WMC is related to the speed of inference learning in the same way as it is to classification learning, or whether its relationship to the two tasks might differ.
Method
One hundred and nineteen members of The University of Western Australia campus community (mean age = 21.23 years, number of females = 82) completed two 1-hour experimental sessions. A categorization task was completed in the first session, 1 and four WMC tasks were completed in the second session. Tasks were completed on a Windows-based computer using a program created using MATLAB, with the aid of the Psychophysics Toolbox (Brainard, 1997; Pelli, 1997). Participants received course credit or $20 remuneration for the two hours of testing.
A second, unrelated, categorization task was completed immediately following the first task.
Categorization task
Design
In the categorization task, participants were required to classify a series of stimuli into one of two categories, A or B. The stimuli varied on four binary features, as shown in Table 1. Eight of these items were training items, and eight were test items. There were two phases; a training phase and an inference, or feature-completion, phase. 2 During training, perfect categorization accuracy could be obtained using a rule strategy (RU) or a correlated-cues strategy (CC). During the feature-completion phase, knowledge of the CC strategy, but not the RU strategy, allowed for above-chance performance.
Participants also completed a recognition phase and a transfer phase at the end of training. During these phases, participants were presented with training and test items. During recognition, participants were asked to identify which items they had seen during the training phases. During transfer, participants classified all items. The data from the recognition phase were analysed but showed few effects of interest. Results from the transfer analysis are reported briefly in the discussion.
Category structure for training and test items, with item labels used during test phases
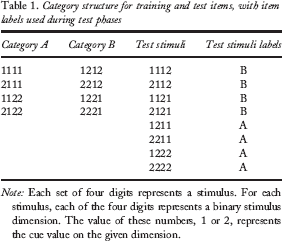
Note: Each set of four digits represents a stimulus. For each stimulus, each of the four digits represents a binary stimulus dimension. The value of these numbers, 1 or 2, represents the cue value on the given dimension.
The RU strategy is a one-dimensional rule on the second stimulus dimension. If the value is one, the item is in Category A, and if the value is two, the item is in Category B. The CC strategy is a correlated-cues strategy between the third and fourth dimensions: When the third and fourth dimensions have the same value, the item is in Category A; when the values differ, the item is in Category B.
Apparatus and procedure
The stimuli were presented as rockets, with the four binary features corresponding to the size of the (a) nose, (b) porthole, (c) tail, and (d) wings of the rockets. During the training phase, participants were presented with training items, one at a time. Participants were required to categorize each item into Categories A or B by using the “z” or “/” keys. During training, feedback (“CORRECT” or “WRONG”) was presented for 1.3 s. Participants completed 32 blocks of training. Each item was presented once per training block.
On feature-completion trials, participants were presented with a test item displaying three of the four stimulus dimensions, along with the category label of the rocket. The category label assigned to each item corresponded to the test labels shown in Table 1. Participants were required to determine the value of the missing dimension by pressing the “z” or “/” key.
Feature-completion blocks were presented after the eighth training block, and subsequently after every fourth training block. At each of these instances, a set of two feature-completion blocks was presented, the first with the fourth stimulus dimension as the missing feature, and the second with the third stimulus dimension as the missing feature. Each test item, with the given feature removed, was presented once per feature-completion block. After each feature-completion block, participants were presented with proportion correct during the preceding block.
Participants were placed into one of two randomization groups, Group A (n = 27) or B (n = 92). 3 To reduce method variance, participants within a randomization group were presented with an identical randomized trial sequence and an identical randomized association between the conceptual and visual stimulus dimensions. For Randomization Group A, Stimulus Features 1 to 4 corresponded to the nose, porthole, tail, and wings of the rocket, respectively. For Randomization Group B, Stimulus Features 1 to 4 corresponded to the porthole, wings, tail, and nose, respectively. Category response keys were randomly counterbalanced across participants.
Randomization groups were unbalanced because of a task error that affected some participants from Group A. The data from these participants were excluded as the data were not usable.
Working memory tasks
To minimize error variance associated with specific WM tasks, participants completed a battery of WMC tasks (Lewandowsky, Oberauer, Yang, & Ecker, 2010). Participants completed four WM measures, in the following order: a memory updating (MU) task, an operation span (OS) task, a sentence span (SS) task, and a spatial short-term memory (SSTM) task.
Memory updating (MU) task
The MU task was designed to test participants' ability to store and update information in their WM. There were two variants of the MU task, termed MUA (n = 43) and MUB (n = 76). 4 In the MUA task, four words were presented for 6 s in four frames, presented horizontally on the screen. New words were then presented in the frames, one at a time, in a random order, for 2 s each. After a varying number of words, probe words were presented in the frames, one at a time. Probe words were signalled by a question mark. Participants were required to judge whether each probe word was the last word presented in that frame. On each trial, two of the probes were the last words presented in the frame. The correct answer for these probes was yes. One probe was a new word, and one probe had been presented, but then updated. The correct answer for these probes was no.
The two MU variants were used as a manipulation for a separate study; see Hanich (2009) for details.
In the MUB task, five frames were presented. Additionally, on each trial a deletion cue, “X”, was presented in one frame. After the presentation of a deletion cue, no more words appeared in the corresponding frame for the remainder of the trial, nor was memory for the frame tested. There were four probe types in the MUB variant: an old word, a new word, a word that had been updated, and a word that was presented previously in the deletion frame. Participants completed 42 and 49 trials of the MUA and MUB tasks, respectively.
Operation span (OS) task
Participants were presented with a series of equations (e.g., “4 + 3 = 7”), followed by a to-be-remembered consonant. Participants were instructed to judge whether each equation was true or not and to remember each consonant. At the end of each trial, participants were prompted to recall the to-be-remembered letters in the order presented. Set sizes ranged from 4 to 8 letters. Participants completed 15 trials, three trials of each set size.
Sentence span (SS) task
The SS task was almost identical to the OS task, except that instead of judging equations, participants judged whether sentences were true or not.
Spatial short-term memory (SSTM) task
On each trial, black circles were presented, one by one, within a 10-by-10 grid. Participants were instructed to identify the locations that the circles appeared. Set sizes ranged from 2 to 6 dots, with six trials for each set size. Scoring was based on spatial relations of the dots, not the absolute grid locations
Results
Data from 10 participants who failed to attend both sessions were removed. Scores on the WMC tasks were calculated as the mean proportion correct across trials. Because scores differed significantly between the MUA (M = .84, SD = .10) and MUB tasks (M = .76, SD = .08), t(107) = 4.40, p < .001, MUA scores were reduced by the difference in means for the MUA and MUB tasks (i.e., .08) before being combined into a single MU score.
Scores for one participant were excluded as their averaged z-standardized WMC score was more than three standard deviations below the mean (SDs = −3.76). Descriptive statistics for the WMC tasks are shown in Table 2.
Means, standard deviations, skewness, kurtosis, and standardized regression weights for the memory updating, operation span, sentence span, and spatial short-term memory tasks
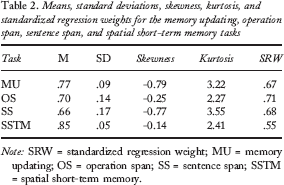
Note: SRW = standardized regression weight; MU = memory updating; OS = operation span; SS = sentence span; SSTM = spatial short-term memory.
Category learning
Figure 1 shows mean performance error across training. Training accuracy was very high. Increases in error at Blocks 9, 13, 17, 21, and 29 may have reflected strategy reevaluation following feature completion trials.
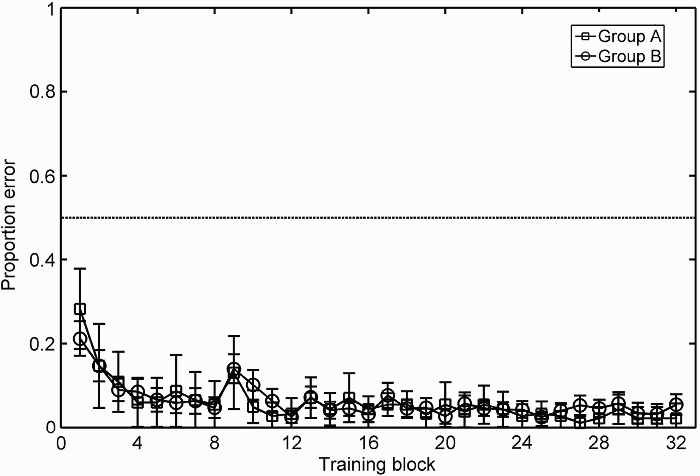
Mean proportion of error scores across training blocks for the two randomization groups (A and B). Error bars represent 95% confidence intervals. The dotted line indicates chance performance.
For each participant, scores were averaged across Blocks 1 to 8, 9 to 16, 17 to 24, and 25 to 32. A cube-root transformation was applied to these proportion-error scores to correct for negative skew. Means (and standard deviations, SDs) for the transformed group blocks in order were: .40 (.17), .35 (.15), .29 (.17), and .26 (.17). A 2 × 4 between–within analysis of variance (ANOVA) revealed a significant effect of training block group on cube-root-transformed proportion of error, F(3, 318) = 18.34, MSE = .02, p < .001, ηp2 = .28, reflecting the improvement in training performance across blocks. There was no significant effect of randomization group, F(1, 106) = 0.39, MSE = .06, p > .1, and no significant interaction, F(3, 318) = 1.13, MSE = .02, p > .1.
Feature completion
Figure 2 shows the mean proportion of error for feature-completion blocks across training. Proportion of error steadily decreased across training. Feature-completion scores at latter blocks appeared bimodal. The upper and lower modes probably represented whether or not participants detected the CC strategy. A nonparametric Friedman's ANOVA was conducted with feature-completion scores at each block included as seven levels for the independent variable. Error significantly decreased across training, χ2(6) = 61.58, p < .001.
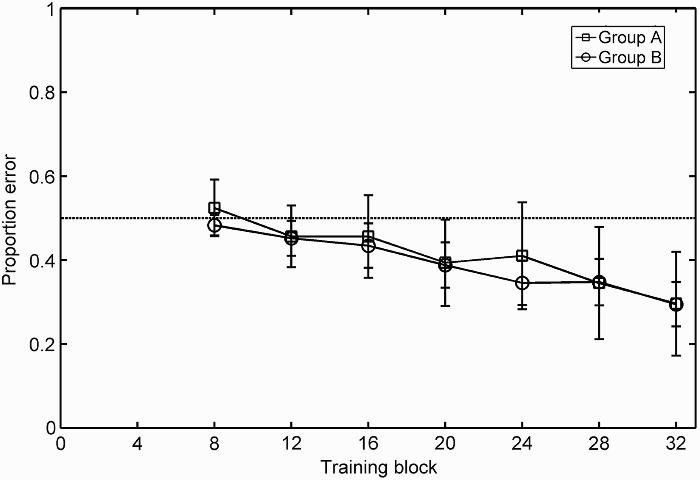
Mean proportion error at the seven sets of feature-completion blocks for the two randomization groups, A and B. Each set of feature-completion blocks includes scores averaged across two separate blocks, one in which the third dimension was missing, and one in which the fourth dimension missing. Feature-completion sets are presented relative to their location in the training sequence. Each feature-completion set occurred directly after the corresponding training block. Error bars represent 95% confidence intervals. The dotted line represents chance performance.
Relationship between WMC and categorization
Structural equation modelling (SEM) was used to explore the relationship between WMC and category-learning performance, WMC and feature-completion performance, and category-learning and feature-completion performance. To foreshadow the results, WMC and category-learning error and WMC and feature-completion error were found to be negatively related. A positive relationship between category-learning and feature-completion error straddled the boundary of significance.
Four goodness-of-fit tests were used to asses each model: χ2, comparative fit index (CFI), root mean square error of approximation (RMSEA), and standardized root mean square error residual (SRMR) or weighted root mean square residual (WRMR), depending on the estimation type used. Common guidelines suggest that a good model fit is indicated by nonsignificant χ2, a CFI of greater than .95, an RMSEA of less than .08 (ideally less than .06), an SRMR of less than .08, and a WRMR of less than .9 (Schreiber, Stage, King, Nora, & Barlow, 2006). Fit statistics are shown in Table 3.
Fit statistics for the measurement models and structural models
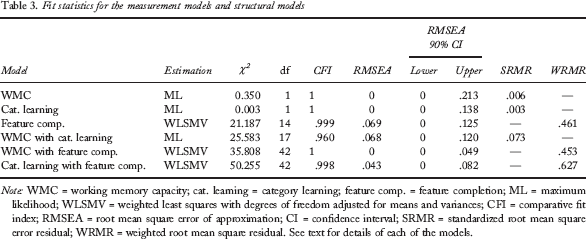
Note: WMC = working memory capacity; cat. learning = category learning; feature comp. = feature completion; ML = maximum likelihood; WLSMV = weighted least squares with degrees of freedom adjusted for means and variances; CFI = comparative fit index; RMSEA = root mean square error of approximation; CI = confidence interval; SRMR = standardized root mean square error residual; WRMR = weighted root mean square residual. See text for details of each of the models.
A WMC, a category-learning, and a feature-completion measurement model were created. As shown in Table 3, all three measurement models fit well. For the WMC measurement model, the OS, SS, SSTM, and MU tasks were treated as manifest variables that loaded onto a latent variable termed WMC. As in Lewandowsky et al. (2010), the error terms on the OS and SS tasks were set to be correlated to improve the fit and to account for the common-method variance shared between the two tasks (standardized estimate .56, p < .001). Standardized regression weights for the four WMC tasks are shown in Table 2.
To create a category-learning measurement model, the four cube-root-transformed grouped block training scores were treated as manifest variables, which loaded onto a single category-learning latent variable, category learning (error). To account for autocorrelations across training blocks, error terms for the Blocks 1 to 8 and Blocks 9 to 16 manifest variables were set to be correlated (standardized estimate .21, p < .05). Standardized regression weights for the category-learning manifest variables, in order of blocks, were, .37, .53, .81, and .58.
Next, the feature-completion measurement model was created. As the feature-completion scores appeared bimodal, participants were placed into low or high error groups depending on whether or not they performed significantly better than chance at each feature-completion phase. Participants were placed in the low error group if their error score fell below .25. These binary scores were used as manifest variables that loaded on to a single latent variable, termed feature completion (error). Due to the use of dichotomous variables, weighted least mean squares with degrees of freedom adjusted for means and variances (WLSMV) estimation was used. Standardized regression weights for the feature-completion manifest variables, in order of blocks, were .60, .78, .96, .97, .98, .98, and .98.
Three structural models were created. For the first model, the WMC and category-learning latent variables were set to covary. The model is shown in Figure 3. The fit of the model was reasonable. The correlation between the category-learning and the WMC latent variables was significant, −.26, p < .05.
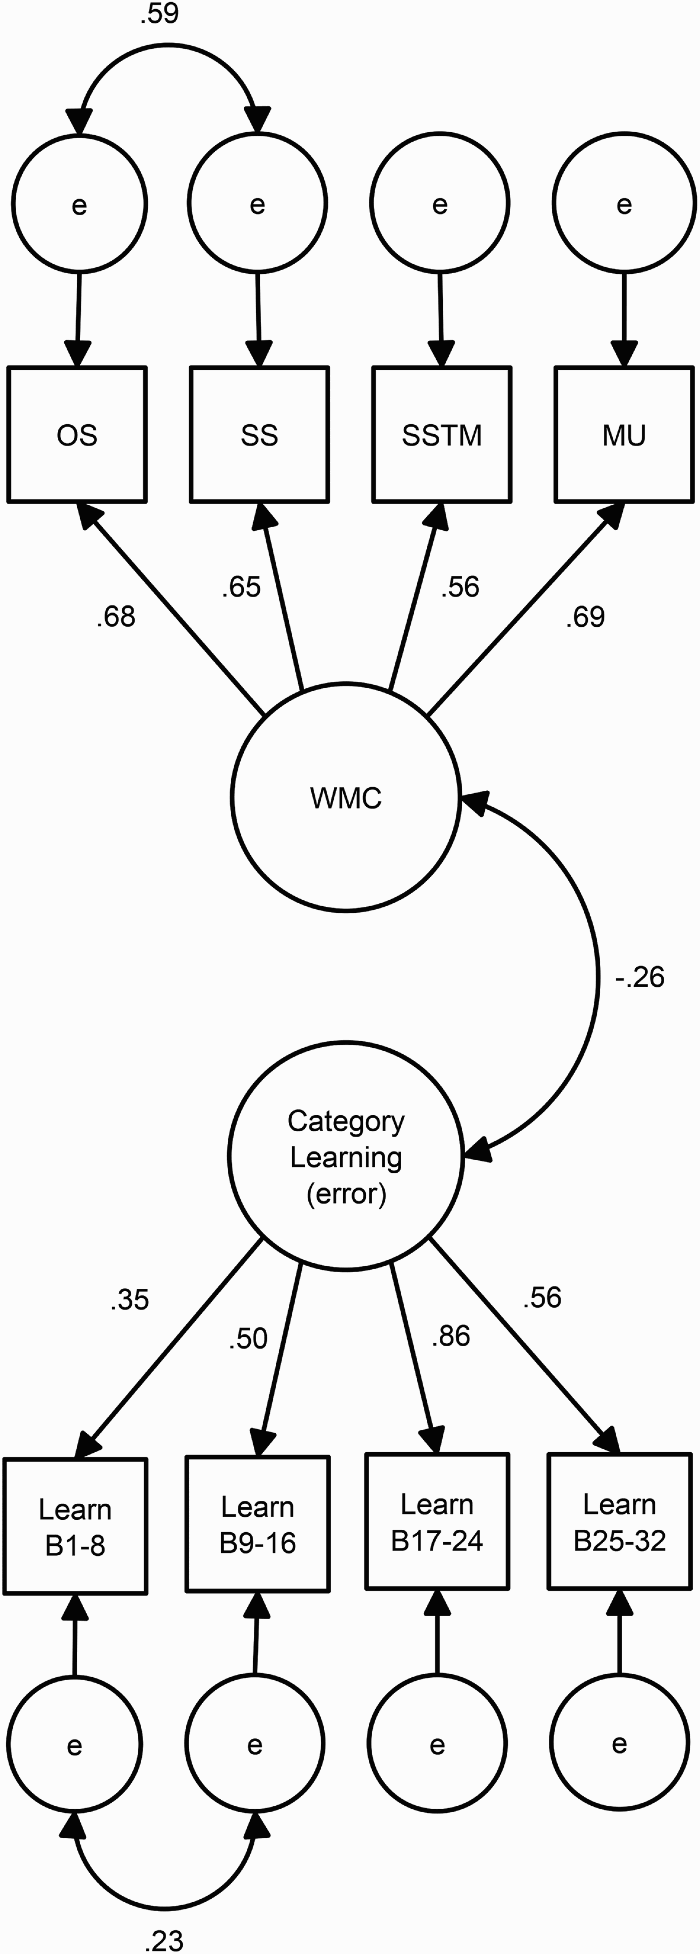
Structural model showing relationship between working memory capacity (WMC) and category-learning—category learning (error)—latent variables. Manifest variables for the WMC latent factor are operation span (OS), sentence span (SS), spatial short-term memory (SSTM), and memory updating (MU) tasks. Manifest variables for the category-learning latent factor are cube-root-transformed averaged proportion of error scores across Blocks 1 to 8, 9 to 16, 17 to 24, and 25 to 32. The fit of the model was reasonable, χ2(17) = 25.583, p > .05, CFI = .960, RMSEA = .068 (90% CI: [0, .120]), SRMR = .073. Relationship between WMC and category-learning latent variables was significant (p < .05).
For the second structural model, the WMC and feature-completion latent variables were set to covary. The model is shown in Figure 4. The model fit well, and there was a significant, negative correlation between the WMC and the feature-completion latent variables, −.31, p < .01.
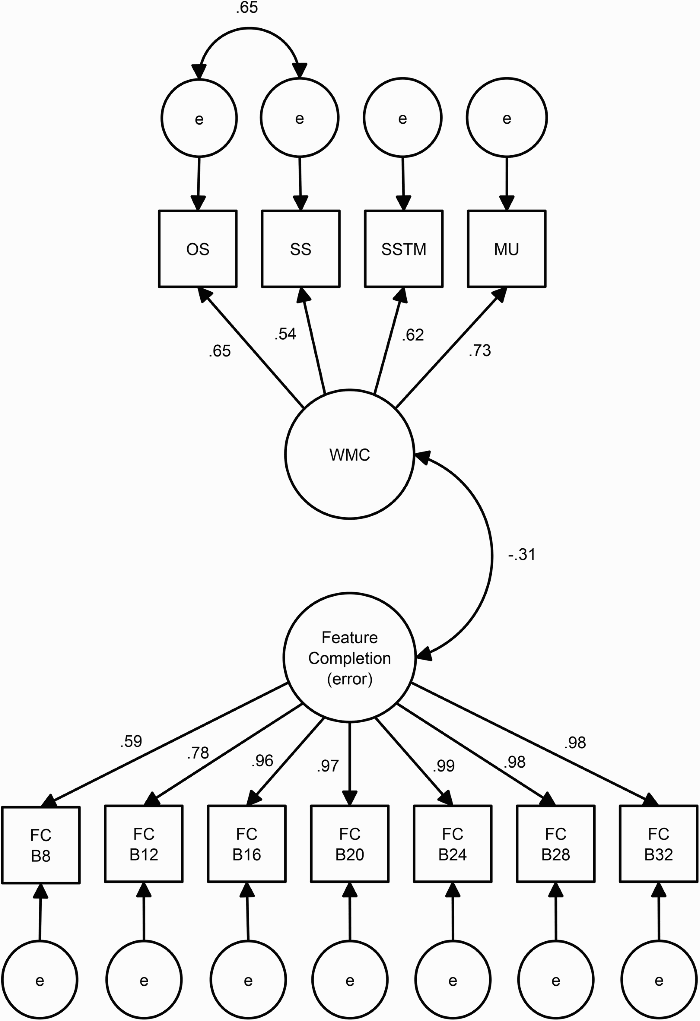
Structural model showing relationship between working memory capacity (WMC) and feature-completion—feature completion (error)—latent variables. Manifest variables for the WMC latent factor are operation span (OS), sentence span (SS), spatial short-term memory (SSTM), and memory updating (MU) tasks. Manifest variables for the feature-completion latent variable are dichotomous performance scores on the seven feature-completion blocks. Scores were dichotomized based on whether participants scored significantly above chance on the feature-completion trials at each phase (p < .05, one-tailed). The fit of the model was good, χ2(42) = 35.808, p > .05, CFI = 1.0, RMSEA = 0 (90% CI: [0, .049]), WRMR = .453. The relationship between the WMC and feature-completion latent variables was significant (p < .01).
For the final structural model, the category-learning and feature-completion latent variables were set to covary. WLSMV estimation was used. The model is shown in Figure 5. The fit of the model was good. The correlation between category-learning and feature-completion performance straddled the boundary of significance, .25, p = .053.
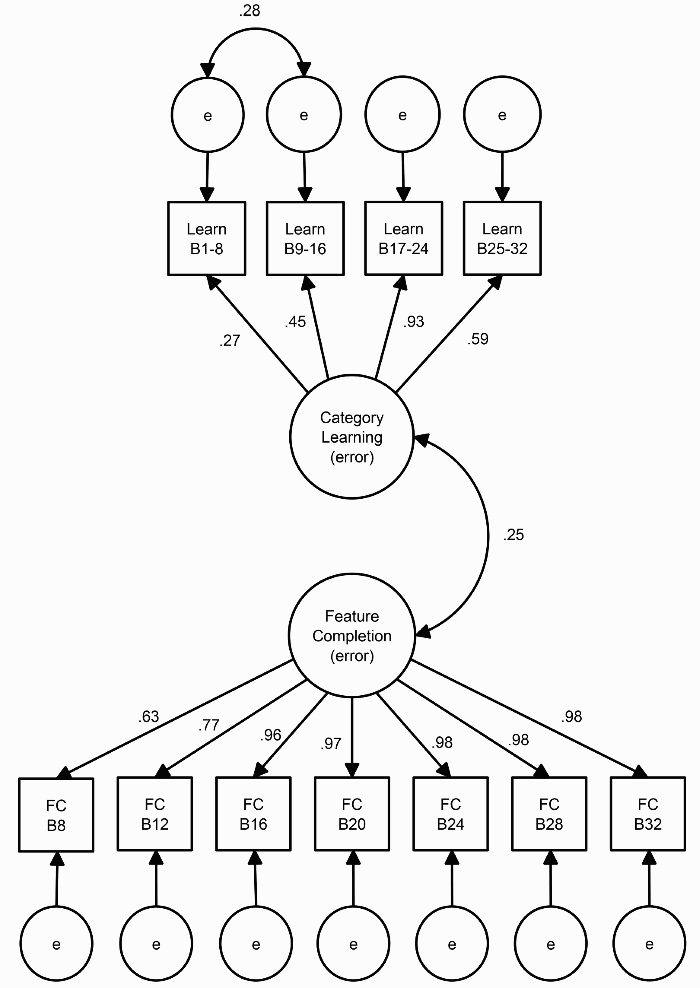
Structural model showing relationship between category-learning—category learning (error)—and feature-completion—feature completion (error)—latent variables. Manifest variables for the category-learning latent factor are cube-root-transformed averaged proportion of error scores across Blocks 1 to 8, 9 to 16, 17 to 24 and 25 to 32. Manifest variables for the feature-completion latent variable are dichotomous performance scores on the seven feature-completion blocks. Scores were dichotomized based on whether participants scored significantly above chance on the feature-completion trials at each phase (p < .05, one-tailed). The fit of the model was good, χ2(42) = 50.255, p > .05, CFI = .998, RMSEA = .043 (90% CI: [0, .082]), WRMR = .627. The relationship between the category-learning and feature-completion latent variables bordered on significance (p = .053).
Discussion
The present study showed that WMC was positively related to the two category-learning tasks: classification learning and inference learning. The association between WMC and inference-learning performance is a novel and noteworthy result, notwithstanding the small magnitude of the correlation. The parallel association between WMC and classification learning is consistent with results of previous studies, although its magnitude was also smaller here than observed previously (Craig & Lewandowsky, 2012; DeCaro et al., 2009; Lewandowsky, 2011; Lewandowsky et al., 2012; Sewell & Lewandowsky, 2012). The smaller magnitude probably resulted from ceiling effects on the classification-learning task. As a single-dimensional rule allowed for perfect performance, many participants were quickly reaching near-perfect accuracy, thereby restricting variance and curtailing the magnitude of the correlation.
The fact that the correlations involving WMC were of a similar magnitude for inference learning and classification learning suggests that there may be a common set of processes linking WMC to both tasks. Further, the existence of such mechanisms would suggest that the relationship between WMC and category learning reflects more than just that higher general processing abilities leads to better learning. The data of Lewandowsky (2011) provide some insight into what mechanisms might link WMC and category learning. Based on modelling, Lewandowsky (2011) proposed that WMC assists with classification learning by aiding with the formation of associations between category exemplars and category labels, rather than by some other mechanism, such as enhanced memory for exemplars. We therefore tentatively propose that WMC may similarly support inference learning by facilitating the formation of associations. At the same time, the fact that the correlation between inference learning and classification learning in our study was low—and only borderline significant—points to the need for further exploration of the differences between those tasks. Whatever those differences might turn out to be, we now know that the involvement of WM is not one of them.
One implication of the present results is a lack of support for multiple-systems theories of categorization (Ashby et al., 1998; Ashby & O'Brien, 2005). In multiple-systems theories, WMC is thought to support rule-based, but not family-resemblance-type, classification. Given that inference learning tends to lead to family-resemblance-type categorization (Markman & Ross, 2003; Yamauchi & Markman, 1998, 2000), then multiple-systems theories should predict no relationship between inference learning and WMC. In contrast to these predictions, inference learning was related to WMC.
Our study adds to the growing body of work exploring the relationship between WMC and categorization (Blair et al., 2009; Craig & Lewandowsky, 2012; DeCaro et al., 2009; De Caro et al., 2008, Erickson, 2008; Lewandowsky, 2011; Lewandowsky et al., 2012; Sewell & Lewandowsky, 2012). Across all types of category learning explored to date, WMC has been associated with faster learning (Craig & Lewandowsky, 2012; DeCaro et al., 2009; Lewandowsky, 2011; Lewandowsky et al., 2012; Sewell & Lewandowsky, 2012). The present results extend that generality to inference-learning environments.
One known exception to the pervasive role of WM in categorization is the choice of classification strategy. Using a similar type of task, Craig and Lewandowsky (2012) found no association between WMC and categorization strategy choice. Likewise, an analysis of strategy use in the present study revealed that the WMC latent variable was not related to participants' choice of the CC (n = 21) over the RU (n = 66) strategy at the end of training, r = .22, p > .1. It remains to be seen whether there are other categorization problems or tasks in which strategy choice is related to WMC.