
Abstract
Estimation patterns in the number line task are usually interpreted to indicate the (logarithmic or linear) nature of the underlying mental number line. However, indicators of the to-be-achieved linear representation may also be confounded with task requirements or strategies to achieve optimal task performance. In this study, we dissociated correct task performance from indices of a linear representation. Therefore, we designed an experiment in which adults and first graders had to learn number-to-space mappings of nonlinear functions. For adults, we found better fits of the corresponding functions than a linear function after just a few minutes of training. For most first graders, estimation patterns were not fitted better by a logarithmic function when they had to learn a logarithmic layout. Thus, estimation patterns produced in the number line estimation task do not necessarily allow for valid inferences on the underlying representation of number magnitude.
The assumption of number magnitude to be represented along an internal mental number line is a widely agreed metaphor of the human number magnitude representation (e.g., Dehaene, Dupoux, & Mehler, 1990; Gallistel & Gelman, 1992; Restle, 1970). However, there is an ongoing debate about the actual layout by which number magnitude is mapped upon the mental number line (MNL). There are currently two competing models on this issue—one claiming a linear mapping of numbers on the mental number line (e.g., Brannon, Wusthoff, Gallistel, & Gibbon, 2001; Gibbon & Church, 1981) and another one assuming a logarithmic compression of the mental number line (e.g., Dehaene, 1992, 2001; Pica, Lemer, Izard, & Dehaene, 2004).
Siegler and Opfer (2003) challenged the view of a single fixed linear or logarithmically compressed representation of number magnitude in humans as they presented evidence suggesting that the representation of number magnitude changes from logarithmic to linear with increasing age and experience (see also Booth & Siegler, 2006, 2008; Laski & Siegler, 2007; Opfer & Siegler, 2007; Siegler & Booth, 2004). Usually, this representational change is assessed using the number line estimation task (NLET). In this task, participants are given a hypothetic number line with fixed start and end points (e.g., 0 and 100), and they are asked to mark the correct spatial position of a given number on this line. Participants’ estimation patterns are then fitted by a linear or a logarithmic function. Superior fit (e.g., descriptive adequacy) by one of these two functions is then interpreted to indicate the layout of the underlying mental representation being either linear or logarithmic.
However, this interpretation was questioned recently. Moeller, Pixner, Kaufmann, and Nuerk (2009; see also Helmreich et al., 2011; Moeller & Nuerk, 2011, for an opinion paper summarizing the arguments) suggested that the seemingly logarithmic estimation pattern of young children can be also accounted for by two-linear models reflecting distinct representations of single- and two-digit numbers (see also Ebersbach, Luwel, Frick, Onghena, & Verschaffel, 2008, for a first two-linear account differentiating familiar and unfamiliar numbers). However, while Moeller et al. (2009) still interpret the estimation pattern to be informative as regards the underlying magnitude representation, Barth and Paladino (2011; see also Slusser, Santiago, & Barth, 2013; Sullivan, Juhasz, Slattery, & Barth, 2011) claim that such an interpretation of the estimation pattern should be treated with caution as the developmental change of the estimation pattern may instead be due to increased use of landmarks and associated proportion judgement strategies rather than reflecting an isomorphism to the underlying representation.
In particular, Moeller and Nuerk (2011; see also Karolis, Iuculano, & Butterworth, 2011) argue that there is one major problem when inferring the underlying magnitude representation of numbers from estimation performance in the NLET: Indicators of the to-be-achieved linear representation (e.g., a superior linear fit) are confounded with correct task performance. Because correct task performance necessarily implies a linear fitting pattern, it is unclear whether the underlying representation indeed develops from logarithmic to linear or participants just learned to solve the task correctly. Therefore, correct task performance and linear fitting results need to be dissociated to distinguish between these possibilities.
Present study
In the present study, we modified the standard version of the NLET such that in our nonlinear NLET, participants had to map numbers not linearly onto the number line, but nonlinearly (e.g., logarithmically). Solving this nonlinear NLET correctly would then produce a nonlinear estimation pattern. Because linear number-to-space mappings are most common in daily life (e.g., rulers, thermometers, etc.), we designed an experiment in which participants had to learn nonlinear mappings by feedback.
Opfer and Siegler (2007) already employed learning by feedback to improve second-grader estimations on a linear NLET. Providing just a single feedback trial improved children's estimations considerably, making them more linear. Thus, we expected adults to be able to learn linear and logarithmic mappings quite easily, since they should have already mastered these representations in childhood (e.g., Siegler & Opfer, 2003).
Functions that participants had to learn
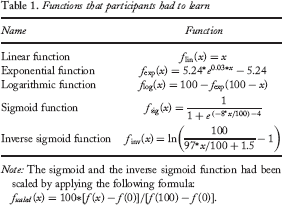
Note: The sigmoid and the inverse sigmoid function had been scaled by applying the following formula:
Therefore, we conducted a second experiment with first graders at end of their first year. These students should have learnt to solve a linear NLET with upper bound 20 correctly (i.e., producing a linear estimation pattern), but should produce a logarithmic estimation pattern on a linear NLET with upper bound 100. Thus, they should be able to learn both a linear and a logarithmic estimation pattern on our new version of the NLET with feedback. This would be a critical test of whether children indeed have both a linear and a logarithmic representation of numbers. However, first graders having problems learning the logarithmic NLET would question the implication of logarithmic estimation patterns indicating a logarithmic representation of numbers. Instead, it would favour the suggestion that estimation pattern mirrors strategies applied to solve the task (e.g., proportion judgement strategies).
Experiment 1: Adults
Method
Participants
Twenty-five students of the University of Tuebingen participated in Experiment 1 (18 female). Average age was 24.1 years (SD = 5.33 years, range: 19 to 42 years). All participants reported normal or corrected-to-normal vision.
Stimuli and design
We used a computerized version of the number line estimation task, in which participants had to mark the position of a given number on a number line. Participants had to learn the mapping of five different functions (linear, logarithmic, exponential, sigmoid, and inverse sigmoid function; see Table 1 and Figure 1A). Training comprised the following 30 numbers: 1, 2, 8, 13, 15, 17, 26, 27, 29, 31, 38, 39, 42, 43, 49, 52, 53, 54, 63, 65, 67, 71, 73, 78, 82, 86, 87, 94, 97, and 98. In the assessment phase, participants had to locate the following numbers: 3, 9, 12, 16, 23, 25, 34, 36, 41, 47, 51, 56, 61, 68, 74, 79, 85, 89, 95, and 96. The numbers of the training and the testing phase were presented in randomized order for each individual participant. Participants learned each of the five functions with their order following a Latin square design.
Experiment 1: (A) Underlying mathematical functions that adult participants were exposed to. (B) Mean empirical number line estimates after training.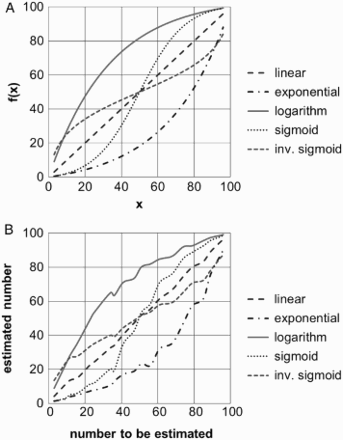
The task was presented at a standard PC with a 16″ monitor. Screen resolution was set to 1024 × 768 pixels. The left end of the number line was labelled 0, and the right end 100 (x/y coordinates of the left end: 170/460, and the right end: 853/460). The number line was about 18.5 cm long (683 pixels). The to-be-estimated number was presented centrally above the line (x/y coordinate of the centre: 384/225) and surrounded by a circle. The number line and the numbers were displayed in black colour against a white background. Sans Serif was used as font for the numbers (size: 60, style: bold).
Procedure
Each participant was assessed separately in a dimly lighted room. The experiment started with an instruction, in which participants were told that in the following task the mapping of the number to the number line would not always correspond to their expectation. Importantly, they received no information at any point in the experiment about which function they had to learn. Instead, they should learn the new mapping on the basis of feedback provided during a training period. Feedback was a green dash marking the correct position on the number line. It lasted for 2 s and was given immediately, after participants indicated their spatial estimate of the to-be-located number guess by clicking on the number line using the mouse. The mouse cursor was altered into a blue dash. The training period usually lasted only a short time, about 3 up to 5 min (5–9 s per trial). After the training, they were informed about their performance (mean deviation of their estimates in relation to the maximal length of the number line) and that there would be no feedback in the following assessment phase.
Results
In a first analysis step, we determined whether participants understood the task. Therefore, we analysed their performance on the linear number line layout. Participants’ mean absolute estimation errors were quite low with M = 3.23 (range: 1.81–6.37). Thus, all participants were able to learn the linear layout very well. Moreover, we were interested whether training durations differ for the different layouts. An analysis of variance (ANOVA) with layout (linear, logarithmic, exponential, sigmoid, and inverse sigmoid) as within-participant factor and reaction time (RT) as dependent variable indicated no reliable main effect of layout, suggesting that functions were learnt equally fast, F(4, 96) = 0.33, p = .86.
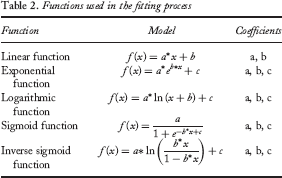
Functions used in the fitting process
As can be seen in Figure 1B, participants learnt the nonlinear functions quite well. This observation was confirmed by the model comparisons for each participant using the AICc values (for details for each single participant, see Appendix A; for adjusted R2 values, see Appendix B). Participants’ AICc values were lower for the logarithmic, exponential, and sigmoid models than for the linear model. However, the inverse sigmoid function differed slightly from the other functions. Its model explained estimates of 14/25 participants better than the linear model, which suggests that only about one half of the participants were able to differentiate between the linear and the inverse sigmoid function. This suggests that participants seemed to rely on a proportion judgement strategy resulting in an inverse sigmoid pattern of estimations (Barth & Paladino, 2011). The proportion judgement account suggests that participants make use of reference points (i.e., start, end, and midpoint of the respective range) to infer the correct position of numbers on a given number line. Such a strategy leads to systematic under- and overestimation of numbers close to the reference points (Hollands & Dyre, 2000), which can be identified by fitting estimation patterns using cyclic power functions. For instance, the one-cyclic power function is inversely S-shaped and is thus well suited to evaluate the systematic use of both start and end point as reference points.
The interpretation of such a systematic use of reference points is further corroborated by our data. Five participants started with the linear task, and, thus, their estimation patterns on the linear task provide an unbiased hint on their strategy in a possible paper-and-pencil version of the linear NLET. When fitting the estimation patterns of these participants on the linear task with both a one-cyclic function and a linear function we observed that for all five participants the one-cyclic function provided better fits, which suggests that participants indeed relied on a proportion judgement strategy.
Discussion
We observed that participants learnt the nonlinear mappings very well within 30 training trials, as reflected by very high coefficient of adjusted R² for of the nonlinear fitting functions. Additionally, for almost all nonlinear functions (except the inverse sigmoid function), participants’ estimates were better described by the nonlinear functions than by the linear function. This observation questions the ubiquitous interpretation that a participant's estimation pattern on the NLET is a reliable indicator of the underlying layout of this participant's magnitude representation (i.e., her/his MNL). Otherwise, one would have to suggest different, flexible, and interchangeable spatial layouts of human number magnitude representation (i.e., logarithmic, exponential, and sigmoid representations in addition to a linear one), which seems rather unlikely. Instead, our results corroborate the conclusion that participants learnt to solve the task correctly irrespective of the layout of the underlying magnitude representation.
The inverse sigmoid function seems to be special, because only about half of our participants learnt the function correctly. However, the inverse sigmoid function is very similar to the one-cyclic function (see also Barth & Paladino, 2011; Spence, 1990). The one-cyclic power model described adults’ performance very well in a variety of estimation tasks (see Hollands & Dyre, 2000). Therefore, even some adults may use this estimation strategy, which makes it very difficult for them to differentiate between the linear and the inverse sigmoid function. As a consequence, they would perform worse when estimating values of the inverse sigmoid function than when estimating values of the sigmoid function.
Experiment 2: Children
Method
Participants
Forty-four first graders participated in Experiment 2 (21 female). Average age was 6.6 years (SD = 0.50 years).
Stimuli and design
In Experiment 2, we used a paper-and-pencil version of the standard NLET. The numbers to be estimated were presented at the centre above the respective number lines ranging from 0 to either 20 or 100. For initial practice, children were asked to estimate the position of numbers 5 and 10 on the 0 to 20 scale and numbers 10 and 60 on the 0 to 100 scale. Afterward they were asked to indicate the position of the numbers 1, 2, 3, 4, 6, 7, 8, 9, 12, 13, 14, 15, 16, 17, 18, 19 on the 0 to 20 scale and the numbers 2, 5, 9, 13, 16, 19, 21, 28, 32, 37, 43, 46, 51, 56, 63, 67, 74, 78, 81, 85, 89, 92, 94, 98 on the 0 to 100 scale. There were four problems per page with number lines (length: 20.3 cm) starting either 2.6 cm or 6.7 cm from the left end of each page.
The computerized NLET was identical to the one used in Experiment 1 except for the range being restricted to 0–20. Additionally, first graders completed the linear and the logarithmic version only (see Figure 2A). The logarithmic task was scaled to the length of 20. Training comprised the following 30 numbers: 1, 1, 2, 3, 3, 4, 4, 5, 6, 6, 7, 7, 8, 9, 9, 10, 11, 12, 12, 13, 14, 14, 15, 16, 16, 17, 18, 18, 19, and 19. In the assessment phase, participants had to locate all numbers from 1 to 19. Numbers were presented in randomized order during both training and testing phase for each individual participant. Half of the first graders started with the linear NLET and the other half with the logarithmic NLET.
Experiment 2: (A) Underlying mathematical functions that first graders were exposed to. (B) Mean empirical number line estimates after training.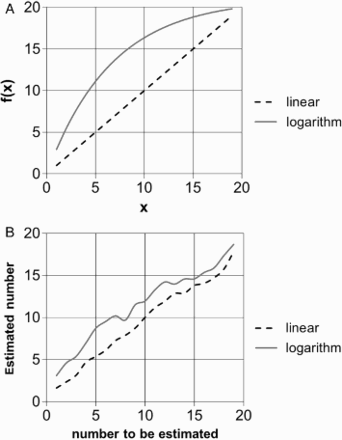
Procedure
First graders started with the paper-and-pencil NLET first. They were instructed to estimate the position of the presented numbers in one-on-one sessions. They started with the 0–20 scale and then completed the 0–100 scale. After they had finished the paper-and-pencil tasks, children's performance on the computerized NLET was assessed. At the beginning of the experiment, the experimenter read the instruction, which informed the children that they would have to indicate the position of a given number on the number line using the mouse pointer. After each trial they would be given feedback, which they should use to adjust their performance because after the training it would be tested how well they could indicate the correct positions of the numbers without further feedback. The training period usually lasted about 4 up to 10 min (M = 5.40 min, SD = 1.06 min).
Results
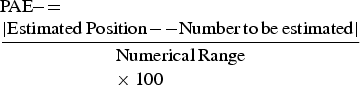
We excluded 4 children from further analyses because of missing data in one of the paper-and-pencil tasks (2 children) or in the computerized task (1 child) or very bad performance in the NLET with 0–20 scale (1 child: mean estimation error of 8.20). To make performance on tasks with different scales comparable, we calculated each child's mean percentage absolute error (PAE; see Booth & Siegler, 2006, 2008):
First, we fitted children's estimation patterns on the paper-and-pencil versions of the NLET with a linear and a logarithmic layout (see Experiment 1 for the fitting procedure). Fits were compared using AICc values (for details for each single child, see Appendix C). On the 0–20 scale, the estimation patterns of nearly all children (39/40) were better described by a linear function. On the 0–100 scale, the estimation patterns of only 17 out of 40 children were better described by a linear function. Thus, we found evidence for both linear and logarithmic estimation patterns in our sample, suggesting children to have linear and logarithmic representations of number magnitude.
To determine whether children understood the computerized task, we analysed their performance on the linear number line layout. Children's PAE did not differ between the paper-and-pencil and the computerized tasks [t(39) = 0.47, p = .64; paper-and-pencil: M = 10.27%; computerized: M = 10.89%]. Thus, children learnt the linear layout very well, indicating that they understood the task. As with adults, we were interested whether training durations for the layouts differed. A nonsignificant paired-sample t test indicated that children spent an equal amount of time in learning the linear and logarithmic layouts [t(39) = 1.24, p = .22; linear: M = 5.94 min, logarithmic: M = 5.70 min].
As with adults, we fitted children's estimation patterns on the linear and the logarithmic task with a linear and a logarithmic function (see Table 1) and calculated AICc values to compare model fits. For the linear layout, 33 out of 40 children's estimation patterns were fitted best by the linear function, whereas for the logarithmic layout only 15 out of 40 children's estimation patterns were fitted best by the logarithmic function (see also Figure 2B). McNemar's test indicated that proportions of linear and logarithmic fits differed for the two layouts, χ²(1, N = 40) = 56.10, p < .001, suggesting that children's estimation patterns are described best more often by a linear function for the linear layout than by a logarithmic function for the logarithmic layout. Thus, more children learnt the linear layout than the logarithmic layout. Additionally, as a further index of performance differences, we compared PAEs for the linear and logarithmic layouts. A paired-sample t test indicated that children's estimates were more accurate for the linear layout than for the logarithmic layout [M = 10.27% vs. M = 13.35%, respectively; t(39) = 2.30, p < .05], indicating that children learnt the linear function better.
Finally, we tested whether children producing a logarithmic estimation pattern on the 0–100 scale were better or worse than children producing a linear estimation pattern in task performance as measured by PAE in the computerized NLET. An independent-samples t-test indicated that children producing linear estimation patterns produced lower errors for the linear layout than did the peers producing a logarithmic pattern [M = 8.49% vs. M = 11.60%, respectively; t(38) = 2.05, p < .05]. However, for the logarithmic layout, we did not find an advantage for those children producing a logarithmic layout [linear children: M = 11.51%, logarithmic children: M = 14.71%; t(38) = 1.28, p = .21].
Discussion
In Experiment 2, we aimed at investigating whether children assumed to have both linear and logarithmic representations of numbers are also capable of learning linear and logarithmic solely by feedback. Our findings indicate that first graders’ representation of numbers is not as flexible as suggested by Siegler and colleagues (e.g., Opfer & Siegler, 2007; Siegler & Booth, 2005; Thompson & Siegler, 2010). The overlapping waves model would implicate that they should have both a linear and a logarithmic representation at least for numbers within a familiar number range. As a consequence, they should be able to learn a logarithmic mapping by feedback, since the majority of children produce a logarithmic estimation pattern in the 0–100 task at this age. However, we found that most children learnt the linear mapping in the linear learning condition, but only few children were able to learn the logarithmic mapping in the logarithmic learning condition. Furthermore, children who produced logarithmic estimation patterns in the paper-and-pencil NLET were not better in the logarithmic learning condition. Thus, our results indicate no systematic relationship between producing a logarithmic estimation pattern in the linear paper-and-pencil NLET and being able to learn a logarithmic mapping in a computerized version of the NLET. This finding is hard to reconcile with the notion that a logarithmic estimation pattern observed for children when solving a linear NLET within an unfamiliar number range is indicative of a logarithmic underlying representation of number magnitude.
We found that children with a linear estimation pattern on the 0–100 scale outperformed children with a logarithmic estimation pattern on the administered number line learning tasks. Based on this, we suggest that for young children in particular the ability to map numerical magnitudes onto space in a linear fashion corroborates not only learning new nonlinear number-to-space mappings but is also a valid predictor of actual and later arithmetic performance (Booth & Siegler, 2006). Additionally, we observed that adults assumed to have or at least have learnt a linear mental number line representation experienced no problems learning nonlinear mappings in only 30 practice trials.
From this, we suggest that a linear mapping of numbers onto space may not only be a building block for later arithmetic competencies building up on the linear structure of the Arabic number system as indicated by recent research (e.g., Opfer & Siegler, 2012). It may also allow for the flexibility of number-to-space mappings that we observed in adults when having to learn nonlinear number line layouts. More generally, we suggest that a flexible representation becomes more desirable with increasing age and skill level as it allows for more versatility when confronted with or having to learn new numerical concepts in mathematics (e.g., rational numbers).
General Discussion
In the standard version of the NLET, correct task performance is confounded with the assumed underlying linear layout of the mental number line. When the task is performed correctly, estimates necessarily have to follow a linear function. Therefore, in the standard NLET it is difficult to decide whether a linear estimation pattern is due to an underlying linear representation or rather due to participants having learnt to correctly perform the standard NLET.
Therefore, we designed a new version of the NLET in which linearity of estimation patterns and correctness of task performance can be distinguished by using nonlinear number line layouts instead of a linear one (i.e., logarithmic, exponential, sigmoid, inverse sigmoid). For these layouts, correct task performance should be described best by the corresponding nonlinear functions and not by a linear function. Correct task performance could thus be dissociated from an assumed linear representation of number magnitude in adults.
In Experiment 1, we investigated whether adults would be able to learn nonlinear mappings in the NLET and found that this was indeed the case. In Experiment 2, we evaluated whether children's representation is as flexible as that of adults seemed to be. This was not the case: Children learnt the linear layout quite easily, but did not do so for the logarithmic layout. More specifically, even children exhibiting a logarithmic estimation pattern on a paper-and-pencil NLET (which should thus have a logarithmic representation) did not learn a logarithmic layout more easily. Therefore, in combination the results of both studies are hard to reconcile with idea that children's estimation pattern in the number line task reflects an isomorphic physical realization of children's underlying representation of number magnitude. Thereby, the current study provides evidence that number line estimation patterns may not necessarily be interpreted to portray internal representations of numbers.
As a consequence, results of the present study indicate that number line estimation patterns should be interpreted more cautiously than done so far by ourselves (Helmreich et al., 2011; Moeller et al., 2009) and others (e.g., Opfer & Siegler, 2007; Siegler & Booth, 2005; Siegler & Opfer, 2003). It is important to note that we do not want to claim that children's estimation patterns are not informative at all with respect to their spatial representation of number magnitude. Number line estimation patterns may nevertheless provide indications about the possible nature of the numerical representation underlying task performance; however, they are also influenced by task demands and strategies employed. However, this implies that the so far more or less isomorphic interpretation may not be justified. Thus, fitting estimation patterns with different functions may not necessarily be a valid way to identify the nature of the underlying representation. Thereby, the results of this study are in line with other recent evidence suggesting that performance in the number line estimation task is not only determined by the to-be-assessed spatial representation of number magnitude. Instead, it also seems to be susceptible to the use of systematic non-numerical strategies (e.g., the use of reference points, e.g., Barth & Paladino, 2011; Slusser et al., 2013). Additionally, there is now first evidence that different ways to present the task (i.e., the standard bounded version with given start and endpoints, e.g., 0–100 vs. an unbounded version with only the start point and a fixed unit given) influence the result pattern and thus the conclusions on the nature of the underlying representation (Cohen & Blanc-Goldhammer, 2011).
Taken together, in line with Ebersbach, Luwel, and Verschaffel (2013), we suggest that the evaluation of number line estimation pattern is nevertheless an important source of information for the investigation of children's spatial representation of number magnitude. Yet, we also argue that future research should consider the specificities and possible confounds of the NLET as well as strategic influences on estimation performance more thoroughly and should not take an isomorphic relation between estimation and representation for granted.
Footnotes
Acknowledgements
This research was supported in part by a project within the ScienceCampus (WissenschaftsCampus) Tuebingen (Cluster 1/TP 1) supporting Stefan Huber. Moreover, part of this research was funded by the German Research Foundation (DFG) by means of a project within the Research Group FOR 738/2/TP02 supporting Korbinian Moeller and the cooperation project (Nuerk, Engel, Fischer, Moeller, & Cress, 2011–2014) within the joint Promotionskolleg Effektive Lehr- und Lernarrangements: Empirische Evaluation und Intervention in der Pädagogischen Praxis of the Eberhard-Karls University, Tuebingen and the Pädagogische Hochschule Ludwigsburg. Hans-Christoph Nuerk's developmental and educational research is supported by the excellence graduate school LEAD, in which he is a principal investigator.
Appendix A
AICc values of the linear and nonlinear model fits for each function (logarithmic, exponential, sigmoid, and inverse sigmoid) in Experiment 1
Appendix B
Adjusted R² values of the nonlinear model fits for each nonlinear function (logarithmic, exponential, sigmoid, and inverse sigmoid) in Experiment 1
Appendix C
AICc values of linear and logarithmic model fits for the linear and logarithmic tasks in Experiment 2