
Abstract
The operational momentum (OM) effect describes a cognitive bias whereby we overestimate the results of mental addition problems while underestimating for subtraction. To test whether the OM emerges from psychophysical characteristics of the mental magnitude representation we measured two basic parameters (Weber fraction and numerical estimation accuracy) characterizing the mental magnitude representation and participants’ performance in cross-notational addition and subtraction problems. Although participants were able to solve the cross-notational problems, they consistently chose relatively larger results in addition problems than in subtraction problems, thus replicating and extending previous results. Combining the above measures in a psychophysical model allowed us to partially predict the chosen results. Most crucially, however, we were not able to fully model the OM bias on the basis of these psychophysical parameters. Our results speak against the idea that the OM is due to basic characteristics of the mental magnitude representation. In turn, this might be interpreted as evidence for the assumption that the OM effect is better explained by attentional shifts along the mental magnitude representation during mental calculation.
Recent years have brought forward a surprisingly strong representational association between numbers and space, providing a psychological and neural reification of the metaphor of the “mental number line”. The SNARC (spatial–numerical association of response codes) effect is often taken as an indicator for an association of numerical magnitude with space (Dehaene, Bossini, & Giraux, 1993): Left-sided responses are faster for smaller numbers while right-sided responses are faster for larger numbers. This has been interpreted as evidence for a left-to-right oriented “mental number line” with smaller numbers being located to the left of larger numbers (at least in left-to-right reading cultures; Shaki & Fischer, 2008; Shaki, Fischer, & Petrusic, 2009). Additional evidence for a spatial representation of numerical magnitude comes from the observation that numbers can shift spatial attention. That is, larger numbers shift spatial attention to the right while smaller numbers facilitate processing of left-sided stimuli (Casarotti, Michielin, Zorzi, & Umiltà, 2007; Fischer, Castel, Dodd, & Pratt, 2003; Galfano, Rusconi, & Umiltà, 2006). Similarly, in a luminosity decision task where participants had to select the brighter of two greyscale stimuli, the numerical magnitude of the superimposed numbers systematically influenced performance (Nicholls, Loftus, & Gevers, 2008). A leftward bias was observed with small numbers while large numbers induced a rightward bias. Patient studies add evidence to the idea that number processing implies spatial shifts of attention (Zorzi et al., 2012). Patients suffering from spatial neglect were found to show representational neglect when judging the numerical midpoint of a given interval marked by two numbers. For example, when asked for the midpoint between 1 and 9 (correct answer is “5”) these patients would provide “7” as response, as if neglecting the left portion of the numerical interval (Zorzi, Priftis, & Umiltà, 2002).
Only recently it has been found that the spatial organization of the mental magnitude representation might also have an impact on basic mental calculations—that is, addition and subtraction. When adding or subtracting two nonsymbolic numerical quantities (i.e., dot patterns) participants favoured results that were larger than the actual outcome for additions, while for subtraction problems participants preferred numbers that were smaller than the actual outcome (McCrink, Dehaene, & Dehaene-Lambertz, 2007). In reference to a similar effect in visual perception, this bias was named the operational momentum (OM) effect. This effect is not restricted to the nonsymbolic notation but was demonstrated with symbolic numbers as well, pointing to a common underlying mechanism for mental arithmetic in both notations (Knops, Viarouge, & Dehaene, 2009; Pinhas & Fischer, 2008). This implies that very similar mechanisms are involved in symbolic and nonsymbolic calculation and is congruent with the idea that symbolic calculation is grounded in the innate ability to perceive and process numerical magnitudes—that is, the “number sense” (Dehaene, 2011). Converging evidence suggests that the number sense represents a crucial prerequisite for the development of adequate symbolic calculation skills (Gilmore, McCarthy, & Spelke, 2010; Halberda, Mazzocco, & Feigenson, 2008; Park & Brannon, 2013; for a review see Piazza, 2010). The number sense represents numerical magnitude information in an approximate, language-independent, and analogue fashion. Humans share this system with other animals such as rats (Meck & Church, 1983), monkeys (Merten & Nieder, 2009; Nieder, 2012), birds (Emmerton & Renner, 2006), and even fish (Agrillo, Dadda, & Bisazza, 2007; Agrillo, Piffer, & Bisazza, 2010; Dadda, Piffer, Agrillo, & Bisazza, 2009), implying a common evolutionary origin. In line with this claim, infants already show numerical discrimination performance that is mainly defined by the ratio of the to-be-compared numerosities (Izard, Sann, Spelke, & Streri, 2009; Xu & Spelke, 2000; Xu, Spelke, & Goddard, 2005).
Different explanations for the observed bias in mental calculation are currently being discussed. One idea, originally expressed by McCrink et al. (2007), assumes that arithmetic operations are carried out on compressed magnitude scales. That is, the internal magnitude scale is thought to be logarithmically compressed (Dehaene, 2003; Stoianov & Zorzi, 2012). McCrink et al. (2007) assumed that the cognitive system “undoes” the compression during mental calculation, operating on uncompressed magnitudes. This process of uncompression may be subject to a systematic bias, which results in a slightly compressed magnitude code during calculation. This compressive bias may in turn cause the OM. A simple example illustrates this idea. Imagine a participant adds two numbers—for example, 20 + 5. Internally, these are represented as log10(20) = 1.301 and log10(5) = 0.699. In the most extreme case, if uncompression failed completely, participants would operate on the log-scaled values and add log10(20) = 1.301 and log10(5) = 0.699. Adding two logarithms corresponds to multiplying their linear-scaled values, and in most cases this would result in values larger than the actual outcome. A similar argument holds for subtraction, which would be replaced by division. Clearly, the bias produced by applying this mechanism to logarithmically compressed magnitudes is larger than the relatively small bias observed in actual OM experiments. However, even a partial inaccuracy in compression and uncompression might provide a plausible explanation of the operational momentum effect and was implemented in a computational model by Chen and Verguts (2012).
A second explanation of the operational momentum entails shifts of spatial attention along the mental magnitude representation. When adding (subtracting) two numbers, spatial attention is shifted to the right (left) along the mental number line, moving participants “too far” on the representation to the right (left), which in turn leads to an overestimation (underestimation) with respect to the correct outcome. This notion has received support from neuroimaging (Knops, Thirion, Hubbard, Michel, & Dehaene, 2009) and behavioural studies (Knops, Zitzmann, & McCrink, 2013).
Despite assuming different mechanisms, both theories are based on the idea that symbolic arithmetic is grounded in the approximate number system (ANS) and the notion of the mental number line. If mental calculation is grounded in the ANS, then the individual performance in (non)symbolic calculation tasks might be correlated with other indices describing crucial properties of this system in the individual participant. Here, we set out to test this idea by examining whether the size of the OM effect correlates with other properties of the number system.
Humans vary in two basic properties of the ANS. First, the individual acuity by which two (nonsymbolic) quantities can be distinguished varies between participants. The acuity can be expressed by a simple parameter, the Weber fraction. The Weber fraction describes the proportional numerical difference by which two given numerosities must differ to attain a fixed performance level. The Weber fraction has been shown to correlate with mathematical abilities in children (Piazza et al., 2010) underlining the close link between basic numerosity perception and basic mental arithmetic. Moreover, even in an educated adult population the Weber fraction is correlated with symbolic mathematical achievement level (Agrillo, Piffer, & Adriano, 2013; Halberda, Ly, Wilmer, Naiman, & Germine, 2012). Second, participants’ estimation of the number of items in a given set diverges from the actual number, usually in the direction of underestimation. The amount of underestimation varies between participants (Izard & Dehaene, 2008). This can be comprehensively described by regressing from the logarithm of the shown number of items in a display on the logarithm of the estimated number of items in a numerosity estimation task.
In this study we aim to describe in more detail how mental arithmetic is grounded in the ANS by exploring the association between basic psychophysical parameters of this system and performance in simple mental arithmetic. That is, by combining basic psychophysical parameters capturing the core properties of the ANS, we seek to predict participants’ performance in simple mental arithmetic tasks and specify how the operational momentum relates to the ANS. In detail, we reasoned that the overall underestimation in previous studies on the operational momentum (see Knops, Viarouge, et al., 2009, for example) might be the consequence of an overall miscalibration in estimating (i.e., underestimation) the number of items in a visual set. According to the compression–decompression hypothesis, the operational momentum effect itself might be linked with the overall acuity of the ANS, with higher overall acuity leading to less operational momentum due to more efficient and more accurate compression/decompression mechanisms.
Method
Participants and overall procedure
Fourteen participants (5 female, 9 male; mean age: 22.1 years) were presented with three tasks in two sessions. Participants were remunerated with 12.75 euros for participation. Each session lasted about 1 hour. The two sessions took place on separate days, approximately a week apart. The tasks administered were (a) a numerosity estimation task where participants were presented with dot patterns and had to provide the numerical estimate of the presented set, (b) a nonsymbolic numerosity comparison task in which participants were asked to indicate the larger of two numerosities, and (c) an approximate calculation task. The calculation task comprised addition and subtraction problems with operands and results either being presented in a common notation (i.e., Arabic numerals or dot patterns) or in different notations (cross-notational). In all cases both operands were presented in the same notation. In cross-notational trials, both operands were presented in one notation (e.g., Arabic numerals), and the response alternatives in the other notation (e.g., dot patterns). No feedback was provided to the participants in the three paradigms.
Participants were seated at a distance of about 60 cm from the monitor. No chin rest was used.
Numerosity estimation task
Stimuli
We presented the decade numbers between and including 10 and 110 as black dots against a white circular background (diameter: 240 pixels corresponding to approximately 6° visual angle) on an otherwise black screen.
Two sets of dot patterns were used: In one set, dot size was kept constant across dot patterns with different numerosities. This procedure leads to a confound between nonnumerical cues (i.e., the total occupied area) and numerosity, since both parameters were necessarily positively correlated. For example, when keeping the individual dot size and density constant, increasing the numerosity will increase the overall area occupied by the set (also sometimes referred to as convex hull; Gebuis & Reynvoet, 2011). In the second set of dot patterns, dot size changed with changing numerosity while total occupied area was kept constant across the set. Thus, total occupied area could not serve as a cue for distinguishing between the different numerosities.
To avoid memorization effects due to repetition of a particular stimulus, on each trial the stimulus images were randomly chosen from a set of 10 precomputed images with the given numerosity and a given control over nonnumerical parameters. The Matlab code for generating these stimuli has been provided by Dehaene and colleagues (Dehaene, Izard, & Piazza, 2005) and can be found on the unicog website (http://www.unicog.org/pm/pmwiki.php/Main/Arithmetics).
Procedure
Each trial started with the presentation of a fixation cross in the middle of the screen for 500 ms. The fixation cross was replaced by the dot pattern for 300 ms. After the dot pattern disappeared, participants provided their estimation of the presented numerosity using a standard keyboard. Participants had unlimited time and were given the chance to correct their estimates if they wished to. No feedback was provided during instruction or testing.
Each numerosity was presented 20 times: 10 times with constant dot sizes across numerosities, 10 times with varying dot sizes across numerosities. In total, 220 trials were presented.
Numerosity comparison task
Stimuli
The stimulus set comprised two standard numerosities (16 and 32) that had to be compared against two sets of deviant stimuli (one set for each standard). The deviant numerosities for the standard 16 consisted of the numerosities 10, 12, 13, 14, 15, 17, 18, 19, 20, and 22. For the standard 32, these deviants were doubled (i.e., 20, 24, 26, 28, 30, 34, 36, 38, 40, and 44). The to-be-compared numerosities were presented as black dot patterns against a white circular background on an otherwise black screen in a horizontal layout. The same way of controlling for nonnumerical parameters as that for the number estimation tasks was employed, resulting in two different sets of dot patterns (size and surface). On each trial, both numerosities were drawn from the same set of dot patterns—that is, either total occupied area or dot size was constant across different numerosities. Each standard–deviant pair was presented 32 times, 16 times for each set of dot patterns.
Procedure
Each trial began with the presentation of a fixation cross in the middle of the screen for 1000 ms, which was replaced by the pair of numerosities. After 300 ms, the two dot patterns disappeared, and a question mark appeared in the centre of the screen signalling participants to indicate via button press which side of the screen the larger numerosity was presented on. Each standard–deviant pair was presented 16 times for each set of dot patterns. This resulted in a total of 640 trials—16 (repetitions) × 20 (pairs) × 2 (dot pattern sets)—completed in two sessions of 320 trials on two days. Each session was preceded by 10 practice trials.
Calculation task
Stimuli
Two different problems were chosen for each arithmetic operation (addition and subtraction). In all cases the first operand was 50 (plus or minus a random number between 1 and 8 to jitter the starting numerosity). As second operand either a small numerosity of 6 (plus or minus a random number between 0 and 3) or a large numerosity of 26 (plus or minus a random number between 0 and 3) was presented. Correct results varied between 13 and 87. Apart from the correct result, 8 deviant results were created for each arithmetic problem. These deviants were arranged as a geometric series (i.e., were linearly spaced on a logarithmic scale). Technically, they were generated as round(c × ri/4), where c is the correct result, i ranges from −4 to +4, and r describes the maximal possible ratio between correct outcome and deviants. Parameter “r” was set to 2.5 for problems with nonsymbolic stimuli and 1.41 for the purely symbolic problems. This differentiation was introduced to increase the precision by which we would be able to detect a given bias in the purely symbolic trials. Previous experiments (Knops, Viarouge, et al., 2009) have shown that the possibility to rely on verbal labelling and recall from long-term memory makes it more difficult for nonverbal, approximate number codes or attentional biases to influence the participants’ choices.
To discourage participants from using a strategy of always selecting the response falling in the middle of the trial's numerical range, only seven out of those nine possible results were presented. In 50% of the trials, we presented the upper seven (high range), and thus the correct result was the fifth largest numerosity (although numerosities were randomly mixed). In the other 50% of the trials, the lower seven choices were shown (low range), and the correct result was therefore the third largest numerosity. Because the experimental design was organized around a small number of arithmetic problems, it was important to prevent subjects from memorizing them in symbolic form. To this aim, the problems and their proposed results were randomly “jittered”, differently on each trial. First, the operands were jittered by a random value from 0 to ±2, such that the actual outcome would remain unchanged (i.e., for a given task 48 + 23, the jittered operands could be 47 + 24). Second, all of the seven proposed response alternatives were jittered up or down by a random value (fixed for a given trial). This random value had a mean value of zero and was drawn from a flat distribution on a logarithmic scale, in the range ± half of the numerical interval between the correct result and the first deviant above or below it. Technically, this was achieved by drawing a random number r between −0.5 and 0.5 and defining the proposed results as round, c × 2(r+i)/4, where i again ranges from −4 to +4. To encourage the use of approximate calculation we ensured that the correct outcome would never appear as a response alternative.
Operands and results were presented in two notations—that is, as Arabic digits or as dot patterns. The operands’ and results’ notation was varied in a full factorial design, yielding four possible conditions (digits–digits, digits–dots, dots–digits, and dots–dots). All stimuli were displayed in black within a white circle, which was presented against a black background. Each circle had a diameter of 120 pixels (3.55 cm) at a viewing distance of approximately 65 cm (no chin rest was used). Due to a programming error, 1
Due to the wrong use of a variable defining the lower boundary of the jittering range in the digits–digits condition, the presented response alternatives were asymmetrically distributed around the correct outcome. The numerical range of response alternatives that were smaller than the actual outcome was larger than the numerical range of those that were larger than the actual outcome. Consequently, on average, participants chose values that were smaller than the actual outcome for both operations (addition and subtraction).
Procedure
Each trial began with the presentation of a fixation cross in the centre of the screen for 1000 ms, followed by the appearance of an instructional letter (“A” for addition or “S” for subtraction) informing participants about the subsequent operation to be performed. After 1200 ms the instructional letter was replaced by the first operand, which remained on screen for 1400 ms. The second operand replaced the first one immediately and remained equally visible for 1400 ms. The operands were presented successively in the centre of the screen. Finally, the screen was emptied, and seven response alternatives appeared, one by one, with a delay of 200 ms between successive operands at one of seven possible locations. The temporal order in which the seven locations appeared was randomized for each trial. After all alternatives were present on screen, the mouse pointer appeared in the centre of the screen, and the participants had to indicate by clicking on the images which numerosity was numerically closest to the actual result. Speed was stressed over accuracy to maximize the use of approximation strategies and to avoid explicit calculation (Arabic numerals) or counting (dot patterns). The results were presented at seven locations arranged around the screen centre in an ellipsoid fashion. The seven proposed outcomes were counterbalanced in a Latin square, such that each of the seven response alternatives in the high or low response range appeared once at every position.
Results
Numerosity estimation task
If participants were able to accurately estimate the numerosity of the dot patterns, the mean estimate should increase linearly with the number of dots in the stimulus. To evaluate this relationship, we used log–log regression, which corresponds to fitting the data with a power law whose exponent should be 1 for a linear relationship. When regressing the log of the shown number against the log of the given estimate, an excellent linear fit was observed (R2 = .9991), and the slope of the regression function (mean = .51, SD = .20) for the 14 participants was significantly larger than zero, t(13) = 9.67, p < .001, but significantly smaller than 1, t(13) = −9.24, p < .001, indicating that participants underestimated the number of dots in a given display (see Figure S1 in Supplemental Material).
If the underestimation exhibits scalar variability, standard deviation should increase proportionally with increasing mean estimates on a linear scale, yielding a constant coefficient of variation (CV) with a regression slope that does not differ from zero. Indeed, the CV remained constant over the range of numerosities with a slope (mean = −0.0001, SD = 0.0004) that did not significantly differ from zero, t(13) = −1.35, p = .20.
In line with results from previous numerical estimation studies, participants showed large variance in their amount of underestimation. Although most participants underestimated significantly, the slopes of the log–log regression of number against their individual estimates ranged from b = 0.24 (a massive underestimation) to b = 1.02 (a well-calibrated estimation).
Numerosity comparison task
The observed pattern of performance in the numerosity comparison task is in keeping with results from previous studies employing a similar task (Piazza, Izard, Pinel, Le Bihan, & Dehaene, 2004; van Oeffelen & Vos, 1982; see also Figure S2 in Supplemental Material). The percentage of “larger” responses increased with increasing number of dots in the set, for both standards (16 and 32).
While the distribution of “larger” responses for the larger standard numerosity is broader on linear scale (see Figure S2, left), both curves become symmetric, once transformed to log-scale. This indicates that participants’ performance follows the predictions derived from Weber's law. Applying a curve-fitting algorithm as described in the supplementary material to Piazza et al. (2004), we pitted the goodness of fit indices from linear and logarithmic scales against each other. While both functions explained a large amount of variance in the data (R2 linear = .874, R2 logarithmic = .947), the amount of explained variance (R2) was significantly higher for the logarithmic model, t(13) = 7.14, p < .0001. The internal Weber fraction (w; see Piazza et al., 2004, for details) derived from these analyses was w = 0.224 for a standard of 16 and w = 0.264 for a standard of 32. The average internal Weber fraction over both numerosities was w = 0.243.
Mental calculation task
As can be seen in Figure 1, the values chosen by participants increased as a function of the correct outcomes. To statistically validate this impression, we computed, separately for each notation, a regression of correct values on chosen values. If participants’ choices systematically increase with correct values, regression slopes should be larger than zero. Indeed, all mean beta coefficients were significantly larger than zero (all ps < .001), with only the slope for addition in the dots–dots condition being significantly different from one, t(13) = 4.3, p = .001 (all other ps > .348).
The correct outcomes of the presented arithmetic problems plotted against the value chosen by participants, separately for each notation and operation. Mean R2 is provided for each condition. Each data point corresponds to one trial. All participants’ data have been merged together. Grey diagonal indicates correct performance.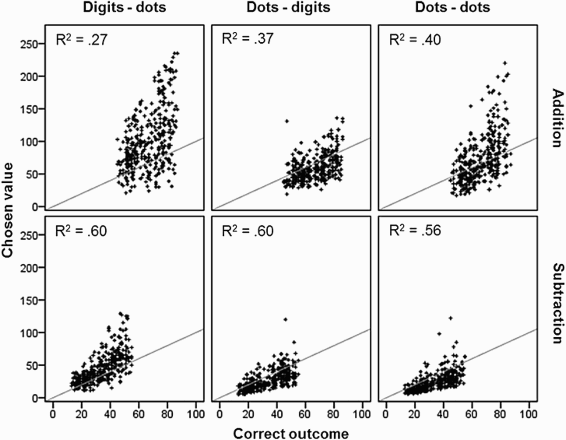
Mean response bias in the actual data and in the predictions made by the compression–decompression model, separately for each notation and operation
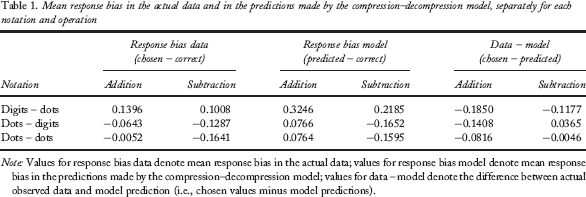
Note: Values for response bias data denote mean response bias in the actual data; values for response bias model denote mean response bias in the predictions made by the compression–decompression model; values for data – model denote the difference between actual observed data and model prediction (i.e., chosen values minus model predictions).
As can be seen in Table 1, the OM effect did not take the form of a full cross-over effect with a positive bias for addition and a negative bias for subtraction but remained present in form of a relative difference between addition and subtraction with more negative values for subtraction than for addition. Consistent with results from previous experiments (Izard & Dehaene, 2008; Knops, Viarouge, et al., 2009), we observed an overall tendency towards underestimation in the dots–dots condition as well as in the dots–digits condition. For the reverse cross-notational condition (digits–dots) we observed an overall tendency of overestimating the results with respect to the actual outcome.
A psychophysical model of approximate calculation
If these overall biases are linked to the individual miscalibration of the internal transcoding we should be able to correct for the bias on the basis of the individually measured transcoding performance in the numerosity estimation task. Note that in theory no transcoding was necessary in the dots–dots condition. Nevertheless participants might have engaged in such a transcoding strategy (a) to facilitate the arithmetic operation and (b) since they could not predict the notation of the final display, which could be either in the dot format or in the Arabic digits format.
In order to investigate whether the individual amount of underestimation as measured in the estimation task is linked to the perception of the numerosity in the cross-notational calculation task, we assumed a basic sequence of cognitive steps. First, participants see and perceive the operands. In case of nonsymbolic operands, this step entails the application of an individual underestimation factor as measured in the numerosity estimation task (i.e., using the individual regression equation) to the nonsymbolic operands in each trial to estimate the individually perceived numerosity. The actual calculation process (addition or subtraction) is then applied to the individually perceived numerosities. This second step yields the most probable, individually biased result in a given trial, which is finally compared to the presented response alternatives on screen. Finally, to model the internal comparison between the result of the arithmetic operation and the response alternatives we applied the inverse perceptual bias in a third step.
It is well known that the perceived numerosity for a given number is subject to individual trial-to-trial fluctuations, which can be well described by the Weber fraction, indexing the accuracy of the numerosity perception in each individual participant. The Weber fraction defines a range within which participants cannot accurately distinguish between different numerosities. This means that the numerical magnitude of the internally represented operands (i.e., the individually perceived numerosities) varies within a certain range of subjective equality. To determine the subjective equality range we multiplied (or divided) the individually perceived operands with (by) the individual Weber fractions, which resulted in the upper and lower boundaries of the subjective equality range for each operand. In sum we combined the individual measures from the three tasks in a simple model in order to more adequately capture the most prominent behavioural signatures of the performance in a cross-notational mental calculation paradigm. The model can be summarized as follows:
For each participant p in trial i the individually perceived nth operand O pin is computed by taking into account the individual underestimation as determined by the numerosity estimation task [O pin = log10(ap + bp × O pin )] and adding the subjective equality range as determined by the numerosity comparison task [bound pin _up = O pin + log10(1 + wp); bound pin _low = O pin − log10(1 + w p )]. For participant p in trial i the predicted result PR pi results from the addition/subtraction of the individually perceived operands: PR pi = log10[10^(O pi 1) ± 10^(O pi 2)]. For participant p in trial i the subjective equality range around PR pi is defined by adding up the upper and lower boundaries (bound pin _up and bound pin _low) around the individual operands (O pi 1 and O pi 2).
The chosen result on an individual trial (CR pi ) was considered as “predicted” if it fell within the subjective equality range around PR pi .
This model was adjusted to the hypothesized processes in each notation condition. That is, for the digits–dots condition, no underestimation or uncertainty range for the Arabic operands was assumed. Instead, the inverse of the linear regression model from Task 1 was used to define the amount of overestimation when comparing the internal symbolic representation of the outcome with the nonsymbolic quantities presented as response alternatives. A subjective equality range was centred on this transcoded quantity only. A comparable correction by the inverse of the linear regression was applied to the other notations to compensate for the final transcoding that is assumed to allow for the match between internal quantity representation of the problem's outcome and the externally presented nonsymbolic quantities (i.e., response alternatives).
Figure 2 shows the chosen values in each trial for all participants against the values that were predicted (accounted for) by the above model as black crosses. If the model perfectly predicted the participants’ performance, the chosen values would increase linearly with the predicted result, with a slope approaching 1. Additionally, the chosen values would be symmetrically distributed around the mean predicted values, indicated by the linear regression slope (grey line). If, however, mental arithmetic is subject to additional influences—such as the operational momentum—the chosen values should systematically deviate from the above linear regression slope with an intercept of zero and a slope of 1. Indeed, we observed a linear increase of the chosen values with the predicted outcome, indicating that the simple model proposed here captured parts of the performance in the approximate calculation problems.
Predicted values of the model (x-axis) against the chosen values (y-axis) for all participants in different notations and operations. Left column: addition; right column: subtraction; first row: dots–dots; second row: dots–digits; third row: digits–dots. Values within the predicted range are shown as black crosses, and values outside the predicted range are shown as grey asterisks. Each data point represents one trial. Note that data points may be superimposed if identical. The light-grey diagonal indicates perfect correspondence between model prediction and observed performance.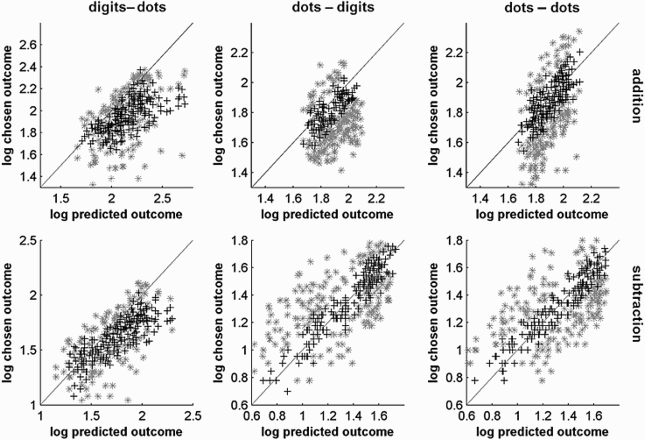
The simple model we used here to predict performance in simple approximate calculations captures major aspects of the observed variance. Since we aimed at testing whether the operational momentum effect can be explained by basic parameters of the ANS, we next analysed whether the model predictions exhibit similar response biases to the observed behaviour, which would argue against the idea that the OM can be explained by basic ANS parameters. Figure 3 depicts the model predictions as a function of correct outcomes, separately for each notation and operation. The model predictions correlate with the correct outcome, yet with deviations from the diagonal, which correspond roughly with those observed in actual data (compare Figure 3 and Figure 1). This observation suggests that the proposed model, as expected, captures the general trend of operational momentum effects in the data.
Predicted values of the model (y-axis) against the correct values (x-axis) for all participants in different notations and operations. Both axes are in log scale. Top row: addition; bottom row: subtraction; first column: digits–dots; second column: dots–digits; third column: dots–dots. Each data point represents one trial. Note that data points may be superimposed if identical. The light-grey diagonal indicates perfect correspondence between model prediction and correct outcome.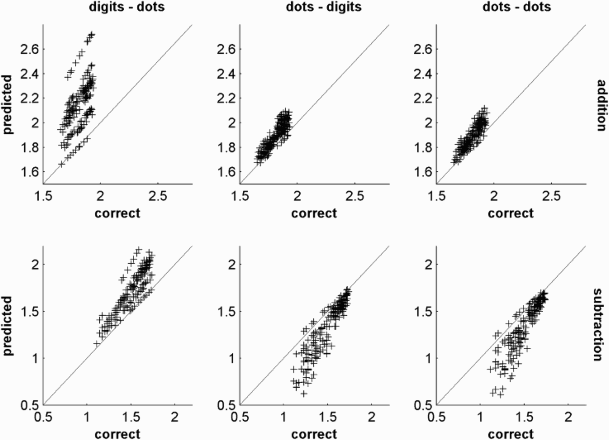
Table 1 summarizes the actual and predicted response bias (i.e., log chosen/predicted values minus log correct outcome), separately for each notation and operation. Additionally, we report the mean difference between the model prediction and the observed values for response bias. If the model captured the operational momentum bias, this difference should be centred on zero. However, as can readily be seen, in these residuals (chosen – predicted), additions now show a more negative deviation than subtraction. Furthermore, for notations with nonsymbolic operands (dots–dots and dots–digits) the model exhibits a cross-over effect with additions being predicted too large and subtractions being predicted as too small relative to the correct outcome.
To finally test whether the model can explain the operational momentum, we computed a linear regression where we tried to predict the observed operational momentum bias (i.e., chosen values minus correct outcome) on the basis of the model prediction. The question can be reformulated as follows: Does the model, by including for each individual trial the participants’ overall miscalibration in estimation and the precision of the ANS, provide values that are significantly related with the observed over- and underestimation in addition and subtraction? The result can be seen in Figure 4 where we plotted the observed response bias (chosen values – correct outcome) against the predicted response bias from the model (model prediction – correct outcome). As can be seen in the overall poor amount of explained variance (R2 between .047 and .153), the model does not capture the operation specific bias that leads to the operational momentum effect. More specifically, the over- and underestimation do not seem to correlate with the model prediction.
Model predictions plotted against the response bias—that is, the difference between log chosen values and log correct outcomes—separately for each notation (columns) and operation (top row: addition; bottom row: subtraction). Each data point corresponds to a single trial. Identical values are superimposed. Grey diagonal represents perfect correlation between both variables. R2 denotes the mean explained variance of the regression of the response bias from the model (i.e., model prediction minus correct outcome) on the operational momentum bias (i.e., chosen value minus correct outcome), separately for each notation and operation.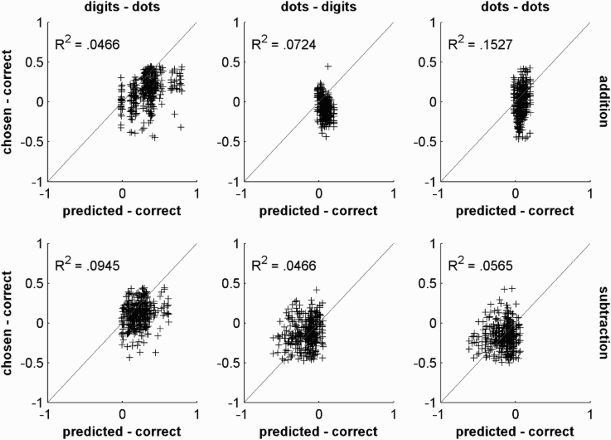
Pairwise Pearson correlation coefficients between the signed response bias and two psychophysical parameters—the Weber fraction and the amount of underestimation in numerosity estimation
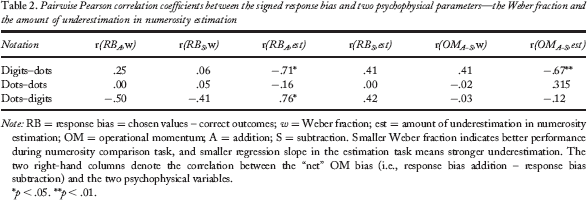
Note: RB = response bias = chosen values – correct outcomes; w = Weber fraction; est = amount of underestimation in numerosity estimation; OM = operational momentum; A = addition; S = subtraction. Smaller Weber fraction indicates better performance during numerosity comparison task, and smaller regression slope in the estimation task means stronger underestimation. The two right-hand columns denote the correlation between the “net” OM bias (i.e., response bias addition – response bias subtraction) and the two psychophysical variables.
p < .05.
p < .01.
Discussion
In the current study we investigated the relation between the ANS and performance in approximate addition and subtraction problems, in order to specify in more detail how mental arithmetic is grounded in the ANS. The results from three experiments (numerosity estimation, numerosity comparison, and mental calculation) are well in line with results from previous studies. First, in the numerosity estimation task we found that the number of items in a visually presented set is systematically underestimated. The amount of individual underestimation was captured by a linear regression on log-transformed values. In line with earlier studies (Izard & Dehaene, 2008) this indicates a miscalibration of the internal numerosity-to-number mapping function, resulting in underestimation for most participants. Second, we observed that data from the numerosity comparison task were better fitted by a logarithmic scale than by a linear scale, congruent with the assumption of a logarithmically compressed mental number line (Nieder & Miller, 2003). The observed mean Weber fraction (w = 0.243) is well in line with previous results (Halberda et al., 2012; Izard & Dehaene, 2008; Piazza et al., 2004). Third, performance in the mental calculation task paralleled to a large extent findings from previous studies (Knops, Viarouge, et al., 2009; McCrink et al., 2007). This includes an overall underestimation of the final results in the dots–dots condition. The cross-notational conditions were characterized by an underestimation in the dots–digits condition and an overestimation in the digits–dots condition (which can be seen as a simple reversal of the same tendency). These findings are compatible with the hypothesis that the numerosity of dot patterns continues to be systematically underestimated during the calculation task. Most crucially, we replicated the operational momentum effect in all notations. As observed in previous studies, the OM did not take the form of a full cross-over but was present in form of more negative values for subtraction than for addition.
The current study, for the first time, allowed us to test whether the observed overall underestimation in mental calculation tasks involving nonsymbolic stimuli is associated with the overall tendency to underestimate the number of items in a set. To test this assumption, we included individual psychophysical parameters in a simple model of mental calculation. The values predicted by the psychophysical model lined up nicely with the chosen values, as can be seen in Figure 2. The majority of predicted values fell close to the diagonal, which indicates an adequate fit between model predictions and observed data. Hence, the overall miscalibration in cross-notational mental calculation task can by and large be explained by the individual response bias in numerosity estimation task in combination with the individual accuracy of the ANS. It has been argued that the performance in numerosity estimation tasks is defined by the characteristics of the mental magnitude representation—that is, spatial layout (mental number line), logarithmic scaling, Gaussian distribution of dispersion centred on activated number), and an internal response grid (Izard & Dehaene, 2008). Hence, participants might rely on a transcoding of nonsymbolic numerosities into a single internal numerical scale during the course of mental calculation.
However, the model tested here did not fully capture the operation-specific over- and underestimation pattern—that is, the operational momentum effect. When we tested directly whether the model's predicted response bias correlated with the observed arithmetic bias, we found virtually no explanatory value of the proposed model. The overall direction of the response bias (i.e., numerically larger values for addition than for subtraction) was roughly captured in group averages, but many qualitative and quantitative details did not fit (see Table 1). Relative to the correct outcome, contrary to what was observed, the model predicted negative values for subtraction and positive values for addition, taking the form of a full cross-over effect for cross-notational conditions. Furthermore, interindividual variance in nonsymbolic number processing did not correlate with the amount of operational-momentum effect.
This may suggest that the observed biases in approximate mental arithmetic are due to factors outside the ANS that were not included in the current model. Amongst the currently discussed theoretical accounts for the operational momentum, the most parsimonious explanation postulates that OM results from attentional shifts along the mental number line during the course of mental calculation (Knops, Thirion, et al., 2009; Knops et al., 2013). The current data are in line with this notion insofar as they support crucial characteristics of the hypothesized underlying magnitude representation. In detail, we observed evidence for a logarithmically compressed mental magnitude representation in the numerosity comparison task. The results from the numerosity estimation task, too, are in line with a recent model assuming a spatially oriented, logarithmically compressed mental number representation (Izard & Dehaene, 2008). It remains an open issue whether shifts of spatial attention along the mental number line induce the OM effect. Support for this claim comes from a neuroimaging study (Knops, Thirion, et al., 2009) where authors used brain activity in posterior, superior parietal cortex elicited by left- and rightward saccades to train a classifier. The classifier successfully learned to predict whether participants made saccades to the right or to the left. Without further training, the same classifier generalized to mental arithmetic and successfully predicted whether participants were solving addition or subtraction problems. Addition problems were associated with neural activity from rightward saccades, presumably since participants shifted attention towards larger numbers on the right side of the mental number line. Further evidence for an association between OM and attention comes from a recent study that reports a strong correlation between reorienting in a Posner paradigm and OM in 6-and-7-year-old children (Knops et al., 2013).
An interesting dissociation between cross-notational conditions and the purely nonsymbolic condition was observed. OM was larger in the purely nonsymbolic condition, implying that exact verbal coding during approximate mental calculation might mitigate the influence of mechanisms leading to OM. Alternatively, participants may have a more precise, but still analogue representation of the quantity associated with Arabic numerals (Dehaene, Spelke, Pinel, Stanescu, & Tsivkin, 1999; Fias & Verguts, 2004).
To summarize, the present study provides for the first time a psychophysical model capturing basic parameters of the ANS in the context of cross-notational approximate addition and subtraction problems. We replicated a previously reported tendency to underestimate during numeric estimation tasks. We report an internal Weber fraction well in line with previously reported values. Most importantly, we replicated the operational momentum effect, not only in purely nonsymbolic conditions but also in cross-notational trials. Relative to subtractions, additions were associated with larger responses. An overall miscalibration—that is, a tendency to over- or underestimate the results with respect to the correct outcome—was superimposed on this arithmetic bias. Depending on the particular notation, participants over- or underestimated with respect to the actual outcome. By combining the participant-specific ANS parameters in a simple model we were able to correct for this overall miscalibration during nonsymbolic and cross-notational arithmetic operations. However, the model was unable to account for the operation-specific bias. This suggests that the operational momentum effect has its origin in factors outside the ANS that remain to be modelled in future studies.
Funding
This work was financially supported by a grant of the European Research Council [grant number ERC-StG 210922] to M.Z. Additional funding for A.K. came from a grant of Deutsche Forschungsgemeinschaft [grant number DFG KN 959/2].