
Abstract
Circumstances in which the speech input is presented in sub-optimal conditions generally lead to processing costs affecting spoken word recognition. The current study indicates that some processing demands imposed by listening to difficult speech can be mitigated by feedback from semantic knowledge. A set of lexical decision experiments examined how foreign accented speech and word duration impact access to semantic knowledge in spoken word recognition. Results indicate that when listeners process accented speech, the reliance on semantic information increases. Speech rate was not observed to influence semantic access, except in the setting in which unusually slow accented speech was presented. These findings support interactive activation models of spoken word recognition in which attention is modulated based on speech demands.
Considering that about 20% of the US population speaks a language other than English at home (US Census Bureau, 2011), that there are more non-native than native English speakers worldwide (Graddol, 1997), and that there is an increasing trend in diversification and intermixing of cultures and nationalities across the world, it is very likely that a person will be exposed throughout their lifetime to a variety of both regional and foreign accents. Processing of accented speech is generally more difficult than processing of native speech. In this study, we examine whether difficulties in processing accented speech can be alleviated by semantic information and investigate the top-down effects of lexical semantics on processing sub-optimal speech. In addition to examining the effect of semantics on accented speech, we investigated the relationship between speech rate and access to semantic information. Since comprehensibility of faster speech is slower and more prone to errors than the processing of slower speech, we hypothesize that at faster rates, participants will rely more on semantic information.
Semantic influences on word recognition
One can characterize the semantic structure of concepts by defining salient features of those concepts. For instance, when a listener is presented with the word cat, the meaning of the concept cat, in return, can be characterized as the shared activation of features such as furry, animal, pet, and so on. This kind of representation of semantic structure has been shown to be very useful in describing the results from semantic priming and categorization tasks (McRae, de Sa, & Seidenberg, 1997; Mirman & Magnuson, 2009; Yee, Huffstetler, & Thompson-Schill, 2011), where words that are semantically similar are activated based on overlap in features. Mirman and Magnuson (2009) have shown that the processing of spoken words is modulated by the number of semantic neighbours and the degree of semantic feature overlap. Moreover, semantic feature representations have been very suitable from a modelling perspective, specifically in describing the structure of semantic memory and accounting for a wide range of empirical results (Cree, McRae, & McNorgan, 1999; McRae, Cree, Seidenberg, & McNorgan, 2005; McRae et al., 1997; Plaut & Shallice, 1993).
Defining the meaning of words through featural representations is not the only available option. Semantics is considered to be multi-dimensional and can incorporate such aspects as imageability (i.e., the degree to which the stimulus can be perceived through the senses), number of meanings, number of associates, and contextual dispersion (i.e., how often the same words appear across content areas). All these dimensions, including the feature dimension, have been shown to influence the speed of visual word recognition (see Yap, Pexman, Wellsby, Hargreaves, & Huff, 2012, who explored the influence of the above-mentioned dimensions in a variety of recognition tasks). General findings suggest that richer semantic representations facilitate processing in lexical decision tasks. Hence, in the visual domain, words with higher imageability ratings, more associates, more meanings, and more features show a benefit in processing. Figure 1 presents a meta-analytic summary of studies with factorial designs that examined the influence of feature semantics (i.e., the number of features, NOF, effect) on visual word recognition from lexical decision and semantic categorization tasks.
Studies with a factorial design that examined the effects of feature semantics on visual word recognition. Note that this figure does not include regression studies, which are much more prevalent in the literature. The filled diamond represents the average effect size (standardized mean difference) and the 95% confidence interval (CI) from a random effects meta-analysis. All studies in the figure had high precision (i.e., provided all the information needed to compute the effect size), except for the study by Rabovsky, Sommer, and Abdel Rahman (2012), who report a non-significant effect, but do not provide the means and the variance for the effect. For Rabovsky et al. (2012), we assumed an effect size of 0 and computed the variance based on the formula provided in comprehensive meta-analysis (CMA; Borenstein, Hedges, Higgins, & Rothstein, 2011).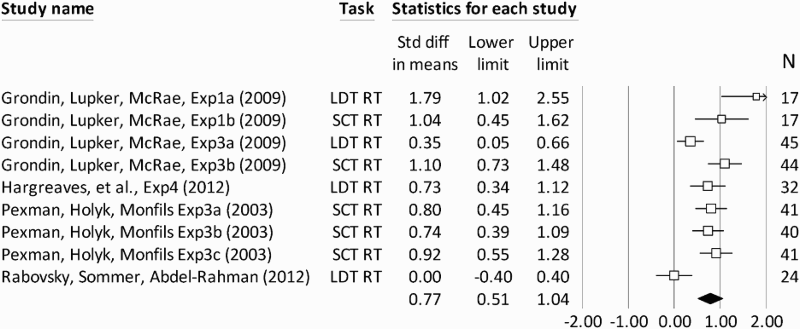
Previous research in visual (Pexman, Hargreaves, Siakaluk, Bodner, & Pope, 2008; Pexman, Lupker, & Hino, 2002; Yap et al., 2012; Yap, Tan, Pexman, & Hargreaves, 2011) and spoken word recognition (Sajin & Connine, 2014; Tyler, Moss, Galpin, & Voice, 2002; Tyler, Voice, & Moss, 2000) has shown that listeners are able to use information about the semantic structure of words during the recognition process. Moreover, it was generally found that increased processing demands created either because of adverse listening environment (e.g., presence of babble noise in background; Sajin & Connine, 2014) or because of lexical characteristics of words (e.g., word differing in their neighbourhood size; Tyler et al., 2000) led to greater reliance on semantic information.
Taking into account the dissimilarity between processing spoken words versus written words, Sajin and Connine (2014) investigated whether words with richer semantic representations are recognized faster. Specifically, they compared recognition for words that had a high number of features (high NOF) with words with a low number of features (low NOF) using the lexical decision task and the visual world paradigm (VWP). Words with higher number of features generally refer to concepts that have richer sensorimotor information as well as taxonomic information. For instance, the words bread and brick, despite being similar on a number of dimensions such as imageability, frequency, age of acquisition, and neighbourhood density, show large differences in the number of semantic features that participants provide in a feature listing questionnaire (see for details McRae et al., 2005). In this instance, the word bread has a larger number of features than the word brick. We focus on the feature dimension to index semantics because it showed robust effects in visual word recognition studies (see Figure 1). Sajin and Connine's (2014) findings suggest that words with higher number of features show faster recognition. Interestingly, they found that the difference among words on the feature dimension became particularly important when the processing demands were increased. For instance, recognition of an auditory target was delayed, and a NOF effect was found in the visual world paradigm only when both a target and onset competitor appeared in the display (e.g., subject heard high NOF word bread while being presented in the display with the target BREAD, onset low NOF competitor BRICK, and two distractors). In trials with no onset competitors in the display (i.e., with fewer processing demands on target selection), the NOF effect was absent. However, by embedding the token stimuli in babble speech, they found greater reliance on semantics in both competitor and no-competitor trials. These results suggest that when listeners are presented with spoken input that is degraded due to noise in the environment (e.g., babble), listeners experience delays in processing that subsequently enable them to rely on semantic information to speed up recognition. Background babble is but one circumstance under which listeners find themselves with additional processing demands, and in the following experiments we investigate whether speech rate and accent impact how semantics manifests when recognizing spoken words.
Recognition of accented speech
Accented speech produced by a non-native speaker leads to processing costs that are known to impact accuracy (Bradlow & Bent, 2008; Imai, Flege, & Walley, 2003; Munro & Derwing, 1995) and speed of recognition (Clarke & Garrett, 2004). Imai et al. (2003), for instance, found that English listeners are more accurate at recognizing words spoken in their native language without an accent than at hearing Spanish-accented words. Similarly, Munro and Derwing (1995) found that native English speakers were slower in transcribing sentences spoken in English by a Chinese speaker than sentences spoken in English by a native speaker. Despite the initial difficulty that listeners experience when processing accented speech, there is considerable evidence indicating that listeners learn to cope with the more difficult speech by adapting to systematic variation found in foreign accented speech (Baese-Berk, Bradlow, & Wright, 2013; Maye, Aslin, & Tanenhaus, 2008; Sidaras, Alexander, & Nygaard, 2009). For instance, Maye et al. (2008) created an artificial accent where front vowels were lowered in the vowel space (e.g., this led to a word like witch being pronounced as wetch). After exposure to a 20-min accented segment of the “Wizard of Oz”, listeners processed at test the newly learned production as being more word-like than listeners who had not been exposed to the novel accent.
A native speaker does not necessarily have to go through an adaptation process in order to recognize accented speech more accurately. Bradlow and Pisoni (1999) found that native listeners had greater transcription accuracy when presented with lexically “easy” words (low neighbourhood density and high frequency) in non-native English than when they had to listen to “hard” words (high neighbourhood density and low frequency) in non-native English. Moreover, they found that lexical information carries greater weight in recognition when non-native listeners rather than native listeners transcribed the non-native English speech. This finding indicates that for listeners who perceive speech as more difficult (e.g., a native speaker of English listening to Chinese-accented English), lexical information will play a more important role in spoken words recognition. This study further investigates the involvement of semantic information in the recognition of accented speech. In particular, we address the following question: When processing accented speech, do listeners of accented speech rely more on semantic information to help them recognize spoken words? To answer this question, this study compares the recognition of high and low NOF words for accented and native speech and tests whether the NOF effect is greater in the accented condition than in the native condition.
Speech rate and spoken word recognition
Faster speaking rates show greater impediments to processing spoken words than slower speech rates (Adank & Janse, 2009; Dupoux & Green, 1997). Bradlow and Pisoni (1999) found that words spoken at a fast rate have lower accuracy rates in a transcription task than words presented at medium and slow rates (medium and slow rates showed similar accuracy rates, suggesting that the effects of speech rate are nonlinear). Difficulty in processing faster speech has been generally attributed to faster speech having a somewhat degraded signal due to phoneme deletions and substitutions (Fosler-Lussier & Morgan, 1999) and more coarticulation and assimilation (Adank & Janse, 2009).
There are at least two ways in which prior research has investigated the influence of speech rate on word recognition. One approach examines how speech rate affects articulatory variation during production, and how that variation impacts processing. The second is to examine speech rate as a distal or global contextual cue. In the former approach, Byrd and Tan (1996) have shown that there are two ways that speech rate influences articulatory variation. Their production work shows that an increase in speech rate leads to an overall shortening in duration for each articulatory segment and an overall increase in overlap between articulatory units (see also Fosler-Lussier & Morgan, 1999). In other words, in order to talk faster, one increases the amount of coarticulation, deletions, and assimilations, as well as shortens the duration of each speech segment. An overall shortening in segment could be used to explain how speech rate affects the boundary for voice-onset time (VOT) when distinguishing voiced stop consonants (/b/, /d/, /g/) from voiceless consonants (/p/, /t/, /k/). Miller and Volaitis (1989) found that changes in speech rate (i.e., changes in duration of the segments) shifted the voice–voiceless category boundary as indicated by judgements that listeners made in a phoneme categorization task. Additionally, Shatzman and McQueen (2006) found that segment duration plays an important role in identifying word boundaries in connected speech. When Dutch listeners were presented with tokens such as “eens (s)peer,” “one (s)pear”, where the phoneme [s] could be shared between the two words, listeners were more likely to attribute the [s] to the second word if the duration of the [s] was longer. Shatzman and McQueen (2006) indicate that this perceptual effect is observed because segments with longer durations are more likely to be found as part of a word-initial position rather than a word-final position.
Speech rate has also been examined as a contextual cue as part of distal (in an utterance) or global context (in a conversation). Dilley and Pitt (2010) found that slowing a talker's speech around a target word led listeners to report the absence of the target word. Using targets that were embedded in either a fast or a slow rate context, they show that sentences with fast rate context led listeners to perceive function words that were not produced (e.g., perceiving leisure or time instead of leisure time), while sentences with a slow rate context led listeners to under-report the presence of function words that were produced (e.g., perceiving leisure time instead of leisure or time). According to Dilley and Pitt (2010), this is an indication that listeners use information about relative speech rates in order to identify and segment speech. Follow-up work shows that context speech rate effects can be found not only in distally occurring context (i.e., within an utterance), but also from the global speech rate context that listeners experience during a conversation (Baese-Berk et al., 2014).
In the following study, we examined properties of speech rate and semantics at the word level, and in keeping with this goal, the stimuli were recorded in isolation. Our manipulation thus cannot speak to the effects of contextual speech rate, but focuses on the effect of changes in segment duration and coarticulation on recognition of spoken words. Our prediction is that at faster rates of speech, words will be more difficult to process, subsequently leading to more top-down processing and a larger NOF effect. Under this prediction, listeners’ reliance on semantic knowledge will be impacted by the quality of the acoustic input under varying speech rates.
Summary
In the study described below, a set of lexical decision experiments were performed that examined the interaction between NOF and accentedness and the interaction between NOF and speech rate. Participants were presented with high and low NOF words either in an accented or in a native voice at one of the five speech rates (from very fast to very slow). We expected to observe a larger NOF effect for the accented condition than for the native condition. Additionally, we expected to observe a larger NOF effect for speech rates that are more difficult to process (i.e., very fast speech).
Experimental study
Method
Materials
Mean statistics for low number of features and high number of features stimuli used in Experiment 1.
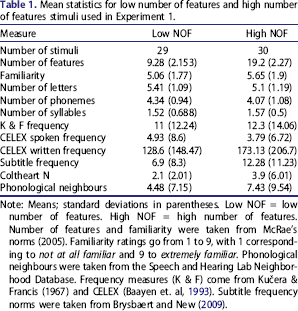
Note: Means; standard deviations in parentheses. Low NOF = low number of features. High NOF = high number of features. Number of features and familiarity were taken from McRae's norms (2005). Familiarity ratings go from 1 to 9, with 1 corresponding to not at all familiar and 9 to extremely familiar. Phonological neighbours were taken from the Speech and Hearing Lab Neighborhood Database. Frequency measures (K & F) come from Kučera & Francis (1967) and CELEX (Baayen et. al, 1993). Subtitle frequency norms were taken from Brysbaert and New (2009).
Stimuli were recorded in a very fast, fast, medium, slow, and very slow rate by a female native speaker of American English and by a male speaker whose native language was Romanian. The Romanian language has a smaller vowel inventory than American English (Labov, Ash, & Boberg, 2006; Mallinson, 1986; there are 7 vowels in Romanian compared to 13 in the North American English vowel system), and the missing vowel categories in Romanian are distributed across the vowel space. For native Romanian speakers of English this leads to speech where an English [æ] is produced as the Romanian [e] (Pittman, 2008). Romanian speakers also show a failure to make the tense/lax distinction between, for example, English [i] and [ɪ] (e.g., pronouncing Tim as team). Shared vowels also differ in their acoustic realization; for example, the Romanian [u] falls somewhere between the English [u:] and [o]. The consonant inventories of English and Romanian are similar but Romanian does not have dental fricatives or the nasal velar segments found in English. Similar to shared vowels, the phonetic realization of shared consonants differs somewhat. For example, unlike English, Romanian voiceless plosives are unaspirated. Salient characteristics of Romanian accented English include the trilled [r] and a tendency to substitute dental fricatives /ʺ/ and /Ð/ with labio-dental fricatives /f/ and /v/ (see Pittman, 2008 for an extensive analysis of the way in which a Romanian accent is expressed in English productions).
Mean duration (ms) for accent and native recordings in the very fast to very slow speech rates.
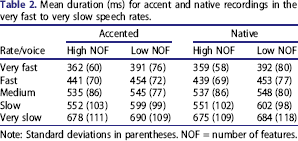
Note: Standard deviations in parentheses. NOF = number of features.
Participants
A group of 237 students at Binghamton University took part in the experiment in order to fulfil a psychology course requirement. All participants were native English speakers and reported normal hearing. Participants were assigned to one of 10 conditions: 2 (voice) × 5 (speech rates). Among participants in the native conditions, 24 heard recordings at a very fast rate, 23 heard recordings at a fast rate, 23 heard recordings at a medium rate, 25 subjects heard recordings at a slow rate, and 22 heard recordings at a very slow rate. In the accent conditions, 26 heard recordings at a very fast rate, 24 listened to recordings at a fast rate, 26 heard recordings at a medium rate, 18 participants heard recordings at a slow rate, and 26 heard recordings at a very slow speech rate. Subjects in the fast, medium, and slow rates were tested in a different semester from subjects in the very slow and very fast conditions.
Procedure
Participants were tested in groups of two or three in a sound-dampened room. Each subject was seated in front of a 15.7″ monitor, 1024 × 768-pixel resolution. During a trial a target word or a filler nonword was presented through closed-ear headphones, and participants had to make a lexical decision response by pressing the word or nonword key on the serial response box. Before the start of the experimental session, participants were provided with eight practice trials on which they had to achieve at least 80% accuracy, otherwise a second practice session was provided. Target and filler words were presented in a random order and were heard once, which made up a total of 132 trials. The whole experimental session lasted no more than 10 minutes. Participants were instructed to be both fast and accurate in their responses. Reaction times were measured from the offset of the spoken word until a response was made. Data collection and stimuli presentation was done through E-Prime 2.0 software (Schneider, Eschman, & Zuccolotto, 2002).
Data analysis
Analysis of RT data was done using linear mixed effects regression (Baayen, Davidson, & Bates, 2008) through lme4 package (Version 1.1–10; Bates, Maechler, Bolker, & Walker, 2015) in R (Version: 3.2.2; R Core Team, 2015). When specifying the random effect structure, we tried to follow suggestions provided by Barr (2013; see also Barr, Levy, Scheepers, & Tily, 2013), who recommended a maximal random effect structure that includes by-subject and by-item slopes for any within-unit effects and interactions that are used in the fixed effects structure of the model. A maximal random effects structure led to failure to converge, suggesting that the maximal model was over-parameterized (see Bates, Kliegl, Yosishth & Baayen, 2015). Consequently, we identified a random effect structure using the forward-fitting procedure from the LMERConvenienceFunctions package (Version 2.1) provided by Trembley (2015). The forward-fitting is an iterative model fitting procedure that compares a model without a particular random effect with a model that includes the random effect, and, based on likelihood ratio testing, this procedure retains the random effects that improve the model's fit while also removing random effects that lead to failure to converge.
When analysing RT data, we also observed some recommendations suggested by Baayen and Milin (2010) that relate to outlier trimming and auto-correlational structure of the data. Baayen and Milin suggest that minimal a priori outlier trimming combined with model based outlier removal outperforms traditional outlier screening procedures (e.g., removing subject-specific outliers 2.5 SDs from mean). Following their suggestions, we implemented very minimal a priori outlier removal and instead screened for outliers based on how normally the residuals of the fitted model were distributed. Additionally, we improved model fit by including variables that account for auto-correlational structure of the data. In particular, each linear mixed model that was tested included the previous trial reaction time (PreviousTrialRT) and the previous trial word/nonword status (PreviousTrialWord) as variables. Since presentation order in the experiment is randomized, the inclusion of these variables made the models that we tested less noisy and more sensitive to fixed effects. The p values were calculated using Satterthwaite approximation to degrees of freedom through the lmerTest package (Version 2.0–29; Kuznetsova, Krockhoff, & Rune, 2015). For all analyses, unstandardized regression coefficients, standard errors (SEs), t values, and significance levels are reported.
Analysis of accuracy data was performed using generalized linear mixed effects regression (GLMER) using similar procedures to what was done for RT analyses. Unfortunately, because there is a very small number of incorrect responses across various conditions, complex random effects and fixed effects structure led to failure in model convergence. To resolve this issue, we relied on a fitting procedure from the LMERConvenienceFunctions package. Unlike in the analysis for RT, where the fitting algorithm was used only to create a more parsimonious random effect structure, for accuracy data the fitting algorithm was used for both fixed and random effect structure. In particular, the following steps were used: (a) the fixed effects were first back-fitted, (b) the random effects were then forward-fitted, and lastly (c) the fixed effects were re-back-fitted.
Results
One subject from the accent very fast condition, who performed at chance, was removed. The rest of the subjects had accuracy above 70% and were retained. We retained the data for any words with at least 70% accuracy. 1
The following words (% accuracy) were removed from each condition:
Accent very fast: boots (68%), toad (68%), fence (68%), skillet (68%), bark (60%), spade (60%), guppy (56%), nylons (56%), olive (44%), bucket (40%), bouquet (24%).
Accent fast: bison (67%), guppy (67%), prune (67%), boots (42%), nylons (38%).
Accent medium: bucket (69%), finch (69%), nylons (65%), apron (62%), bison (54%), baton (23%), guppy (20%).
Accent slow: finch (67%), nylons (67%), guppy (56%), prune (56%), boots (28%).
Accent very slow: guppy (58%), bouquet (24%).
Native fast: bison (65%).
Native medium: finch (69%), bison (57%).
Native very slow: buckle (40%).
NOF effect across all groups.
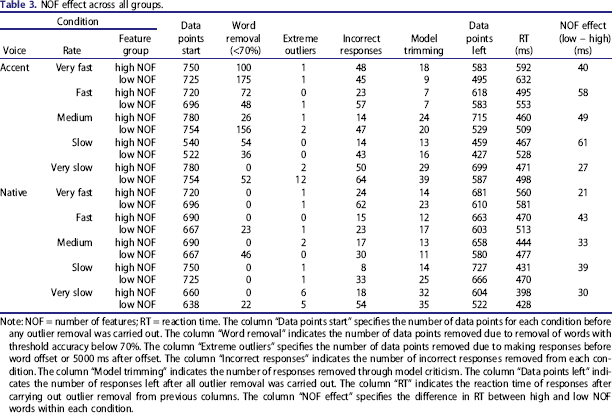
Note: NOF = number of features; RT = reaction time. The column “Data points start” specifies the number of data points for each condition before any outlier removal was carried out. The column “Word removal” indicates the number of data points removed due to removal of words with threshold accuracy below 70%. The column “Extreme outliers” specifies the number of data points removed due to making responses before word offset or 5000 ms after offset. The column “Incorrect responses” indicates the number of incorrect responses removed from each condition. The column “Model trimming” indicates the number of responses removed through model criticism. The column “Data points left” indicates the number of responses left after all outlier removal was carried out. The column “RT” indicates the reaction time of responses after carrying out outlier removal from previous columns. The column “NOF effect” specifies the difference in RT between high and low NOF words within each condition.
Selecting a threshold of 70% for word removal leads to biased data loss, because accented speech is more difficult to process and is thus likely to have a larger portion of responses lost due to words not meeting the required threshold. Moreover, as Table 3 indicates, words with low NOF, with poorer accuracy and higher RT, are more likely to be removed because of this threshold. This creates a downward bias for the NOF effect and leads to the RT analyses reported to be on the conservative side (when it comes to both the magnitude of the effect size and statistical significance). We performed another analysis in which the word removal threshold was set at 50% (see Supplemental Material). After lowering the threshold to 50%, the overall effect of NOF for the accented speech increased and remained unchanged for the native speech. We also performed an analysis where the three way interactions between NOF, rate, and accent were examined (see also Supplemental Material). Despite increased model complexity, the performance of this model was similar to that of the model reported in Table 3, χ2(2) = 2.70, p = .258, so we focus on reporting the more parsimonious model, which tested for two-way interactions.
Reaction time analysis
Reaction time data were log-transformed, since a visual inspection of reaction time density plot and one-sample Kolmogorov–Smirnov test for each condition showed that RT responses were not normally distributed (p < .0001 for all conditions), having a positive skew.
A linear mixed model (LMM) with random intercepts for subjects and items, by-subject random slopes for NOF condition, and by-item random slopes for rate condition was used. The fixed effect structure included NOF (high vs. low), voice (accent vs. native), rate (very fast to very slow), 2
Rate was recoded as 1 to 5 (very fast = 1 to very slow = 5). We performed LMER analyses either using rate as a factor variable and specifying multiple comparisons, or by using rate as numerical variable (ranging from 1 to 5). We did not note any interactions between NOF and rate for all of the multiple comparisons when rate was used as a factor, so we decided to present the model with the simpler output, where speech rate is treated as a continuous variable.
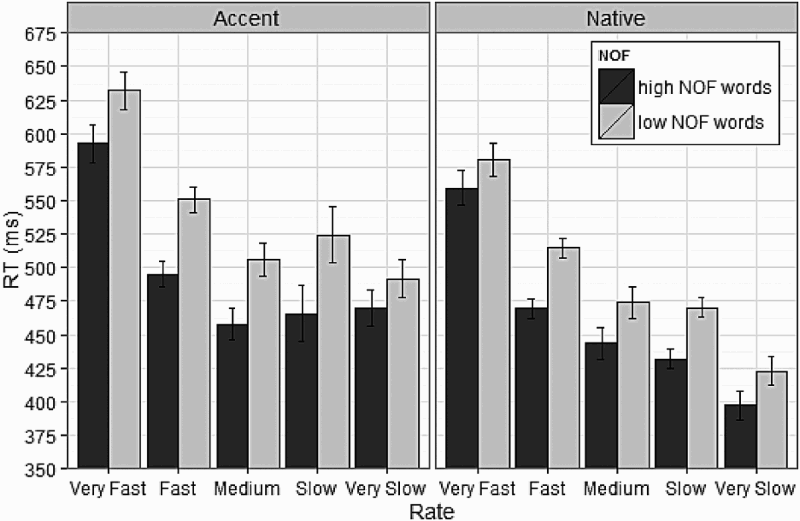
Number of features (NOF) effect (ms) for each native and accented voice across the five speech rates (very fast to very slow). RT = reaction time. The mean values for the NOF effect can be found in Table 3. Error bars represent confidence intervals (CIs). The graph depicts within-subjects variable CI (95%) using the method reported in Morey (2008). This method provides a more accurate understanding for making inferences between high and low NOF conditions, because CI reflect the inferential tests based on a within-subjects analysis of variance (ANOVA) mean square error (MSE) rather than regular between-subjects ANOVA. It is important to note that the CIs in this figure do not fully reflect the complexity of the experimental design (such as accounting for random variability due to items or inter-trial dependencies) as presented in the LMER models.
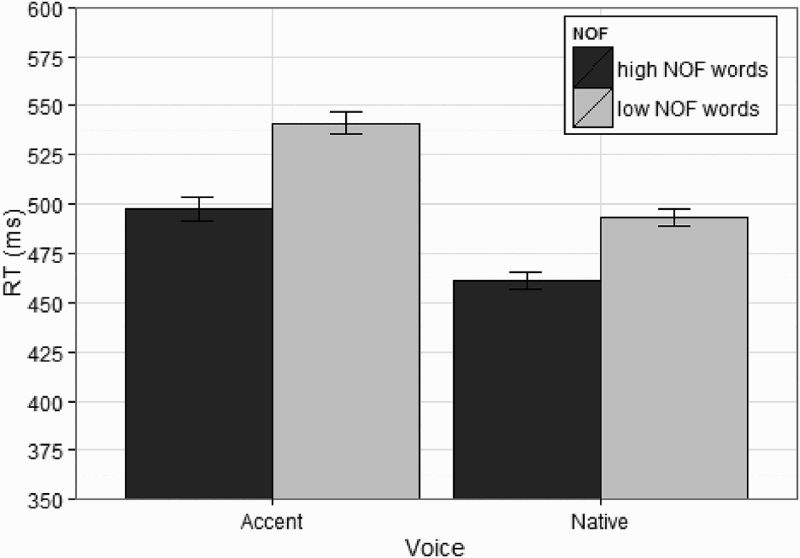
Number of features (NOF) effect (ms) for each native and accented voice after collapsing across the five speech rates. RT = reaction time. Confidence intervals (CIs; 95%) were plotted using the same procedure as that used in Figure 1.
Results of the model for RT analysis.
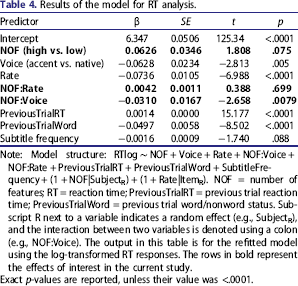
Note: Model structure: RTlog ∼ NOF + Voice + Rate + NOF:Voice + NOF:Rate + PreviousTrialRT + PreviousTrialWord + SubtitleFrequency + (1 + NOF|SubjectR) + (1 + Rate|ItemR). NOF = number of features; RT = reaction time; PreviousTrialRT = previous trial reaction time; PreviousTrialWord = previous trial word/nonword status. Subscript R next to a variable indicates a random effect (e.g., SubjectR), and the interaction between two variables is denoted using a colon (e.g., NOF:Voice). The output in this table is for the refitted model using the log-transformed RT responses. The rows in bold represent the effects of interest in the current study.
Exact p-values are reported, unless their value was <.0001.
The model presented in Table 4 examined the main effect of NOF, speech rate, and accentedness, as well as the interaction between speech rate and NOF and the interaction between accentedness and NOF. Results show a marginal effect of NOF, with high NOF words being recognized faster than low NOF words, and a main effect of speech rate, with words spoken at a fast rate generally taking longer to be recognized than words spoken in slower speech rates, an interaction between feature group and voice condition, which indicates that in the accent condition listeners show a greater NOF effect than in the native condition (see Figure 1 and RT in Table 3). No interaction between speech rate and NOF was observed, suggesting that listeners’ reliance on feature semantics is not dependent on speech rate. Lastly, a marginal effect of frequency was observed. 3
Although during norming items were controlled for CELEX and Kučera and Francis frequency, high and low NOF items differed from each other on newer subtitle frequency norms (Brysbaert & New, 2009). The addition of subtitle frequency, either as a stand-alone variable (as presented in Table 4), or as part of an interaction with other manipulated variables, led to no model improvements or led to the frequency effect becoming not significant, suggesting that the effects found in this experiment are unlikely to be due to frequency not being adequately controlled.
Accuracy analysis
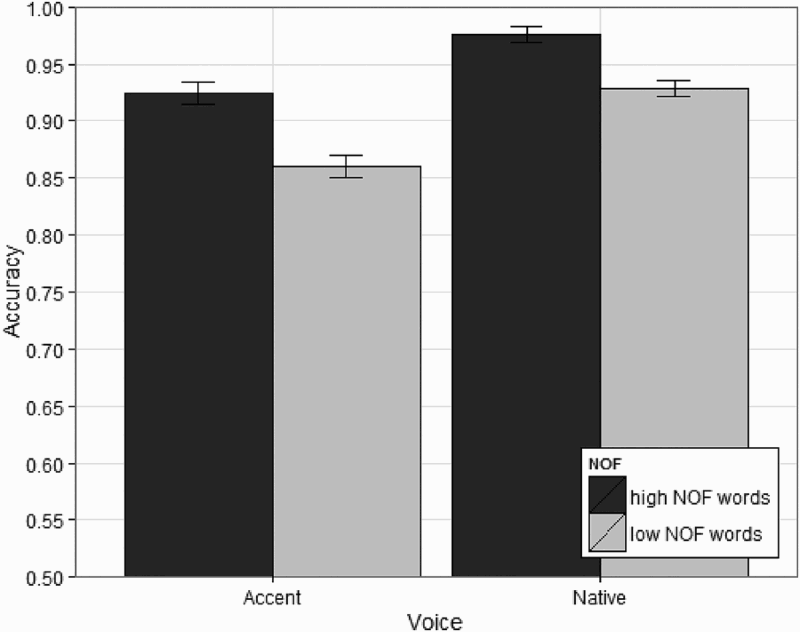
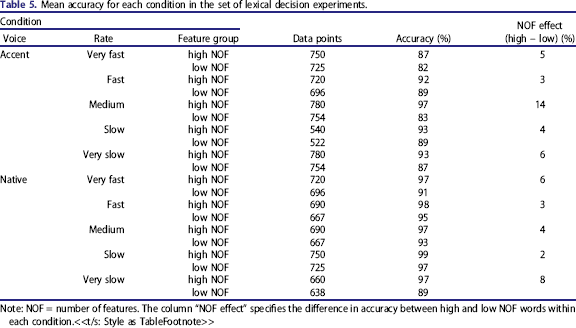
Accuracy (see Figures 4 and 5) was analysed using generalized linear mixed effects regression (GLMER). In order to minimize any bias occurring due to outlier removal, accuracy was analysed based on the original dataset, before any outlier removal was carried out. Table 5 indicates the number of data points for each condition as well as accuracy in each condition.
Accuracy depicting the number of features (NOF) effect for each native and accented voice across the five speech rates (very fast to very slow). Confidence intervals (CIs) were calculated using the same method as that in Figure 1. Accuracy depicting the number of features (NOF) effect for each native and accented voice after collapsing across speech rates. Confidence intervals (CIs) were calculated using the same method as that in Figure 1. Mean accuracy for each condition in the set of lexical decision experiments. Note: NOF = number of features. The column “NOF effect” specifies the difference in accuracy between high and low NOF words within each condition.<<t/s: Style as TableFootnote>>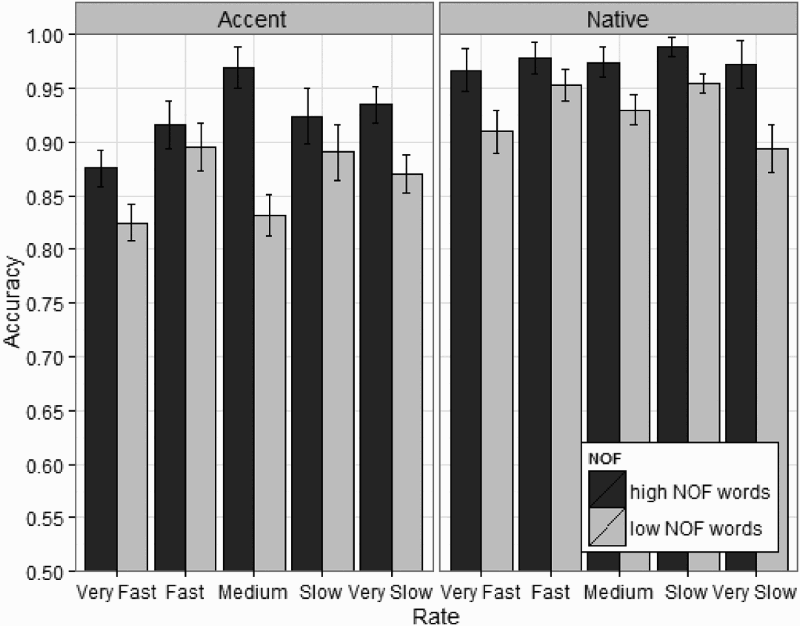
Results of the GLMER model for the accuracy data.
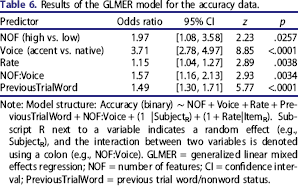
Note: Model structure: Accuracy (binary) ∼ NOF + Voice + Rate + PreviousTrialWord + NOF:Voice + (1 |SubjectR) + (1 + Rate|ItemR). Subscript R next to a variable indicates a random effect (e.g., SubjectR), and the interaction between two variables is denoted using a colon (e.g., NOF:Voice). GLMER = generalized linear mixed effects regression; NOF = number of features; CI = confidence interval; PreviousTrialWord = previous trial word/nonword status.
The results of the model indicate a main effect of NOF, with low NOF words 1.97 times more likely to have incorrect responses than high NOF words (z = 2.23, 95% confidence interval, CI [1.08, 3.58]), a main effect of voice, with accented conditions 3.71 times more likely to have an incorrect response (z = 8.85, 95% CI [2.78, 4.97]), a main effect of rate, with accuracy being lower at faster speech rates (odds = 1.15, z = 2.89, 95% CI [1.04, 1.27]), and a main effect of PreviousTrialWord (odds = 1.49; z = 5.77, 95% CI [1.3, 1.71]), indicating that subjects are more likely to respond correctly on the current trial if on the previous trial they were asked to respond to a word stimulus. Additionally, a significant interaction between NOF and voice was observed: The difference in accuracy between high and low NOF words was greater for accented conditions than for native conditions (odds = 1.57; z = 2.933, 95% CI [1.16, 2.13]).
General Discussion
In this experiment it was hypothesized that greater semantic effects will be observed for speech that is more difficult to process. This hypothesis was driven by previous findings indicating that listeners have early access to semantic knowledge and that semantic information becomes more important when listeners hear degraded speech (i.e., speech embedded in babble; Sajin & Connine, 2014). Hence, if accented speech is more difficult to process than native speech, one should see a greater NOF effect for the accented speech. Similarly, if various speech rates create processing difficulties for listeners, one should also observe an associated increase in the NOF effect.
Overall, the results reported in Figure 2 and Table 3 indicate that listeners use semantic information during speech processing. Moreover, the effect of semantic knowledge is larger in the accented speech conditions than in the native speech conditions, suggesting that when listeners hear accented speech, having access to semantic feature information aids in processing spoken words. Figure 2 also indicates that variability in speech rate does not generally influence access to semantics (i.e., the NOF effect remains fairly constant across speech rates).
The absence of an interaction between speech rate and NOF must be interpreted with a caveat. Although there is no overall interaction between rate and NOF, Figure 2 indicates that the effect of NOF changes across speech rates within the accent condition. For instance, in post hoc LMM analyses for the accent condition, the NOF effect in very slow speech (27 ms) is smaller than the NOF effect observed for the fast (58 ms; t = 1.99), medium (49 ms; t = 2.527), and slow rates (61 ms; t = 1.97), but comparable to the very fast rate (40 ms; t = 1.39). In other words, at abnormally slow speech rates, the NOF effects for the accent condition are relatively smaller than those for most of the other speech rates. An explanation for why unusually slow speech impacts access to semantic information for the accent condition might be because slow speech enhances the characteristics of the accented speech. For instance, Munro and Derwing (2001; see also Munro & Derwing, 1998) indicate that perceived accentedness and the comprehension of accented speech has a nonlinear relationship to speech rate, with very slow speech and very fast speech having higher accented scores and poorer comprehensibility. Accented speech in between very fast and very slow was judged as more optimal by native listeners. This implies that, in contrast to fast speech, in which the acoustic–phonetic information is more heavily overlapped and reduced via co-articulation and assimilation processes, slow speech draws out the acoustic information that makes accented speech different from native speech. For instance, Romanian speakers substitute the English dental fricative /ʺ/ with the labio-dental fricative /f/, pronouncing the expression “three fries” as “free fries”. Munro and Derwing (2001) indicate that when processing very slow accented speech, rather than focusing on processing the word, listeners fixate on phonological processing of mispronunciations (e.g., will note that the speaker mispronounced three as free). Thus, the rich acoustic–phonetic properties in slow speech will paradoxically impair processing of an accent, since listeners are not engaging in lexical access but rather focus on phonological processing of mis-pronunciations.
This explanation suggests that accented speech in the very slow rate should be perceived as being more accented than the accented speech presented at faster speech rates. To support this view, we collected transcription and ratings data from an additional 50 students who did not participate in the lexical decision task and who had to transcribe and rate the degree of accentedness for the very slow and medium rate accented words (see Appendix C for details). Results of the transcription analyses indicate that high NOF words were transcribed more accurately than low NOF words across both speech rate conditions (a pattern consistent with accuracy in the lexical decision data in which high NOF words were recognized more accurately than low NOF words). The ratings data show that very slow speech is rated as more accented than medium speech. These results indicate that there is a limit to the usefulness of semantic information when processing non-native speech. Slight deviations from expectations in the acoustic input can be corrected through feedback coming from listeners’ semantic representations; nonetheless, if the deviation in the input is too extreme, semantic information stops helping with processing.
Effortful listening and NOF
Why is there a greater NOF effect in the processing of accented speech rather than of native speech? One possibility is that during the processing of difficult speech, there is increased use of executive resources that enable the listener to focus on processing the acoustic input in order to match it with an internal linguistic representation (Van Engen & Peelle, 2014). If the listener hears a clear, unambiguous acoustic input, the comprehension process proceeds without a need to rely on top-down feedback from semantic knowledge. Nonetheless, if the acoustic input is a poor match to the listeners’ perceptual expectations, such as when listening to accented speech, then compensatory executive resources are recruited in order to speed up recognition. In a meta-analysis of 10 neuroimaging studies, Adank (2012) found that during the comprehension of distorted speech (e.g., speech with background noise, unfamiliar accent), listeners show increased bilateral activation for areas associated with general executive processing, such as anterior superior temporal sulcus (STS) and posterior middle temporal gyrus (MTG), regions that are sensitive to the intelligibility of a stimulus and processing of word meaning (Acheson & Hagoort, 2013). Similarly, Wild et al. (2012) report that the process of comprehending degraded speech depends on directed attention. Wild et al. found that clear speech is encoded and processed successfully regardless if participants are told to attend to it or not, while degraded speech was processed successfully only when participants were directly attending to it. This could be an indication that increased NOF effects in the accented speech in our study are due to a process of effortful listening and top-down integration of semantic knowledge (see also, for a possible neural mechanism, Sohoglu, Peelle, Carlyon, & Davis, 2012).
Support for a cognitive control mechanism for speech recognition has also been provided by studies examining age-related differences. As an individual ages, speech recognition generally becomes more effortful and slow. This decline is mainly attributed to hearing loss but also to declining grey matter volume in the temporal lobe (Eckert et al., 2008). Eckert et al. (2008) found that in older listeners cognitive control systems are used to a greater degree than in younger listeners during word recognition. Reliance on cognitive control mechanisms in frontal brain regions is increased in order to compensate for decreased grey matter volume in the temporal regions. This suggests that repeating the set of experiments in this paper with an older population with no cognitive control impairments should lead to even greater NOF effects across all conditions.
Attention is likely to play a key role in the modulation of semantic effects observed during word recognition. Research on spoken word recognition has shown that listeners are both highly adaptable and highly flexible in using lexical knowledge. An early demonstration of flexibility is the work of Cutler, Mehler, Norris, and Segui (1987) who showed that lexical information is not automatically used by listeners—the advantage for processing words over nonwords varies with both task and stimulus characteristics (see also, Eimas, Marcovitz Hornstein, & Payton, 1990). Mirman, McClelland, Holt, and Magnuson (2008) found that the lexicality effect between word and non-word stimuli is bigger when the task involves a larger proportion of word items (e.g., 80% of items are words vs. 20% non-words). In other words, if the task parameter biases participants towards using lexical knowledge, a greater effect is observed. The finding that task demands can modulate the influence of lexical knowledge has prompted the development of interactive theories that incorporate a dynamic process for directing attention across levels of representation.
Of particular interest are extensions of the TRACE model specifically designed to accommodate flexible deployment of attention. Mirman et al. (2008) instantiate attention by modulating activation of lexical form representations within the interactive architecture of TRACE. A decrease in lexical feedback accompanies decreased overall lexical activation based on task demands; simulations of the model indicate that lexical effects decrease when lexical units are modified to be less responsive to excitatory input. In other words, if the listener expects to hear mainly non-words, then lexical units are less likely to be activated, and there will be diminished feedback. A process of effortful listening may provide insight into how attention is used to enhance increased semantic/lexical feedback.
Implications, limitations, and future research
Although semantic effects have been investigated extensively in visual word recognition (Amsel & Cree, 2013; Pexman et al., 2008; Pexman, Holyk, & Monfils, 2003; Pexman et al., 2002; Yap et al., 2012; Yap et al., 2011), the literature documenting how semantic knowledge directly impacts processing of spoken words is fairly scarce. Except for a handful of experiments examining the impact of imageability (Tyler et al., 2000) and NOF (Sajin & Connine, 2014), the extent and strength of lexical semantic effects on spoken word processing remain to be examined in other tasks (e.g., sentence processing, semantic categorization) and across a larger range of semantic dimensions (e.g., sensory experience, concreteness). However, the findings provide a replication of previous experiments (Sajin & Connine, 2014) that point to an important influence of lexical semantics on spoken word recognition. This is a valuable insight, since the benefits conferred by semantics in recognizing orthographic word forms are not necessarily translatable to the spoken word domain. After all, the presentation of the input between the two domains differs. The speech signal is continuous, highly variable, and time dependent, while the input presented in orthographic form is static. The time-dependent nature of the auditory input has focused empirical and theoretical efforts on onset and rhyme competitor activation (Allopenna, Magnuson, & Tanenhaus, 1998; Connine, Blasko, & Titone, 1993; Dahan, Magnuson, Tanenhaus, & Hogan, 2001; Zwitserlood, 1989), where the degree of match between a spoken word and its representation influences activation. The experiments reported here extend prior research by considering the effect of semantics in conjunction with important speech properties known to influence spoken language processing (rate and accentedness).
Language processing typically occurs in a discourse situation, so it important to further examine semantic effects in sentential context. Sentence and discourse context can contribute to activation of semantics in a way that mitigates the impact of less efficient lexical access (see review by Federmeier, 2007). Further, slow speech in a discourse context may facilitate computation of sentence-level representations that will not be revealed by recognition of individual words. For example, introduction of pauses in time-compressed speech provides listeners with the time necessary to catch up (Wingfield, Tun, Koh, & Rosen, 1999), and the combination of contextual constraint and slow speech may serve a similar function. Consistent with this suggestion, Love, Walenski, and Swinney (2009) showed that slowed speech interferes with sentence-level processes involved in syntactic representations (e.g., determining pronoun reference) but improves processes that take into account semantic and pragmatic constraints.
Finally, this study indicates that effects of semantic knowledge on spoken word processing can plateau and eventually diminish if speech differs significantly from what is typical (e.g., accented speech with a very slow rate), suggesting that if speech becomes harder to process, semantic effects increase, but only up to a point. Nonetheless, we have observed the plateau for our semantic effect only in one condition (the accented speech presented at a very slow rate), so it is important to further test whether the constraint on use of semantics generalizes to other types of atypical or difficult-to-process speech. For instance, one suggestion would be to compare speakers of the same accent but with different degrees of accentedness. In this scenario, semantic effects for the heavily accented speech might be smaller than those for the less accented speech.
Disclosure statement
Authors have no financial benefit from the direct application of the research presented in this paper.