
Abstract
Previous psychophysical studies at durations greater than 1000 ms have confirmed the anecdotal reports of an increase in the perceived duration of both positively and negatively valenced emotive stimuli; however, the results of studies at durations less than 1000 ms have been inconsistent. This study further investigated the effect of valence on the perception of durations less than 1000 ms. We used both positively and negatively valenced stimuli in order to compare their effects on the distortion of duration, and we tested multiple data points within the sub-one-second range. We found an increase in the perceived duration of both positively and negatively valenced emotional stimuli at all data points. This is consistent with studies at durations longer than 1000 ms and also with models of temporal processing. We also confirmed that Weber fractions, within the range tested, followed the generalized form of Weber’s law.
“Time stood still” is a common expression describing the perception of time slowing down when one is exposed to dangerous or emotional stimuli; however, the processes that underlie the perceived duration of emotional stimuli (affective chronometry) are not fully understood (Davidson, 2015). One aspect of affective chronometry that is particularly unclear and has had inconsistent findings is the distortion of duration at intervals less than 1000 ms. Another aspect that is not fully understood is whether the distortions are caused by changes in arousal levels or by changes in attention (Grondin, Laflamme, & Gontier, 2014).
Psychophysical techniques have been used to investigate and quantify the distortion at durations greater than 1000 ms, and studies have consistently confirmed anecdotal reports of an increase in the perceived duration of emotive stimuli (Droit-Volet, Brunot, & Niedenthal, 2004; Droit-Volet & Meck, 2007; Tipples, Brattan, & Johnston, 2015). However, studies at durations less than 1000 ms have inconsistent findings. Studies have found an increase in the perception of duration of emotive stimuli, including fear- and disgust-inducing images (Gil & Droit-Volet, 2012), disgusting mutilation images but not disgusted faces (Grondin et al., 2014), and threatening but not disgust-inducing images (Shi, Jia, & Müller, 2012).
Another inconsistent finding at durations less than 1000 ms is the effect of the sign of the valence of the stimulus. While studies at durations greater than 1000 ms have consistently found that both positively and negatively valenced stimuli increase the perceived duration of the stimulus, Smith, McIver, Di Nella, and Crease (2011) found that the estimation of duration varied depending on the sign of the emotional valence. At 1000 ms, negative image durations were overestimated, and positive image durations were underestimated; however, at 200 ms, negative image durations were underestimated but there was no effect on the estimated duration of positive images. These findings are problematic in relation to the dominant theoretical model of human temporal processing. This model suggests that the perception of an increase in the duration of emotive stimuli is caused by an increase in arousal, speeding up the internal clock (Droit-Volet & Meck, 2007). If this is the case, then both positively and negatively valenced, arousing stimuli should cause an increase in the perception of duration.
The effect of arousal on duration estimates can be explained by scalar expectancy theory (SET) and attentional gate theory (AGT). SET has been the dominant model of human temporal processing at shorter intervals since the late 1970s (Buhusi & Meck, 2005; Gibbon, 1977; Grondin, 2008, 2010a; Lewis & Miall, 2009; Wearden, Denovan, Fakhri, & Haworth, 1997). In SET, temporal processing occurs using a single pacemaker, or internal clock, that generates “ticks” that are stored in an accumulator. The number of accumulated ticks in a period is then used for temporal computations. For example, when comparing two intervals, the number of ticks accumulated in the first duration is compared to the number of ticks accumulated in the second duration. Replicating an interval in motor control can be achieved by recreating the number of ticks stored in memory from previous experience. This single internal clock could, at least in theory, be used for processing any duration from milliseconds to hours by accumulating additional ticks—in much the same way as a digital watch accumulates vibrations from a quartz crystal.
AGT is a development on SET and proposes a gate mechanism that regulates the flow of ticks to the accumulator (Zakay & Block, 1996). AGT proposes that increased attention opens the gate mechanism wider, increasing the number of ticks accumulated in a given period, thereby increasing the perceived duration of the period. Studies have attempted to discriminate between the effects of attention and arousal in the perception of an increase in duration. Grondin et al. (2014) suggest that arousal is the most robust explanation for explaining some emotional effects; however, further evidence is required to rule out the involvement of attention.
A further way to test for the effects of arousal would be to compare the effects of positively valenced images with high levels of arousal to those of negative images with similarly high levels of arousal. If the effects were similar, this would support the arousal theory; however, if the effects were dissimilar, this would suggest that other mechanisms such as attention may be involved.
This study used psychophysical techniques to examine the distortion of duration caused by positive- and negative-valenced emotional stimuli, with the metric for systematic distortions or errors being changes in the point of subjective equality (PSE) between the two alternative stimuli. The PSE for duration represents the respective durations at which two stimuli are perceived as equal. The direction and magnitude of any difference between their physical durations at the PSE reveal a temporal distortion, given an experimental manipulation of the second stimulus.
We used a two-alternative, forced-choice (2AFC) paradigm to present the two stimuli. This reduced the chance that differing memory processes across durations could influence the result. One possible explanation for previous inconsistent findings is the extensive use of learned duration methods. For example, in the bisection point version, two reference durations are learnt by the participant. A single test stimulus with a duration between the two learnt durations is then presented, and the participant has to choose whether the test duration is closer to the longer or shorter learnt duration. This may influence the results due to involving either different memory processes or different levels of memory resources at, for example, 200 ms compared to 1000 ms.
We used both positively and negatively valenced stimuli to identify any differences in PSE shift caused by valence. We compared successive durations ranging from 50 ms to 1600 ms in order to identify any differences or changes in the effect across the range of durations. Finally, we examined Weber fractions (WFs) at each duration, to measure the resolution of the temporal processing system at that duration and to confirm that our experimental paradigm was providing clean data.
Experimental study
Method
Participants
One of the authors (M.C.) and four undergraduate students from the Australian National University (ANU) participated in this experiment (three males, two females). The undergraduate students provided written informed consent, as per the ANU Human Research Ethics Committee’s requirements, and they were paid for their time.
Apparatus and stimuli
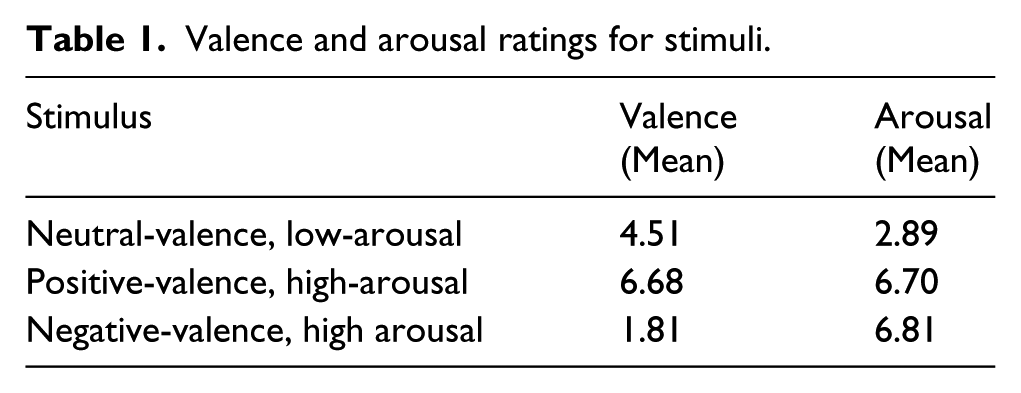
Stimuli were colour images taken from the International Affective Picture Systems (IAPS) database (Lang, Bradley, & Cuthbert, 2005). There were 20 neutral-valence, low arousal images, 20 positive-valence, high-arousal images and 20 negative-valence, high-arousal images. Images were taken from multiple subsets to avoid systematic biases in spatial frequency (Delplanque, N’diaye, Scherer, & Grandjean, 2007). Valence and arousal classifications were based on ratings included in the IAPS database and are shown in Table 1. Ratings are based on a scale of 1 = low and 9 = high.
Valence and arousal ratings for stimuli.
Stimulus size was 448 × 336 pixels, presented at a distance of 1.1 m with a visual angle of 7.5 × 5.6°. Stimuli were presented on a Sony Multiscan G400 CRT monitor at 100 Hz driven by Cambridge Research Systems Visage hardware and software (Version 1.26) and a Dell Precision T3400 PC. The experiment was programmed using Matlab (Version R2012b) and Psychtoolbox-3.
Design and procedure
A temporal 2AFC design was used to compare the duration of two images. The neutral-valence reference image was shown in the first interval, and the duration of this image was compared to the varying duration of the second image. The order effect caused by using this method was identified by including blocks comparing the durations of two neutral images.
The experiment consisted of three blocks where the second image had a valence that was neutral, positive, or negative, with 135 trials in each block. The 135 trials consisted of nine comparison data points (see Table 2), each presented 15 times, with comparison durations randomized within each block. The order of valence and duration blocks was randomized. Across conditions, the reference durations tested were: 50 ms, 100 ms, 200 ms, 400 ms, 800 ms, and 1600 ms.
Comparison data points.
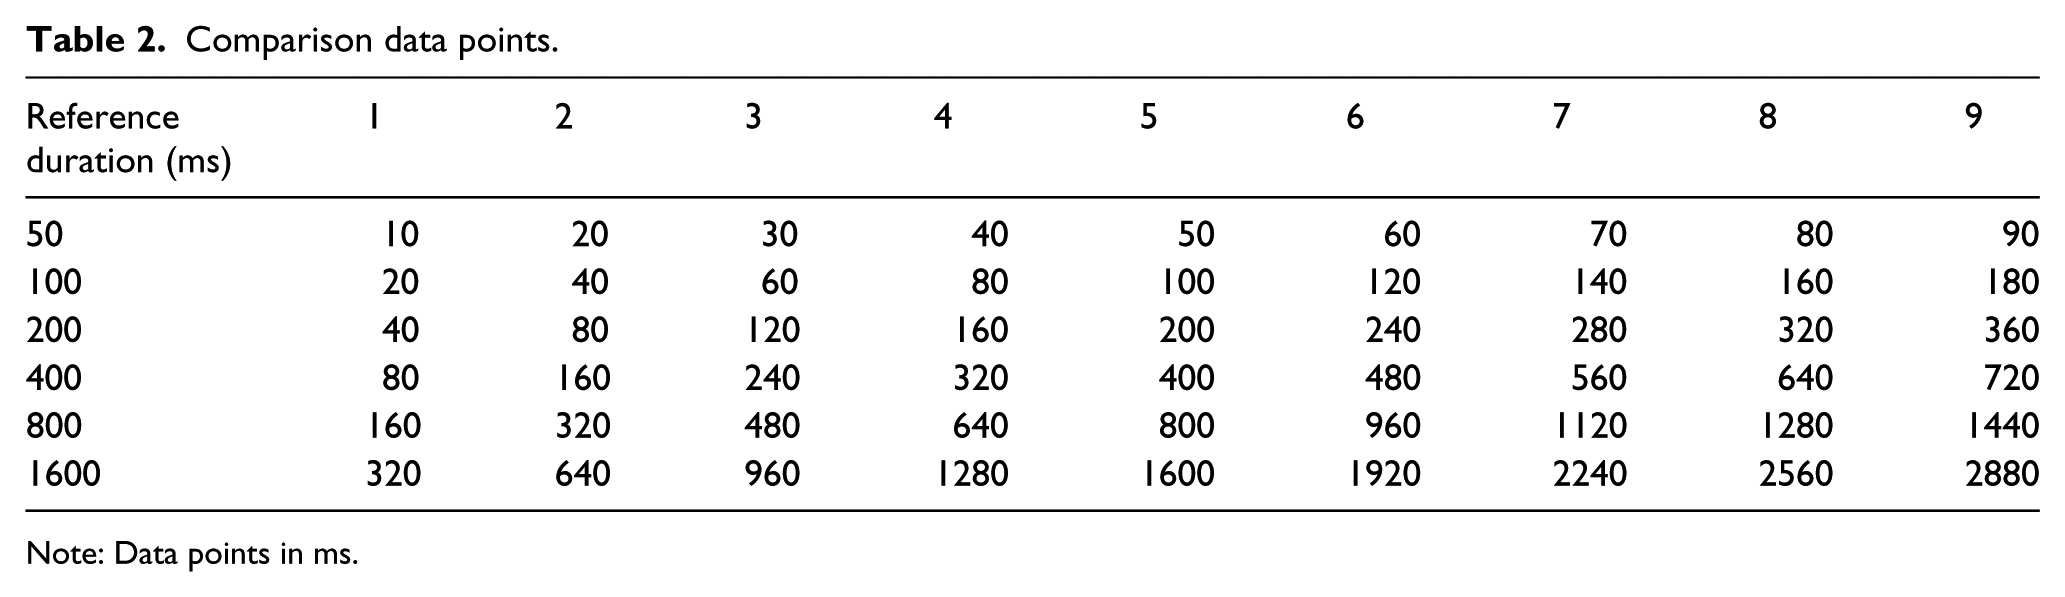
Note: Data points in ms.
A blank, grey screen was shown at the beginning, inter-stimulus interval (0.75 s), and end of each trial. Participants were required to indicate which image was presented for the longest duration (first or second). Responses were captured on a keyboard using the left arrow key for the first image and the right arrow key for the second image. The response initiated presentation of the following trial.
Data analysis
Responses were captured in Matlab and were then transferred to Prism Graphpad (Version 6.02) and fitted to a psychometric curve—a cumulative Gaussian function. This curve was used to calculate the PSE shift and WF for each participant, for each valence–duration combination. PSE shift was calculated by dividing the duration at which the probability was .50 that the test (second) image was perceived to be long, by the reference duration. This provided a proportionate measure of PSE shift to allow comparison between reference durations. WF was calculated using the formula WF = (D.75 – Dref)/Dref, where D.75 was the duration at which the probability of perceiving the test image as being long was .75, and Dref was the reference duration. WF may be calculated using the mean of D.75 – Dref and Dref–D.25 as a numerator; however, we used a proportional scale, therefore our curve was symmetrical, and D.75 – Dref provides the same numerator. Psychometric curves are typically plotted using a linear x axis. However in this experiment, we used a 2AFC method where the duration was varied above and below the reference duration. In this case, a linear scale would be mathematically incorrect as the shorter duration should always be considered as the reference duration to maintain proportionality. In the reported results, we therefore used an inverse log scale for the x axis as this maintains proportional consistency across the range of durations. The results were analysed using both linear and inverse log scales, and no significant difference in outcome was found. Although the inverse log scale is more correct, it is unlikely to produce a different result to the linear scale unless the slope of the psychometric curve is very flat (the WF is large).
Results
The results of primary interest in our study were the PSE shifts, and these would typically be reported first. However, the calculation of Weber fractions revealed a threshold effect at the 50-ms data point. Therefore this data point was not included in the analysis of PSE shifts. The Weber fraction results have been reported first in order to explain this issue before moving on to the PSE shift results.
Weber fractions
Weber fractions (WFs) are plotted by duration for each valence in Figure 1. WFs between 100 ms and 1600 ms were relatively flat with a mean of .17; however, there was a sharp increase at 50 ms (M = .33).
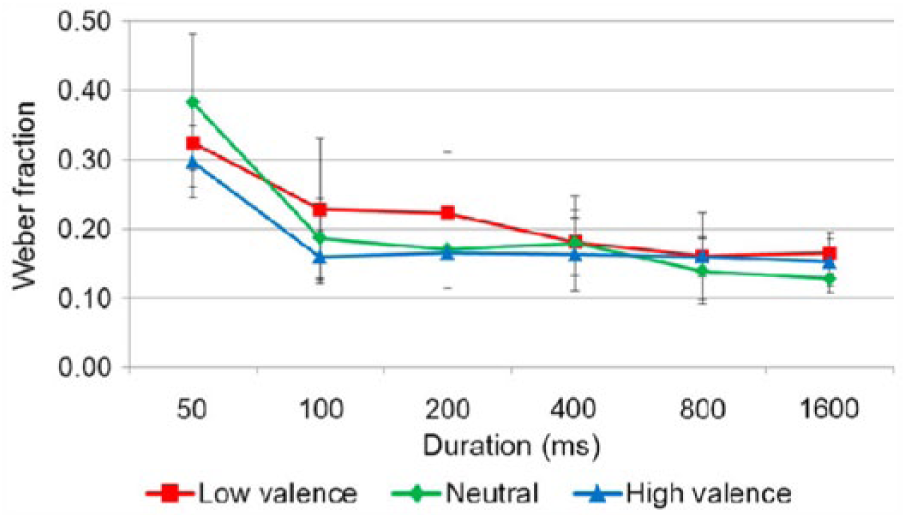
Weber fraction by duration for each valence. Error bars represent standard errors. To view this figure in colour, please visit the online version of this Journal.
The results were analysed with all durations included using an omnibus 3 (valence) × 6 (duration) repeated measures analysis of variance (ANOVA) to determine whether valence or duration affected WFs. The effect of duration was significant, F(5, 20) = 11.03, p = <.001, η2p = .734. The effect of valence was not significant, F(2, 8) = 1.13, p = .369, η2p = .221. There was no interaction effect between valence and duration, F(10, 40) = 1.38, p = .225, η2p = .256.
It appeared that the duration effect was driven by the 50-ms data point (see Figure 1). To confirm this, an additional 3 (valence) × 5 (duration) repeated measures ANOVA was performed, excluding the 50-ms data point. Once this result was excluded, the effect of duration was no longer significant, F(4, 16) = 1.11, p = .386, η2p = .217. The effect of valence was still not significant, F(2, 8) = 1.25, p = .337, η2p = .238. There was no interaction effect between valence and duration, F(8, 32) = 0.78, p = .621, η2p = .165.
PSE shift
PSE shifts are plotted in Figure 2. The 50-ms data point was excluded due to the threshold effect at 50 ms (identified under the WF results, see Figure 1). The PSE shift for the low-valence (negative) and high-valence (positive) images was greater than that for the neutral images, at all durations—that is, when they were the same duration, the duration of the valenced images was perceived as longer than that of the neutral images; however, there was no difference between the PSE shifts for the high-valence and low-valence images. There was an effect of duration; however, this was probably due to the fluctuation in the order effect across durations—theoretically, comparing two neutral images should result in a zero PSE shift; however, time order effects can cause the second image in a sequence to appear to be a different duration to the first image, even if the images and durations are identical (Grondin, 2008). The neutral line represents this order effect at each duration, as both images in the 2AFC comparison were neutral.
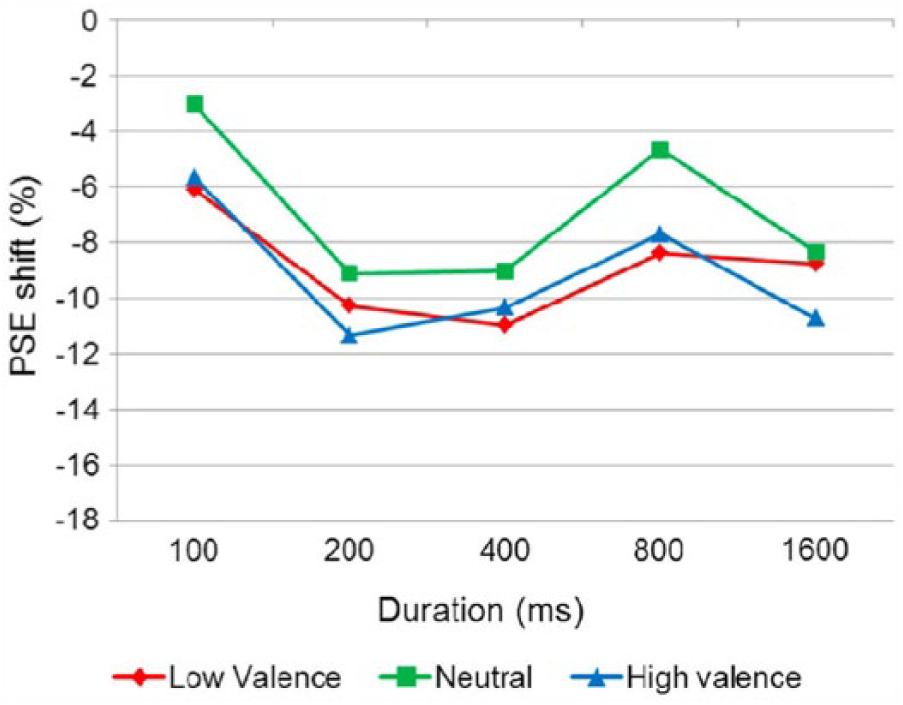
Point of subjective equality (PSE) shift for the second image in comparison to the first image. Error bars represent standard errors. To view this figure in colour, please visit the online version of this Journal.
The psychometric functions were tested for goodness of fit, which was found to be satisfactory (mean R2 = .98). Statistical analysis was performed using an omnibus 3 (valence) × 5 (duration) ANOVA to determine whether valence or duration affected PSE. The effect of duration was significant, F(4, 16) = 4.764, p = .010, η2p = .544. The effect of valence was also significant, F(2, 8) = 5.554, p = .031, η2p = .581. There was no interaction effect between valence and duration, F(8, 32) = 0.59, p = .779, η2p = .128.
Statistical analysis was then performed on the data set after adjusting for the order effects, by subtracting the neutral result from the valence result, at each duration, and using an omnibus 2 (valence) × 5 (duration) ANOVA. The effect of duration was no longer significant, F(4, 16) = 0.080, p = .791, η2p = .020. The effect of valence was also no longer significant, F(1, 4) = 0.391, p = .812, η2p = .089. There was no interaction effect between valence and duration, F(4, 16) = 0.931, p = .471, η2p = .189.
General discussion
This study used psychophysical techniques to examine the distortion of duration caused by emotional stimuli. Changes in systematic distortions or errors in duration were measured using PSE shifts. We used both positively and negatively valenced stimuli to identify any differences in distortion caused by valence. We used a 2AFC paradigm to reduce the memory requirements in comparison to the learned duration paradigm. We compared successive durations ranging from to 50 ms to 1600 ms to identify any differences or changes in the effect within this range. Finally, we examined WFs at each duration, to measure the precision of the temporal processing system and confirm that our experimental paradigm was providing clean data.
We found that both positive and negative images were consistently perceived as lasting longer than neutral images, and we found no effect of duration. These findings are consistent with studies at intervals longer than 1000 ms and confirm that emotional stimuli cause an increase in the perception of duration below 1000 ms. We also found that the increase was independent of emotional valence, suggesting that the effect is more likely to be related to arousal than to attention.
We also found an unexpected change in the time-order effect (TOE) between durations. When comparing two neutral images there should be no valence-driven PSE shift; any systematic shift can be attributed to the TOE. The TOE was originally documented by Fechner (1860). During Fechner’s experiments with successively lifted weights, he noted that the ratio of correct to incorrect judgements varied, depending on whether the incremental weight was lifted before or after the reference weight. Our finding that the TOE varied significantly with duration suggests that some other mechanism, or mechanisms, may be involved that affects the TOE at different durations within this range. One possibility is that this effect is related to differences in memory encoding or retrieval; however, further investigation would be required to confirm this hypothesis.
We did not find a significant difference in the precision of duration comparisons, as measured by WF, between 100 ms and 1600 ms, or any difference between positive and negative images. We did find an increase in WF at 50 ms; however, this is consistent with the generalized mathematical model of a WF with a constant error, related to the absolute threshold of discrimination (Gescheider, 2013). In temporal processing, this fixed constant may be the effect of a fixed switch latency in a pacemaker–switch–accumulator model (Wearden & Lejeune, 2008). Switch latency can be viewed as a small constant error in the number of accumulated pulses, caused by a delay in the switch opening. The switch latency error, therefore, has a greater proportional effect at very short intervals than at longer intervals. If, for example, the fixed switch latency was 10 ms, this would contribute an error of 20% at 50 ms, but only 5% at 200 ms.
Our findings in relation to PSE shift were consistent with studies at durations greater than 1000 ms that have found an increase in the perception of duration of emotional stimuli, independent of emotional valence (Droit-Volet et al., 2004; Droit-Volet & Meck, 2007; Tipples et al., 2015). However, our findings were inconsistent with Smith et al. (2011).
Smith et al. (2011), found that the durations of highly arousing, negative images were overestimated at 1000 ms but underestimated at 200 ms. It is notable that the Weber fractions (WFs) in the Smith et al. (2011) study were relatively high (mean short .30, mean long .36) compared to those in other studies using similar visual stimuli and durations—for example, Grondin (1993; ±.10) and our study (M = .17). WFs represent the resolution within a system and can increase substantially with external noise (Gescheider, 2013). It is therefore possible that the experimental method used by Smith et al. produced noisy data, leading to an anomalous result. One contribution to this anomaly may have been their randomized presentation of short and long durations within blocks. This appears to have resulted in all short-condition bisection points being consistently reported as shorter than the standard value and all long-condition bisection points being consistently reported as longer than the standard value. It is also unusual that the effect they found in the short block condition was not consistent across the durations within the block.
Another inconsistency between our study and Smith et al. (2011), and also Grondin (2010b), was their finding of a larger WF at 1000 ms than at 200 ms. Their finding does not fit with the generalized form of Weber’s law, which suggests that WFs should be larger at the lower end of a sensory range. Both of these studies used a learned duration method (note however that the Grondin, 2010b, study used an auditory not a visual stimulus). It is unclear if or why the learned duration method gives different results to the 2AFC method used in this experiment. One hypothesis is that the learned duration method uses more long-term memory resources due to the participant having to learn the reference duration/s earlier and then compare test durations back to them. It is possible that these relatively longer term memory resources are differentially affected by duration or arousal, unlike the shorter-term memory processes involved in a 2AFC comparison.
In this study, we found that emotional stimuli cause an increase in the perception of duration below 1000 ms and that the increase was independent of emotional valence. This suggests that the effect is more likely to be related to arousal than to attention. Our findings were consistent with the dominant models of temporal processing (SET and AGT) and also studies at durations greater than 1000 ms. We also found that WFs within the range tested followed the generalized form of Weber’s law. We used a 2AFC method, and the inconsistencies between our result and those of two previous studies (Grondin, 2010b; Smith et al., 2011) suggest that their use of the learned duration method may have influenced their results.
Footnotes
Disclosure statement
No potential conflict of interest was reported by the authors.
Funding
This research was supported by an Australian Research Council (ARC) Discovery Early Career Researcher Award [grant number DE140101734] awarded to S.C.G. and an ARC Discovery [grant number DP110104553] awarded to M.E.