
Abstract
This study investigated whether the visual and auditory Simon effects could be accounted for by the same mechanism. In a single experiment, we performed a detailed comparison of the visual and the auditory Simon effects arising in behavioural responses and in pupil dilation, a psychophysiological measure considered as a marker of the cognitive effort induced by conflict processing. To address our question, we performed sequential and distributional analyses on both reaction times and pupil dilation. Results confirmed that the mechanisms underlying the visual and auditory Simon effects are functionally equivalent in terms of the interaction between unconditional and conditional response processes. The two modalities, however, differ with respect to the strength of their activation and inhibition. Importantly, pupillary data mirrored the pattern observed in behavioural data for both tasks, adding physiological evidence to the current literature on the processing of visual and auditory information in a conflict task.
Keywords
Introduction
In daily life, our responses are guided by sensory stimuli presented in multiple modalities, and a crucial question within the field of cognitive neuroscience is how individuals process and respond to stimuli in the presence of irrelevant, and possibly conflicting, information to meet task goals, and how they continuously adjust performance to changing environmental demands. These abilities, known as cognitive control, have been studied by means of different tasks, such as the Eriksen flanker task (Eriksen & Eriksen, 1974), the Stroop colour-naming task (Stroop, 1935) and the Simon task (Simon & Rudell, 1967), with the latter being extensively employed to explore the conflict encountered when different stimulus dimensions compete to activate a response (for reviews, Proctor & Vu, 2006; Rubichi, Vu, Nicoletti, & Proctor, 2006). In this task, participants are required to respond to a non-spatial stimulus dimension (e.g., colour) by pressing a spatially defined key (e.g., left or right). Even though stimulus location is task-irrelevant, responses are faster and more accurate when stimulus and response positions correspond (corresponding trials), compared to when they do not correspond (non-corresponding trials).
A large amount of evidence supports the notion that the Simon effect (i.e., the difference in terms of speed and accuracy between non-corresponding and corresponding trials) originates at the response-selection stage and results from the interaction between two parallel and independent processing routes connecting perception to action, that is, an unconditional/direct route and a conditional/indirect route (e.g., De Jong, Liang, & Lauber, 1994; Kornblum, Hasbroucq, & Osman, 1990). In the unconditional route, the response is thought to be automatically activated by stimulus position through pre-existing stimulus–response (S–R) associations, which are independent from the instructions. Differently, in the conditional route, the required response is activated based on task-defined associations that connect a stimulus to a specific response. In corresponding trials, the two activated responses correspond and no conflict arises (Umiltà, Rubichi, & Nicoletti, 1999). The opposite holds for non-corresponding trials, when a conflict occurs because the two activated responses differ. In these trials, the incorrect response needs to be aborted thus causing a slowing of response time and an increased number of errors.
The classic Simon effect has been replicated across different paradigm variations. In fact, it has been shown to emerge with visual (e.g., Wühr & Ansorge, 2005), auditory (e.g., Buetti & Kerzel, 2008; Simon & Small, 1969; Vu, Proctor, & Urcuioli, 2003) and tactile (e.g., Salzer, Aisenberg, Oron-Gilad, & Henik, 2013) stimuli and with motor (using both upper and lower limbs; Leuthold & Schröter, 2006), vocal (Wühr, 2006) and oculo-motor (e.g., Khalid & Ansorge, 2013; Lugli, Baroni, Nicoletti, & Umiltà, 2016) responses. As regards to the comparison between the visual and auditory modalities, the observation that the auditory Simon effect is larger in magnitude with respect to the visual one (see, e.g., Pick & Proctor, 1999; Proctor & Pick, 1998) has been taken as an indication that the activation of spatially corresponding responses is stronger with auditory stimuli than with visual ones (e.g., Vu et al., 2003). However, it should be noted that the auditory Simon effect has been studied less than the visual Simon effect, and the literature has not reached so far a general agreement on the mechanisms underlying the auditory Simon effect. Consequently, the debate on whether the two effects are generated by different mechanisms or simply differ in the strength of response activation is still open.
In this study, we performed a detailed comparison of the visual and the auditory Simon effects by recording behavioural measures (reaction times [RTs], and error rate [ER]) and pupil dilation (PD), with the aim of investigating the mechanisms underlying both effects. We specifically focused on those mechanisms responsible for shaping the RT distribution and for the sequential modulations evident in the visual and the auditory versions of the task.
As regards the RT distribution, in the current literature, different explanations have been proposed. It is important to note that researches investigating the Simon effect typically focus on the comparison between corresponding and non-corresponding trials at the level of mean of RT. However, this analysis may mask relevant findings that can only be discovered when analysing the RT distribution of interference effects (cf. De Jong et al., 1994; Ridderinkhof, 2002; for reviews, see Dittrich, Kellen, & Stahl, 2014; Proctor, Miles, & Baroni, 2011). Indeed, this technique has revealed that the Simon effect can show two different time courses: a decreasing (i.e., the magnitude of the Simon effect decreases as RT increases) and an increasing or constant (i.e., the magnitude of the Simon effect increases or remained unchanged as RT increases) time course. The former is found when the unconditional response activation occurs soon after the stimulus onset and then dissipates over time (see, e.g., Proctor et al., 2011), while the latter is observed when the irrelevant response needs more time to reach complete activation and thus to exert the maximum influence on performance (e.g., Wascher, Schatz, Kuder, & Verleger, 2001; Wühr, 2006).
To explain these different effect functions, Wascher et al. (2001) proposed that the Simon effect can be generated by two different and dissociable mechanisms: a visuomotor facilitation of same-side responses and a cognitive interference of codes. The decreasing effect function, yielded by the visuomotor process, would be generated by a ‘natural’ spatial–anatomical mapping, that is, when the stimuli are visual and presented in the horizontal axis (Wascher et al., 2001, Experiment 1). On the contrary, the stable or increasing effect function, yielded by the cognitive process, would be due to the lack of a ‘natural’ relation between a visual stimulus and anatomical effect, as, for example, when the stimuli are presented in an auditory modality (Wascher et al., 2001, Experiment 2). Based on their results, Wascher et al. (2001) concluded that the visual Simon effects appeared to be due to specific mechanisms of visuomotor information transmission, thus it is associated with the automatic activation of the corresponding response through the unconditional route; while the auditory Simon effect is attributed to cognitive interference arising within the conditional route only, in which the relevant stimulus feature is translated into a response. Conversely, Leuthold and Schröter (2006) proposed that the increasing Simon effect found with the auditory stimuli would result from the interaction between the two processing routes, as occurs for the visual Simon effect. Recently, Xiong and Proctor (2016) examined the auditory Simon effect as a function of tone frequency and duration. They found a decreasing Simon effect only when auditory stimuli were low-frequency tones (200 and 500 Hz) with a short duration, suggesting that the automatic activation account proposed by Wascher et al. (2001) also applies to auditory stimuli.
For what concerns correspondence sequence, to our knowledge, a direct comparison between correspondence sequence effects in the visual and auditory Simon effects has not been performed so far. We believe it might provide insights on the mechanisms responsible for the two conditions. Specifically, it has been widely shown that the magnitude of the Simon effect depends on correspondence sequence: the effect is larger following a corresponding trial while it disappears or even reverses following a non-corresponding trial (e.g., Iani, Rubichi, Gherri, & Nicoletti, 2009; Iani, Stella, & Rubichi, 2014; Soetens, Maetens, & Zeischka, 2010; Stürmer, Leuthold, Soetens, Schröter, & Sommer, 2002). According to some authors, whenever a conflict is detected, as occurs in non-corresponding trials, the mechanism selectively suppresses the unconditional route to avoid conflicts in subsequent trials (e.g., Iani et al., 2009; Stürmer et al., 2002). This reduces the costs of subsequent non-corresponding trials and the benefits of subsequent corresponding trials; hence the Simon effect is reduced or eliminated. However, since after corresponding trials no conflict is detected, nothing is preventing the activation of the irrelevant location-based response code. This enhances the costs of subsequent non-corresponding trials and the benefits of subsequent corresponding trials. It should be noted, however, that some authors have proposed alternative explanations of correspondence sequence considering them as reflecting S–R priming (Egner, 2007; Mayr, Awh, & Laurey, 2003) or binding effects (e.g., Hommel, Proctor, & Vu, 2004; Notebaert, Gevers, Verbruggen, & Liefooghe, 2006; Notebaert, Soetens, & Melis, 2001; Spapé, Band, & Hommel, 2011) rather than conflict-driven adaptations in cognitive control. In the typical Simon task, correspondence sequence is confounded when stimulus and response repetitions occur in consecutive trials. Specifically, whereas sequences of two corresponding trials and sequences of two non-corresponding trials are either complete repetitions of stimulus position and response or complete changes in both stimulus position and response, mixed sequences are always partial repetitions in which either stimulus position or response repeats. Since responses to both complete repetitions and complete alternations are always faster than those to partial repetitions (Hommel, 2004; Pashler & Baylis, 1991), the advantage of correspondence-level repetition may be accounted for by the repetition of specific stimulus and response features and, consequently, may be due to the absence of unbinding costs (i.e., featuring integration account; Hommel, 2004). For this reason, in this study, we used the same version of the Simon task that was previously shown to produce strong conflict-driven adaptations even when stimulus and response repetitions were controlled for (Iani et al., 2009; van Steenbergen & Band, 2013).
It is worth mentioning that RT distributions are affected by correspondence sequence. Ridderinkhof (2002), indeed, used RT distributional analyses to further investigate the dynamics of the activation–suppression processes in the visual Simon task. The author claimed that the active suppression process would be engaged to control the automatic activation of the unconditional route. More precisely, a decreasing time course of the Simon effect would be due to a relatively strong selective suppression (i.e., Simon effect following non-corresponding trials), while a constant or increasing function could be attributed to a weaker inhibition process (i.e., Simon effect following corresponding trials). The pattern of sequential modulations found in the auditory task (see Leuthold & Schröter, 2006) can also be explained by the suppression account proposed by Stürmer et al. (2002) who postulated that the unconditional route is suppressed following non-corresponding stimuli, and the S–R processing is mainly mediated by the conditional route (resulting in the complete absence of interference across the entire RT distribution).
Furthermore, it is noteworthy that we decided to measure PD because the current literature provides consistent evidence that the task-evoked pupillary response indexes cognitive effort, increasing its dilation as a function of task demands (i.e., the more difficult the task, the larger the PD; e.g., Beatty & Kahneman, 1966; Kahneman & Beatty, 1967; Loewenfeld, 1993; for a review, see Beatty, 1982; Beatty & Lucero-Wagoner, 2000; Laeng, Sirois, & Gredebäck, 2012). In addition, in recent studies on interference between stimuli and responses, a conflict-related PD has been observed in the Stroop (see Laeng, Ørbo, Holmlund, & Miozzo, 2011), in the Eriksen flanker (van Bochove, van der Haegen, Notebaert, & Verguts, 2013; Wendt, Kiesel, Geringswald, Purmann, & Fischer, 2014) and in the Simon tasks (D’Ascenzo, Iani, Guidotti, Laeng, & Rubichi, 2016; van Steenbergen & Band, 2013). In particular, van Steenbergen and Band (2013) used a visual Simon task to investigate whether the PD could be considered as an indirect marker either of conflict- or control-related processes. The authors analysed sequential effects emerging in RTs and PD and found that PD increased when the conflict was higher, that is, for non-corresponding trials with respect to corresponding ones. Consistent with the conflict monitoring theory (Botvinick, Braver, Barch, Carter, & Cohen, 2001), they observed sequential effects on both RTs and PDs. Hence, their results indicate that increased PD could be interpreted as a sensitive marker of conflict-related processing. It has to be pointed out though that the authors used a visual Simon paradigm, while it has still to be investigated whether the same processes are involved with a different sensory modality. To our knowledge, in fact, neither the auditory Simon effect by means of PD has been examined so far nor consequently a comparison between visual and auditory PD Simon effect has been provided.
To this aim, in this study, we implemented an experiment in which a group of participants performed a Simon task with visual stimuli, while another group performed a Simon task with auditory stimuli. RTs, ER and PD in the two conditions were analysed as a function of correspondence sequence. Furthermore, for RTs we analysed the time course of sequential modulations (for a review, see Dittrich et al., 2014), and subsequently, we investigated how the PD changed depending on the RTs’ distribution.
As regards RTs, since it has been shown that the auditory modality is more automatically alerting than the visual modality (e.g., Posner, Nissen, & Klein, 1976), we expected to find overall faster responses in the auditory condition compared to the visual one. For the same reason, we also hypothesized that auditory stimuli would produce a stronger activation of the corresponding response through the unconditional route, resulting in a larger Simon effect for auditory than for visual stimuli (Pick & Proctor, 1999; Proctor & Pick, 1998; Simon, 1990; Vu et al., 2003). As regards PDs, in line with the hypotheses on RTs, we expected to find an overall reduced PD amplitude for the auditory condition compared to the visual one, indicating that auditory stimuli require less effort to be processed. In addition, we expected to find, for both visual and auditory stimuli, an increased PD in non-corresponding trials as compared to corresponding ones, replicating the previous studies on the visual condition (see Laeng et al., 2011; van Steenbergen & Band, 2013) and, interestingly, adding new evidence on the auditory condition. For what concerns the Simon effect, as hypothesized for RTs, we expected a modality-specific effect on PD amplitude. Specifically, due to the stronger activation produced by corresponding auditory stimuli compared to the visual ones, we expected smaller PD with the former compared to the latter stimuli, resulting in a larger Simon effect for auditory than for visual stimuli.
As regards the mechanism responsible for shaping the RT distributions, according to the above-mentioned literature, we expected to find a decreasing Simon effect as a function of RTs for the visual condition, resulting from the visuomotor process (see Wascher et al., 2001, Experiment 1), and an increasing Simon effect as a function of RTs for the auditory condition, resulting from the cognitive process (see Wascher et al., 2001, Experiment 2). 1 For what concerns the time course of sequential modulations (e.g., Ridderinkhof, 2002; Stürmer et al., 2002), we hypothesized that for the visual Simon condition, in line with Ridderinkhof (2002), a stable or increasing time course would emerge following a corresponding trial, while a decreasing time course would emerge following a non-corresponding trial; for the auditory Simon condition, in line with Stürmer et al. (2002), an increasing time course would emerge following a corresponding trial, while a stable time course would emerge following a non-corresponding trial. In addition, we analysed PD depending on RT distributions for each condition. Considering that a larger PD is an index of greater effort, we expected to find, for both conditions, larger PDs in those bins for which a larger Simon effect for RTs was evident.
As regards the mechanism responsible for producing sequential modulations, we expected the magnitude of the Simon effect in RTs to be larger after a corresponding trial and smaller, absent or reversed after a non-corresponding trial. We hypothesized that if the mechanisms underlying the visual and auditory Simon effects are comparable, the sequential modulation pattern should hold for both visual (e.g., Stürmer et al., 2002) and auditory stimuli (e.g., Leuthold & Schröter, 2006). As regards PD, we hypothesized that if the effects evident in the two modalities are due to the interplay between unconditional and conditional processing, then a modulation of PD by correspondence sequence should be evident in both conditions, with a larger Simon effect in PDs following corresponding trials and a smaller effect following non-corresponding ones.
Methods
Participants
Sixty-nine undergraduates from the University of Bologna participated as volunteers to the experiment (41 female, two left-handed, M age: 20 years, SD age: 1.9 years). All of them reported normal or corrected-to-normal vision and normal hearing. In all, 32 participants took part in the visual condition and 37 in the auditory condition. A different number of participants were run in the two conditions because we wanted to have a sample size of 30 2 participants for each condition, after the application of the exclusion criteria; see section ‘Statistical analyses’ below. The local ethics committee approved the study and written informed consent was obtained from all the participants before participation.
Apparatus and stimuli
Participants sat in front of an LCD monitor (1024 × 768) at a viewing distance of 70 cm in a dimly lit room. Stimulus presentation and response collection were controlled by the E-Prime® software system.
The stimuli for the visual condition were black capital letters ‘M’ and ‘W’ that were presented 1.07° to the left or right of a central fixation cross on a dark grey background (average luminosity of each stimulus including the background was 127 units in the RGB system). The stimuli for the auditory condition were ‘high’ (1050 Hz) or ‘low’ (650 Hz) tones with the loudness approximately of 60 dB, presented through loudspeakers placed 15 cm to the left side and to the right side of the computer monitor. For both conditions, responses were made by pressing the ‘z’ or the ‘m’ keys on the QWERTY keyboard with the left or the right index finger, respectively. The keyboard was located centrally with respect to the body midline.
Procedure
For the visual (see van Steenbergen & Band, 2013) and the auditory Simon conditions, participants were instructed to respond as quickly and as accurately as possible to the type of letter and to the tone pitch, respectively, while ignoring their location. In the visual condition, half of the participants responded to the ‘M’ letter with the left hand and to the ‘W’ letter with the right hand, while the other half experienced the opposite mapping. In the auditory condition, half of the participants responded to the ‘low’ tone with the left hand and to the ‘high’ tone with the right hand, while the other half experienced the inverse mapping.
Both conditions consisted of 384 trials that were divided into six blocks of 64 trials each, preceded by 8 practice trials. In each block, the trial sequence was controlled so that each trial could be preceded with an equal probability by a corresponding (C) or a non-corresponding (NC) trial. Hence, four different trial sequences were created (C–C, C–NC, NC–C and NC–NC, with italics denoting current trial correspondence).
Each trial started with a white fixation cross that after 900 ms turned yellow for 200 ms (warning cue) and then returned white for the remaining duration of the trial. The stimulus appeared for 100 ms together with the white fixation cross, which remained visible on the screen for the following 900 ms. Responses up to 1000 ms after stimulus presentation were recorded. A trial lasted 2100 ms.
Pupillometry
Participant’s right eye pupil diameter was measured using the iView X Remote Eye Tracking Device (RED; SensoMotoric Instruments [SMI], Teltow, Germany). Data were recorded at a sampling rate of 60 Hz using the iView X software (SMI).
The illumination of the testing room was kept constant during the whole session. A standard five-point eye tracker calibration routine was used at the beginning of the experiment. Participants were instructed to keep their head as steady as possible.
A single measure (in mm) of pupil diameter was obtained for each sample. Pupil data were pre-processed using a custom-made Python script to remove artefacts in the time series related to eye blinks: data points with physiologically unlikely pupil sizes (smaller than 2 mm or larger than 8 mm) together with the neighbouring data points (the preceding and following 80 ms) were removed. Also, samples having more than 2.5 SDs from the mean pupil size within a trial were removed from the time series. Trials with less than 50% of the data remaining after removal of outliers were not included for further analysis. Resulting gaps in the data were replaced by linear interpolation, and the resulting time series were smoothed using a cubic spline. Baseline pupil diameter was calculated as the average pupil size during the 200 ms (warning cue) preceding each stimulus onset and was subtracted from the time series of the entire subsequent trial (0-1900 ms). If the warning cue was discarded, the baseline was calculated using first 200 ms after stimulus onset.
We calculated the average of the trial’s time duration as a function of the onset of the stimulus for each condition, without considering trials excluded from behavioural analysis. Baseline-corrected pupil diameter change in response to the stimulus is plotted in Figure 1, for the visual (a) and the auditory Simon condition (b).
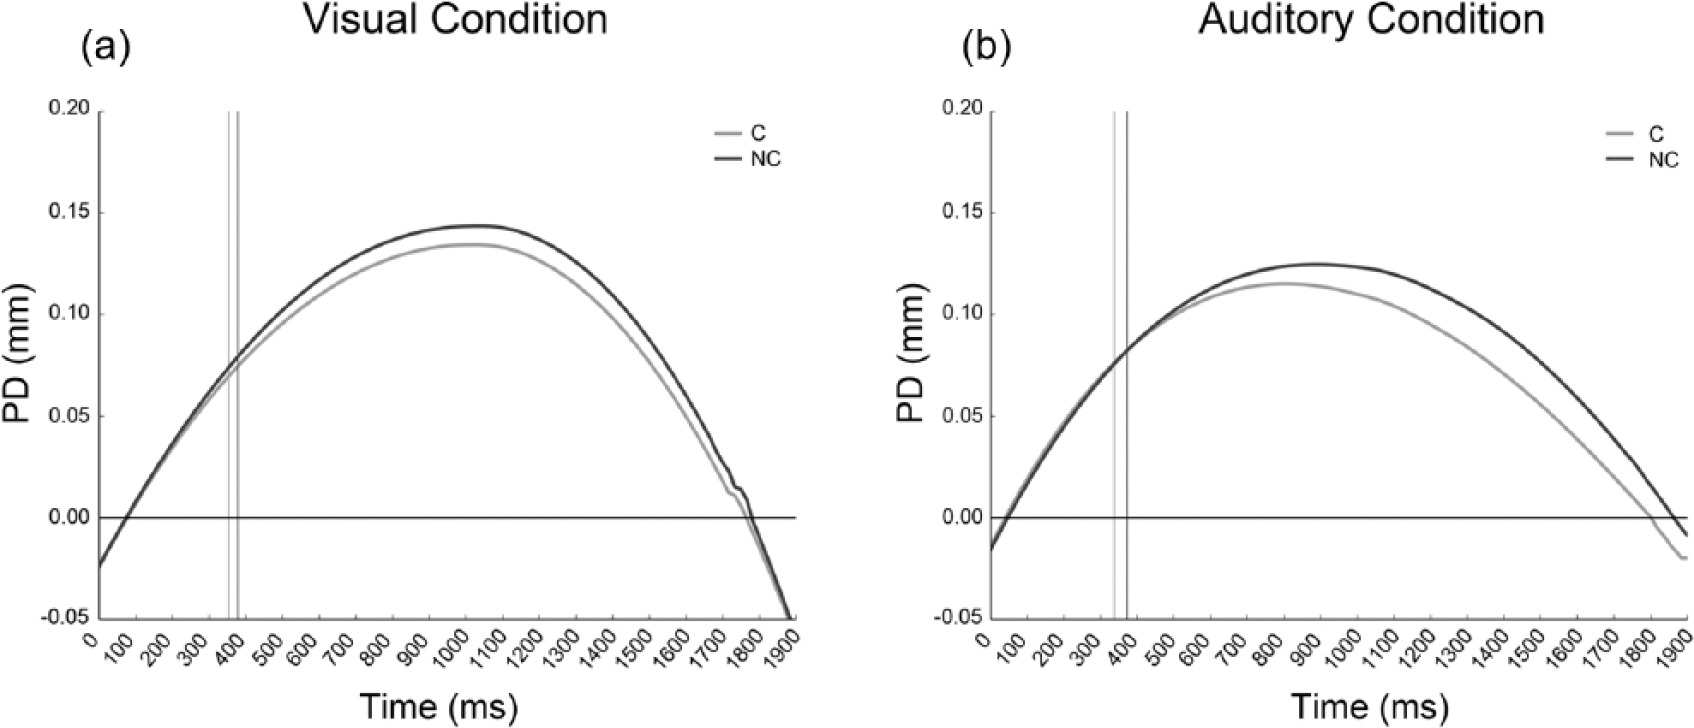
Baseline-corrected mean pupil dilation (PD) in the (a) visual and (b) auditory Simon conditions. Time 0 represents the onset of each stimulus. The vertical lines represent the point in time of each condition’s mean reaction time.
Statistical analyses
Correct RTs, arcsine-transformed ERs and mean PDs in the entire epoch (0-1900 ms) for both conditions were submitted to a repeated-measures analysis of variance (ANOVA) with current trial correspondence (corresponding vs. non-corresponding) and previous trial correspondence (corresponding vs. non-corresponding) as within-participant factors and condition (visual vs. auditory) as between-participant factor. 3 When necessary, comparisons were performed using paired samples t-tests and by correcting the p-value for the number of comparisons (Bonferroni correction).
To compute the time course of the sequential modulations in RTs, we applied the Vincentizing procedure (Ratcliff, 1979). For both the visual and the auditory conditions, individual RTs were rank ordered as a function of current and previous trial correspondence and divided into quintiles (bins). For each bin, we calculated the size of the Simon effect by subtracting the mean RT for the corresponding condition from the mean RT for the non-corresponding condition. The resulting values were submitted to a repeated-measures ANOVA with bin (from 1 to 5) and previous trial correspondence as within-participant factors and condition as between-participant factor. It should be noted that considering the way data were grouped, the main effect of bin necessarily turned out to be significant in all the analyses; therefore, it will not be discussed here or later on.
In addition, for both the visual and the auditory conditions, considering the quintiles (bins) obtained by ranking RTs, we computed mean PD (baseline-corrected) in the entire epoch (0-1900 ms) as a function of each RT bin for both current and previous trial correspondence. The resulting values were submitted to the same analysis reported above.
For the visual Simon condition, two participants were excluded from the analyses: one because of the ER being higher than 20% of the total trials, and the other because 50% of his or her total trials were discarded due to technical problems with the eye tracker recording. As a result, 30 of 32 participants were included in the behavioural and pupillary analyses. For the auditory Simon condition, seven participants were excluded from the analyses because of their high ER (more than 20% of the total trials). As a result, 30 of 37 participants were included in the behavioural and pupillary analyses.
For both the visual and auditory Simon conditions, incorrect responses (7.2% and 6.4% of the trials for visual and auditory Simon conditions, respectively) and latencies that were 2 SDs above (3.7% and 10.6% of the trials, for visual and auditory Simon conditions, respectively) or below (0.6% of the trials for both visual and auditory Simon conditions, respectively) each participant’s mean were excluded from the analyses.
The exclusion criteria were decided a priori based on previous studies using the same task. For what concerns behavioural data see, for example, Iani, Milanese, and Rubichi (2014). For what concerns pupillary data see, for example, Laeng et al. (2011, 2012) and Alnæs et al. (2014).
Results
RTs
The analysis showed a significant main effect of current trial correspondence, F(1, 58) = 106.00, MSE = 49,815, p < 0.001, ηp2 = 0.65, with faster responses in corresponding (M = 349, SD = 64) than in non-corresponding (M = 378, SD = 68) trials. The main effects of previous trial correspondence, F(1, 58) = 1.09, MSE = 127.29, and condition, F(1, 58) = 1.02, MSE = 16011.07, did not reach significance.
The interaction between current trial correspondence and condition was significant, F(1, 58) = 5.79, MSE = 2721, p < 0.05, ηp2 = 0.09. T-tests showed that the difference between corresponding (M = 360, SD = 61; M = 338, SD = 64; for visual and auditory conditions, respectively) and non-corresponding trials (M = 382, SD = 54; M = 373, SD = 80; for visual and auditory conditions, respectively; i.e., the Simon effect) was of 22 ms in the visual modality, t(29) = 6.368, pBonferroni-corrected < 0.001, and 35 ms in the auditory modality, t(29) = 8.090, pBonferroni-corrected < 0.001. T-tests showed that the difference between the two effect sizes was significant, t(58) = −2.407, p < 0.05, d = −0.63.
The interaction between previous trial correspondence and condition was also significant, F(1, 58) = 15.67, MSE = 1836, p < 0.001, ηp2 = 0.21. T-tests showed that only in the visual condition responses were faster when the preceding trial was corresponding (M = 368, SD = 54) than when it was non-corresponding (M = 375, SD = 53), t(29) = −4.712, pBonferroni-corrected < 0.001. Importantly, the interaction between current and previous trial correspondence was significant, F(1, 58) = 237, MSE = 50,726, p < 0.001, ηp2 = 0.80. T-tests showed a significant Simon effect of 58 ms following a corresponding trial, t(59) = 15.669, pBonferroni-corrected < 0.001, and a null effect following a non-corresponding trial, t(59) = −0.072, p = 0.94. Crucially, this two-way interaction was modulated by condition, F(1, 58) = 25.53, MSE = 5466, p < 0.001, ηp2 = 0.30 (see Figure 2(a), visual and auditory conditions in the leftmost and rightmost panels, respectively). T-tests showed that the visual Simon effect was of 61 ms when the preceding trial was corresponding, t(29) = 14.888, pBonferroni-corrected < 0.001, and reversed to −16 ms when the preceding trial was non-corresponding, t(29) = −3.345, pBonferroni-corrected = 0.008, while the auditory Simon effect was of 55 ms when the preceding trial was corresponding (t(29) = 8.892, pBonferroni-corrected < 0.001) and decreased to 16 ms when the preceding trial was non-corresponding, t(29) = 4.674, pBonferroni-corrected < 0.001. T-tests showed that the Simon effect evident after a non-corresponding trial was significantly smaller in the visual (M = −16, SD = 27.09) than in the auditory (M = 16, SD = 18.77), t(58) = −5.411, pBonferroni-corrected < 0.001, d = −1.42, condition. No difference between conditions was evident after a corresponding trial (visual: M = 61, SD = 22.33; auditory: M = 55, SD = 33.92), t(58) = 0.758, p = 0.45, d = 0.20.
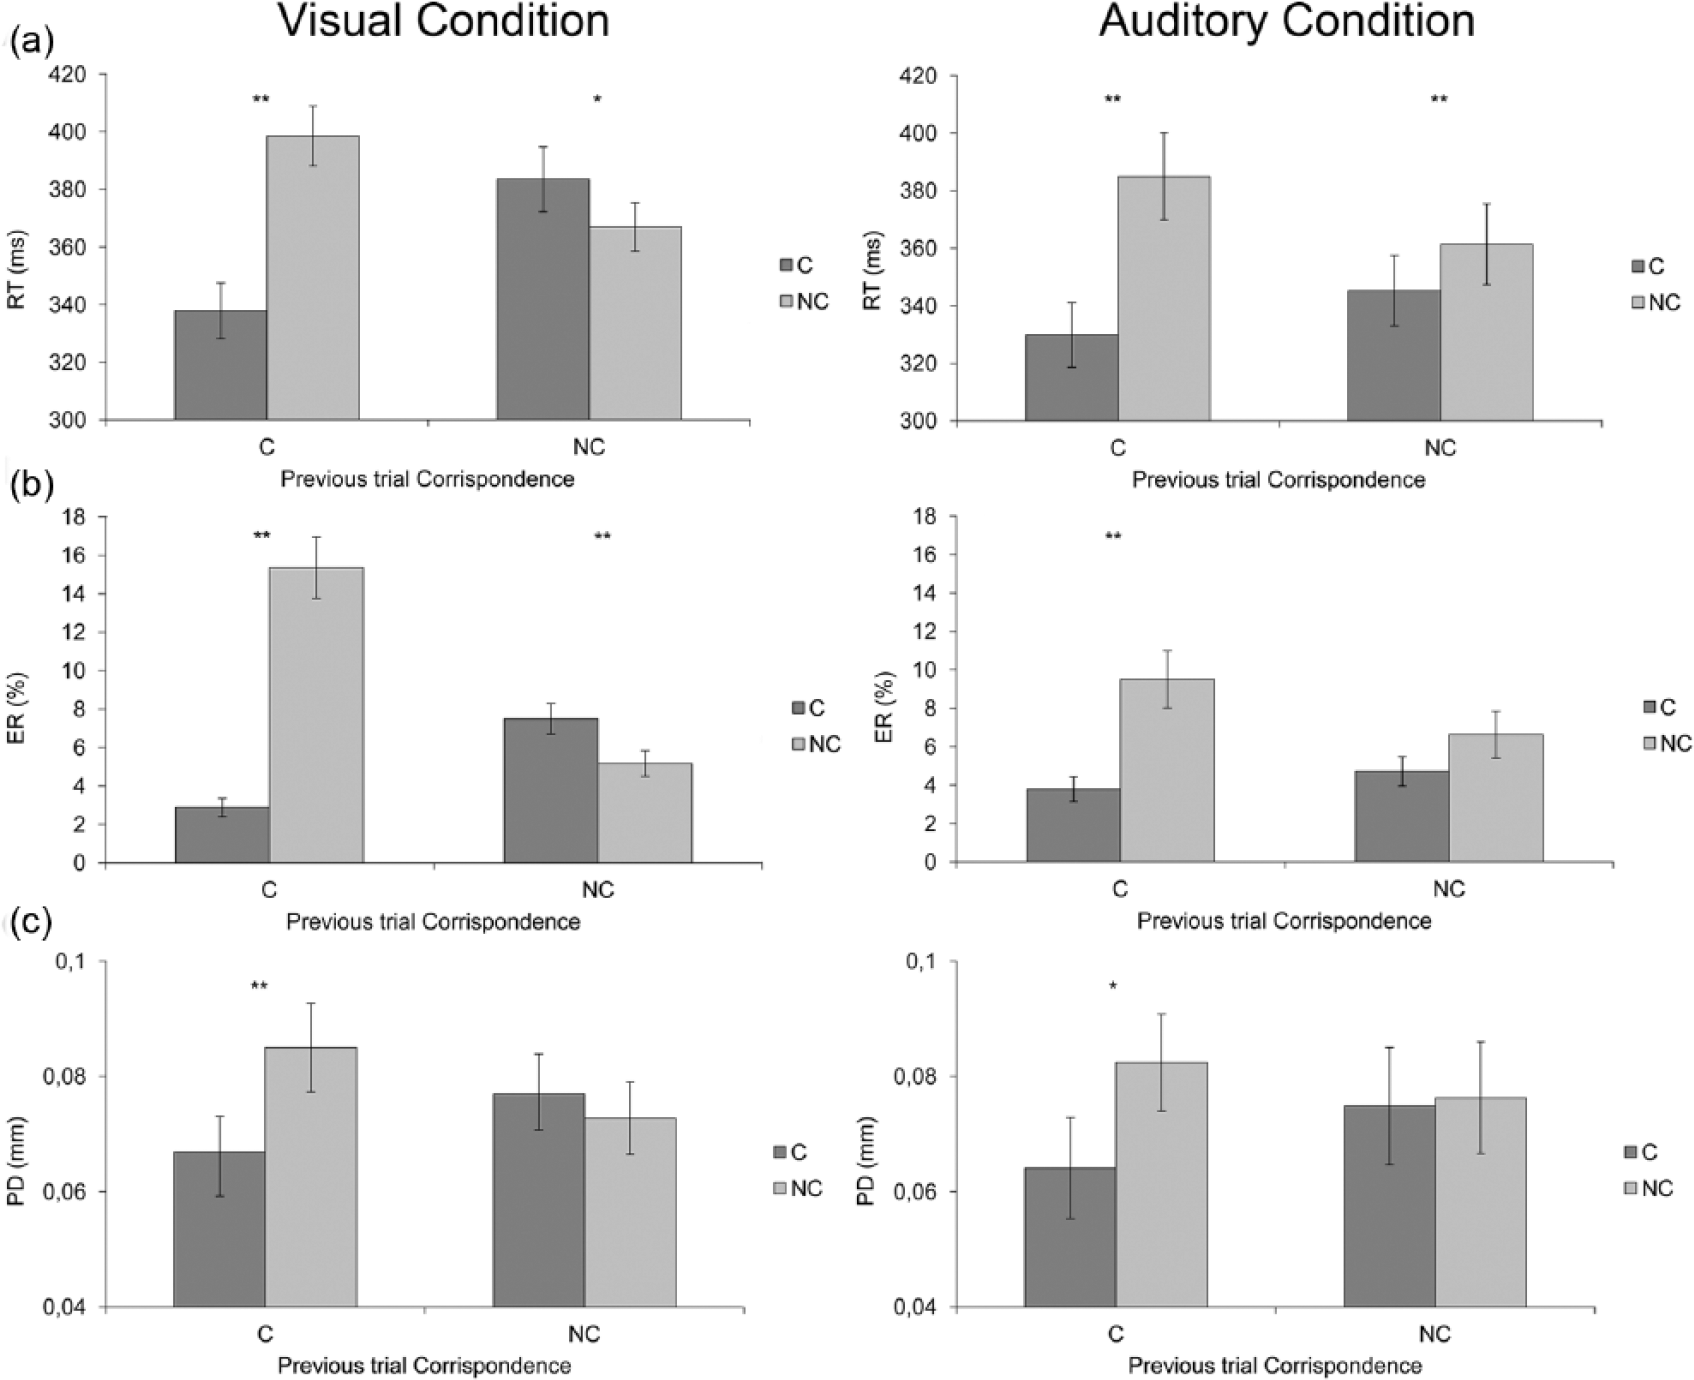
(a) Mean reaction time (RT), (b) mean error rate (ER) and (c) mean pupil dilation (PD) for current trial correspondence as a function of previous trial correspondence in the visual and auditory Simon conditions (leftmost and rightmost panels, respectively). Error bars indicate standard errors of the mean.
ERs
The analysis showed significant main effects of current trial correspondence, F(1,58) = 67.28, MSE = 0.49, p < 0.001, ηp2 = 0.53, and previous trial correspondence, F(1, 58) = 9.81, MSE = 0.035, p < 0.005, ηp2 = 0.14, with higher ERs in non-corresponding (M = 9.17%, SD = 8.01%) than in corresponding trials (M = 4.72%, SD = 4.08%), and after corresponding (M = 7.88%, SD = 8.04%) than after non-corresponding (M = 6.01%, SD = 4.92%) trials. The interaction between current and previous trial correspondence was significant, F(1, 58) = 103, MSE = 0.50, p < 0.001, ηp2 = 0.64. T-tests showed that the Simon effect was significant after a corresponding trial, 9.10%, t(59) = 10.075, pBonferroni-corrected < 0.001, but did not reach significance after a non-corresponding trial, −0.21%, t(59) = −0.049, p = 0.96. Importantly, the three-way interaction between current and previous trial correspondence and condition was significant, F(1, 58) = 39.35, MSE = 0.19, p < 0.001, ηp2 = 0.40 (see Figure 2(b), visual and auditory conditions in the leftmost and rightmost panels, respectively). T-tests showed that the visual Simon effect was positive when the preceding trial was corresponding, 12.5%, t(29) = 9.450, pBonferroni-corrected < 0.001, and negative when the preceding trial was non-corresponding, −2.3%, t(29) = −3.371, pBonferroni-corrected = 0.012. The auditory Simon effect was significant when the preceding trial was corresponding, 5.7%, t(29) = 6.125, pBonferroni-corrected < 0.001, and failed to reach significance when the preceding trial was non-corresponding, 1.9%, t(29) = 2.587, pBonferroni-corrected = 0.09. T-tests showed that the Simon effect was comparable in the two conditions (visual: M = 5.1%, SD = 4; auditory: M = 3.8%, SD = 57), t(58) = 0.679, p = 0.92, d = 0.18. However, considering sequential modulations, t-tests showed that after a corresponding trial, the Simon effect in the visual condition (M = 12.5%, SD = 8.57) was significantly larger than in the auditory condition (M = 5.7%, SD = 3.68), t(58) = 3.906, pBonferroni-corrected < 0.001, d = 1.03. After a non-corresponding trial, the Simon effect in the visual condition (M = −2.3%, SD = 6.32) was significantly smaller than in the auditory condition (M = 1.9%, SD = 4.87), t(58) = −4.044, pBonferroni-corrected < 0.001, d = −1.06. No other main effects or interactions reached significance (Fs < 1).
PD
The analysis on mean PD (baseline-corrected) during the entire epoch (0-1900 ms) revealed a significant effect of current trial correspondence, F(1, 58) = 9.51, MSE = 0.00, p ≤ 0.005, ηp2 = 0.14, with larger PDs in non-corresponding (M = 0.079 mm, SD = 0.04) than in corresponding (M = 0.070 mm, SD = 0.04) trials. Current trial correspondence did not interact with condition, F(1, 58) = 0.29, MSE = 0.00, indicating that the difference between corresponding (M = 0.072, SD = 0.03; M = 0.069; SD = 0.06; for visual and auditory conditions, respectively) and non-corresponding trials (M = 0.079, SD = 0.04; M = 0.079, SD = 0.06; for visual and auditory conditions, respectively) was comparable in the two conditions (visual: M = 0.007 mm, SD = 0.018; auditory: M = 0.010 mm, SD = 0.023).
Current and previous trial correspondence interacted, F(1,58) = 8.37, MSE = 0.01, p < 0.005, ηp2 = 0.13. T-tests showed that the Simon effect was significant following a corresponding trial, 0.018 mm, t(59) = 4.133, pBonferroni-corrected < 0.001, whereas it did not reach significance following a non-corresponding trial, −0.001 mm, t(59) = −0.329, p = 0.743. This pattern was evident for both conditions (see Figure 2(c), visual and auditory conditions in the leftmost and rightmost panels, respectively), as indicated by the lack of a significant three-way interaction involving the condition factor, F(1, 58) = 1.58, MSE = 0.00. No other main effects or interactions reached significance (Fs < 1).
RT distributions
This analysis revealed a significant interaction between current trial correspondence, bin and condition, F(4, 232) = 60.144, MSE = 13,164, p < 0.001, ηp2 = 0.50. T-tests revealed that the visual Simon effect was significant in the first four bins, ts(29) > −13.10, ps < 0.05, but did not reach significance in the last bin, t(29) = 0.91, p = 0.37. Differently, the auditory Simon effect was significant at all the bins, ts(29) > 5.59, ps < 0.001. Furthermore, Helmert contrasts showed that the size of the visual Simon effect decreased significantly from bin 1 to bin 5 (42, 35, 25, 10 and −5 ms, respectively), Fs(1, 29) > 52.70, MSEs > 20276.39, ps < 0.001, while the size of the auditory Simon effect increased significantly from bin 1 to bin 4 (18, 28, 36 and 47 ms, respectively), Fs(1,29) > 40.18, p < 0.001, and remained stable from bin 4 to bin 5 (47 and 50 ms, respectively), F(1, 29) = 0.76, p = 0.39 (see Figure 3(a), visual and auditory conditions in the leftmost and rightmost panels, respectively).
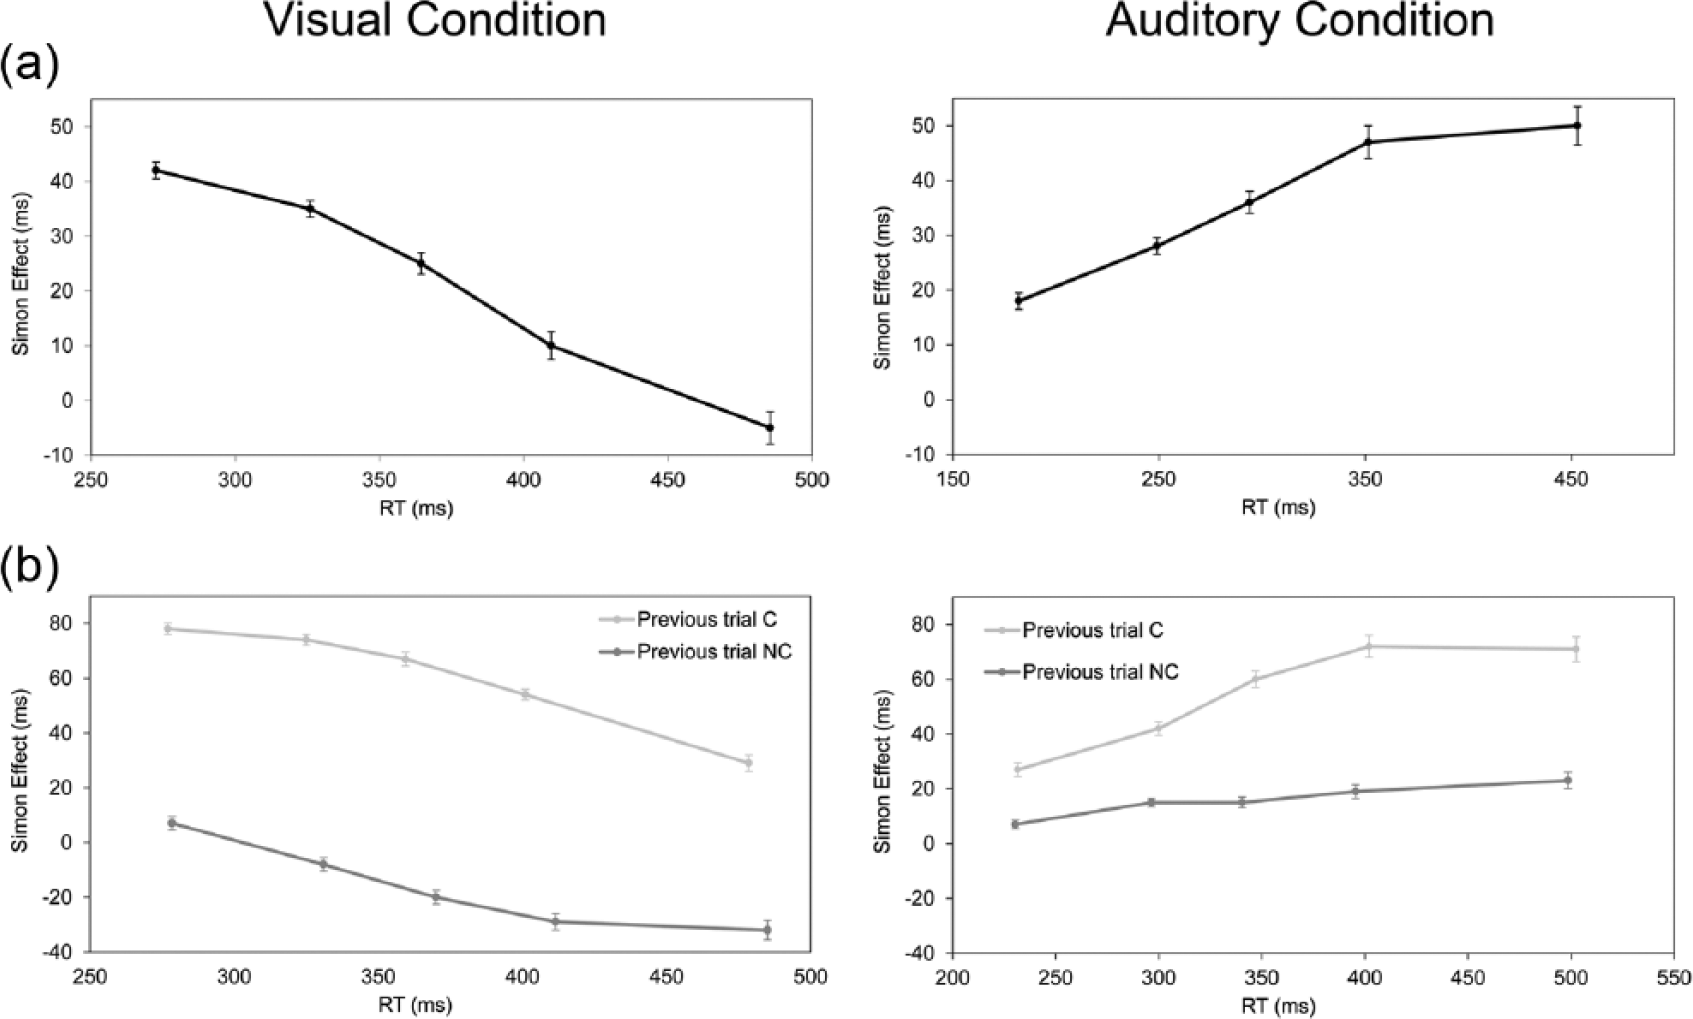
The Simon effect as a function of mean RT for each bin considering (a) current trial correspondence and (b) previous and current trial correspondence, for the visual and auditory Simon conditions (leftmost and rightmost panels, respectively). Error bars indicate standard errors of the mean.
Interestingly, the interaction between previous and current trial correspondence, bin and condition was significant, F(4, 232) = 10.428, MSE = 1091, p < 0.001, ηp2 = 0.15. For the visual Simon condition, t-tests revealed that after a corresponding trial, the effect was significant across bins, ts(29) > −20.04, ps < 0.001, whereas after a non-corresponding trial, the effect was significant at bins 3, 4 and 5, ts(29) > 3.68, ps < 0.001, and was not significant at bins 1 and 2, ts(29) < −1.37, ps > 0.180. Helmert contrasts showed that the size of the Simon effect evident after a corresponding trial decreased significantly from bin 1 to bin 5 (78, 74, 67, 55 and 28 ms, respectively), Fs(1, 29) > 61.17, ps < 0.001. Whereas the size of the Simon effect after a non-corresponding trial decreased significantly from bin 1 to bin 4 (7, −7, −20 and −29 ms, respectively), Fs(1, 29) > 33.39, MSEs = 26301.74, ps < 0.05, it did not differ significantly between bins 4 and 5 (−29 and −32 ms, respectively), F(1, 29) = 0.495, MSE = 310.02 (see Figure 3(b), leftmost panel for the visual condition).
For the auditory Simon condition, t-tests revealed that the Simon effect was significant at all bins irrespective of previous trial correspondence, respectively, ts(21) > 5.91, ps < 0.001; ts(21) > 2.28, ps < 0.05. Furthermore, Helmert contrasts showed that the size of the Simon effect evident after a corresponding trial increased significantly from bin 1 to bin 4 (27, 41, 59 and 71 ms, respectively), Fs(1, 29) > 62.59, MSEs > 34415.17, p < 0.001, but did not differ between bins 4 and 5 (71 and 71 ms, respectively), F(1, 29) = 0.00, MSE = 0.00). Conversely, the size of the Simon effect evident after a non-corresponding trial increased significantly from bin 1 to bin 2 (7 and 14 ms, respectively), F(1, 29) = 5.57, MSE = 3560.68, p < 0.05, but did not differ significantly in the other bins (14, 14, 19 and 22 ms, respectively), Fs(1, 29) < 2.58, MSEs < 1234.41 (see Figure 3(b), rightmost panel for the auditory condition).
PD depending on RTs’ distributions
The interaction between current trial correspondence, bin and condition failed to reach significance, F(4, 55) = 0.797, MSE = 0.001 (see Figure 4(a), leftmost panel for the visual condition and rightmost panel for the auditory condition). Interestingly, the interaction between previous and current trial correspondence, bin and condition was significant, F(4, 55) = 3.351, MSE = 0.007, p < 0.01, ηp2 = 0.22. For the visual Simon condition, t-test revealed that after a corresponding trial, the effect was significant at bins 2, 3 and 4, ts(29) > −3.008, ps < 0.05, and it was not significant at bins 1 and 5, ts(29) < −0.92, ps > 0.78, whereas after a non-corresponding trial, the effect was close to significance at bin 5, t(29) = 1.83, p = 0.078, and it was not significant from bin 1 to bin 4, ts(29) < −0.788, ps > 0.43. Helmert contrasts showed that the size of the Simon effect after a corresponding trial was stable across bins (−0.004, 0.022, 0.035, 0.022 and 0.010 mm from bin 1 to bin 5, respectively), Fs(1, 29) < 2.58, MSEs < 0.02. The size of the Simon effect after a non-corresponding trial was also stable across bins (0.008, −0.001, −0.008, −0.007 and −0.022 mm from bin 1 to bin 5, respectively), Fs(1, 29) < 1.78, MSEs < 0.01 (see Figure 4(b), leftmost panel for the visual condition). For the auditory Simon condition, t-tests revealed that after a corresponding trial, the effect was significant at bin 4, t(29) > −4.379, p < 0.001, and it was not significant at bins 1, 2, 3 and 5, ts(29) < −0.28, ps = 0.77, whereas after a non-corresponding trial, the effect was significant at bins 3 and 4, t(29) = 2.089, p < 0.05, and it was not significant at bins 1, 2 and 5, ts(29) < −0.576, ps = 0.56. Helmert contrasts showed that the size of the Simon effect evident after a corresponding trial was stable across bins (0.003, 0.015, 0.005, 0.050 and 0.009 mm, from bin 1 to bin 5, respectively), Fs(1, 29) < 3.36, MSEs < 0.05, whereas the size of the Simon effect after a non-corresponding trial decreased significantly only from bin 3 to bin 4 (0.028 and −0.023 mm, respectively), Fs(1, 29) = 8.32, MSEs = 0.04, p < 0.01, and it was stable at bins 1, 2 and 5 (0.006, −0.008 and 0.007 mm, respectively), Fs(1, 29) < 8.32, MSEs < 0.04 (see Figure 4(b), rightmost panel for the auditory condition).
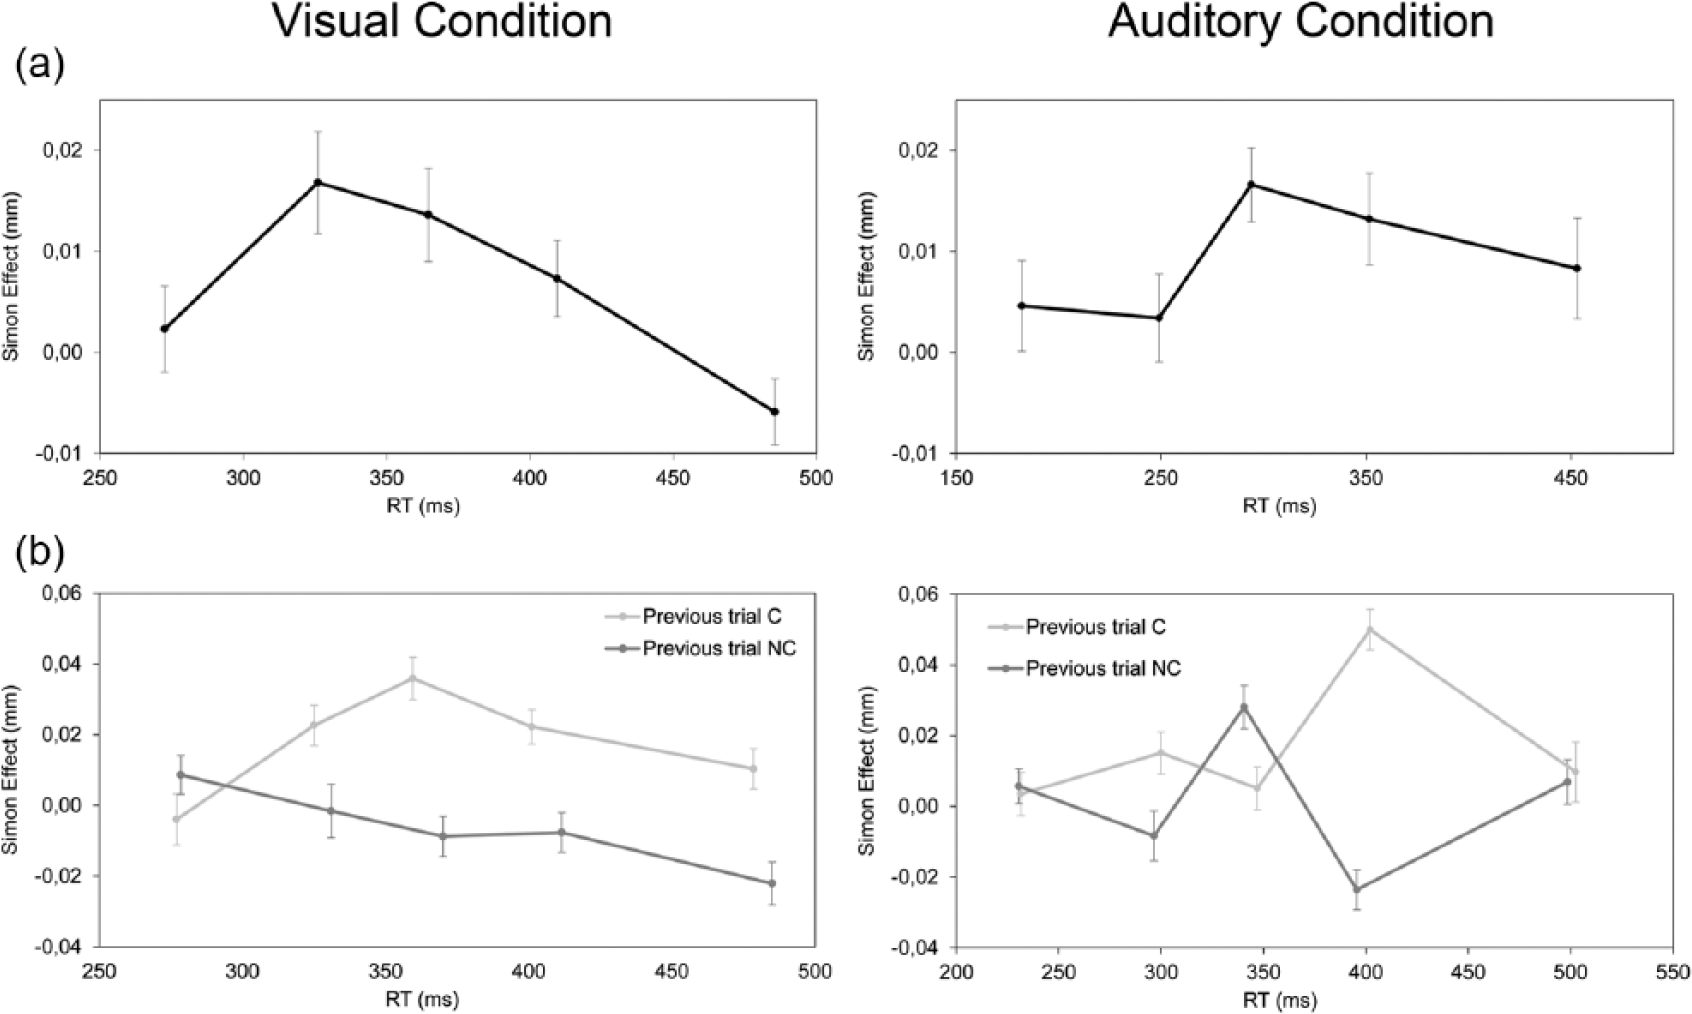
The Simon effect as a function of PD depending on RTs’ distributions for each bin considering (a) current trial correspondence and (b) previous and current trial correspondence, for the visual and auditory Simon conditions (leftmost and rightmost panels, respectively). Error bars indicate standard errors of the mean.
General discussion
The Simon effect has been widely investigated using visual stimuli, while the effect emerging with auditory stimuli remains, at least for some aspects, less studied. Specifically, while it is widely accepted that the visual Simon effect originates from the interplay between two processing routes leading to response activation, there is still an ongoing debate regarding the mechanisms underlying the auditory Simon task (e.g., Leuthold & Schröter, 2006; Wascher et al., 2001; Xiong & Proctor, 2016).
In this study, we performed a detailed comparison of the visual and the auditory Simon effects recording behavioural measures (RTs and ER) and PD, which is considered as a physiological index of the cognitive effort induced by conflict-related processing (i.e., van Steenbergen & Band, 2013), aiming to investigate the mechanisms underlying both effects. We specifically focused on those mechanisms responsible for shaping the RT distributions and for the sequential modulations evident in the visual and the auditory versions of the task. Importantly, to our knowledge, this is the first study that examined conflict processing by means of the pupillary response in the auditory Simon task. It should be noted that to achieve our aim and to avoid practice effects from the task performed as first to the task performed as second, a between-subject design has been performed. However, in order to investigate whether practice effects could also influence the subsequent task in this specific paradigm, a follow-up experiment using a within-subject design was performed (see Supplementary Appendix). The results of the two experiments are in line, but the within-subject design revealed an effect of the order of presentation of the task, supporting the notion that Simon task performance can be affected by a similar task performed before (e.g., Iani et al., 2009; Marini, Iani, Nicoletti, & Rubichi, 2011; Tagliabue, Zorzi, Umiltà, & Bassignani, 2000). Specifically, performing the auditory condition as first speeded up performance as compared to when the visual condition was executed as first. This result shows that performing the same task in a specific modality (i.e., auditory) can influence performance of the same task in a different modality (i.e., visual modality; see for example Vu et al., 2003). Consequently, we decided to focus our discussion on the results of the between-subject experiment.
Our behavioural results were in line with those of previous studies (e.g., Leuthold & Schröter, 2006; Pick & Proctor, 1999; Wühr & Ansorge, 2005): the Simon effect emerged for both visual and auditory modalities. As hypothesized, despite the fact that we did not find an overall advantage of the auditory condition compared to the visual one, the auditory Simon effect was significantly larger as compared to the visual one (35 vs. 24 ms). Crucially, the analysis of sequential modulations showed that after a corresponding trial, the Simon effect for RTs did not differ across modalities (61 vs. 55 ms, respectively), while it was larger for the visual than for the auditory Simon condition on ERs (12.5% vs. 5.7%, respectively). Differently, after a non-corresponding trial, the Simon effect in both RTs and ERs was reversed in the visual modality and only reduced in the auditory modality (−16 vs. 16 ms and −2.3% vs. 1.9%, respectively). Overall, the sequential modulations replicated those of previous studies using visual and auditory stimuli (e.g., Iani et al., 2009, 2012; Leuthold & Schröter, 2006; Stürmer et al., 2002), hence supporting the idea that the conflict experienced in a trial triggers adaptations aimed at eliminating the impact of spatial S–R correspondence on response selection in the following trial. Specifically, these findings are consistent with the proposal by Stürmer et al. (2002) that the unconditional processing route is under the control of an ancillary monitoring mechanism (AMM), which detects response conflict and subsequently suppresses the unconditional route (see also Ridderinkhof, 2002). It should, however, be noted that sequential modulations have been observed by Hommel et al. (2004) in the absence of conflict adaptation effects. The authors showed persistent sequential modulations in versions of the Simon task in which the occurrence of response conflict on the previous trial was precluded and concluded that congruency sequence effects in the Simon task do not require conflict-driven cognitive control processes. Subsequently, Wühr (2005) showed that sequential modulations can also be obtained in the absence of feature integration effects, concluding that in a typical Simon task (as used in this study), sequential modulations might reflect additive effects of conflict adaptation and feature integration (see also Wühr & Ansorge, 2005). Thus, it is not possible to exclude that our results were influenced by repetition effect, since, with the present paradigm, it is not possible to completely disentangle feature integration and conflict adaptation effects, and both may contribute to the observed sequential modulations. Interestingly, the direct comparison between sequential modulations in the visual and auditory versions of the Simon task provides some insights on the mechanism responsible for these modulations in the two conditions. Indeed, if we consider performance after a non-corresponding trial, we can notice that the visual Simon effect reversed while the auditory Simon effect was simply reduced. This finding may suggest that in the two conditions the same suppression mechanism produces different outcomes, probably because of the different strengths of the activation produced by stimuli in the two modalities. Specifically, the activation of the corresponding response through the unconditional route produced by auditory stimuli, which is thought to be stronger than the one produced by visual stimuli (see Vu et al., 2003), could be more difficult to suppress, resulting in a reduced auditory Simon effect after non-corresponding trials. Differently, since visual stimuli produce a weaker activation than auditory stimuli, suppression may result in a reversed visual Simon effect after non-corresponding trials. This inference is consistent with the notion that visual and auditory information processing differs in many regards, as also manifested by relevant differences between visual and auditory spatial attention (e.g., Kanwisher & Wojciulik, 2000; Neumann, van der Heijden, & Allport, 1986; Spence & Driver, 1994; Wu, Weissman, Roberts, & Woldorff, 2007).
The difference reported in the behavioural results between the two conditions also emerged partially for the pupillary data. Specifically, we did not found an overall reduced PD amplitude for the auditory stimuli compared to visual stimuli. In addition, we replicated the previous finding in which PD was larger in non-corresponding than in corresponding trials in the visual condition. Interestingly, we found that the PD Simon effect was also present in the auditory condition but, differently from RTs, no difference emerged between the magnitude of the visual and the auditory PD Simon effects, suggesting that probably the two conditions required the same amount of cognitive effort. Along with the results of previous studies (in which visual stimuli were used), these results showed that pupil diameter might be used as an indirect marker of the cognitive effort induced by conflict monitoring (e.g., Laeng et al., 2011; van Steenbergen & Band, 2013; Wendt et al., 2014) independently of the stimulus modality. In addition, the results of the analysis of sequential modulations showed that, in both conditions, a Simon effect emerged following a corresponding trial, whereas a null effect was evident following a non-corresponding trial, irrespective of the nature (visual or auditory) of the stimuli. Overall, this analysis revealed a pattern of results that is in line with a previous study on the visual Simon effect (van Steenbergen & Band, 2013) and added new empirical evidences on the conflict-related processing of auditory stimuli.
The analysis of the RT distributions showed differences between the visual and auditory conditions. More precisely, the visual Simon effect was present for fast RTs (bins 1-4) and decreased with longer RTs (e.g., Ridderinkhof, 2002; Wascher et al., 2001), whereas the auditory Simon effect was present at all bins and, compared to the visual Simon effect, increased with longer RTs (e.g., Wascher et al., 2001) showing a longer-lasting effect. Furthermore, the RT distributions were differently modulated by previous trial correspondence. Specifically, with visual stimuli, the Simon effect following a corresponding trial was present at all bins and decreased with increasing RTs, whereas, following a non-corresponding trial, it was absent at the fastest RTs and reversed at longer RTs, showing a decreasing function. We interpreted these results in light of the activation/inhibition account proposed by Ridderinkhof (2002). That is, the decreasing time course evident after both corresponding and non-corresponding trials may have been due to a relatively strong selective suppression of the unconditional route. Furthermore, it should be noted that after non-corresponding trials, the visual Simon effect reversed at the longer bins. Hence, it seems that the inhibition process following non-corresponding trials was stronger compared to that after corresponding trials (Ridderinkhof, 2002). However, the finding of a reverse visual Simon effect following a non-corresponding trial could be explained by the fact that complete repetitions of non-corresponding trials produce shorter RTs compared to partial repetitions. For auditory stimuli, following a corresponding trial, the Simon effect was present at all bins and increased with increasing RTs, whereas it increased in the first two bins to become stable with longer RTs following a non-corresponding trial. This flat time course following non-corresponding trials is in line with the account proposed by Stürmer et al. (2002), according to which after a non-corresponding trial the direct route is suppressed and the response activation process is mediated by the indirect route (see also Dittrich et al., 2014; Leuthold & Schröter, 2006).
It is important to note that such qualitatively different processes that have been inferred to exist for the two conditions of the Simon task might be re-interpreted in the light of the diffusion model for conflict tasks (DMC) recently proposed by Ulrich, Schröter, Leuthold, and Birngruber (2015). The model takes into account the idea of two simultaneous processes: one process (i.e., controlled process) operates on task-relevant information while the other (i.e., automatic process) operates on task-irrelevant information. Through a simulation model, the authors demonstrated that the shape of the time course function depends on how the automatic activation spreads out in time. If this automatic activation reaches its maximum relatively quickly, the time course will show a decreasing trend. If, however, the maximum of the automatic activation is reached relatively late, the resulting time course will be increasing. Ulrich et al. (2015) combined the concept of diffusion processes with the idea of dual processing in conflict tasks to provide a novel account of the delta functions. It should be noted that if we consider the modulation of the RT distribution by previous trial correspondence (sequential modulations), the model predicts the reduction in the Simon effect when the amplitude of the automatic activation is diminished. However, it does not predict the reversal of the Simon effect after a non-corresponding trial for slower responses, a result that we found in our visual condition. For this reason, we believe that this model, although interesting, needs to be further integrated.
In addition, the analysis of PD depending on the RT distributions showed that the visual Simon effect in PD increased in the second bin to then decrease. The auditory Simon effect slightly increased at the beginning and then decreased. It is possible that the difference in the time course between the two stimulus modalities evident in RT did not emerge in PD because this index does not reflect the different strengths of activation characterizing the two modalities. Moreover, considering the previous trial correspondence, in both conditions, the PD time course was stable after both corresponding and non-corresponding trials; however, it seems that it reflected the RT distribution, with a larger PD for slower RTs. This result might confirm the role of PD as an index of cognitive effort. However, it should be noted that PD, compared to RT, presents very small variations and tends to be noisy, and, in this analysis, dividing the number of trial into five bins may have decreased the statistical power to detect the effect.
To conclude, taken together, the findings of this study confirmed the widely accepted account that the visual Simon effect can be explained in the framework of the dual-route model of information processing. In addition, they seem to support the proposal that the visual and auditory Simon effects rely on the same mechanism, with both involving automatic response activation through the unconditional route (Leuthold & Schröter, 2006). Although the results of the RT distributional analysis are in line with those of Wascher et al. (2001), with a decreasing effect function emerging in the visual condition and an increasing effect function emerging in the auditory condition, the results of our analysis of the sequential modulations of the RT distributions add more evidence to the proposal of a control mechanism that, in both modalities, suppresses the unconditional processing route following the detection of a conflict. In other words, our data seem to indicate that even though these modalities seem to differ with respect to the strength of the activation and inhibition processes characterizing them, a common mechanism could underlie the Simon effect arising in the two modalities (see also Buetti & Kerzel, 2008). Importantly, these results were also corroborated by the pupillary measure that in both conditions mirrored the pattern observed in RTs and ERs.
Supplemental Material
Supplementary_appendix – Supplemental material for Visual versus auditory Simon effect: A behavioural and physiological investigation
Supplemental material, Supplementary_appendix for Visual versus auditory Simon effect: A behavioural and physiological investigation by Stefania D’Ascenzo, Luisa Lugli, Giulia Baroni, Roberto Guidotti, Sandro Rubichi, Cristina Iani and Roberto Nicoletti in Quarterly Journal of Experimental Psychology
Footnotes
Declaration of conflicting interests
The author(s) declared no potential conflicts of interest with respect to the research, authorship and/or publication of this article.
Funding
The author(s) disclosed receipt of the following financial support for the research, authorship, and/or publication of this article: Cristina Iani was supported from a grant from the University of Modena and Reggio Emilia (Fondo di Ateneo per la Ricerca, FAR 2014).
Notes
References
Supplementary Material
Please find the following supplemental material available below.
For Open Access articles published under a Creative Commons License, all supplemental material carries the same license as the article it is associated with.
For non-Open Access articles published, all supplemental material carries a non-exclusive license, and permission requests for re-use of supplemental material or any part of supplemental material shall be sent directly to the copyright owner as specified in the copyright notice associated with the article.