
Abstract
In this article, we present an investigation into the use of visual cues during number line estimation and their influence on cognitive processes for reducing number line estimation error. Participants completed a 0-1000 number line estimation task before and after a brief intervention in which they observed static-visual or dynamic-visual cues (control, anchor, gaze cursor, mouse cursor) and also made estimation marks to test effective number-target estimation. Results indicated that a significant pre-test to post-test reduction in estimation error was present for dynamic-visual cues of modelled eye-gaze and mouse cursor. However, there was no significant performance difference between pre- and post-test for the control or static anchor conditions. Findings are discussed in relation to the extent to which anchor points alone are meaningful in promoting successful segmentation of the number line and whether dynamic cues promote the utility of these locations in reducing error through attentional guidance.
Introduction
Eye movements have long been considered as a window into the mind (Wade & Tatler, 2005). It is well established that eye movement behaviours reflect what is likely to be the object of our thoughts (Ferreira, Apel, & Henderson, 2008; Knoblich, Ohlsson, & Raney, 2001; Tanenhaus, Spivey-Knowlton, Eberhard, & Sedivy, 1995) and that increased fixation durations are related to increased processing on the object of fixation (Just & Carpenter, 1976; Rayner, 1998, 2009) Research on numerical cognition has recently started to appreciate the value of employing eye-tracking studies (Hartmann & Fischer, 2016; Mock, Huber, Klein, & Moeller, 2016), with key studies involving adults (Reinhart, Huber, Nuerk, & Moeller, 2015; Sullivan, Juhasz, Slattery, & Barth, 2011) and both typically (Schneider et al., 2008) and atypically developing children (van’t Noordende, van Hoogmoed, Schot, & Kroesbergen, 2015) already revealing new insights into the online processes and strategies used in number line estimations.
The number line estimation task involves participants positioning a series of numbers on blank number line scales, generally using paper and pencil (Siegler & Booth, 2004), but more recently using tablet computers (LeFevre et al., 2013). The scale of the number line presented to participants varies with age, with young children being presented with small scales (e.g. 0-10, 0-20 or 0-100) and older children and adults being presented with larger scales (e.g. 0-1000), reflecting the anticipated extent of their number familiarity. In addition, manipulations of the presented scale have been used to experimentally investigate more complex numerical knowledge, such as that of fractions (Schneider, Grabner, & Paetsch, 2009). Unbounded number lines have also been utilized to further understand what precisely is measured by this task, with a growing body of evidence suggesting that proportional judgements are important for bounded, but not necessarily unbounded, number line estimation (Ashcraft & Moore, 2012; Barth & Paladino, 2011; Rouder & Geary, 2014). It is argued that in this experimental set-up, participants must make use of a ‘dead-reckoning’ strategy based upon the spatial-unit information given (e.g., target value of 25 to estimate, with spatial-unit information of 1). Dependent on the target number and spatial-unit information provided, participants may need to make an increased number of ‘dead-reckoning’ steps to estimate the spatial location of the target value (e.g., target of 30 would require half the amount of steps with spatial-unit information of 10 compared to 5). The use of a greater number of ‘dead-reckoning’ steps (or self-generated points of reference) may result in increased acuity of association between number magnitude and spatial extent reducing overall estimation error (Barth, Slusser, Cohen, & Paladino, 2011).
Typically, the number line task is analysed in one of two ways. Curve estimation provides an indication of the function of the estimates across the number line, with the actual position of the numbers being regressed onto the estimated points that participants have made, producing best-fit values for linear (
The task has gained increasing interest because of the consistently observed relationship between number line estimation and more complex mathematical achievement (see Siegler, 2016 for a review), with both more accurate and linear estimations being associated with better addition skills (Siegler & Booth, 2004), more successful mathematical learning (Booth & Siegler, 2008) and better general mathematical achievement (Muldoon, Towse, Simms, Perra, & Menzies, 2013). Due to the implied importance of number line estimation for mathematical achievement, there has been increasing interest in interventions to improve performance on this task. Siegler and Ramani (2008) observed that children who completed a simple linear board game intervention displayed more linear estimations after intervention compared to a control group. This improved estimation performance was also associated with increased addition accuracy. These findings have been replicated with children from low socio-economic backgrounds (Wilson, Dehaene, Dubois, & Fayol, 2009). More recently, a number of studies have utilized an embodied cognition approach using physical large-scale movements in board games and have observed similar findings (Fischer, Moeller, Bientzle, Cress, & Nuerk, 2011; Link, Moeller, Huber, Fischer, & Nuerk, 2013).
These intervention studies provide evidence suggesting a causal relationship between numerical estimation and mathematical achievement (Moeller, Fischer, Nuerk, & Cress, 2015). Nevertheless, it is currently debated what precisely the bounded number line task measures, for example, numerical representations (Siegler, 2016), proportional judgements skills (Cohen & Blanc-Goldhammer, 2011) or perhaps vital visuo-spatial skills to complete the task (Simms, Clayton, Cragg, Gilmore, & Johnson, 2016). As such, there has been a call to further understand the processes that underpin number line estimation responses, and a recent special issue by Hartmann and Fischer (2016) highlights how eye tracking may help shed new light on numerical cognition.
With regard to possible strategy use, relative increases in fixations at the beginning, middle and end points of number lines indicate that children and adults use these key areas as references points to estimate the target number on a line (Schneider et al., 2008; Sullivan & Barner, 2014; Sullivan et al., 2011). Moreover, these measures of online processing prior to making a response add to the growing support that proportional judgement models (e.g., Barth & Paladino, 2011) may offer a better fit of number line estimation data than traditional linear and logarithmic models (Siegler & Opfer, 2003; Siegler, Thompson, & Opfer, 2009). Since the processing involved in number line estimation has been linked to these reference points, making these task-specific areas more salient by adding visible anchor points at these key intervals should improve accuracy in number line estimations (Peters, Verschaffel, & Luwel, 2017; Siegler & Thompson, 2014). In addition, research suggests that number line estimations can be improved if there is some form of local feedback indicating the correct location of the target number values (Barth et al., 2016). We not only investigate these collective issues but also examine whether it is more beneficial for participants to observe another person make number line estimations using these anchor points, as shown by either their gaze position or mouse position.
Recording eye movement behaviour can help us understand visual and cognitive processes, but eye movements also have a communicative role in social and learning interactions by attracting and directing another’s attention (Kleinke, 1986; Shepherd, 2010). From an early age, we are highly sensitive to other people’s gaze (Brooks & Meltzoff, 2005; Symons, Lee, Cedrone, & Nishimura, 2004), and by following another’s gaze, our attention is guided towards relevant aspects of our environment (Flom & Pick, 2007; Hanna & Brennan, 2007). Indeed, through joint attention and viewing where another person looks, we alter our processing of the environment based on the processing modelled by others (Becchio, Bertone, & Castiello, 2008).
With this communicative role of gaze in mind, there have recently been a number of studies that have recorded eye movement behaviour of one observer and presented these eye movement recordings to others. The goal of these studies has been to understand whether knowing where a person looks changes the observer’s perceptions and decision-making ability and, ultimately, whether guiding their attention in this way helps observers complete tasks. Such gaze transfer studies have been employed in a wide range of tasks from medical image perception (Litchfield, Ball, Donovan, Manning, & Crawford, 2010; Seppänen & Gegenfurtner, 2012) and visual inspection tasks (Jarodzka, van Gog, Dorr, Scheiter, & Gerjets, 2013; Nalanagula, Greenstein, & Gramopadhye, 2006) to problem-solving (Litchfield & Ball, 2011; van Gog, Jarodzka, Scheiter, Gerjets, & Paas, 2009).
In line with the growing view that social cognition processes need to be understood on the basis of their interactive nature (Cole, Skarratt, & Kuhn, 2016; Schilbach et al., 2013), research has also enabled real-time interaction with another person via their gaze and demonstrated benefits in performance and coordination from this type of joint attention (Brennan, Chen, Dickinson, Neider, & Zelinsky, 2008; Carletta et al., 2010; Leff et al., 2015; Müller, Helmert, & Pannasch, 2014; Müller, Helmert, Pannasch, & Velichkovsky, 2013; Neider, Chen, Dickinson, Brennan, & Zelinsky, 2010; Velichkovsky, 1995; Wilson et al., 2011). Taken together, whether using pre-recorded videos of where a person looked during a task or using real-time gaze exchanges between two (or more) observers, gaze cursors representing where a person is looking can guide observers’ attention towards task-relevant areas and enhance performance.
While people can follow and make use of simple gaze cursor information to help make decisions (Brennan et al., 2008; Litchfield & Ball, 2011; Litchfield et al., 2010; Zelinsky, Peng, & Samaras, 2013), the ability to maintain precise eye position is offset by normal oculomotor activity (tremors, drifts, microsaccades), which means that gaze is often moving, even if only slightly (Holmqvist et al., 2011). In relation to the number line task where precision is key, this inherent movement may mean that when showing a gaze cursor to other observers, it may be difficult for them to follow and infer precisely where the model is looking on the number line. In contrast, mouse position only moves by the explicit intentional actions of the model and can remain in a stable location until the model decides otherwise. Indeed, previous research by Velichkovsky and colleagues (Müller et al., 2014; Müller et al., 2013; Velichkovsky, 1995) has shown that while gaze can be communicative and direct attention, presenting the mouse position of a model can function as a deictic pointing device that leads to equivalent improvements in participant performance (or better performance in certain contexts; cf., Müller et al., 2014). As a result, it is an open question whether observers would learn best from seeing where a model looked when making number line estimations or whether they would learn just as well from seeing where the model intentionally moved the mouse cursor to make these estimations. To investigate these issues, we examine whether number line estimations are improved when anchor positions are used and whether viewing another person’s gaze cursor or mouse cursor leads to additional improvements in accuracy.
Method
Participants
In total, 133 participants (44 males, 89 females) aged between 18 and 55 years (M = 22.06, standard deviation [SD] = 8.35) were recruited from two universities in England and Northern Ireland to participate in one of four number line estimation tasks. All participants were undergraduate Psychology students recruited through online participant schemes and were rewarded equally at both sites, either in the form of course credit or a small monetary payment. All participants had normal or corrected-to-normal vision, and each provided informed consent before completing the study.
Materials and procedure
All participants completed a 0-1000 number line task with a pre-test block (30 trials), followed by a cueing block (10 trials) and then a post-test block (30 trials). There were four conditions in the cueing block (Control, Anchor, Gaze Cursor, Mouse Cursor), and these were run as a between-participants experiment to avoid practice effects from the similar task demands across the procedures. In each of the four conditions, the following parameters were consistent. E-Prime 2.0 was used to present a horizontal line across the screen 10 cm in length, which was bounded by the values 0 and 1000, presented beneath the line at the left and right extremes. The target number value for each trial was presented above the midpoint of the number line on each trial and remained on screen until a response was given.
Participants used the computer mouse to select the location on the blank number line of the target value presented on screen. In the Control condition, participants completed five practice trials followed by responses to 30 different randomized target values (2, 7, 10, 19, 42, 62, 103, 158, 198, 230, 289, 297, 346, 391, 438, 470, 508, 591, 613, 694, 728, 760, 835, 879, 902, 942, 960, 971, 984, 990), the next block consisted of responses to 10 further target numbers presented in a pseudo-randomized order (20, 560, 700, 220, 980, 800, 60, 430, 950, 980) and the final block was a repeat of the first with the same target numbers being estimated presented in a randomized order. In all response blocks, the instructions emphasized location estimation accuracy over response speed.
In the following three conditions, the target values, block order and target number order were the same as the control condition and only differ in the middle cueing block. In the Anchor condition, the pre-test and post-test blocks were presented as a blank bounded number line, whereas the middle cueing block of 10 trials had visual anchor markers presented along the number line in the following locations: origin (0), first quartile (250), midpoint (500), third quartile (750) and endpoint (1000). No explicit attention was drawn to these, and participants were instructed to perform the task as directed previously. In the Gaze Cursor condition, rather than asking participants to complete 10 trials using the Anchor points, participants were shown 10 videos of where another person was looking (eye-gaze cue depicted as a dynamic 1° red dot overlaid on the screen), with participants watching the model move their eye-gaze to an appropriate anchor mark to then estimate a final value location, e.g., a target value of 800 would be shown using the third quartile anchor to estimate from. No mouse position information was provided where the person actually pointed to the number location with participants only seeing eye-gaze information. In the Mouse Cursor condition, participants were shown 10 videos indicating where this same person moved the mouse cursor to estimate the location of the target number value (but no information provided where the person was actually looking during the task). To create these 10 Gaze Cursor and 10 Mouse Cursor videos, one of the authors performed the number line task while their eye movements were recorded using an EyeLink 1000 eye-tracker (SR Research Ltd, Mississauga, Canada). Following a 9-point calibration using a chin-rest and seated 57 cm from the screen (average calibration error of 0.22°), 10 videos were created in Dataviewer (SR Research) showing either where the model was looking (Gaze Cursor) or where the model was pointing the mouse (Mouse Cursor) when estimating the target number value. Each video lasted approximately 20 s (M = 17.1 SD = 1.79) and were embedded into the appropriate cueing block using E-Prime. Both the gaze cursor and mouse cursor videos displayed a model which moved towards the most relevant anchor point and then shifted to the correct position of the number. Once the final video was shown, participants proceeded immediately to the Time 2 (post-test) block.
Data analytic strategy
Participants’ judgements were converted from the x–y coordinates to a numerical value along the number line in the 0-1000 estimation parameters, allowing calculation of a PAE: ((response estimate − target number)/length of number line) × 100; for example, if the target number was 600 and the participant estimated 650, then the PAE would be equal to ((650 − 600)/1000) × 100 = 5%. Average PAE values per participant were calculated for both pre-test (Time 1) and post-test (Time 2). An analysis of covariance (ANCOVA) was conducted with the dependent factor of Time 2 PAE, the fixed factor of group (anchor, expert video, cursor and control) and the covariate of Time 1 PAE. For post hoc analyses, paired-samples t-tests were used to assess differences between Time 1 and Time 2 performance for each group separately. Partial eta-squared values were used as a measure of effect size for ANCOVAs and Cohen’s d was used for paired-samples t-tests.
Results
The results of the ANCOVA revealed that there was a main effect of group, F(4, 128) = 13.85, p < 0.001,
Pairwise comparisons revealed that after controlling for PAE at Time 1, there were significant differences between the following groups at Time 2: Gaze Cursor and Anchor, Mdiff = −0.90, p = 0.002; Gaze Cursor and Control, Mdiff = −1.35, p < 0.001. There were also significant differences between Anchor and Mouse Cursor, Mdiff = 1.20, p < 0.001, and Mouse Cursor and Control, Mdiff = 1.66, p < 0.001. Bonferroni corrections were applied due to multiple comparisons, thus reducing the α value to p < 0.007. Therefore, all significant differences remained after correction for multiple comparisons. There were no other significant differences.
Paired-samples t-tests revealed that there was a significant difference in PAE between Time 1 and Time 2 for the Gaze Cursor condition, t(33) = 4.10, p < 0.001, d = 0.69, and for the Mouse Cursor condition, t(29) = 7.07, p < 0.001, d = 1.16 (see Figure 1). There were no significant differences between Time 1 and Time 2 for the Anchor or Control group (both ps > 0.05).
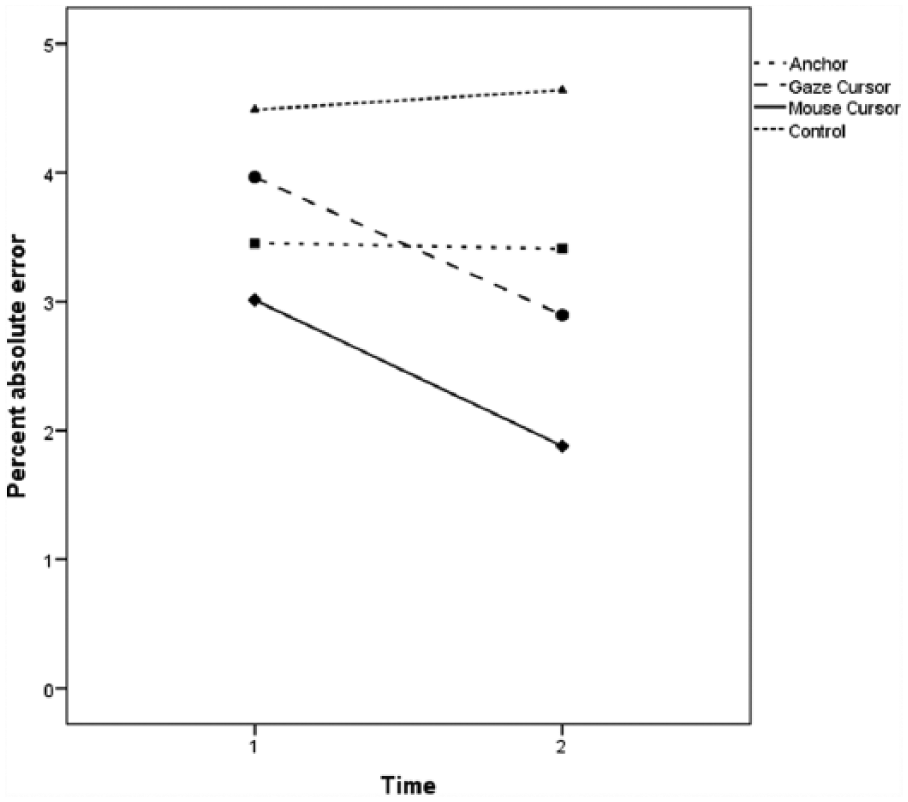
Average PAE at Time 1 and Time 2 for all groups (Control, Anchor, Gaze Cursor and Mouse Cursor).
Further exploratory analysis was conducted to assess any changes in estimation accuracy around the five anchor point locations. In order to assess estimation accuracy at these locations in each task, an average PAE was generated for each participant in each of the experimental conditions. The estimation values from which the PAE values were obtained were as follows: Origin (2, 7), first quartile (230, 289), midpoint (470, 508), third quartile (728, 760) and endpoint (950, 980). The values were selected as the two closest to that of the visual anchor locations provided. Contour analyses were generated for both the pre- and post-test blank number lines.
In order to compare whether accuracy in participants’ estimates were improved at the locations where visual anchors had been provided in the cuing blocks, paired-samples t-tests were conducted separately for each of the experimental conditions between pre-test and post-test at each of the anchor locations. Bonferroni correction was applied, resulting in an adjusted α level of p < 0.01 to correct for multiple comparisons. The analysis showed that there were no significant improvements in estimation accuracy for the blank Control condition or the visual Anchor conditions where only static visual cues were present. However, under task conditions where dynamic-visual cues were presented, there was evidence of improved estimation accuracy. In the Gaze Cursor condition, there was a marginally significant difference in estimation performance at the first quartile, pre (M = 5.62) and post (M = 4.06), t(32) = 2.512, p = 0.017, d = 0.90, yet no other comparisons reached significance. In the mouse cursor condition, a significant reduction in estimation error was found at the first quartile, pre (M = 2.13) and post (M = 1.73), t(29) = 2.96, p = 0.006, d = 1.12, although again no other comparisons reached significance.
Findings from the contour analysis, therefore, suggest that there was additional benefit in reducing estimation error with transfer of information from dynamic-visual cues; however, such benefit was not found with static visual cues at the anchor locations, and this performance benefit was not consistent across the number estimation range.
Discussion
The aim of this study was to examine whether number line estimations are improved when anchor-based number lines highlight interval regions, and specifically whether viewing another person’s gaze cursor or mouse cursor leads to additional improvements in accuracy. Contrary to expectations, participants in the Anchor condition did not show an improvement in performance in Time 2 and were equivalent in performance to the control condition in which no anchor lines were provided.
However, viewing another person’s gaze during number line estimation led to increased performance (reduction in estimation error) on post-test trials compared to control conditions with or without anchor points. These findings are consistent with previous research that has found that presenting a cursor representing where another person looked during a task can enhance observer performance (e.g., Litchfield & Ball, 2011; Litchfield et al., 2010; Nalanagula et al., 2006). In addition, Litchfield et al. (2010) demonstrated that it is the task specificity of the presented gaze that causally determines improvements in performance, as presenting eye movements that are random or not aligned to the specific task does not lead to improved performance. Therefore, our finding that number line estimation improved was not due to the mere presence of a moving stimulus during the intervention trials but instead driven by increased attention directed at task-relevant areas.
Moreover, presenting the mouse position of where an observer estimated number lines also led to increased performance compared to control conditions with or without anchor points. This corroborates existing research that suggests that mouse position can also provide a stable deictic cue that can guide observers’ attention and enhance performance just as well as gaze cues (Müller et al., 2014; Müller et al., 2013; Velichkovsky, 1995). After controlling for baseline error rates at Time 1, there was no statistically significant difference in error rates between participants in the Mouse Cursor condition and Gaze Cursor at Time 2 (Table 2), although performance in the Mouse Cursor condition was marginally more accurate (Table 3).
Descriptive statistics of the average PAE for each group (Control, Anchor, Gaze Cursor and Mouse Cursor) at Time 1 and Time 2.
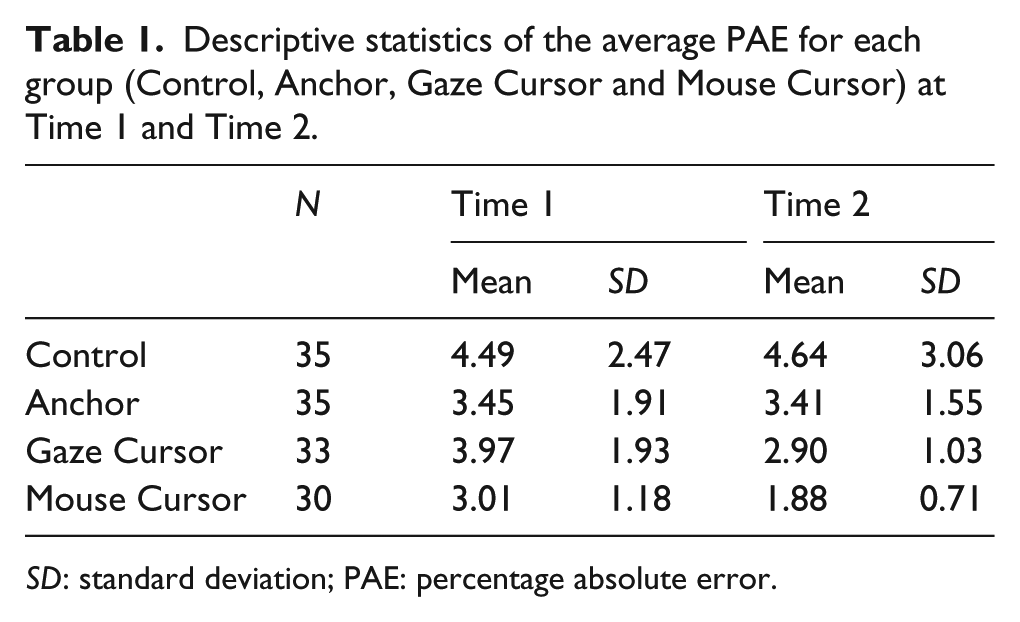
SD: standard deviation; PAE: percentage absolute error.
Estimates of PAE at Time 2 for each group, controlling for PAE at Time 1.
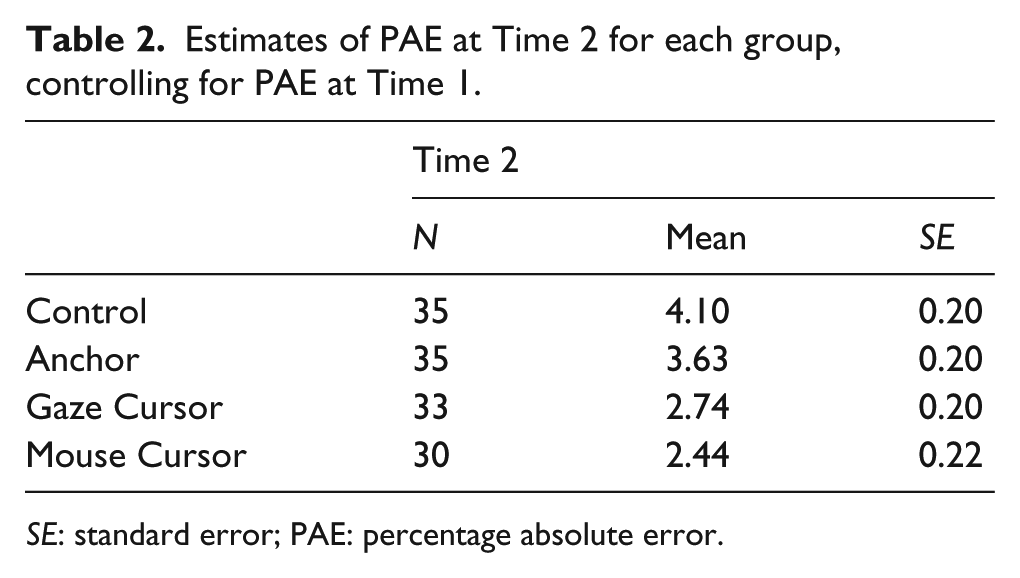
SE: standard error; PAE: percentage absolute error.
Mean percentage absolute error (PAE) of values at anchor points displayed for each experimental condition.
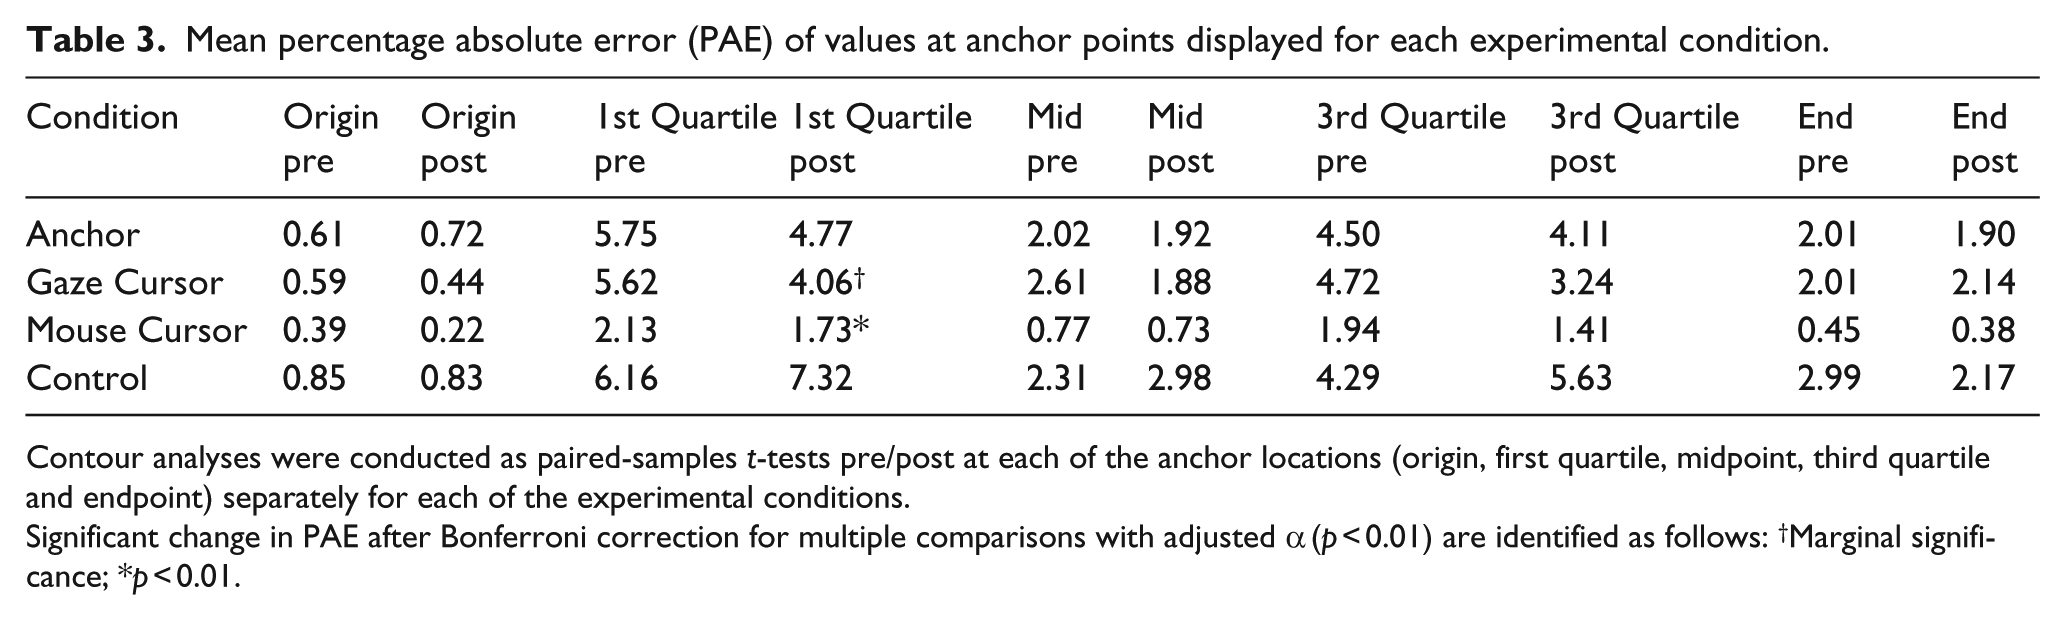
Contour analyses were conducted as paired-samples t-tests pre/post at each of the anchor locations (origin, first quartile, midpoint, third quartile and endpoint) separately for each of the experimental conditions.
Significant change in PAE after Bonferroni correction for multiple comparisons with adjusted α (p < 0.01) are identified as follows: †Marginal significance; *p < 0.01.
As mentioned earlier, attention can be guided by another’s gaze (Litchfield & Ball, 2011; Neider et al., 2010) or mouse position (Velichkovsky, 1995), yet the Mouse Cursor may have been easier to follow more precisely since its position is more stable and is only moved under explicit intentional actions by the model, whereas the Gaze Cursor is often also accompanied with some form of oculomotor motion. The stability of the mouse cursor may help explain why viewing mouse position was marginally superior to viewing gaze position in this task. Findings from the contour analysis also support the benefit of a dynamic cue which was found to be most informative at a location along the number line where greater estimation error was found to occur in the pre-test block (first quartile), with this being most apparent for the stable mouse cursor cue. The impact of this cue was not shown to have a consistent impact across the number range or at all estimation anchors, which may suggest that information for such cues is interpreted most readily when participants have less knowledge of a number-value location (e.g., there was already high accuracy at the origin and midpoint, so less need to make use of additional cue information).
In addition, the visual representation of a mouse cursor was most similar to the dynamic feedback from participants’ own location estimations in the pre-test block; therefore, the saliency with which this cue may transmit meaningful number-location information may be greater than that of other dynamic representations. Therefore, if the goal is to explicitly direct an observer to a precise area in the environment or provide a worked example (Atkinson, Derry, Renkl, & Wortham, 2000; Skuballa, Fortunski, & Renkl, 2015), then it is understandable that mouse movement may be just as appropriate in this regard. Establishing that the Mouse Cursor and Gaze Cursor models had similar impact on performance emphasizes that they both can be a deictic pointing device that can deliberately guide attention (Neider et al., 2010). However, gaze cursors also reflect underlying thought processes that may be implicit to the model and which they are not directly trying to communicate to the observer. That is, even when the model providing the eye movements is not trying to actively and didactically convey the ideal problem solution to subsequent observers in a bid to maximize learning, viewing their attentional processes is nonetheless informative (Litchfield & Ball, 2011; Litchfield et al., 2010). The strengths and weaknesses of these Mouse and Gaze Cursor models may explain the similar error rates observed in these conditions at Time 2.
Taken together, our findings build on previous research showing that number line estimations can be improved following local feedback indicating the correct location of target number values (Barth et al., 2015). By presenting visual recordings of where a model thought these number values were along the number line, alongside visual anchor representations, we hypothesized that this would help observers establish (with greater precision) the likely locations of numbers on this 0−1000 number line in subsequent trials. While an enhancement in performance accuracy was found in conditions where a dynamic cue was present, with reasons for this being previously discussed, no difference was found between the control and visual anchor conditions. Ashcraft and Moore (2012) suggest that marked landmarks may not influence estimation accuracy where participants may generate subjective landmarks. In our current task conditions, participants may have generated their own subjective landmarks in the pre-test block. With no explicit instructions to make use of the visual anchors in the middle block, the mere presence of a visual cue may have had little impact on reducing estimation error. A recent study by Peters et al. (2017) observed that the presence of landmarks improved adults’ estimation performance. However, in contrast to this study, the landmarks in the Peters et al. study were present throughout task completion. Siegler and Thompson (2014, p. 41) suggest that visual anchors are ‘. . . structurally important features that are not encoded spontaneously but that make useful strategies possible’. Thus, although present landmarks may improve concurrent estimation, our data suggest that transfer to increased accuracy in performance when they are removed can be facilitated by the additional presence of dynamic cues (i.e., Gaze cursor or Mouse Cursor interventions). Our study indicates that the dynamic cues drive the utility of visual anchors as meaningful features for greater estimation accuracy.
This study focused on adult participants, and increased accuracy on the number line estimation task was observed in the mouse and gaze cursor intervention. Given the relationship between number line estimation and more complex mathematical achievement (Siegler, 2016), it would be interesting to investigate whether similar, or stronger, effects can be observed with children or individuals with specific difficulties in number line estimation. Our study sample comprised highly educated students; thus, extreme caution must be taken when generalizing our results. Nevertheless, the ability to use reference points to make number line estimations appears to have a developmental trajectory as children and adults are more likely to fixate interval regions (beginning, middle and end points) and make greater use of these areas with age and experience (Ashcraft & Moore, 2012). As eye movements were not recorded during the trials, we cannot confirm whether observers changed where and how they fixated interval regions when presented with the anchor number line compared to the control condition. Similarly, it was not possible to establish how accurate observers were at following the gaze and mouse cursors, respectively, and whether the precise coupling of observer’s gaze with the model’s gaze/mouse was key to the improvements in performance, i.e., those who tightly followed the mouse/gaze cursor showed the largest improvements. Future studies should incorporate both gaze following and gaze tracking in order to unpack the influence of the intervention further.
Footnotes
Declaration of conflicting interests
The author(s) declared no potential conflicts of interest with respect to the research, authorship and/or publication of this article.
Funding
The author(s) received no financial support for the research, authorship and/or publication of this article.