
Abstract
Wear evaluation of rolling components is crucial for tramway dynamics, maintenance and safety. 2D contact wear measurement techniques are the most commonly used to detect the health conditions of rails. In this paper, the novel use of a portable metrological 3D optical scanner is proposed and compared to the prior 2D methods. Laboratory results show that the application of 3D optical digitizers gives results consistent with the 2D results but gives also a more complete and global view of the wear phenomenon. Different inspection procedures are compared and discussed in order to propose the best method to perform 3D wear mapping. The results of on-line experimental campaigns on the real tramway line of Florence (Italy), performed with the current and the new proposed instruments and methods, are also presented and compared. From the results of this paper, new strategies for the maintenance service of tramways, and especially of the Florentine tramway, can be proposed.
Introduction
The problem of tramways safety is a crucial issue for an efficient mobility in a smart city. Since safety depends on the infrastructure maintenance status, diagnostics of the rail wear conditions is very significant to prevent malfunctioning and service interruption [1–5]. Furthermore, high quality rolling components guarantee better dynamical performances, reliability, safety and driving comfort [6,7]. Ordinary diagnostics consists of visual inspections, while technical diagnostics involves the use of measuring instruments to evaluate a set of parameters such as track gauge, cant, crooked, 45° wear and vertical wear. Currently, the instruments used to evaluate the wear progress on the track due to WRI (Wheel-Rail Interaction) are based on the acquisition of 2D profiles, such as:
- MiniProf Rail (Greenwood Engineering A/S, BrØndby, Denmark), [2,4,8–12]; - RMF-2.3E (Vogel and Plötscher GmbH end Co. KG, Breisach,Germany), a continuous corrugation analysis trolley (CAT system) [13], allowing automated continuous scanning of the rail longitudinal profile, and simultaneous measurements of the left and right rail. The sensing elements are measuring needles acting as a follower of a cam [6,14–16].
On the other hand, 3D digital models of components are becoming more and more useful to monitor the wear progress in mechanical and biomedical applications, thanks to numerous recent technological advances [20–24]. A few papers are available in the latest scientific literature describing the use of 3D optical non-contact digitizing instruments, applied to tribological issues [21,23–32]. The use of optical 3D scanners for 3D wear mapping is a topic of great significance also in the field of the WRI [33]. In this paper, the case of the Florence tramway is evaluated. Currently, the verification of the track wear and maintenance conditions is based on the results registered by instrumented diagnostic trolleys, capable of measuring just the 2D profile of the rail by contact probes, every 150 mm. The registered 2D data can be used to indirectly evaluate geometrical parameters such as the track gauge, the cant of the track, the side wear and others. The aim of this paper is to show a novel application of a non-contact portable 3D laser scanner, an inspection software and a wear assessment method, already presented for different applications [20], to perform wear measurements of rail components, as never seen elsewhere in scientific literature. Laboratory tests were carried out with a 2D contact profilometer and a portable 3D laser scanner on a portion of straight worn rail, whit the aim of demonstrating the consistency of the 3D data from the scanner with the 2D data from the contact probe. Different inspection procedures were compared and discussed in order to propose the best method to perform 3D wear mapping. Then, on-track campaigns were performed by using both the 3D optical laser scanner and the 2D contact trolley, currently used on the Florence tramway line. Results were compared and demonstrated to be consistent with each other. Furthermore, this paper demonstrates that the application of 3D instruments gives a more complete and global view of the wear phenomenon due to the WRI and allows the measurement and the assessment of all the wear parameters in a single acquisition. From the results, new, faster and more efficient and reliable strategies for the maintenance service of tramways can be proposed.
Rail wear detection: Experimental approach and preliminary laboratory results
Preliminary laboratory tests were carried out in order to compare results of the wear detection obtained from ultra-accurate contact 2D measuring instruments and 3D metrological optical laser scanners. The specimen of the tests was a straight rail portion of 400 mm of length with a profile Ri60 R13, which was worn out on the counter rail (1) and on the flange (3) and rolling thread (4), according to the real practice (Figure 1a and b). Different alignment and inspection procedures were compared and discussed to propose the best method to perform 3D wear mapping during on-line tests. The wear was evaluated by comparing the detected worn rail model to reference homologue 3D models and 2D profile curves. At the beginning of the laboratory tests, the unworn rail portion (Figure 1(a)) was scanned by the 3D scanning instrument, and the resulting mesh was compared to the reference CAD model of the rail, in order to check the production tolerances. The result showed that the CAD model perfectly fits with the real rail component, so both the CAD and the mesh of the unworn rail can be used as a reference for the inspection phase.
Specimen for laboratory tests: (a) unworn rail portion (1) counter rail, (2) throat, (3) flange, (4) rolling thread; (b) worn rail portion.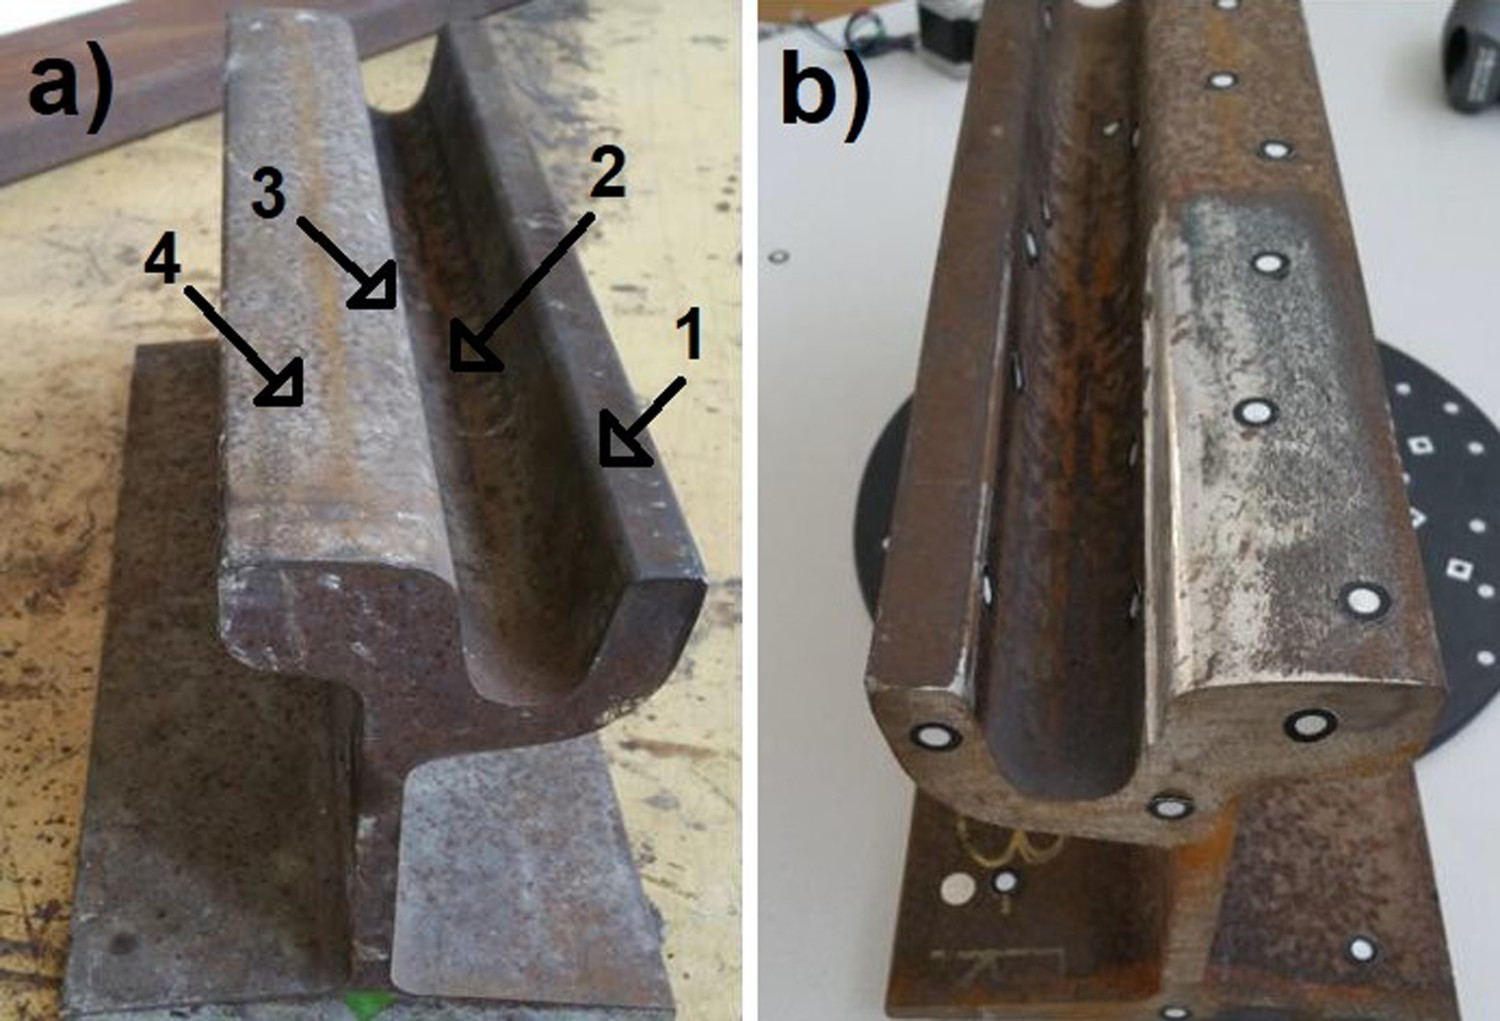
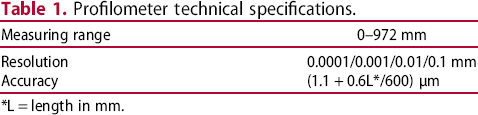
The 2D measuring instrument used in this work is Linear Height LH-600E/EG – Series 518 (Mitutoyo Corp., Kawasaki, Japan). This is a contact stylus profilometer (Figure 2(a)) and its technical specifications are reported in Table 1.
Measuring instruments: (a) 2D contact profilometer; (b) 3D laser scanner. Profilometer technical specifications. *L = length in mm.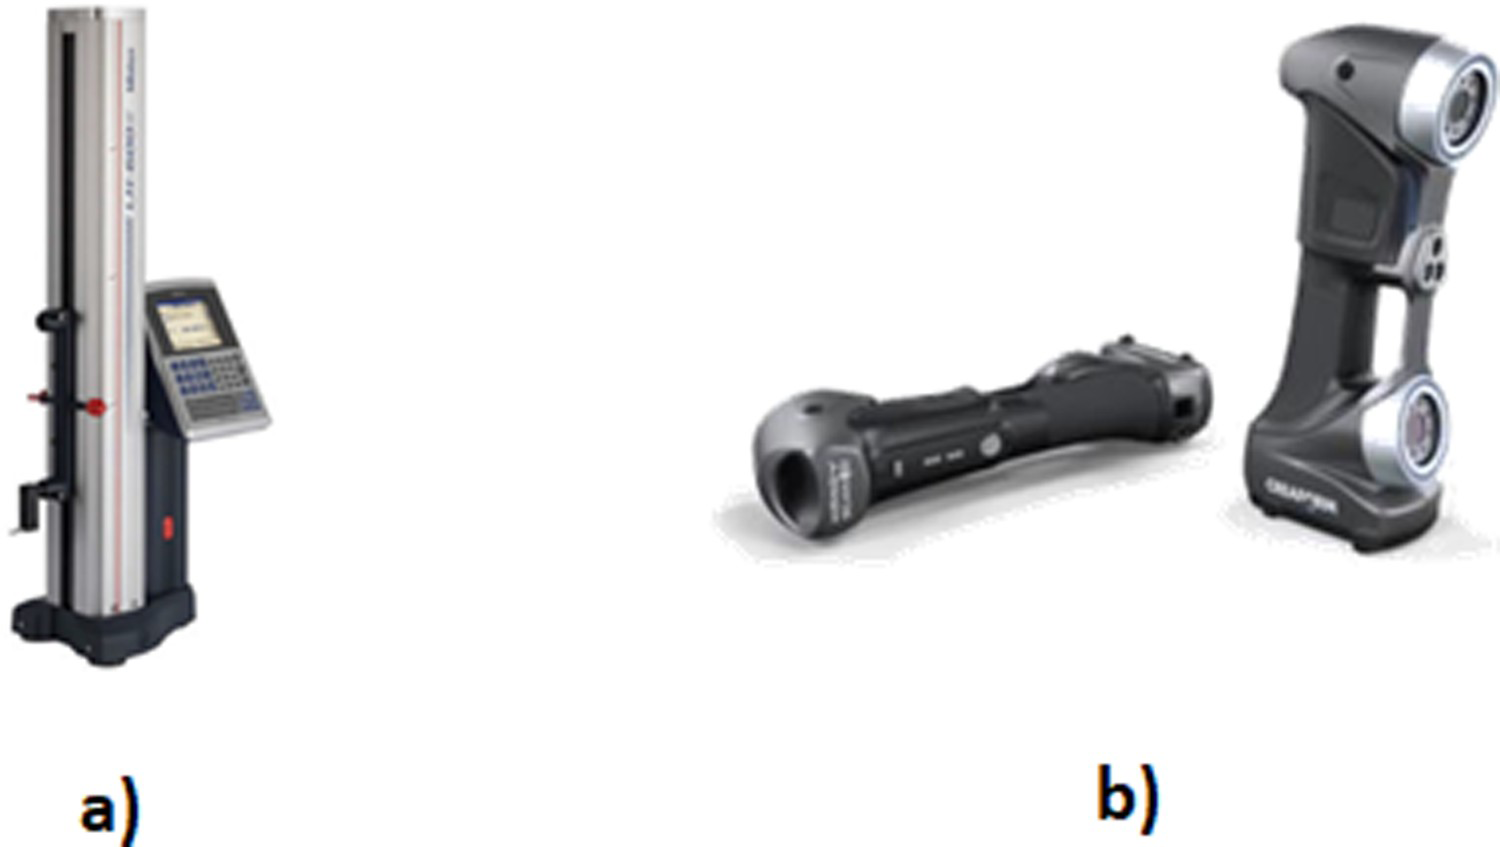
HandySCAN700 technical specifications.
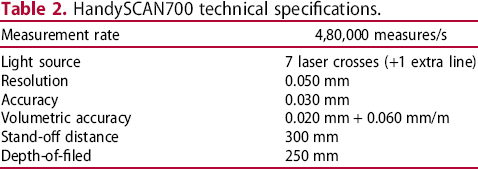
In this device, a red laser source projects 7 + 1 laser crosses on the scene and the embedded 3D acquisition software VXelements (Creaform Inc., Lévis, Quebec) allows real-time 3D reconstructions of the specimen. The scanning procedure is performed by using physical targets as positioning references. Those targets are white highly reactive adhesive circles with black contours (Figure 1(b)), to be applied on the background or directly on the target object.
The laboratory measurements performed with the profilometer took four minutes for any rail section and with the 3D scanner they took 6 min for the entire rail portion and considering also the positioning model preparation with physical targets.
The wear mapping and inspection procedure were performed by means of the 3D modelling and inspection software VXmodel and VXinspect (Creaform Inc., Lévis, Quebec). In Figure 3 the wear inspection workflow used in this study is shown. The first step consists of the CAD import, followed by 3D mesh or 2D profile import and optimization by VXmodel. Afterwards, the creation of geometrical entities allows the CAD to mesh/curve alignment and the comparison by colormaps. Every point and entity can be measured, labelled and inspected all over the component surface/profile.
Wear inspection procedure.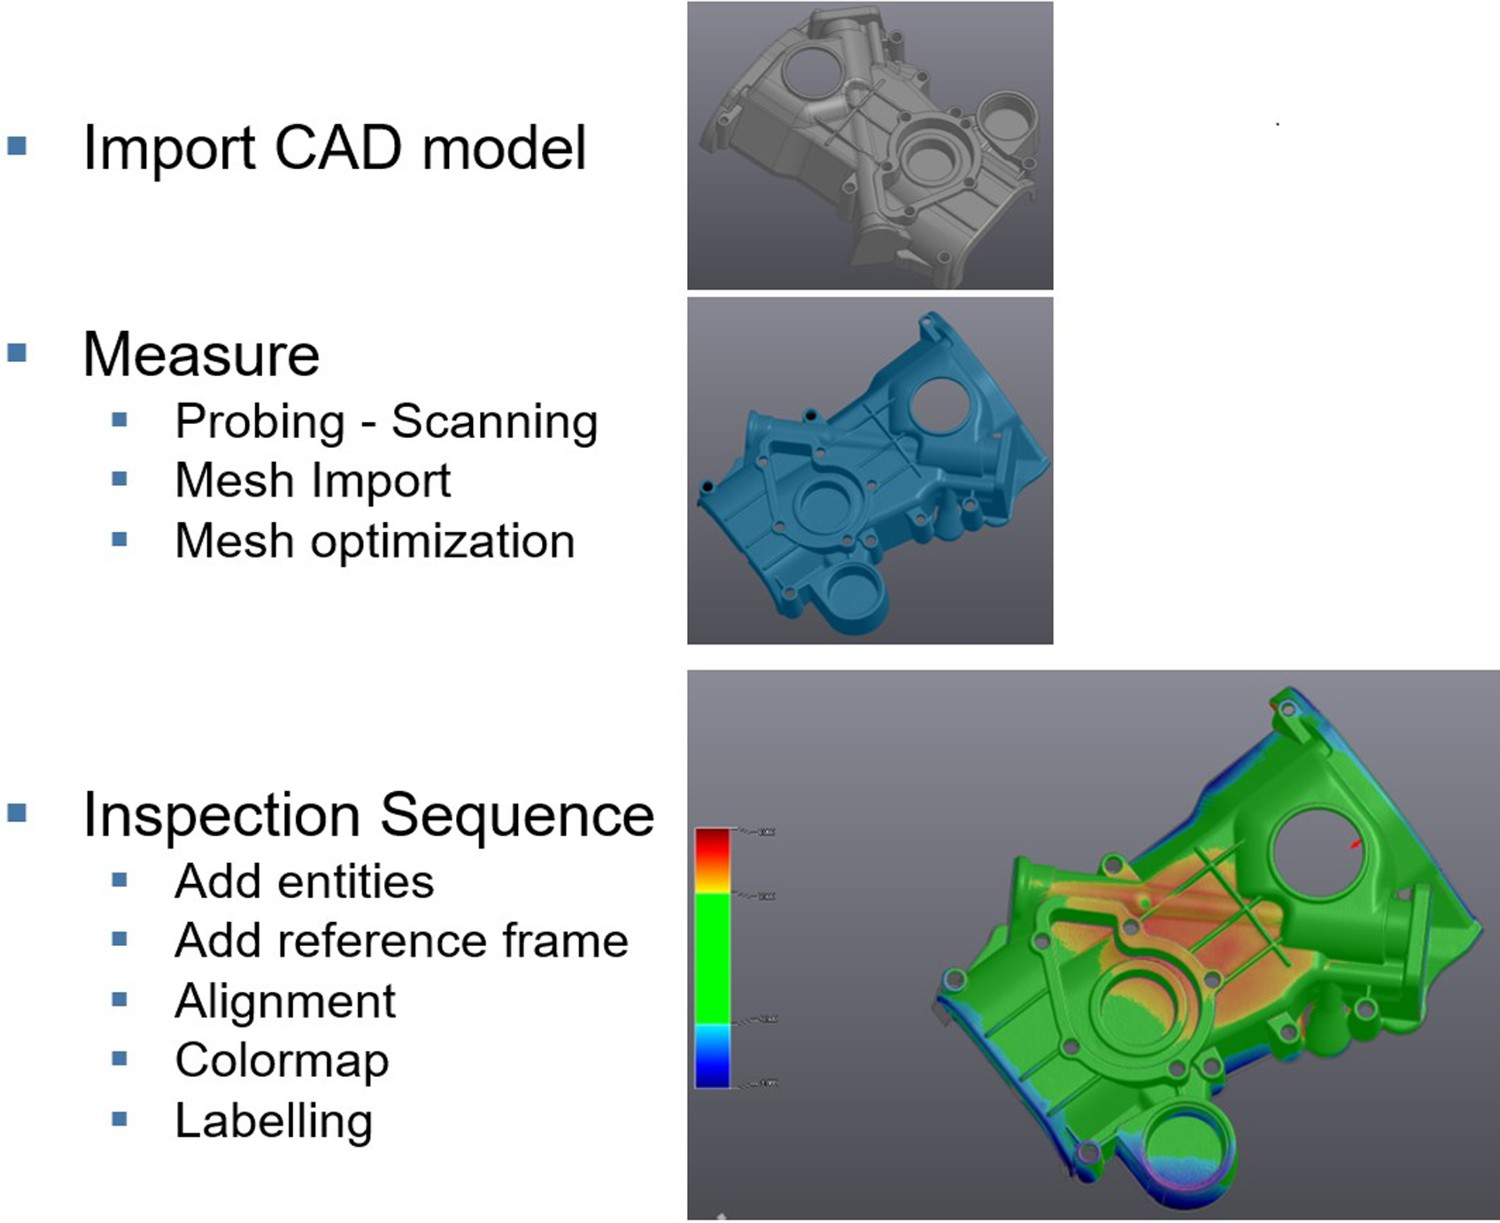
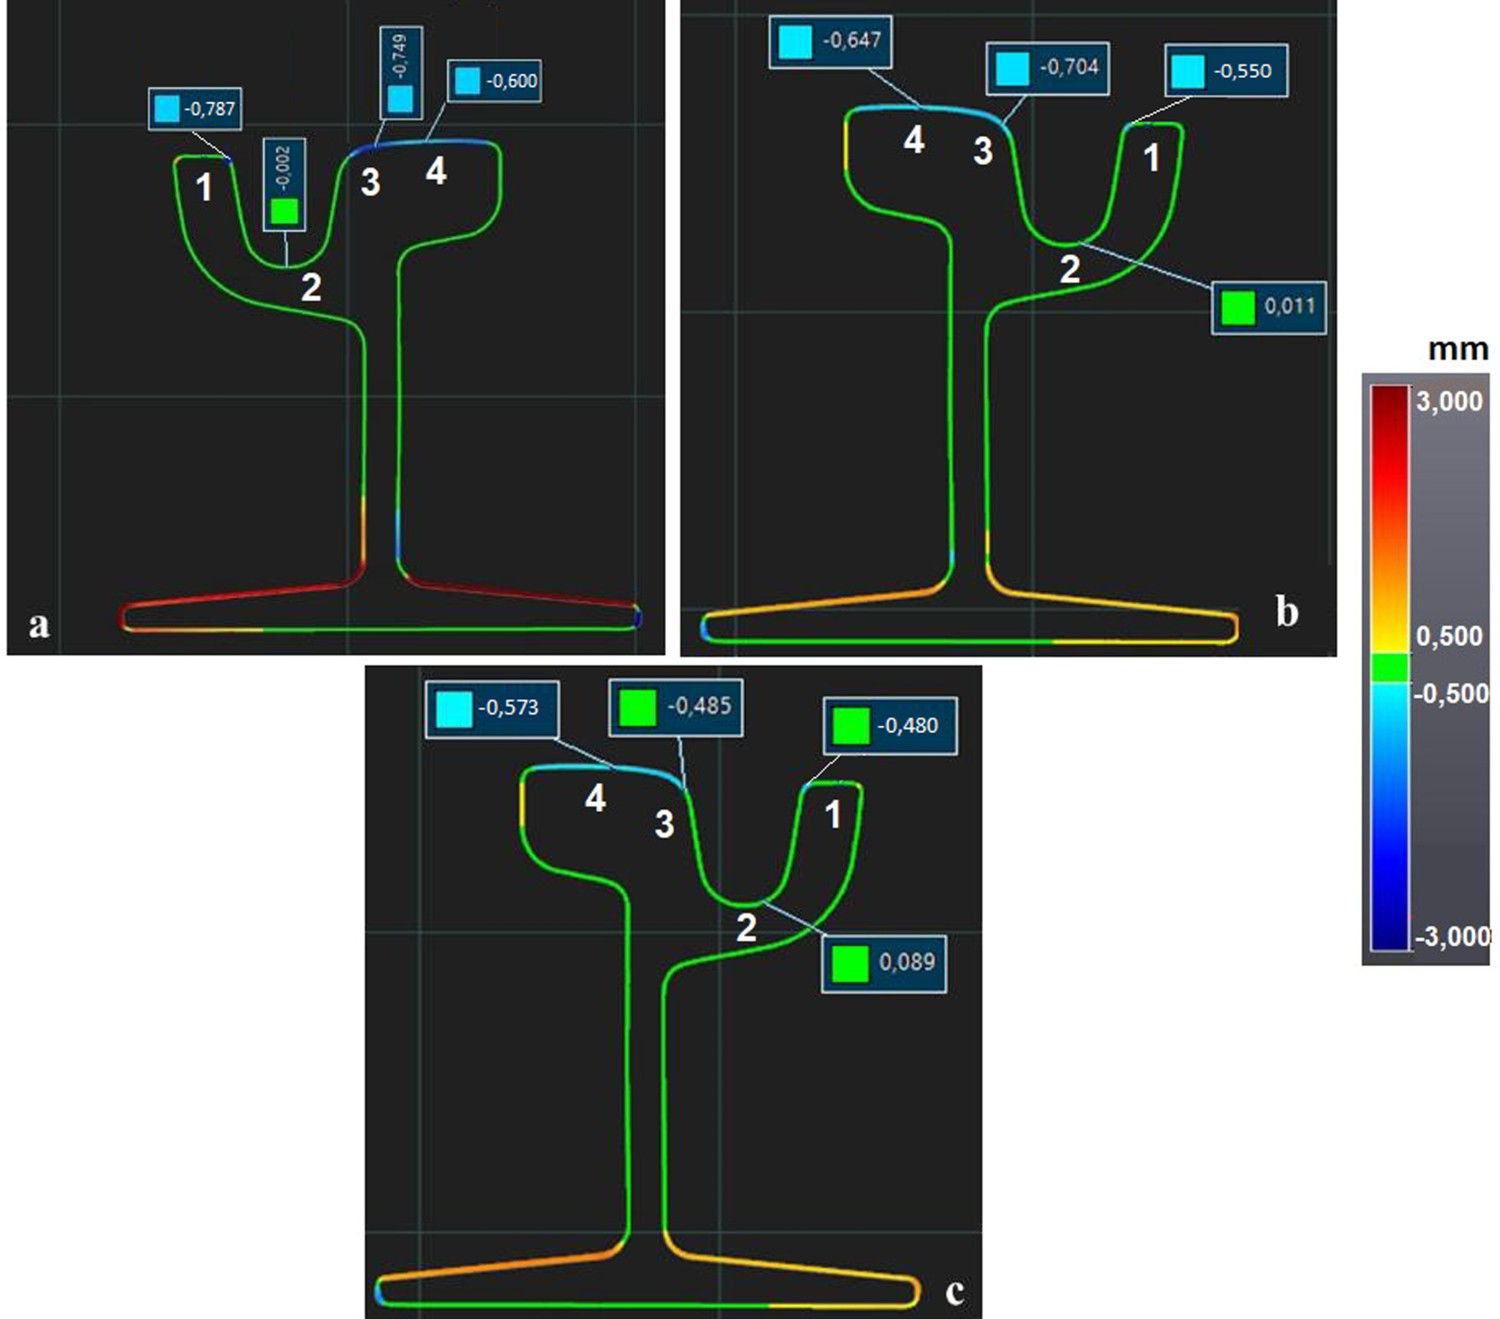
The rail portion was measured at the centre line section by using the profilometer. The wear thicknesses were analysed by aligning and superimposing the worn 2D profile and the CAD reference model of the rail. In this case, the alignment procedure can be performed based on different criteria: alignment by vertical plane, throat cylinder and counter rail plane (a); alignment by counter rail plane, vertical plane and flange plane (b); best-fit algorithms (c) (Figure 4). The results of the inspection are shown in (Figure 5).
Different alignment methods: (a) by counter rail plane, vertical plane and throat cylinder; (b) by counter rail plane, vertical plane and flange plane. 2D wear maps from laboratory tests: (a) alignment by counter rail plane, vertical plane and throat cylinder; (b) alignment by counter rail plane, vertical plane and flange plane; (c) alignment by best fit.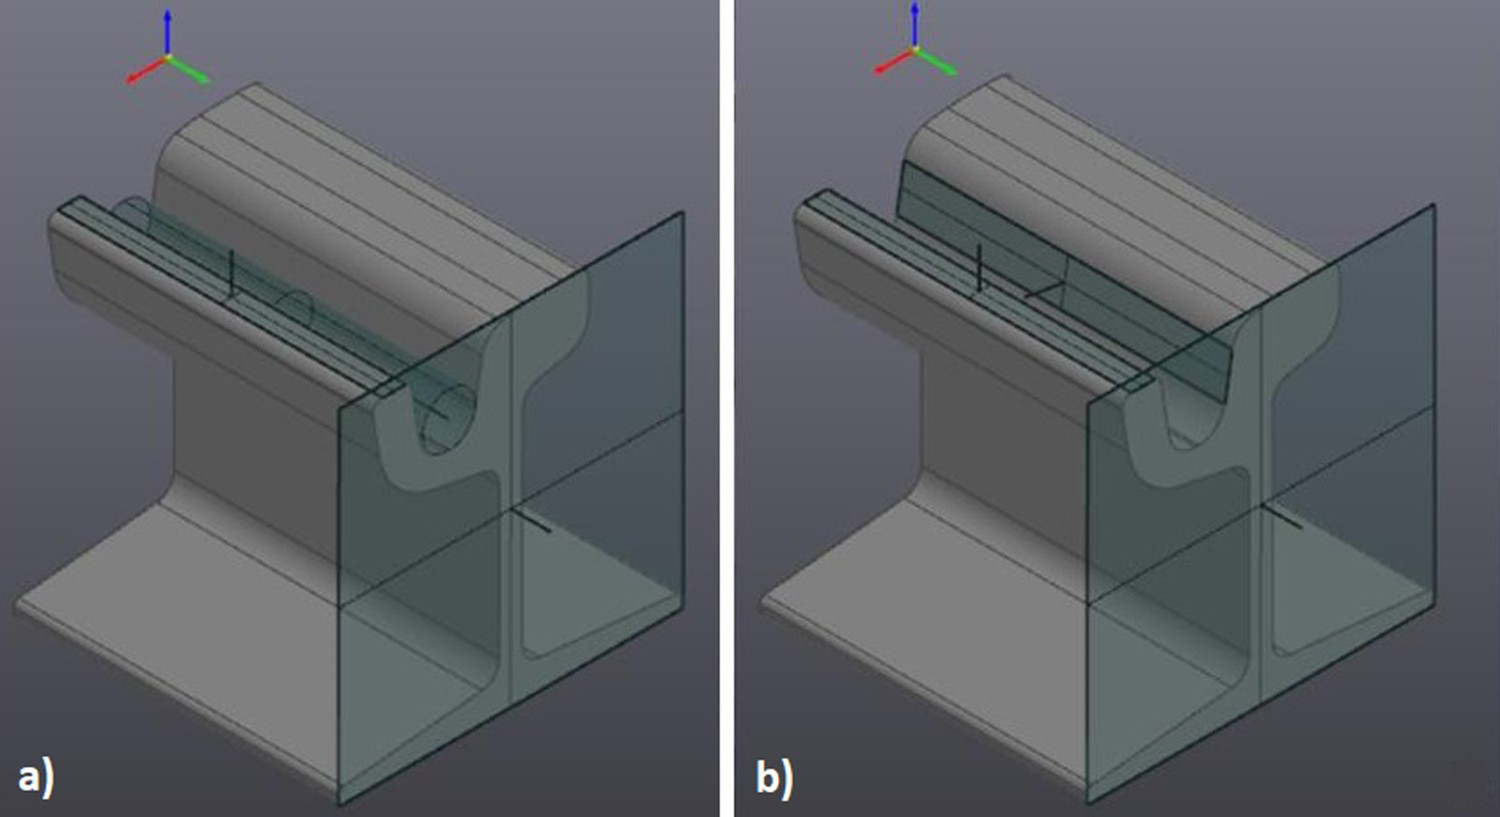
The worn rail portion (Figure 1(b)) was scanned by HandySCAN 700 using physical targets and a manual rotary table to speed up the real-time acquisition. The resulting mesh was postprocessed by VXmodel and optimized. As for the 2D wear mapping, the alignment was performed based on different criteria: (a), (b) and (c). Thus, the inspection results are three different wear maps, (Figure 6).
3D wear maps from laboratory tests: (a) alignment by counter rail plane, vertical plane and throat cylinder; (b) alignment by counter rail plane, vertical plane and flange plane; (c) alignment by best fit.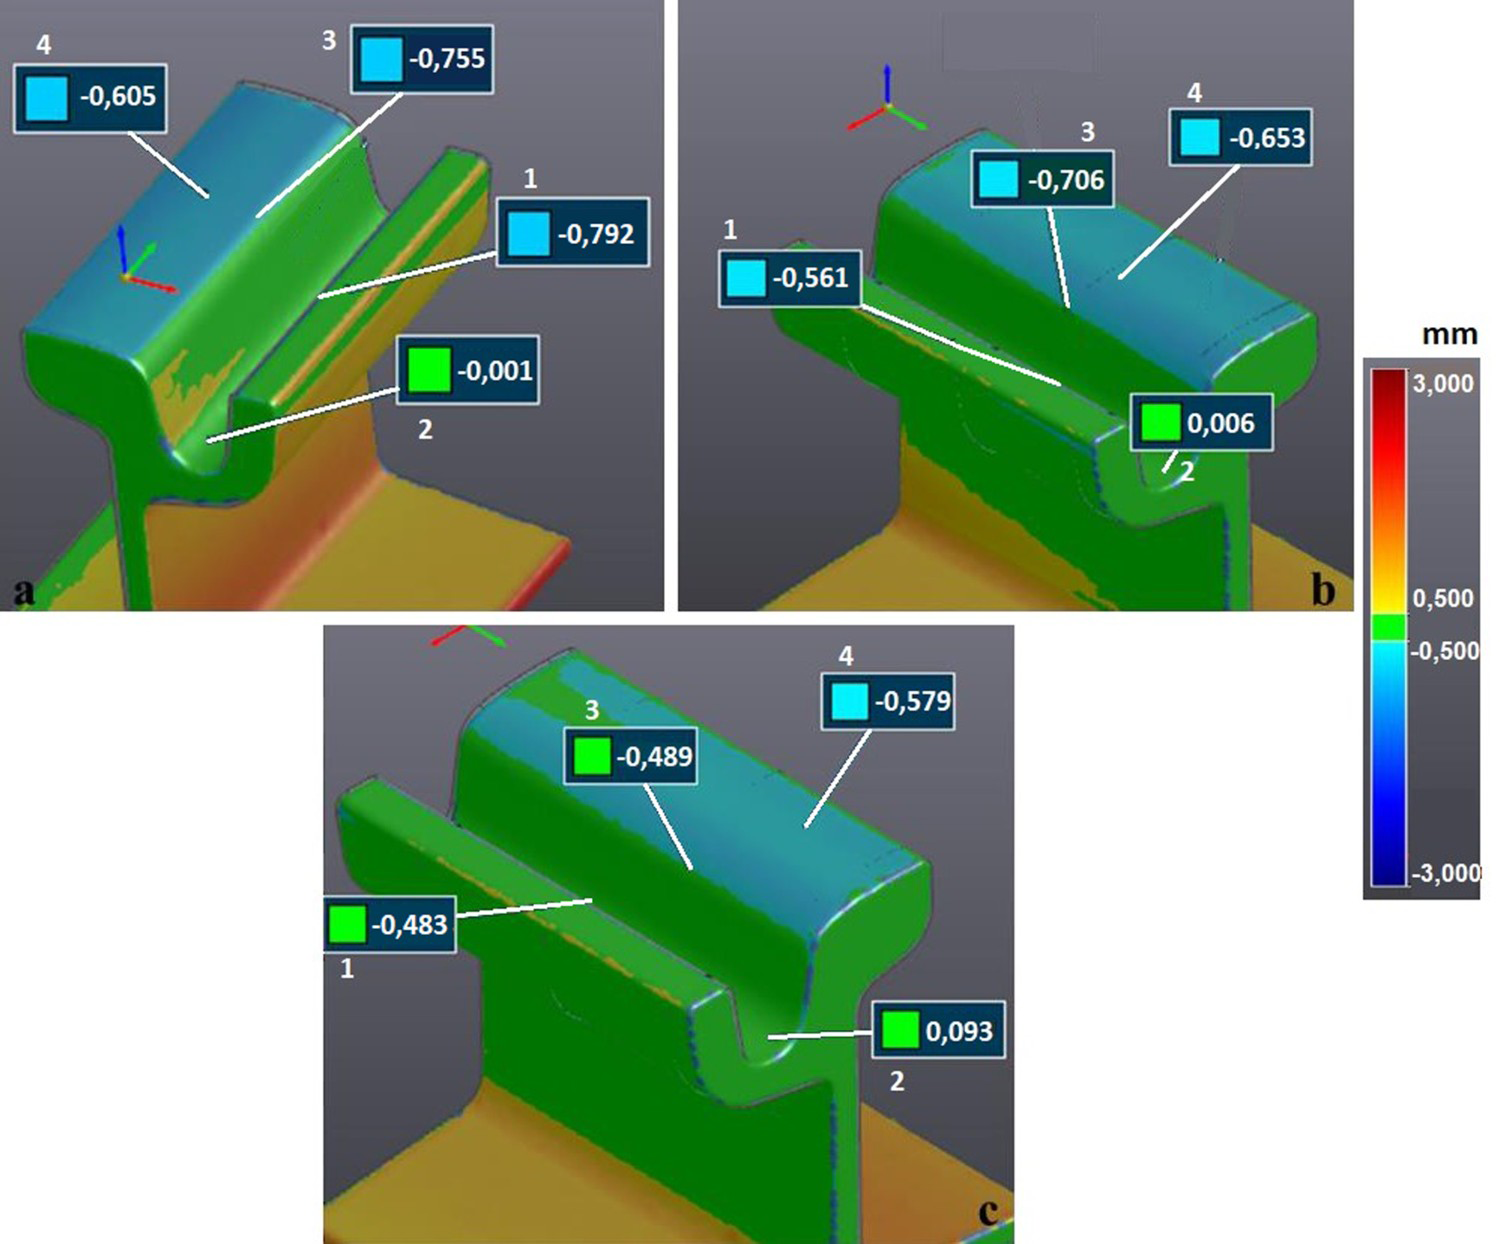
2D/3D Rail inspection results with alignment methods a, b, c.
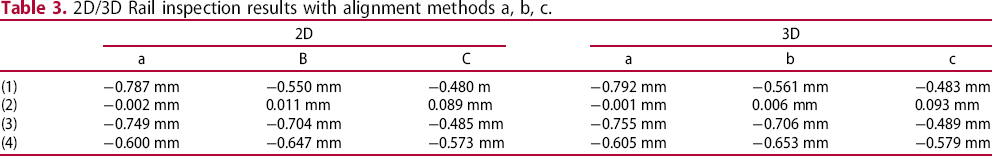
One can observe that the wear thicknesses, obtained by the two different measuring methods, are consistent with each other and the difference is lower than 11 μm. This is what the paper wanted firstly to demonstrate since, normally, contact measuring systems are more accurate than optical systems. This means that the new 3D digital method can be used as an effective and precautionary measurement technique. Concerning the three alignment procedures, it results that the method (a) is the closest to the real situation, since it shows a null value of wear in correspondence of the throat and of the plane of the counter rail during the WRI. In fact, with alignment (a), the wear starts from a null value and increases on the rolling thread and reaches a peak in the flange zone. It is again null in the throat and it has another peak in correspondence of the counter flange. Regarding method (b), it gives results close to method (a), but it underestimates the peak of wear on the flange and overestimates the wear thickness on the rolling thread. In fact, taking the flange plane as a reference surface, the wear corresponding to the throat does not result to be null as it should be. Generally, method (c) is not the best one to evaluate wear, because wear is a non-linear and non-uniform phenomenon. Best fit could give reasonable results only if wear was uniformly distributed. The post processing time for the laboratory tests, comprising the wear measurements took half an hour.
All these laboratory results demonstrated efficiency of the 3D wear evaluation method, compared to the 2D prior ones, for on-line measurement campaigns. In fact, 3D metrological optical digitizers can also measure wear volumes and distributions of tram-way rolling components, giving a more complete and global view of the wear phenomenon. 3D instruments are also very effective (more than 2D) for the study of phenomena such as corrugation, squat, etc., that are 3D aspects. The alignment method to be used for the on-line tests is method (a), according to the previous discussion.
Rails wear detection: On-line results
On-line tests were carried out on the Florence tramway line, on the track portion between Porta al Prato Leopolda and Santa Maria Novella (Figure 7), after six months from the last maintenance intervention and considering 300 trams a day at 14 km/h (according to the Florence tramway schedules). The shape of the studied track portion is rectilinear at the beginning and a clothoid in its final part with a curvature radius equal to 25 m. Its presence was due to the introduction of an exchange in that position during the tramway construction. Due to this shape, wear is severe, and trams must decelerate in that part of track. 2D measurements were carried out in correspondence of the curved track portion and 3D measurements were performed both on the rectilinear and curvilinear portions of the studied track (Figure 7).
On-line campaigns: location.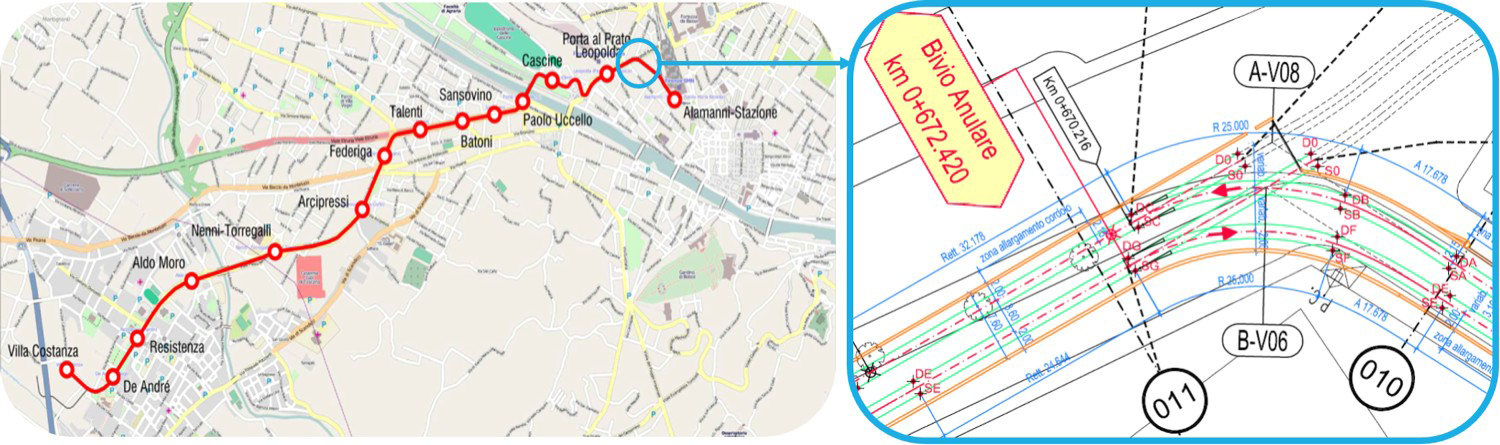
In the tramway of Florence, one of the current instruments used to check the health conditions of the rails is an electronic hand-pushed diagnostic trolley, capable of measuring the track gauge, cant, travelled distance and crooked continuously (Figure 8). It is an electronic and compact tool (1) with battery power, and able to record the geometry of the track. After the positioning of the lateral part of the trolley with the odometrical wheel (9) (in the Figure 8), the trolley is turned until the contact between the rollers and the inner part of the rail takes place. The unit (1) is compressed so that the contact rolls (8) of the fixed part get in contact with the inner side of the opposite rail. After 45 s the electronic part of the instrument stabilizes, and the unit is ready for the registrations and it is pushed by an arm (3). The handle (7), the wheel (6), the belt (4) and the clip (5) are visible in the figure. The odometrical wheel records the progress and rollers detect the track gauge.
Electronic hand-pushed diagnostic trolley.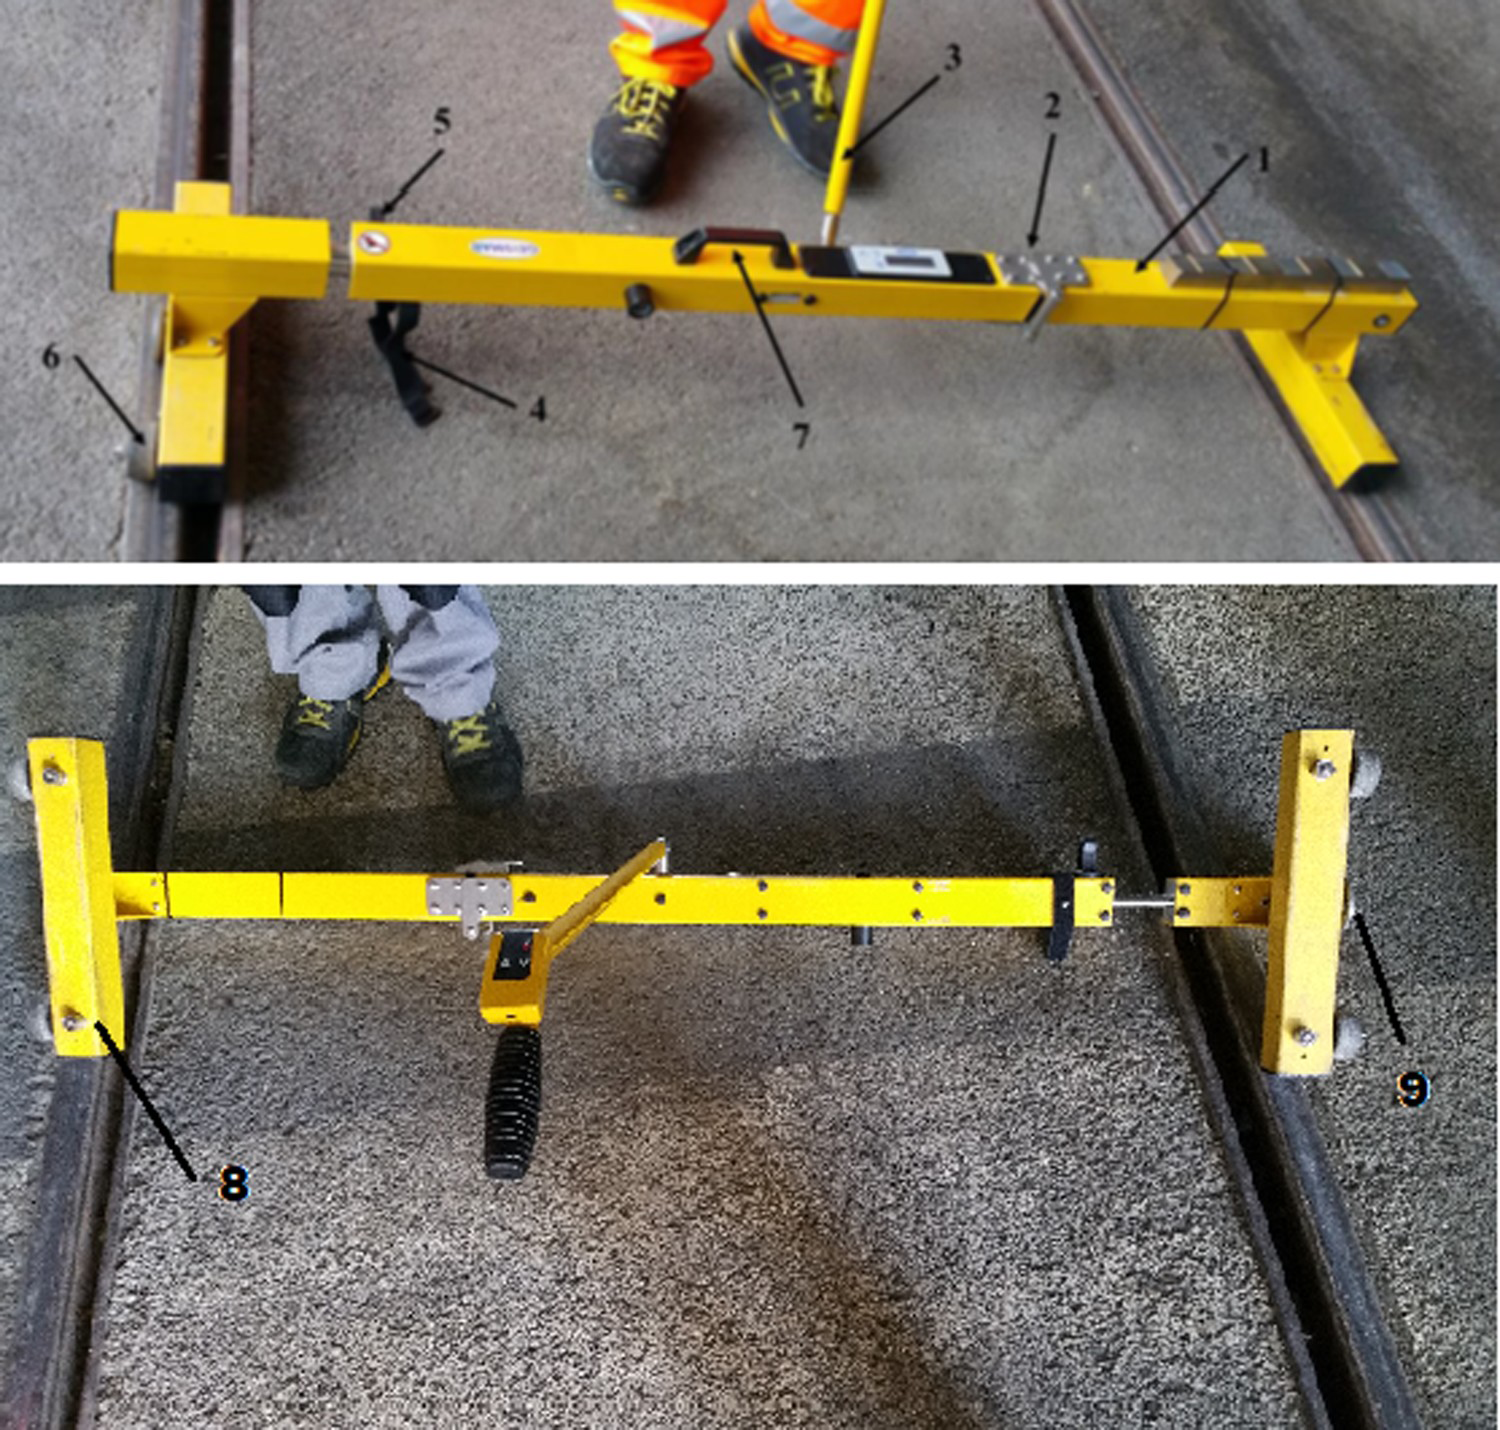
Results of the track gauge measurement in the curvilinear track portion every 150 mm of length are shown in Figure 9.
2D on-line results.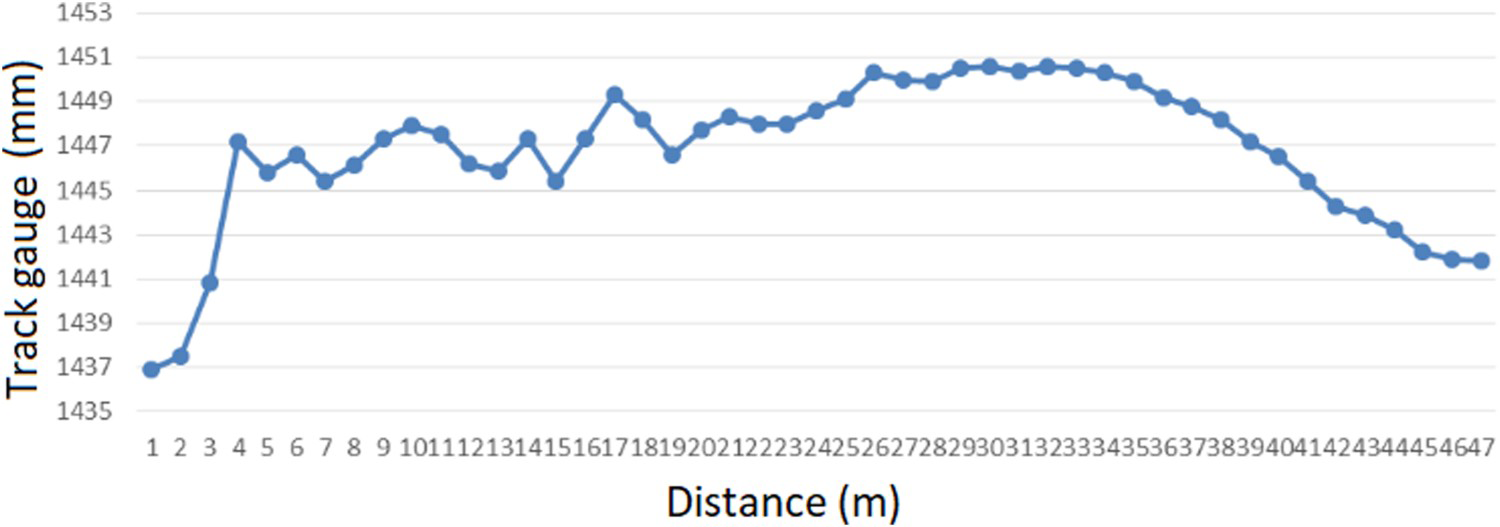
On-line 3D wear inspection
The 3D scanning phase was performed both over the rectilinear and the curvilinear track portions. Physical markers were applied on the rail surface, to generate the positioning model and to avoid misalignments (Figure 10). Real-time 3D collected data had a resolution of 0.1 mm. The on-line measurements took one hour. The post processing time for the on-line tests, comprising the wear measurements took one hour.
On-line 3D scanning campaigns.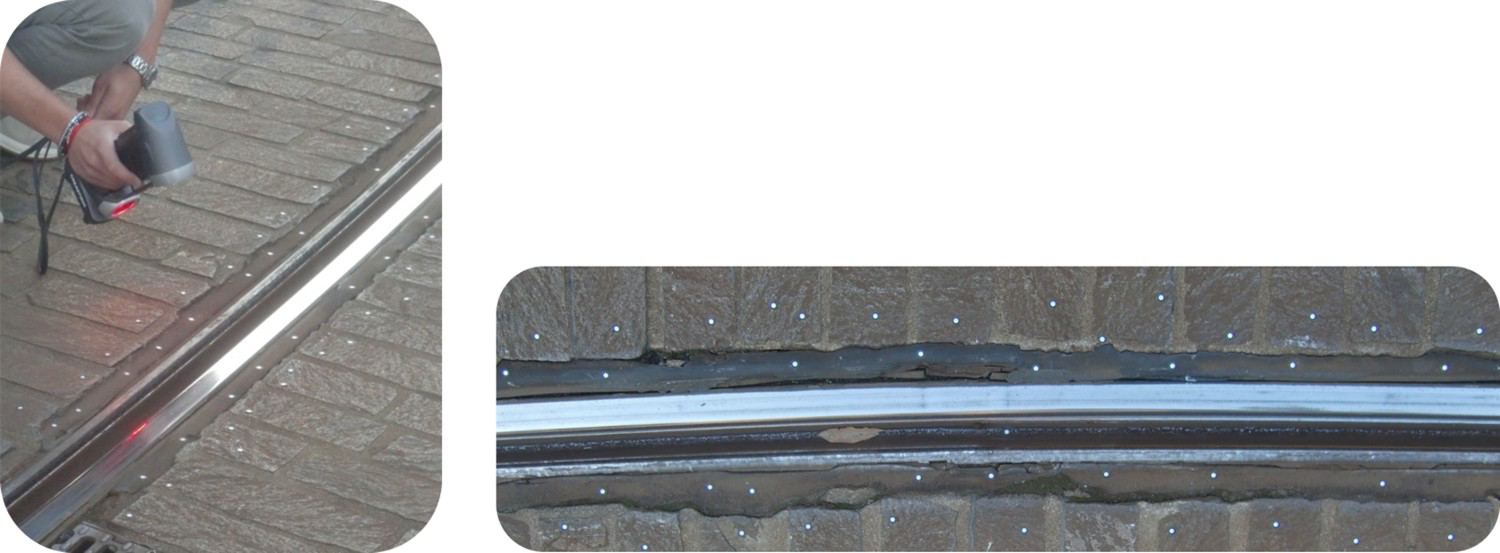
The results are expressed as 3D wear maps. Figure 11 shows the wear map corresponding to the rectilinear track portion and demonstrates that the flange and the counter rail are the parts mainly affected by wear, followed by the rolling thread, as expected.
3D wear map of the rectilinear portion.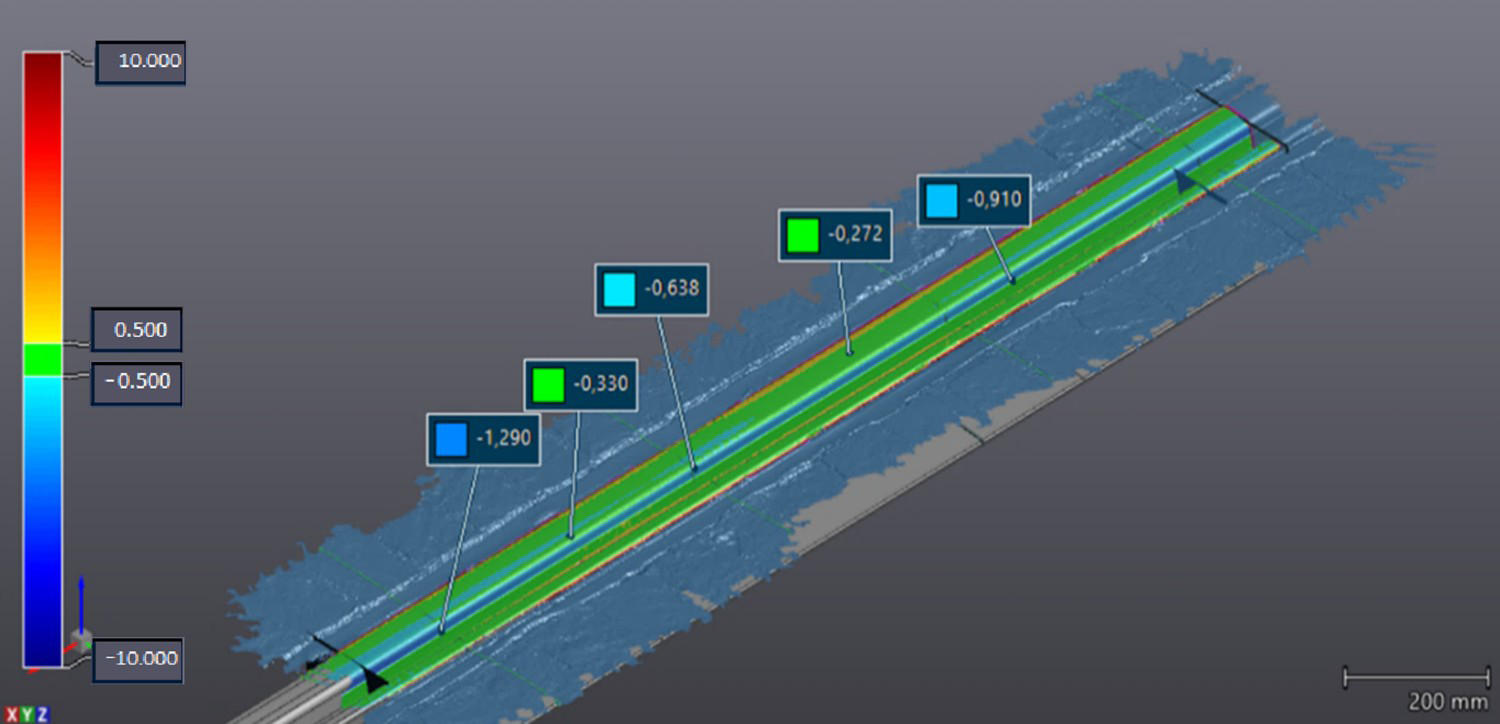
Figure 12 shows the wear map corresponding to the curvilinear portion consisting of a circumferential arc and a clothoid.
3D wear map of the curvilinear portion.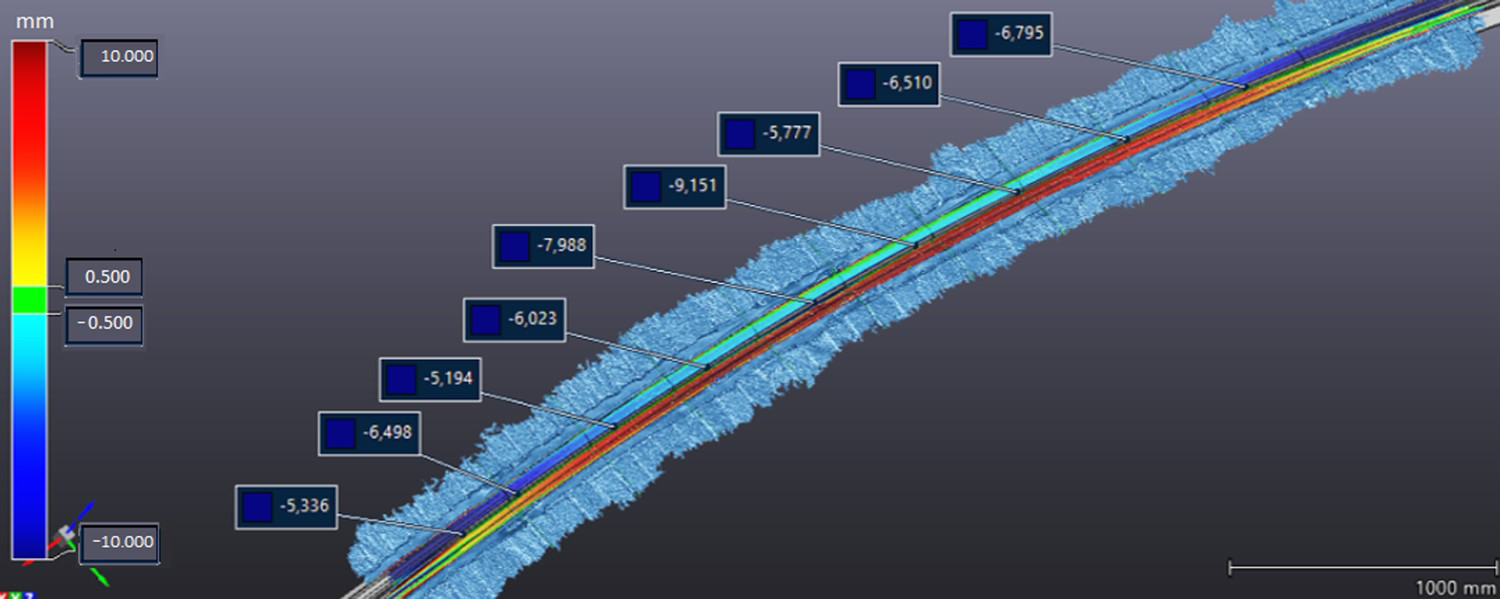
From those two 3D wear maps, 2D sections and wear values in correspondence of the flange, the rolling thread and the counter rail were extracted every 150 mm from the beginning, as the current instruments measure. The results of both the rectilinear and curvilinear portions are shown in Figure 13. The maximum wear depth over the rectilinear portion of the rail is about 1.5 mm, while over the curvilinear portion it is about 8.5 mm.
Wear depth every 150 mm: (a) over the rectilinear portion; (b) over the curvilinear portion.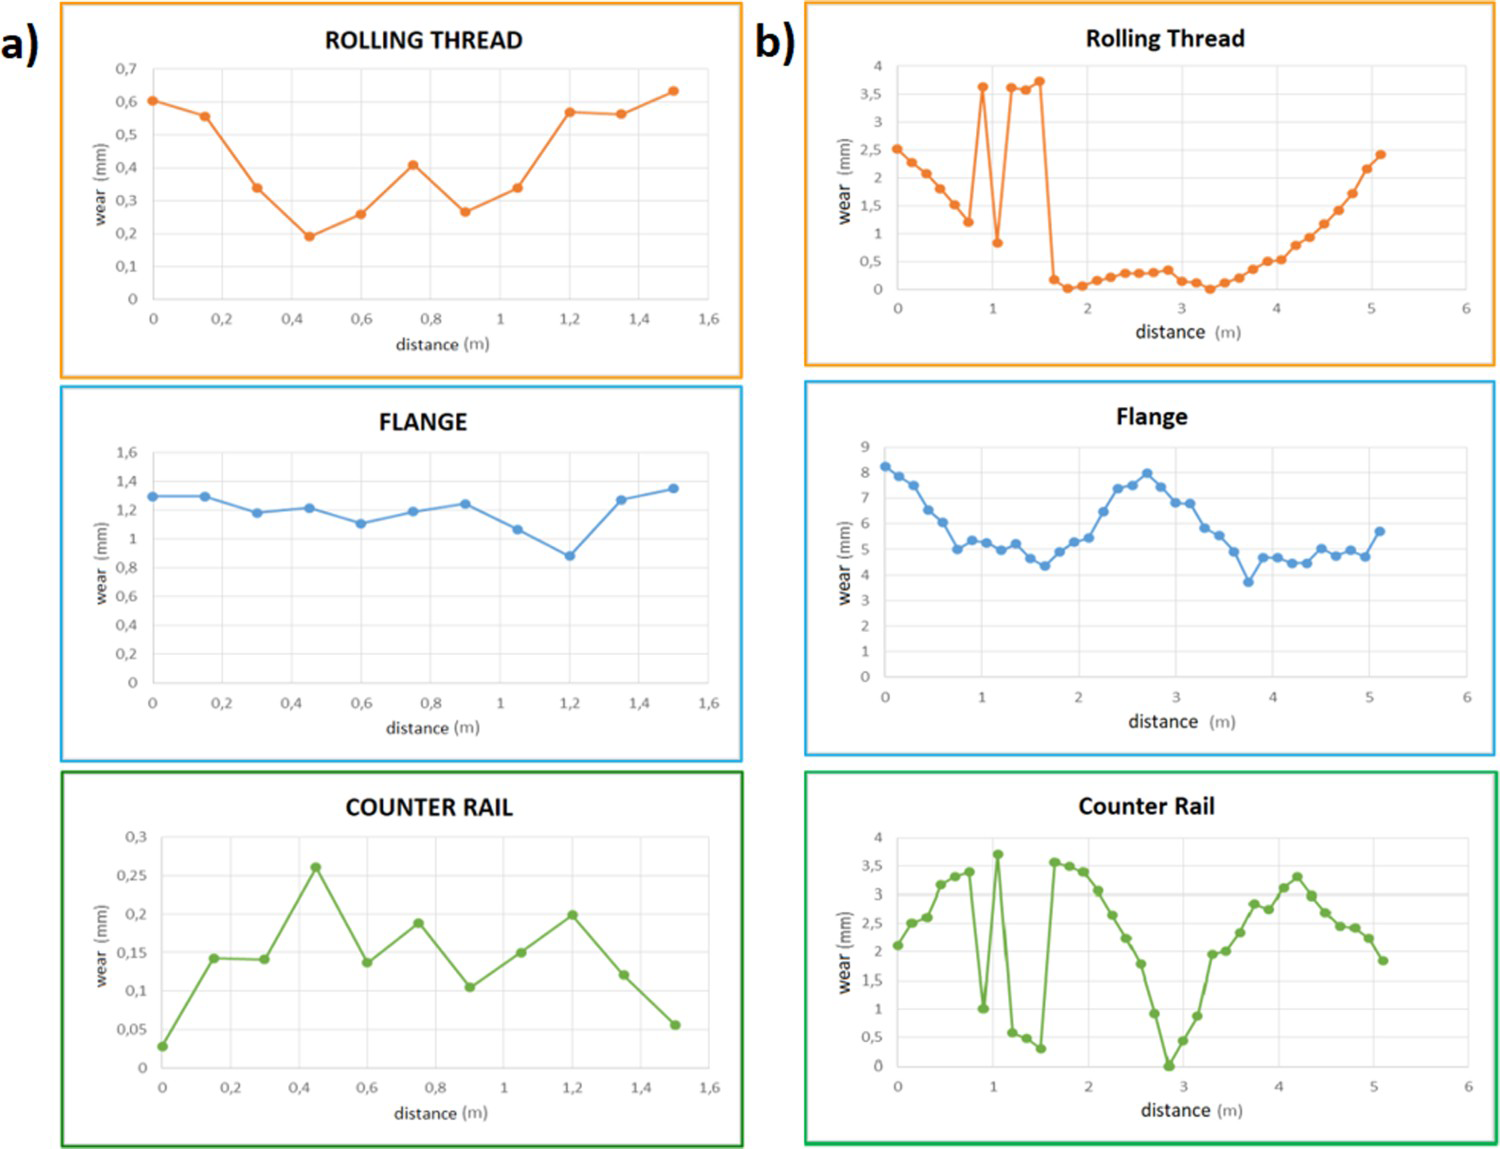
The comparison between 3D and 2D on-line results in term of lateral wear is shown in Figure 14.
On-line results comparison.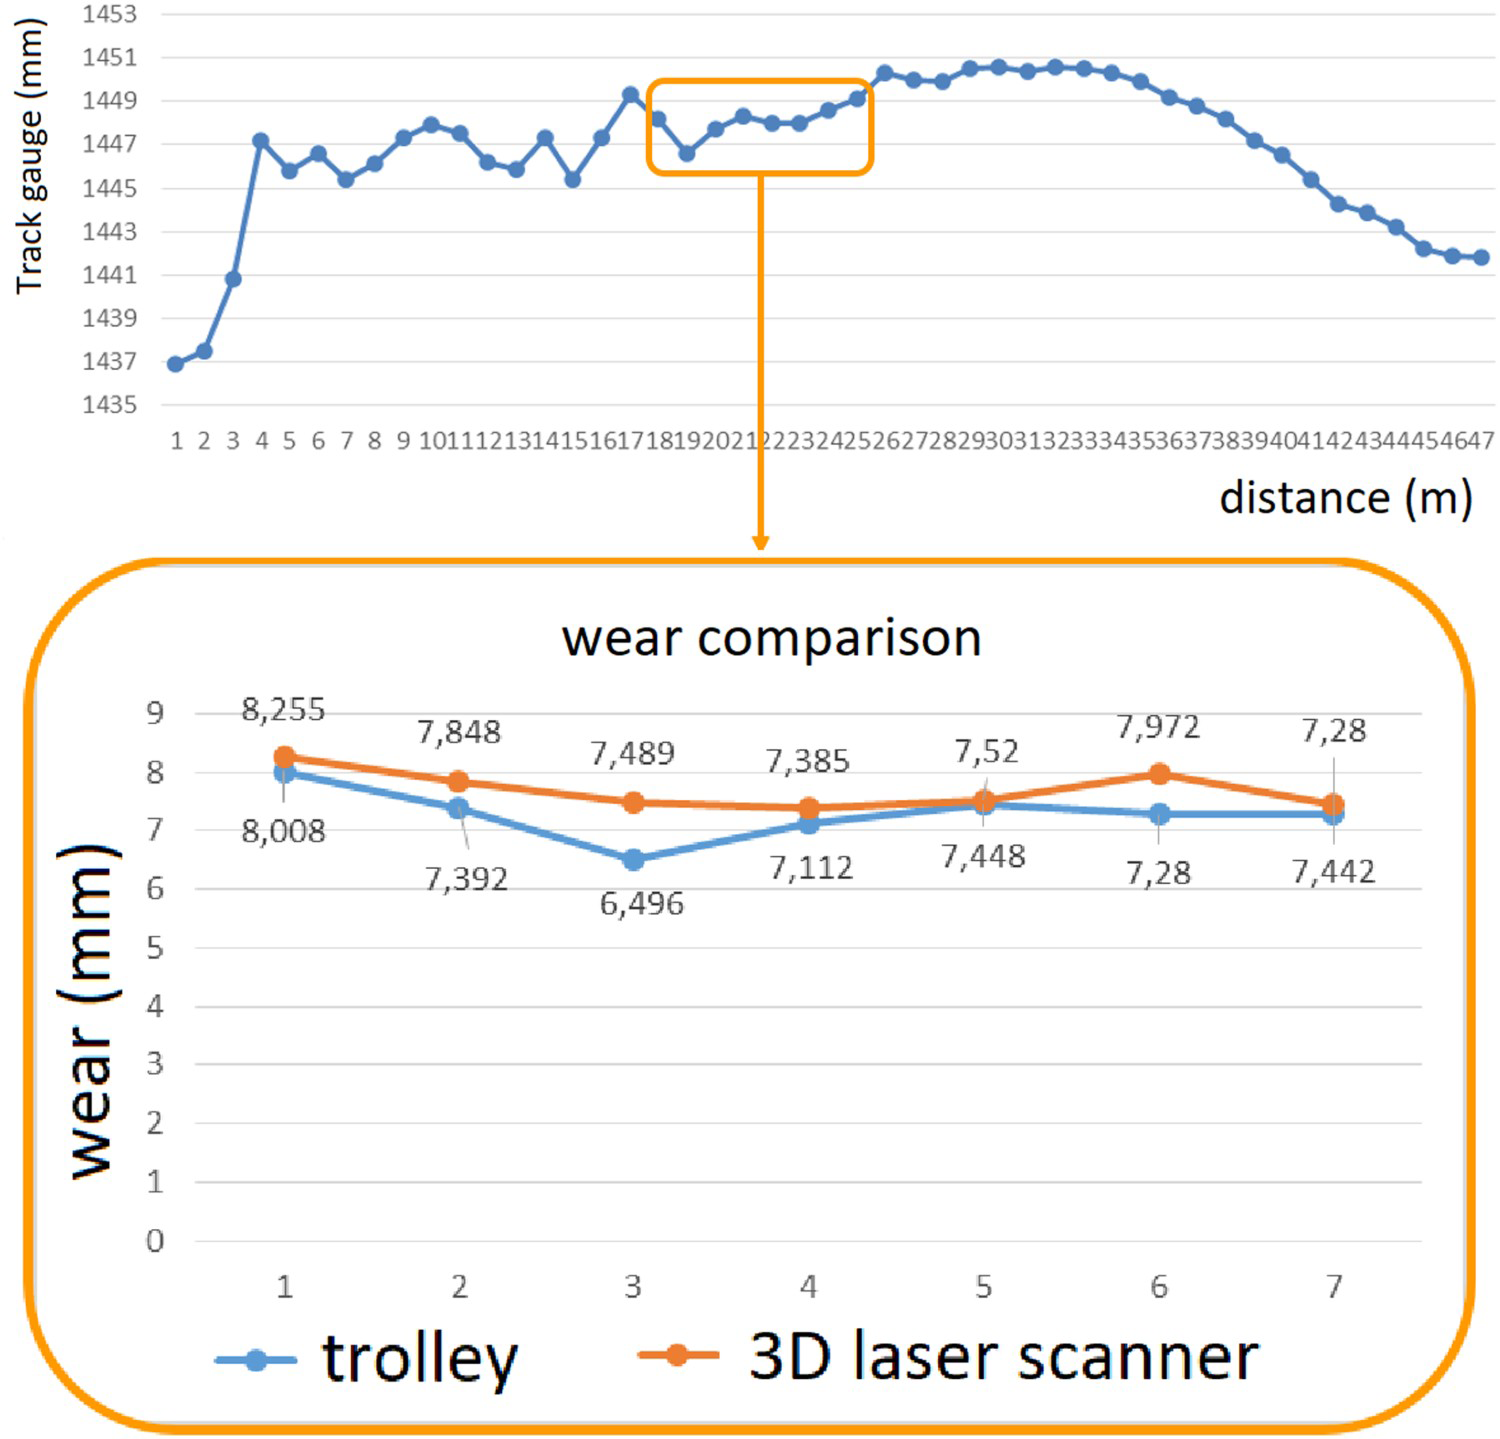
Discussion and conclusion
In this paper, a novel application of a non-contact portable 3D laser scanner to perform wear measurements of rail components is proposed. Laboratory tests carried out with 2D contact profilometers and the proposed 3D laser digitizer demonstrated the consistency of the 3D data with the 2D data. Different inspection procedures were compared and discussed, and the best wear mapping technique was assessed for wear evaluation on rail components. The 3D scanner does not require any surface preparation with the exception of the target positioning. Normally if the surface is too shiny the instrument has a manual or automatic shutter tool to compensate the laser reflection and acquire the surface without errors and noise. Polished surfaces do not affect the accuracy of the instrument, but they can affect the number of acquired data. If the surface is too shiny to be acquired even using the shutter tool, it can be covered by a powdering spray made of micro particles. In the case of this study, the application of the powdering spray was not necessary. The major issue of this technique is the direct sun light over the specimen surface. Thus, the measurement can be performed with every light condition, also dark at night-time, except with the direct light onto the surface. On-field experimental campaigns carried on the Florence tramway, performed by using both the 3D optical laser scanner and the 2D contact instrumented trolley, currently used on the considered tramway, demonstrated consistent and encouraging results, in view of the implementation of new strategies for the maintenance service of tramway lines. Those results can also be used as the basis for the validation of wear and contact models aimed at predicting health conditions and wear progress over time. The application of 3D instruments resulted to be more convenient as it provides a more complete and global view of the wear phenomenon and allows the assessment of all the wear parameters in a single acquisition. Further applications of these instruments include measurement of polygonal wear of tram wheels, squat and corrugation, which are typical 3D phenomena hard to be investigated through 2D instruments. The 3D measuring instruments could also be mounted on dedicated instrumented diagnostic trolleys and bogies and exploited for new, faster and more reliable maintenance services.
Footnotes
Acknowledgements
Authors acknowledge the Florence tramway management company, GEST S.p.A. and Eng. Zumbo for their support. Authors also acknowledge V-GER SRL for providing the 3D instrumentations and software for on-line campaigns.
Disclosure statement
No potential conflict of interest was reported by the authors.