
Abstract
Results of the recently approved machine control grading settings for Douglas fir in the Republic of Ireland and the UK have shown that the species can be graded to C18, and higher strength classes, and while there is a relatively high proportion of low strength timber, useful yields of grades up to C35 can be achieved. Large differences were found between subsamples, but it is believed that this is not a geographical difference between Ireland and the UK, but a feature of the representative sampling, and consequence of much more localized variation in timber quality.
Keywords
Introduction
Douglas fir (Pseudotsuga menziesii (Mirb.) Franco) is a conifer species native to western North America where it is valued for its growth rate and timber quality. It is widely used in continental Europe, but in the Republic of Ireland and the UK it is a minor home-grown timber species. It does, however, have current commercial value, and is familiar to the market as an imported timber. In both countries there is a growing interest in improving the commercialization of this species, driven by concerns about the reliance of the Irish and British forest industry on Sitka spruce, after the recent outbreaks of pests and diseases (particularly Phytophthora ramorum in larch), as well as the uncertainty about the effects of climate change on forestry. There are a total of 46,000 ha of Douglas fir planted in Great Britain (Forestry Commission 2017), 535 ha in Northern Ireland (NI Forest Service, May 2018, personal communication) and 10,380 ha in the Republic of Ireland (Forest Service 2018).
The species is currently used for structural timber, with the EN13556 marking code PSMN (CEN 2003) or within the imported North American species mix Douglas fir-larch (WPSM). Although not widely commercialized as a home-grown timber, it is well thought of by the forest and timber industry, and studies in the UK (Bawcombe 2012; Drewett 2015) concluded that the timber quality of Douglas fir can exceed that of British spruce.
Ireland has very similar climate conditions to the UK, and it is expected that the production and timber quality for Douglas fir are similar in both countries. Furthermore, cross-border trade of timber is currently common. UK Douglas fir can be visually graded to C18 and C14 strength classes (CEN 2012a), but visual grading rules for Irish-grown material are not available. Approval of machine control grading settings may help to boost the interest in growing Douglas fir, particularly if the yields equal or exceed those of Sitka spruce, because the industry will have the possibility of commercializing the material in greater volumes, for different strength classes and adjust the production to the requirement of the market. A route to larger markets, through larger sawmills, would also favour the planting of Douglas fir at a larger scale, and the diversification of the forest resource.
In a recent collaboration between the National University of Ireland Galway and Edinburgh Napier University led to the development of grading settings for Douglas fir from the Republic of Ireland and the United Kingdom. This paper summarizes the grading properties of the material studied and models the potential of two common types of grading machine (based on acoustics) for grading to different strength classes.
Material and methods
Sites, dimensions and number of pieces (n) sampled.
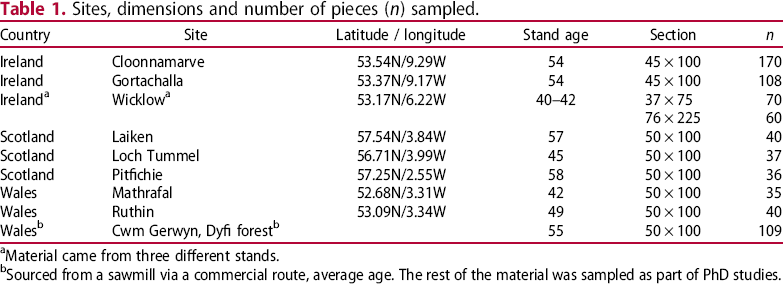
aMaterial came from three different stands.
bSourced from a sawmill via a commercial route, average age. The rest of the material was sampled as part of PhD studies.
The three key determining properties for grading: modulus of elasticity parallel to grain, bending strength and density were determined according to EN 408 (CEN 2012c) and EN 384 (CEN 2018), which entails four-point flexural/bending test of the timber with the critical defect located centrally. Measurements were adjusted, according to these standards, for moisture content and cross-section depth. The moisture content at time of testing was obtained from density samples and determined in accordance with EN 13183–1 (CEN 2002), and at time of grading from measurement of whole board masses at grading and testing and the moisture content at time of testing. Both local (Elocal) and global (Eglobal) modulus of elasticity were measured, but the standard method of adjusting Eglobal to modulus of elasticity parallel to grain (E0), adjusted to 12% reference moisture content, as given in EN 384 (CEN 2018) was found to be suitable:

The settings calculations were performed in line with EN 14081-2:2010 + A1 2012 (CEN 2012b), and the additional rules contained in the CEN TC124/WG2/TG1 decision list, to give grading thresholds for different strength class grading combinations (Ridley-Ellis and Gil-Moreno 2018a, 2018b, 2018c, 2018d).
For this paper, the machines were assumed to be in-line, rather than portable. In-line grading machines (fixed in place on a sawmill conveyor line) are able to use an adjustment factor on strength (CEN 2018), not applicable to portable grading machines (Ridley-Ellis et al. 2016), that usually allows higher grading yields when strength is the limiting property. In order to estimate the likely range of yields in practice, the best and the worst of the four subsamples, and the sampling as whole, were modelled assuming a normal distribution of the IP values, and the yields calculated against the grading thresholds from the overall calculation. Finally, results are compared with studies on Sitka spruce in Ireland and the UK.
Results and discussion
The characteristic value for modulus of elasticity (mean) per subsample ranged from about 8–13 kN/mm2, with an overall mean of 11 kN/mm2. The characteristic value for bending strength and density (5th percentile) ranged from 12 to 29 N/mm2 (15 N/mm2 overall) and from about 360–480 kg/m3 (395 kg/m3 overall), respectively. The wide range of values is likely the result of microsite factors and differences in forest management. The results, however, are not dissimilar from data reported for Douglas fir from the UK by other researchers (Bawcombe 2012), or data collected in other tests by BRE within GradeWood project (unpublished). The variation is a feature of the representative sampling, rather than a flaw in it, but it must be understood that it cannot be used to draw conclusions about timber quality differences between Ireland and the UK, or within the countries of the UK. The sampling is only representative of the growth area as a whole.
The machine grading of conifers in both Ireland and the UK is normally limited by bending modulus of elasticity (Moore et al. 2013; Drewett 2015; Gil-Moreno et al. 2016), but in this study the grading of Douglas fir was, in general, limited by bending strength. That is, within a strength class the characteristic values of density and bending modulus of elasticity were rarely close to the grade requirements, compared to bending strength. However, this was not an obstacle for the whole population to achieve a C18 yield above 99% for the optimum grading with an in-line ‘perfect’ grading machine (grading using the results from the destructive tests). For brevity the optimum grading of a single strength class with near 100% yield will be referred to here by the non-standard term ‘basic grade’.
In Europe, Viguier et al. (2017) reported characteristic values of 10.8 kN/mm2, 19.7 N/mm2 and 426 kg/m3 for Douglas fir in France, limited by bending strength to a basic grade of C22. The same study reported a yield of 95% for the optimum of C24/Reject (that is, 5% would not achieve the C24 quality), and 70% / 29% for C30/C18/Reject (that is, within the combination, 1% of the timber would not grade as any of the two strength classes).
The settings developed for Douglas fir in Ireland and the UK did not cover those particular strength class combinations as they were not efficient for this resource, but for C24/C14/Reject (slightly more demanding than the C24 single grade) the optimum grading achieved a yield of 89% / 9%, that is, only 2% reject. The combinations TR26/C16/Reject (TR26 is a UK grade for trussed rafters) and C30/C16/Reject achieved the same yields, 72% / 23%, and for C35/C16/Reject, it was 51% / 48%, giving a similar level of rejects to those from the C30/C18/Reject reported by Viguier.
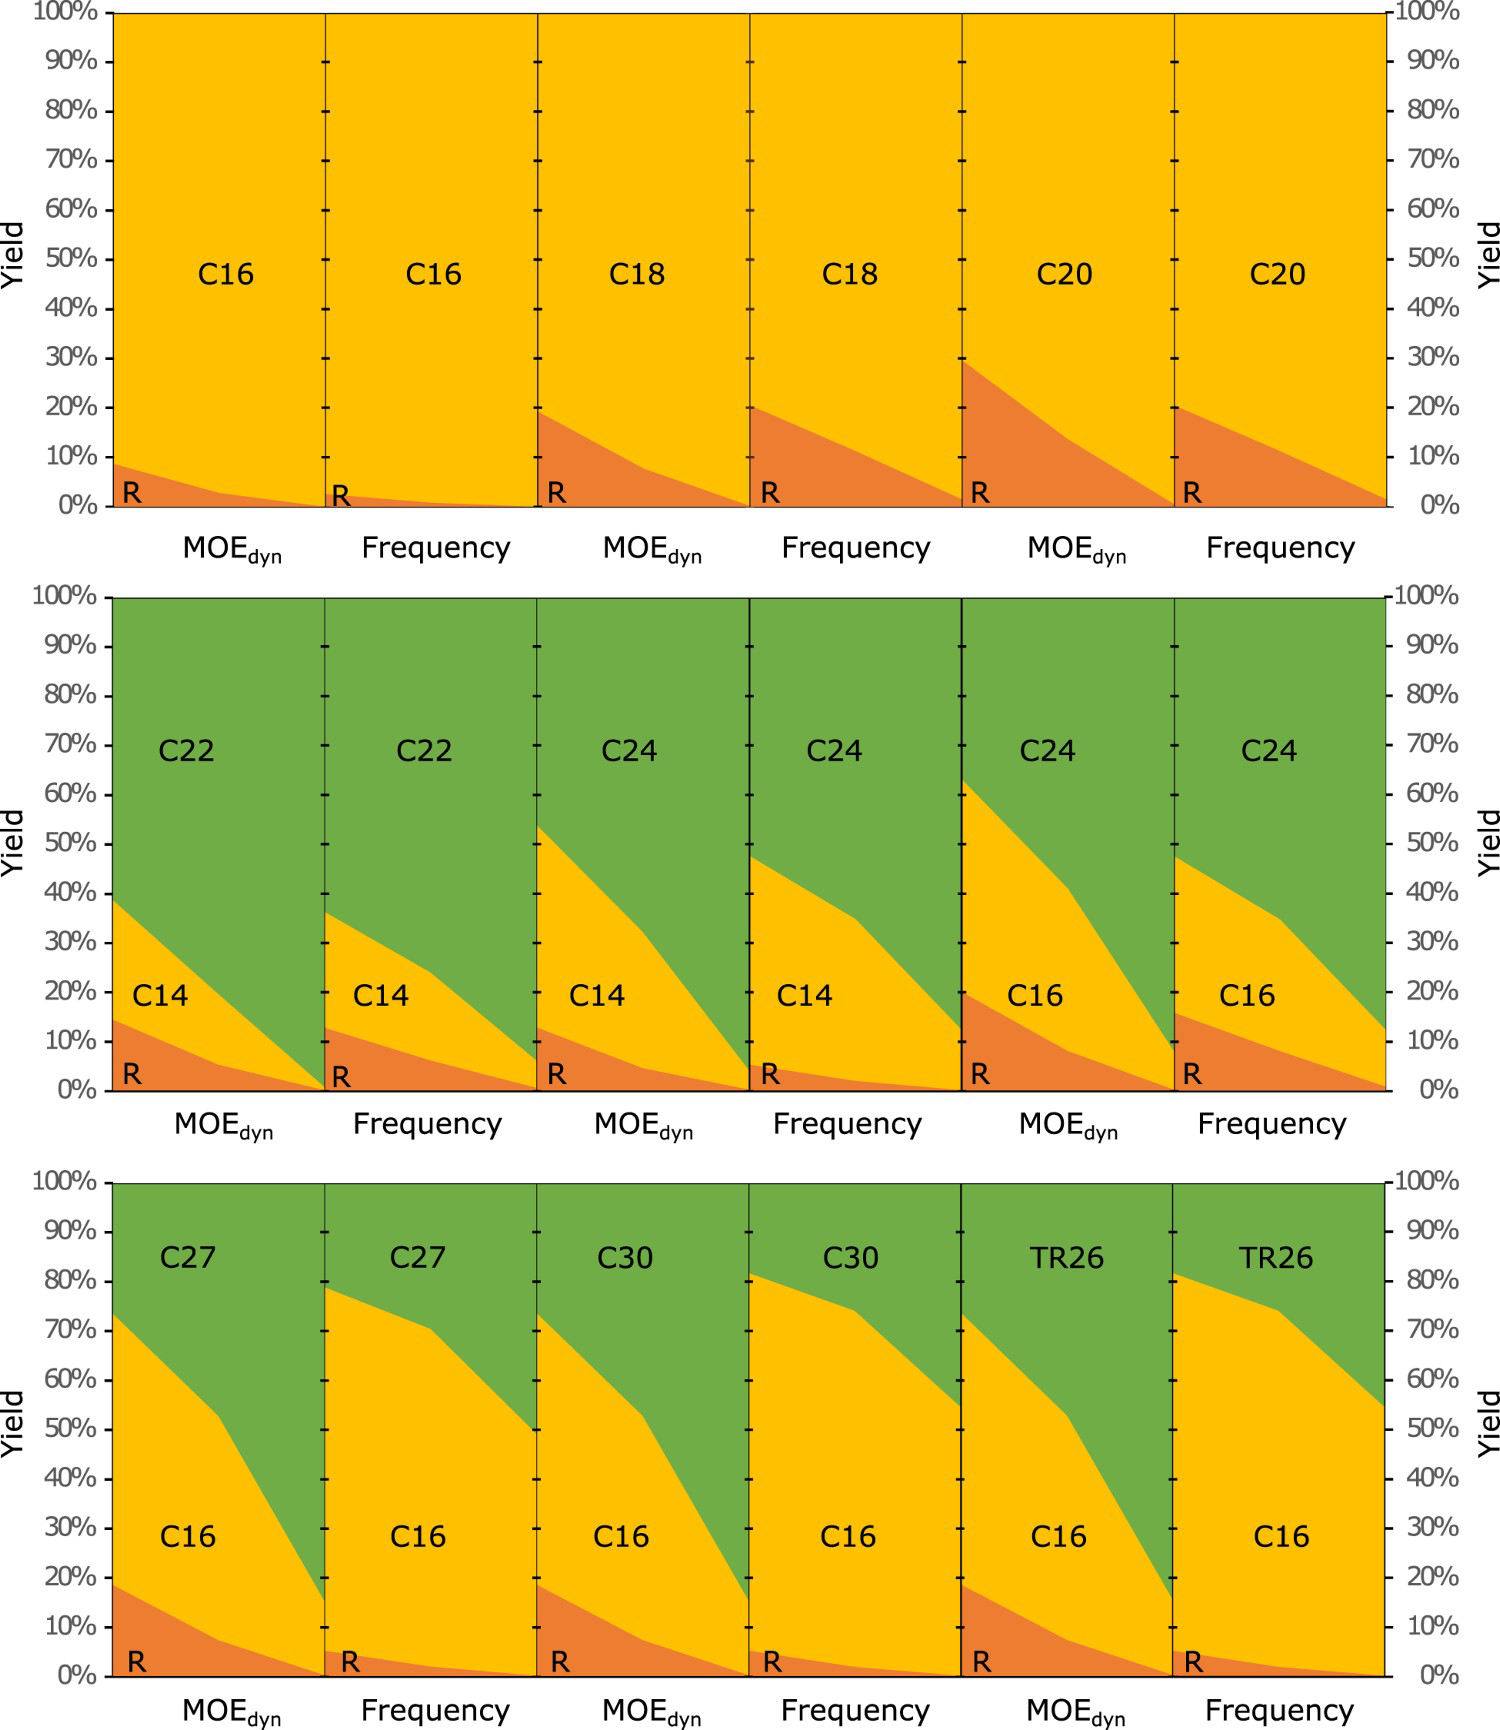
Machine yields however will be lower due to the lack of a perfect correlation between the IP measured, and the grade determining properties measured in the laboratory, and because of variation in timber from shift to shift. Figure 1 presents, for the overall population, the relationships and r-squared (R2) between the measured grade determining properties and the IP for the frequency-only machine. The relationships with the IP for the frequency and density machine were stronger (R2 = .79 for bending stiffness, 0.65 for bending strength and 0.66 for density), but in this study density was the least limiting grading property, making the improvement in the relationship having a larger impact in the higher strength classes. This can be observed in Figure 2, that presents the potential grading of Douglas fir based on the approved machine grading reports. The graphs show from left to right the variation from the lowest expected yields (given by the lowest quality subsample) to the mean and highest yields. Grading settings and yields are influenced by several factors, some of which are peculiar to the sampling on which they are based. It should also be understood that grading settings can be optimized to favour either high yields of the highest grade, or higher yield overall. For these settings higher yield overall was the goal, which explains that in Figure 2, as the subsample quality improves, the yield of the higher strength class increases and the lower strength class decrease, reducing at the same time the overall rejects. For these reasons the yield figures, and comparison between the two types of machine, should be considered indicative as a whole, rather than for any particular grade combination. So, in general the addition of density measurement was somewhat useful in improving the grading yield, but only for the higher strength classes.
Relationships between the IP for the frequency-only machine and the measured grade determining properties. For guidance, the y-axis shows (in a smaller font) the required characteristic values (mean for stiffness and 5th percentile for strength and density) for some of the most common strength classes. Potential range of yields (%) of Douglas fir in Ireland and the UK for machines measuring the dynamic modulus of elasticity (MOEdyn) and the natural frequency of vibration solely (Frequency). The left-hand side of each plot corresponds to the yield for the best subsample tested, the right corresponds to the worst, and the centre corresponds to the sampling as whole. These are intended to represent the range of yields that might be experienced for any particular sawmill and shift. The combinations TR26/C16 and C30/C16 achieved the same yields.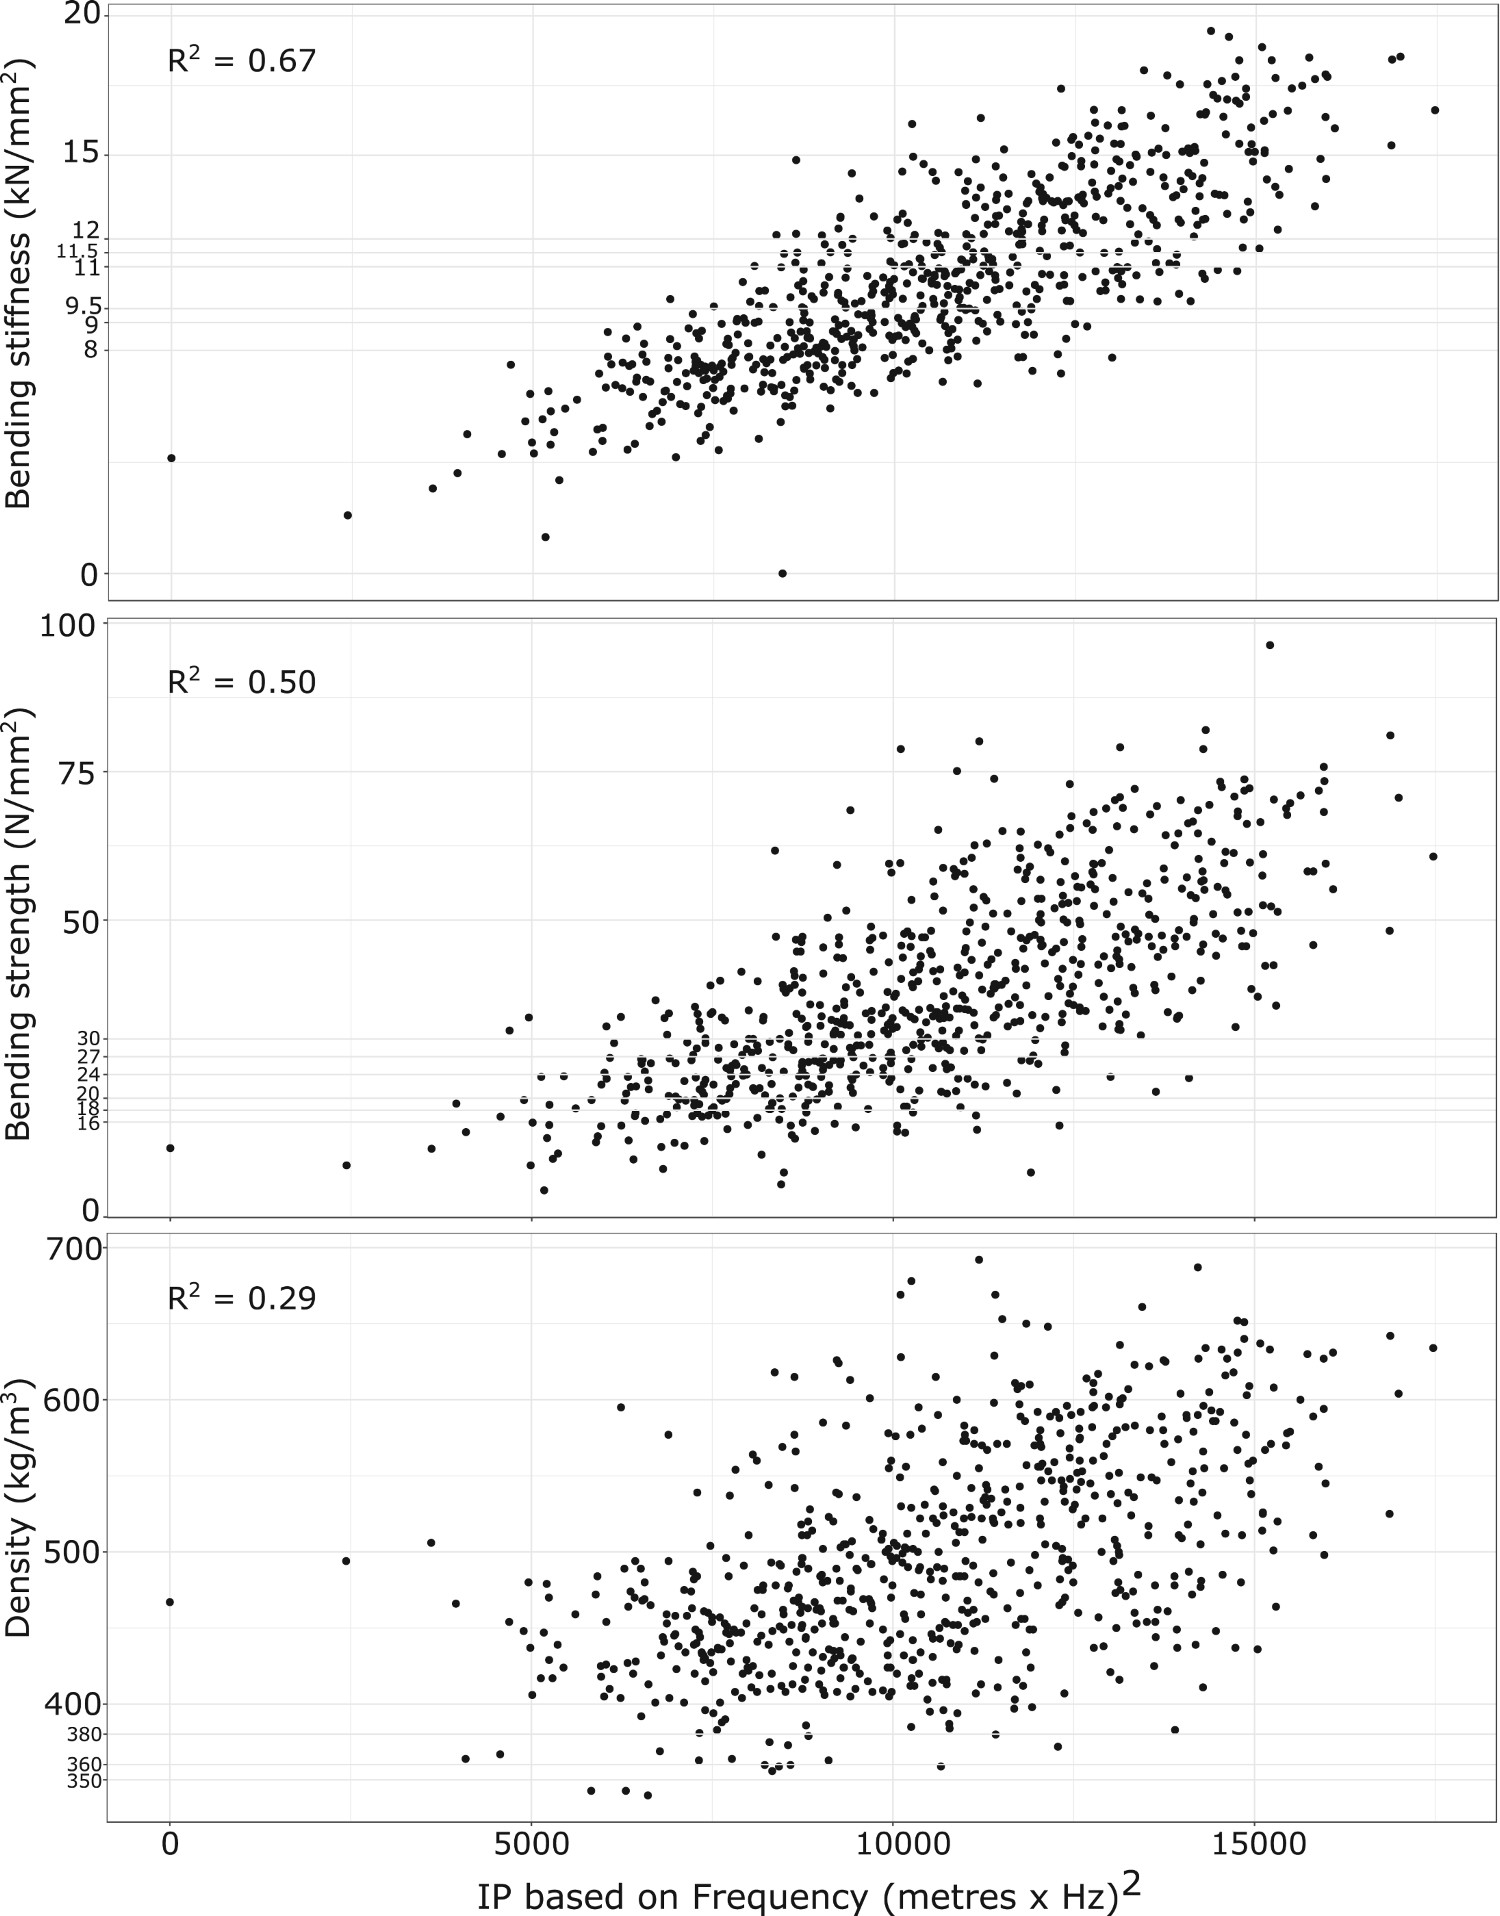
Compared to British spruce (WPCS), Moore et al. (2013) reported for the UK a yield of 92% for C18 optimum grading (slightly lower than Douglas fir), and 29% / 66% for the C24/C16/Reject combination (Douglas fir achieved 89% / 6%). Ridley-Ellis et al. (2018) reported for the C24/C16/Reject combination of British spruce in the Republic of Ireland and the UK an optimum grading of 42% / 39%, and using a portable grading machine based on MOEdyn yields of 24% / 70%. In Ireland, there is not much information published on the yields of Sitka spruce. Using bending type machines (no longer used for grading in Ireland), and the standards and knowledge at that time, Picardo (2000) obtained yields up to 95% of C16, 90% of C18 and 66% / 27% for C24/C16/Reject combination.
Conclusion
This paper has shown that Douglas fir grown in Ireland and the UK can produce higher yields of graded timber than Sitka spruce and comparable to those in France for higher strength classes. Bending strength was the limiting property for grading in the majority of combinations. This could be related to the size of knots, and largely influenced by the silviculture. Further research to confirm this is recommended, particularly under different silvicultural regimes that may lead to a reduction in the size of knots and contribute to increasing the bending strength. In addition to the machine used, yields will vary depending on the quality of the population sampled, so the reported values should only be taken as a reference.
Footnotes
Acknowledgements
This work was developed within the WoodProps programme funded by the Forest Sector Development Division of the Department of Agriculture, Food and the Marine, Ireland. The authors are also grateful to Coillte for the material supplied. Particular thanks are extended to Tom Drewett and Luka Krajnc for the use of data from their PhD theses.
Disclosure statement
No potential conflict of interest was reported by the authors.