
Abstract
The uniformity of final moisture content within a drying timber batch is crucial. Lack of such uniformity leads to producing large percentages of over-dried and under-dried timber, resulting in significant quality degradation and value downgrade. This study aims to predict kiln-dried timber moisture content using its initial moisture value, timber weight, and density. The distribution of wood properties in different drying runs was analyzed, and the difference in their means was statistically assessed. Various machine learning models were used for moisture prediction. The performance of the group method of data handling network was compared with the adaptive neuro-fuzzy inference system, support vector regression, decision tree, and random forest method. The best performance was achieved using random forest with the initial moisture content and weight of the wood as input parameters. Finally, the models’ performances were compared and practical recommendations for employing the adopted methodology in industrial settings were provided.
Keywords
Introduction
Kiln drying plays a pivotal role in wood manufacturing and improving the physicomechanical properties of dried timbers (Perre 2007). Kiln drying aims to reduce the initial moisture (Mi) to target moisture (Mt), which is acceptable for the ultimate usage and extended service life (Cabardo 2007; Salas and Moya 2014). Variation in the final moisture (Mf) between kiln-dried timbers results in over-dried and under-dried timbers and consequently downgraded final products. Thus, grasping the parameters involved in predicting the Mf and reducing its variation after kiln drying is paramount (Elustondo and Oliveira 2009). Minimizing Mf variation has long been a critical challenge, especially for the species with very high green moisture (Mg) variation, such as Pacific Coast hemlock (PCH), spruce-pine-fir, and poplar (Cai and Oliveira 2004; Rahimi et al. 2011; Shahverdi et al. 2017).
The Mf significantly impacts the quality of the timber and the engineered wood products made from it. The moisture variation affects the elastic mechanical properties of wood, but it also influences the viscoelastic properties (Fathi et al. 2020a). Other than its impact on the mechanical properties, moisture content is an important parameter when evaluating the wood durability (Ayanleye et al. 2022). Considering the significance of the Mf prediction in the quality of dried timbers, researchers have attempted to estimate and model Mf at different Mt. For this purpose, researchers used probabilistic analysis and numerical stochastic models to simulate M dispersion during and after kiln drying (Cronin et al. 2002, 2003; Elustondo and Avramidis 2002). Elustondo and Avramidis (2005) used three timber drying simulation approaches, namely Cronin's, Monte Carlo, and a continuous probability density (CPD). They claimed that CPD applies to iterative types of calculations such as process optimization or data fitting. Moreover, Watanabe et al. (2016) used the bootstrap method for probabilistic evaluation of Mf in kiln drying timbers. They concluded that the M data did not conform to any specific classical probability distribution such as Normal, Log-Normal, Weibull, or Gamma, which emphasized the requirement for nonparametric statistics. More recently, Rahimi, Avramidis et al. (2021) applied polynomial models to predict the Mf variation of the kiln-dried timbers and proposed a closed formula based on the Mi indices.
Classic methods are incapable of predicting and characterizing M and its variation in wood drying, mainly due to the natural complexity of wood and the variation in the data collected during the wood drying process. However, artificial neural networks (ANNs) are powerful and robust tools for self-organizing adjustment, adaptive learning, and fault-tolerant anti-noise dealing with nonlinear and complex processes (Sablani et al. 2005; Fu et al. 2017). For these reasons, researchers used ANN methods for characterizing and categorizing M and other drying parameters (Wu and Avramidis 2006; Ceylan 2008). Watanabe et al. (2013, 2014) used ANN to predict Mf and surface stresses of kiln-dried sugi (Cryptomeria japonica). Researchers applied ANNs to sort green PCH timbers with near-infrared spectroscopy (NIRS) and utilized networks for online species identification of PCH based on NIRS and chemometrics (Zhou et al. 2020). In addition, machine learning (ML) methods have been applied to kiln-dried PCH to predict Mf and categorize dried timbers accordingly (Rahimi, Nasir et al. 2021; Rahimi and Avramidis 2022).
The most commonly employed ANN in the literature is the multilayer perceptron (MLP) model, widely used for different regression and classification tasks. While it has been called a universal approximator (Hornik et al. 1989), it has certain drawbacks. The black-box nature of the MLP ANN makes it challenging to comprehend the causality of events in the model (Park and Lek 2016). Also, the convergence of the system and its performance may highly depend on the network architecture and the choice of training algorithm (Nasir and Cool 2020a). Thus, training an optimized model may require a trial and error task. Finally, the model's performance is influenced by the complexity of the dataset.
Rahimi and Avramidis (2022) applied different ANN methods, namely MLP, radial basis function (RBF), and group method of data handling (GMDH), to estimate the Mf of the kiln-dried PCH. Predictive models consisted of four inputs: Mt, Mi, weight (wi), and density (ρb). Research findings revealed that GMDH yielded the best performance. However, other ML approaches have not yet been applied to predicting Mf. This study is a continuation of Rahimi and Avramidis (2022), further optimizing Mf predictive models in timber kiln drying. It compares the results of the best ANN model (i.e. GMDH) to those of other ML predictive models, namely adaptive neuro-fuzzy inference system (ANFIS), support vector regression (SVR), decision tree, and random forests, to find the optimal ML model for accurate prediction of moisture in kiln-dried PCH.
Materials and methods
Specimen preparation and drying experiment
A total of 1152 freshly cut green PCH (also known as hem-fir) timbers (50 mm × 100 mm × 2.44 m) were procured, and 2304 kiln specimens (50 mm × 100 mm × 1.25 m) and cookies (50 mm × 100 mm × 30 mm) were cut out of the timbers according to the cutting protocol represented in the former study (Rahimi and Avramidis 2022). The oven-dry weight method measured the two cookies’ average Mg and ρb. In the next step, all green specimens were sorted and equally divided into six groups. These groups were formed by combining two Mg variations (high and low) and three setpoints (high, medium, and low). Three setpoints of 21% (group 1 and 2), 16% (group 3 and 4), and 11% (group 5 and 6) were considered as the high, medium, and low Mt levels. The odd groups (1, 3, and 5) had high Mi variation, while even groups (2, 4, and 6) had low Mi variation. The clustering and categorization of the kiln specimens were elaborated on and represented in the previous research (Rahimi, Nasir et al. 2021).
Each drying run contained 384 kiln specimens divided into two timber stacks. Drying runs were carried out in the FPInnovations’ research kiln. All six batches were dried under an identical schedule slightly different from the modified typical industrial schedule for PCH (Shahverdi et al. 2017). The drying schedule was tabulated, and drying trends were represented in former research (Rahimi, Avramidis et al. 2021; Rahimi, Nasir et al. 2021; Rahimi and Avramidis 2022).
Statistical analysis
Statistical analysis was accomplished on wood attributes, namely ρb, wi, Mi, and Mf, to evaluate the measures of central tendency (mean and median) and variability (standard deviation, coefficient of variation, and range). Consequently, the mean values of wood attributes (ρb, wi, Mi, and Mf) were analyzed and compared between six drying batches using analysis of variance (ANOVA) at a significance level of 0.95% (confidence level of 0.05%). In case of significant difference for each wood property in the ANOVA test, Duncan tests were implemented to elaborate on the differences in mean values between different drying batches.
Machine learning approaches
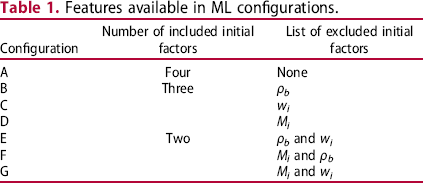
 , are most likely the key factors (Perre 2007). Several parameters, such as wood species, region, presence of juvenile and/or reaction wood, etc., affect the density (ρM) of the wood (Siau 1995). Hence, it potentially has a remarkable effect on the drying rate, and consequently, Mf. Additionally, wi is correlated with Mi of timbers, i.e. the more wi, the more Mi can be. Thus, four wood drying indices, Mi, Mt, ρb, and wi, were considered to estimate Mf. Table 1 lists different network configurations used in this study.
Features available in ML configurations.
Approaches for moisture prediction
GMDH is a family of inductive algorithms for various data mining and pattern recognition problems. GMDH is a powerful approach for predicting the mechanical properties of wood and monitoring the wood manufacturing processes (Nasir et al. 2019a; Fathi et al. 2020b). This method can find the optimal architecture automatically, thanks to its inductive and self-organizing nature (Witczak et al. 2006). GMDH approach works according to a multilayer network of second-order polynomials. The quadratic neurons’ weights are tuned through the learning process, and the GMDH network creates all possible combinations of input pairs from m variables in the first hidden layer. Then, each quadratic neuron will get trained by the least-squares method. The neuron selection criterion is applied to every layer through the natural selection of ideas to the feasible network complexity. Correspondingly, the classification accuracy for each quadratic neuron is calculated by comparing the output of the polynomial models with the targets. Consequently, the neurons with the polynomial model fitness function below the preferred error level are kept, and the rest are left aside (Nasir, Nourian et al. 2019).
ANFIS is a neural network-based fuzzy system based on the Takagi–Sugeno–Kang model (Sugeno 1985). The ANFIS antecedent consists of fuzzy sets; however, linear equations make the consequence. ANFIS is similar to fuzzy inference system (FIS) and NN in several ways. On the one hand, ANFIS includes input fuzzification, rule inference, fire strength computation/implication, aggregation, and output defuzzification steps (like FIS). On the other hand, its input and output neurons represent the training and predicted values, respectively (similar to ANN). This system's membership functions and rules are positioned in the hidden layer. ANFIS consists of a neural structure in which its neurons are the FIS parameters that can be adjusted and optimized by ANN learning methods (Nasir et al. 2019b). A hybrid algorithm was used to train the generated ANFIS model, and the least-squares method in the feedforward algorithm was used to specify the output parameters. The mean square error between the model output and target data was calculated to evaluate the accuracy of the network. For training, validation, and test, a percentage breakdown of 60%, 20%, and 20% of the total dataset were considered, respectively. The fuzzy C-mean (FCM) clustering method generated the FIS structure applied in this study to make the Sugeno-type FIS model and determine the number of rules and membership functions (MFs). The number of clusters produced by the FCM is defined beforehand through trial-and-error. Yilmaz and Kaynar (2011) claimed that the ANFIS computing method is preferable over linear regressions because it benefits from fuzzy logic and neural-based structures. Masoudi et al. (2018) reported that ANFIS is a powerful ML tool in intelligent machine monitoring, especially when it comes to performance in predicting the cutting zone temperature in the turning process. It has been used to predict PCH and Douglas-fir's mechanical properties (Ayanleye et al. 2021) and monitor the wood machining process (Nasir and Cool 2020b). Abellan-Nebot and Subiron (2010) stated that ANFIS is a robust method when dealing with a medium sample size, which was the case in this study. Besides, they indicated that ANFIS could decrease the size and cost of the experiments during training a model.
SVR constitutes a new promising approach to data regression, and its algorithm is different than neural networks but quite like a support vector machine. SVR maps training data into the l-dimensional feature space that formulates an optimized hyperplane and demonstrates the nonlinear relation between input and output data, i.e. independent and dependent variables (Chen et al. 2017). The decision tree is popular for its intuitive nature, making it easier to interpret. It has been used to predict surface and internal checks formation in weathered thermally modified timber (Van Blokland et al. 2021a, 2021b). It was also employed to monitor the mechanical degradation of artificially weathered wood using the wave propagation data (Nasir, Fathi et al. 2021). The challenge of using a decision tree is finding the optimal tree size, which should be tuned during the pruning phase. CART (classification and regression trees) algorithm (Steinberg 2009) was used for decision tree modeling. The least squared error method was used for node splitting, and the optimal tree was set to be within one standard error of the tree with maximum R2. Other hyperparameters were formed similar to those reported by Van Blokland et al. (2021a). Random forest is an ensemble learning algorithm based on bootstrap sampling, which aggregates the decision of many trees known as weak learners and uses a voting scheme to compute the model output. Schubert et al. (2020) used the random forest to predict the mechanical properties of wood fiber insulation boards. Also, it has been successfully employed for wood machining monitoring (Nasir et al. 2020; Nasir, Kooshkbaghi et al. 2021). The number of trees in the model was 500, and 81% of the training data were used to make the bootstrap sample size. The model was also validated by the bag method.
Results and discussion
Initial and final moisture distribution
The results of the ANOVA test for the Mi values of the kiln specimens revealed a significant difference (0.012) between groups at the confidence level of 95%. Duncan's results revealed that the second group's average Mi values differed from those of the first, fourth, and sixth groups. Moreover, the average wi values of the third and fourth groups were statistically different (Figure 1). The average Mi for the six drying batches were 102.4%, 108.2%, 106.8%, 99.6%, 103.4%, and 101.3%, respectively.
The statistical difference for Mi between six drying batches. Letters above the columns show statistically significant differences.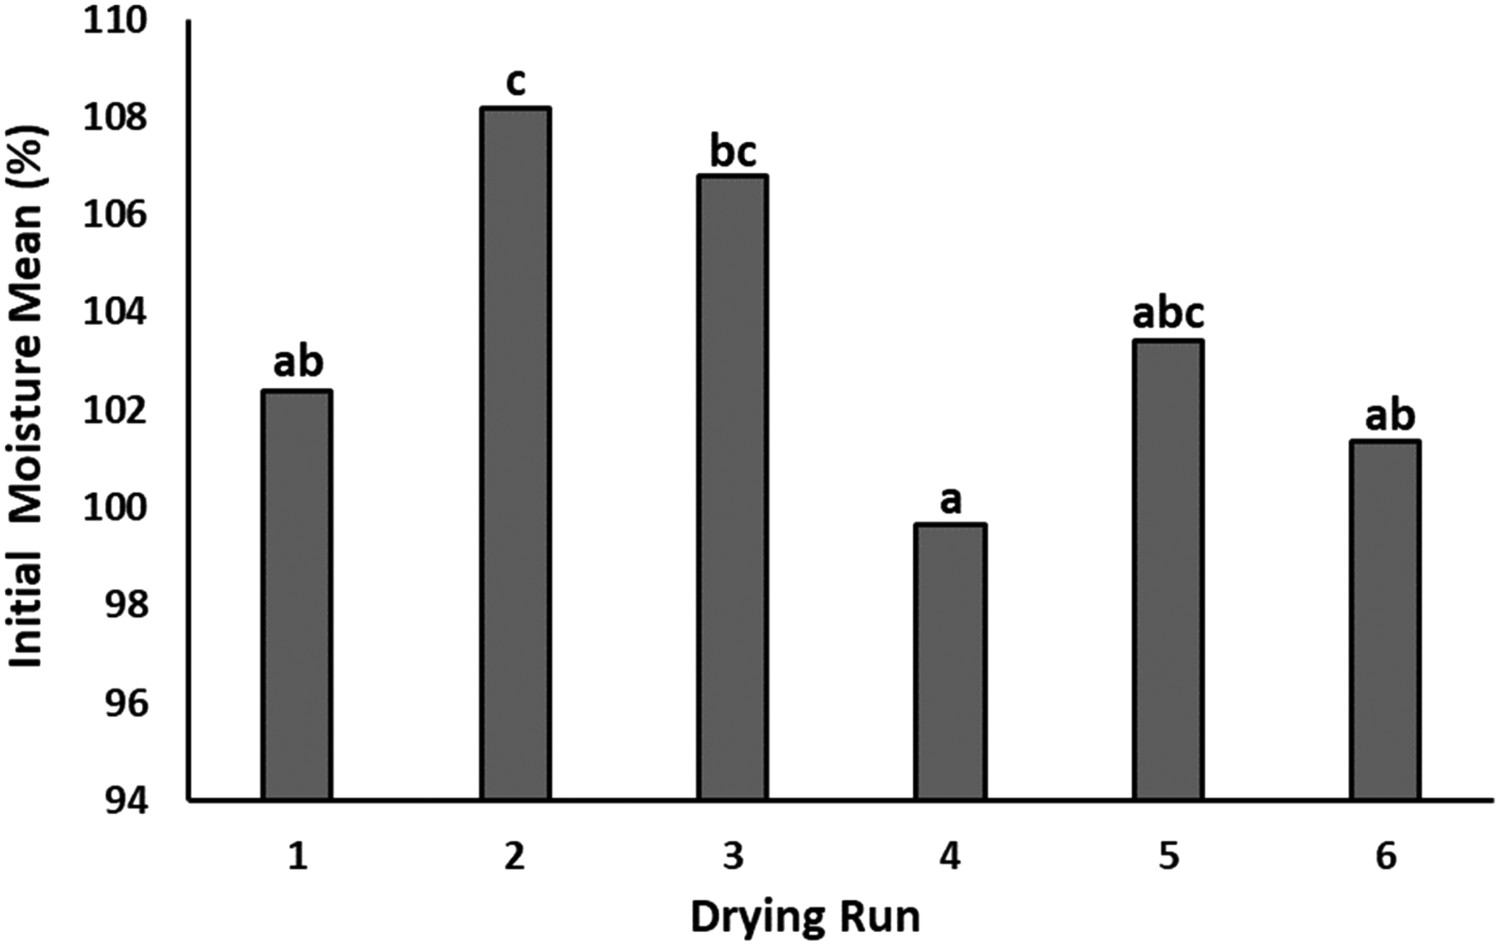
ANOVA test for the Mf values of the kiln specimens also indicated a significant difference (0.012) between groups at the confidence level of 95%. Duncan's results showed an insignificant difference between the first and second groups and the fifth and sixth groups, which verified that Mt significantly impacted the statistical differences between Mf values of the groups. In contrast, the Mi variation insignificantly influenced differences between Mf values of the groups (Figure 2). The average Mf for the six drying batches were 21.1%, 20.3%, 15.8%, 16.1%, 11.7%, and 11.3%, respectively.
The statistical difference for Mf between six drying batches. Letters above the columns show statistically significant differences.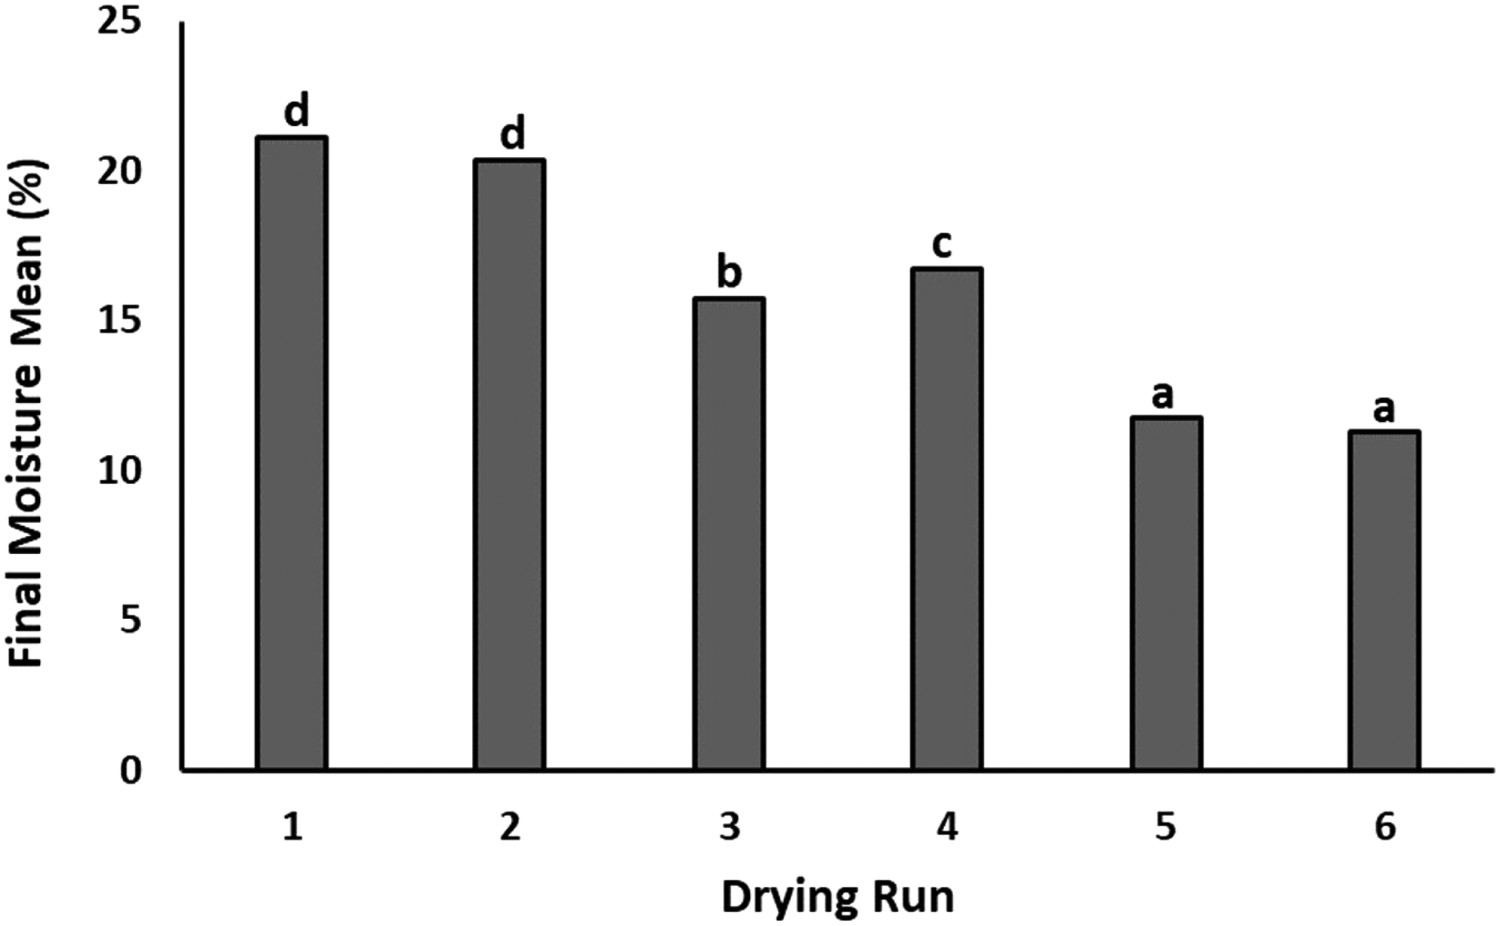
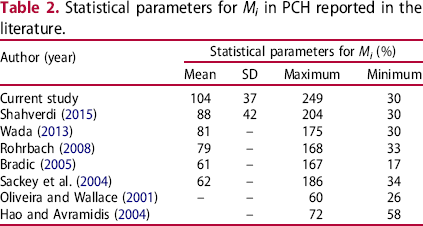
 values in this study did not accord with the findings of previous studies possibly due to three reasons, i.e. determining different Mt (setpoints), applying different drying schedules, and pre-sorting. In addition, current research results did not accord with previous findings, which could be due to two reasons. The timbers used in this research were green and freshly procured, thus having very high Mf values. However, the timber population used in this research contained 2304 specimens, significantly larger than those used in previous studies. Table 2 summarizes the values of
 reported in former studies.
Statistical parameters for Mi in PCH reported in the literature.
Initial weight distribution
Concerning current commercial-scale technology, sawmills cannot reliably measure the M and ρM of green timbers in their production lines. This underscores the importance of wi as an input factor to predict Mf. Considerable differences in the wi among kiln specimens probably originated from various M and ρM values (Siau 1995). ANOVA test for the Mf values of the kiln specimens indicated a significant difference (0.007) between groups at the confidence level of 95%. Duncan's results revealed that the average wi values of the second and third runs were statistically greater than those of the other four runs (Figure 3). The average wi for the six drying batches were 5.64, 5.84, 5.82, 5.65, 5.63, and 5.65 kg, respectively.
The statistical difference for wi between six drying batches. Letters above the columns show statistically significant differences.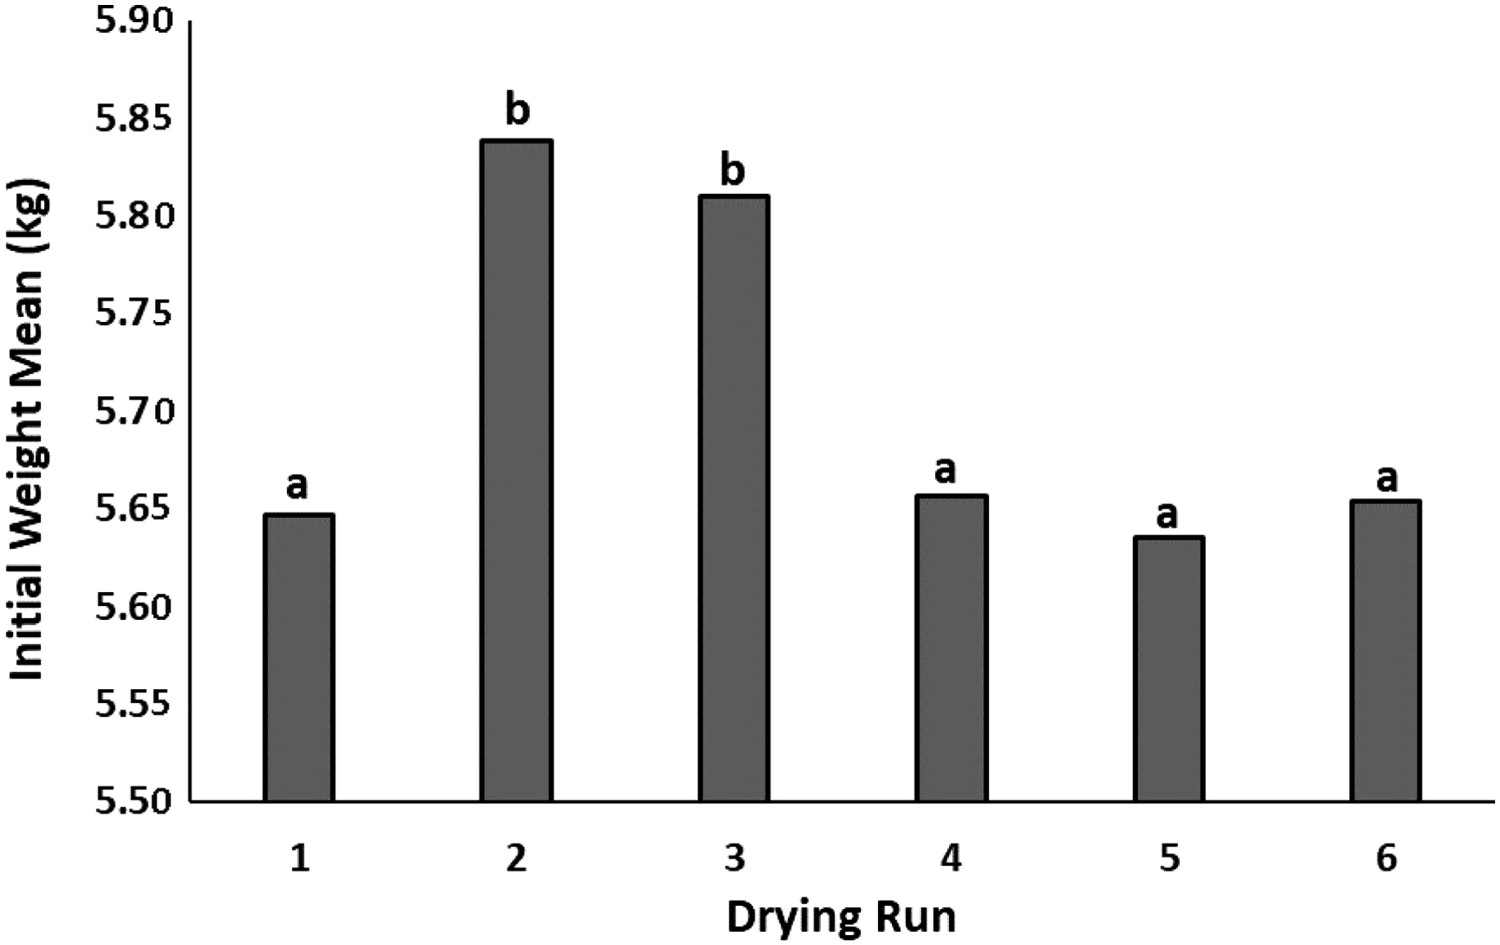
Basic density distribution
ρb is irrelevant to M because it defines as oven-dry weight over green volume. In addition, the three dimensions of the kiln specimens are almost equal and, therefore, have nearly the same V. However, the differences in the ρb among kiln specimens stemmed from the significant difference of ρb between western hemlock and fir, as well as, between juvenile and mature wood, as well as heartwood and sapwood. ANOVA test for the ρb values of the kiln specimens indicated a significant difference (0.007) between groups at the confidence level of 95%. Duncan's results demonstrated that the only significant difference was between the average ρb values of the fourth and fifth runs, which had the greater and smaller ρb values, respectively (Figure 4).
The statistical difference for ρb between six drying batches. Letters above the columns show statistically significant differences.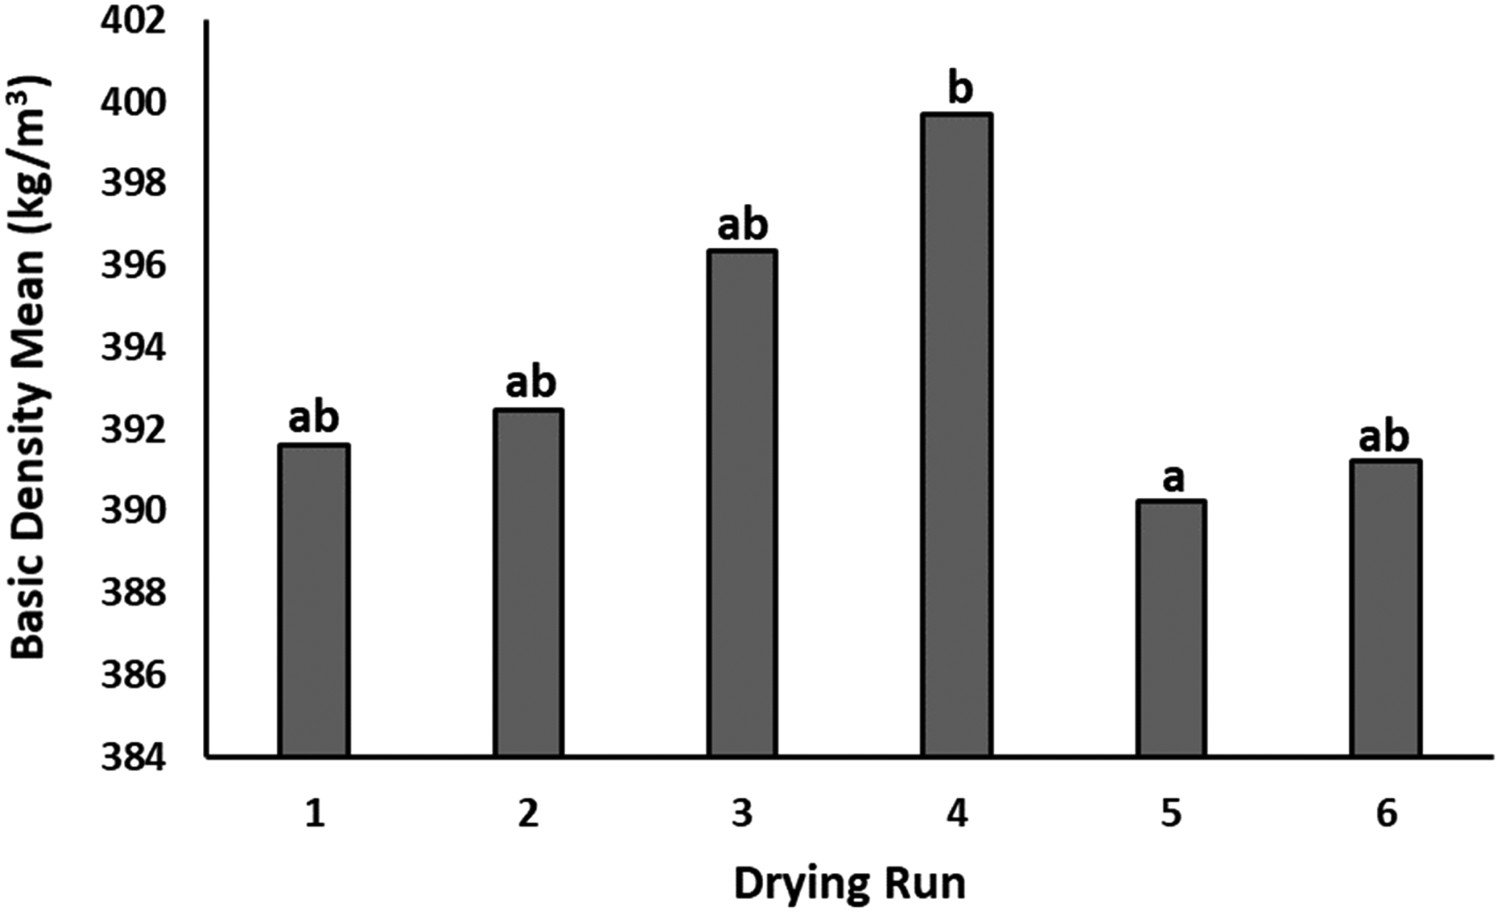
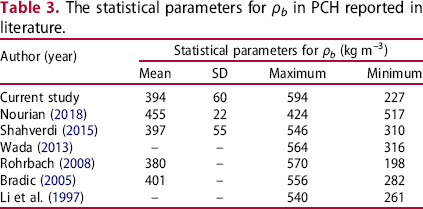
The statistical parameters for ρb in PCH reported in literature.
Wood moisture prediction
Performance of the predictive models for different configurations.
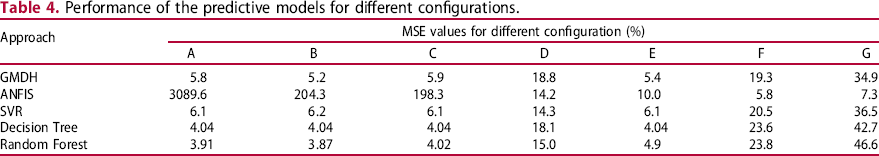
According to Table 4, models that do not use the Mi (model D, F, G) show a relatively lower performance indicating the importance of wood Mi in the accuracy of the prediction. The best performance was achieved using configuration B (including Mt, Mi, and wi) and random forest modeling. The relative importance of the parameters used in the model is shown in Figure 5.
Relative importance of the parameters in configuration B used to train the random forest model.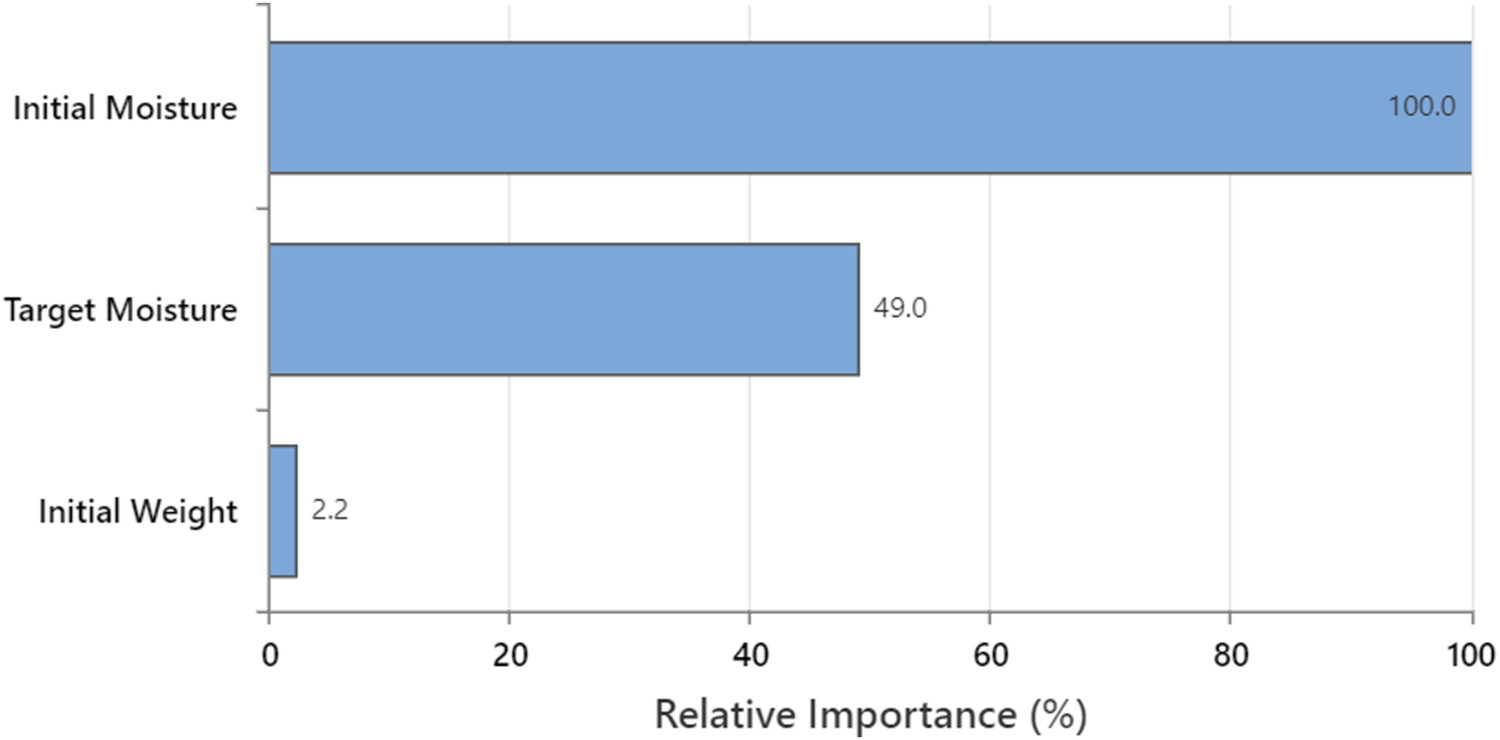
Figure 5 shows that Mi and wi account for the most and least important variables in the random forest model, respectively. Thus, rapid and reliable measuring of Mi is the key to predicting the Mf in kiln-drying. Excluding wi,
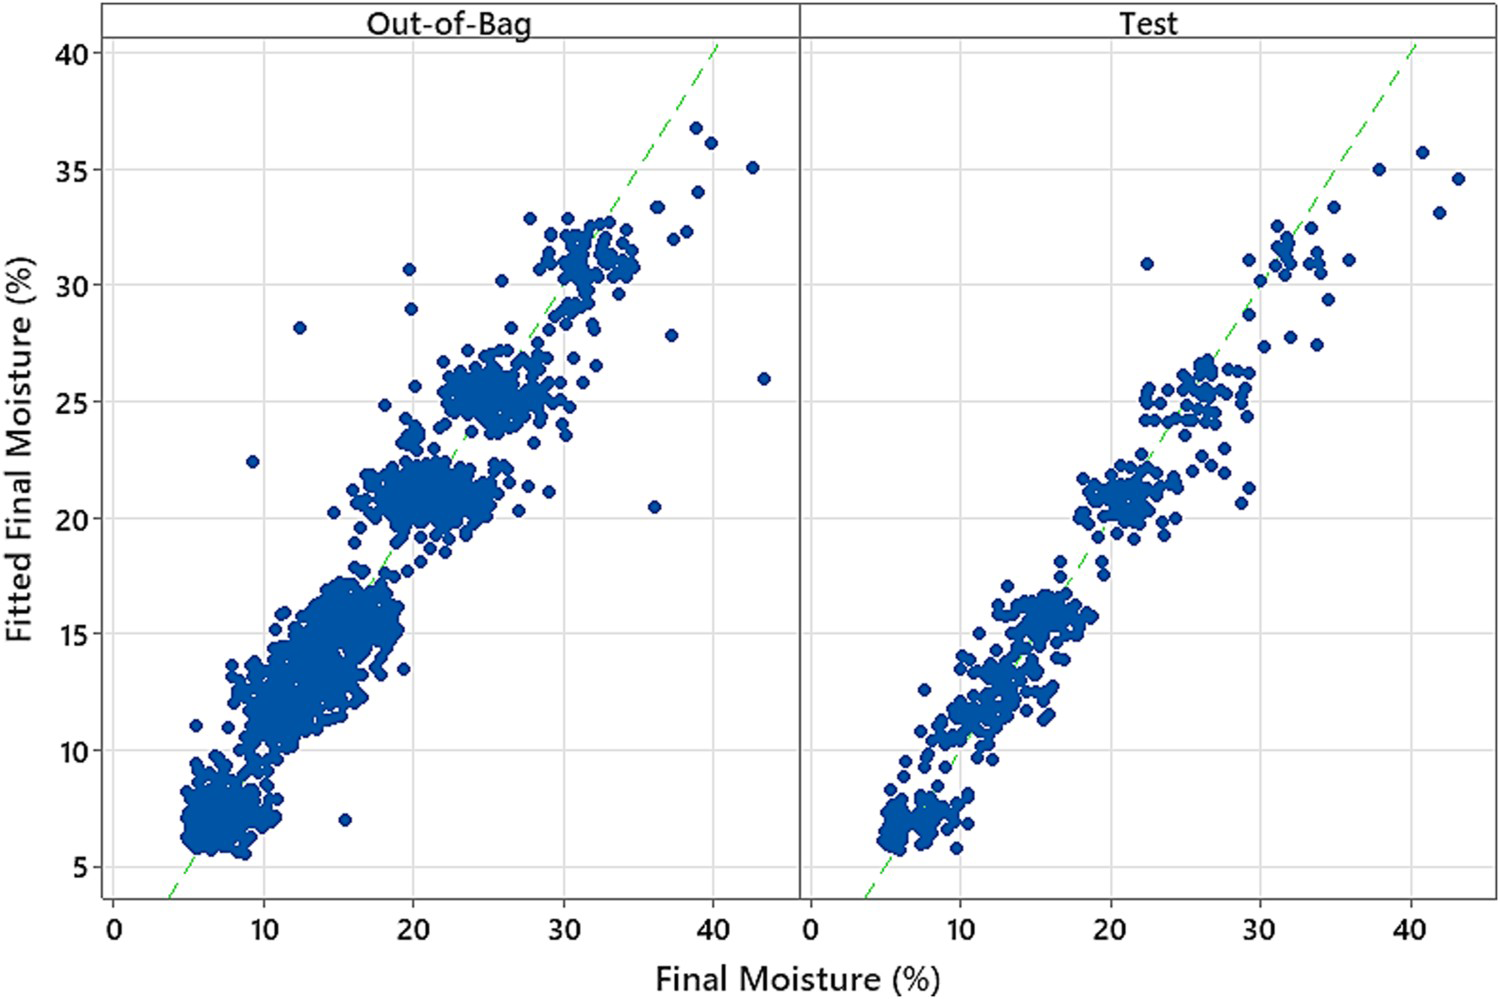
and using Mt and Mi (configuration E) also yields very similar results. However, in this case, the best performance is obtained using a decision tree followed by random forest, GMDH, and SVR. The R2 (test data) achieved using the optima model (random forest – configuration B) is 0.934. Figure 6 shows that this R2 depends on the number of trees in the random forest model. It can be seen that the model has poor performance with a low number of trees (N < 50). Figure 7 shows the actual Mf versus the fitted (predicted) Mf on the out-of-bag and test data.
The variation in R2 with the number of trees in the random forest model. The actual Mf versus the fitted (predicted) Mf on the out-of-bag and test data.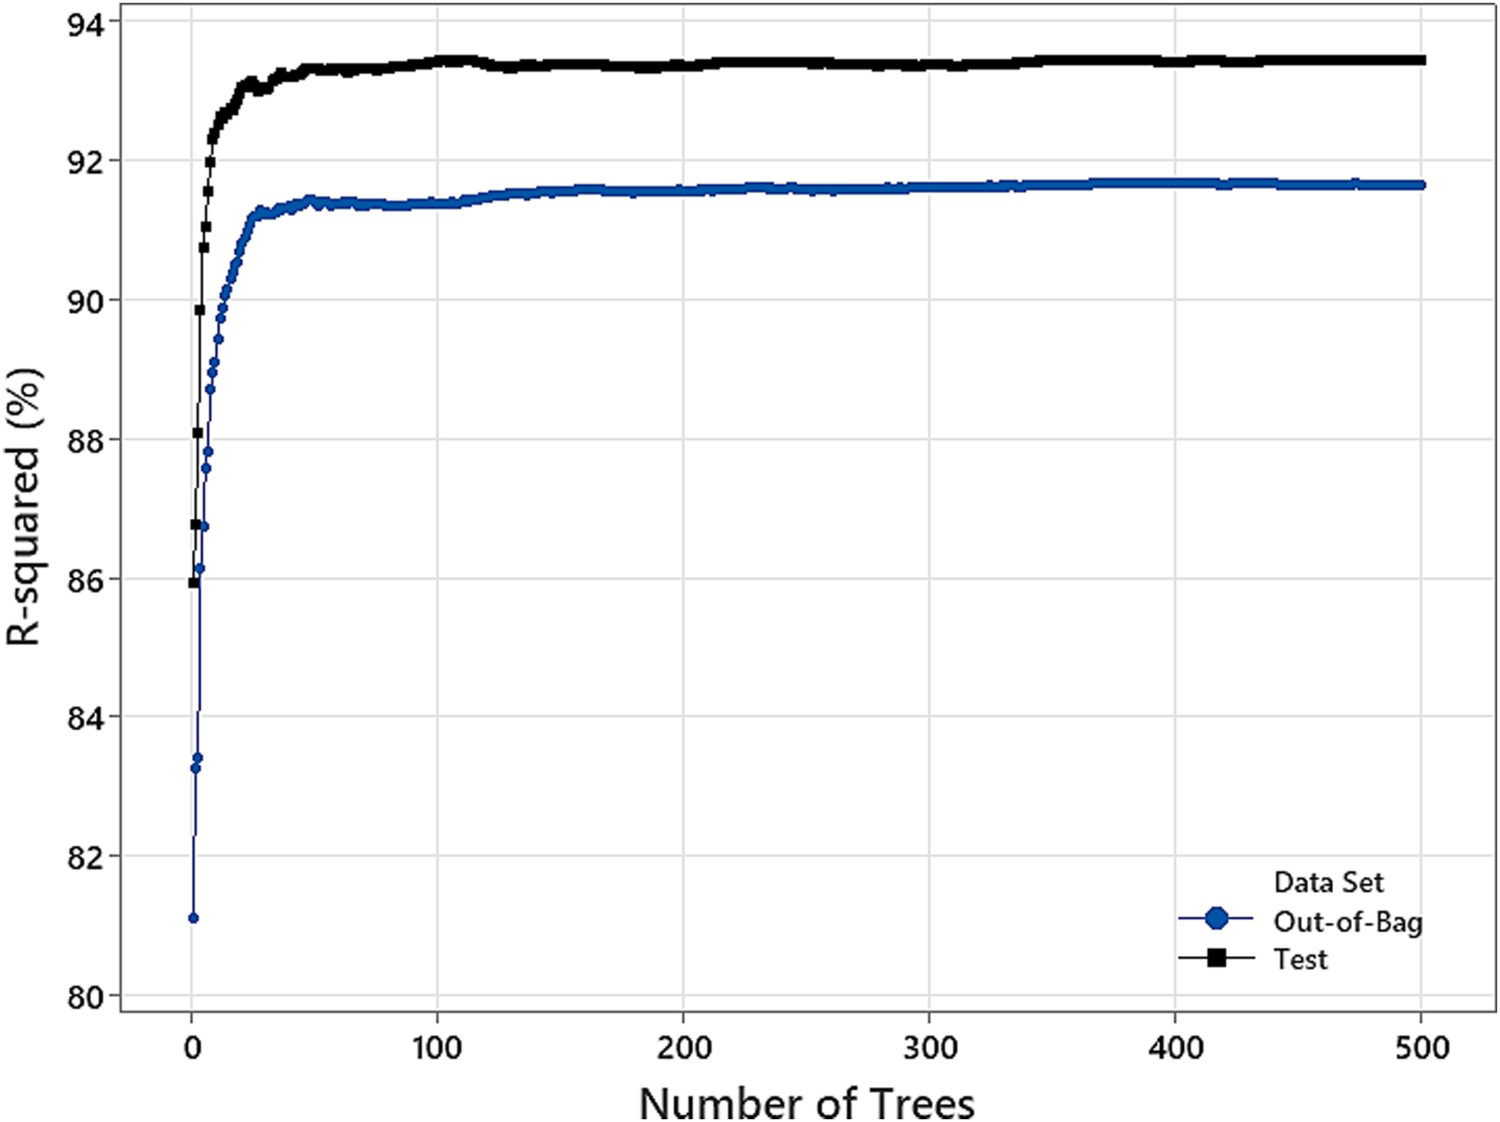
Overall, ANFIS failed to accurately predict the Mf. Despite the superior performance of GMDH over MLP and RBF ANN (Rahimi and Avramidis 2022), it still yielded a lower performance than random forest. The performance of SVR was comparable with that of GMDH, indicating a promising ability to predict Mf. While the best result was achieved using random forest, decision tree, GMDH, and SVR can also yield a comparable result when Mi is included in the input parameters in the ML model. Owing to the importance of Mi and wi in the prediction of Mf, future research should investigate the rapid and reliable techniques for measuring the moisture of green wood. However, this may require different data acquisition methods and affect the choice of ML modeling, which is affected by the complexity of the data and the level of feature engineering before feeding the data into a predictive model (Nasir and Sassani 2021).
Conclusions
This study bridged some significant knowledge gaps on modeling Mf in kiln-dried PCH timbers. It was shown that the key parameter in developing a reliable predictive model is the accurate measurement of wood's Mi. Measuring the moisture content of green lumber can be challenging in sawmills. Future studies should focus on non-destructive moisture assessment in large-size green lumber. Despite the high performance of random forest, other methods such as decision tree, GMDH, or SVR yielded competitive results. Non-destructive measurement of initial moisture content by techniques such as infrared spectroscopy or ultrasound method would change the nature of the input data set. It may require re-evaluating the machine models to identify the one that best fits the input data. This study did not consider the effect of wood properties and drying conditions on the drying defect such as warping, cupping, and checking, to name a few. Future studies can focus on developing predictive tools for assessing the drying defects parallel to moisture prediction.
Footnotes
Acknowledgement
The use of the FPInnovations laboratory kiln in this project is highly appreciated.
Disclosure statement
No potential conflict of interest was reported by the author(s).