
Abstract
Two main parameters of cooling conditions and anti-solvent (ethanol) were significant in the size and shape of the copper sulfate crystals, the feedstock solution of which was produced with the high-pure, copper cathode. In the slow cooling crystallization, increasing cooling time from 30 to 60 min increased the average size of the crystals from 87 μm (30 min) to 145 μm (60 min). On the contrary, in the fast one, no change in the crystal sizes was observed in the same time range. In the presence of ethanol, the average size of the crystals declined. Finally, based on the crystallization kinetics model, it was concluded that enhancing the super-saturation led to increasing the average rate of crystal growth. Also, the addition of the anti-solvent resulted in the declined average size of the crystals. The crystallization kinetics indicated that enhancing the super-saturation led to increased average rate of crystal growth.
Nomenclature
Population Density
Time
Growth Rate
Length of Crystal Parameter
Nucleation Rate
Red Hat Package Manager

Magma Density

Nucleation Constant
Nucleation Order
Growth Order

Weight Fraction of Micro particles
Introduction
Copper sulfate (CuSO4.5H2O) has found many areas of applications such as agriculture, antiseptic agent, electroplating processes, electronics as an intermediate, antifungal agent, treatment of copper deficiency, and even catalyst in petrochemical processes (Giulietti et al. 1996; Bissengaliyeva et al. 2016). In industrial level, it is produced through the reaction of metallic copper with a hot concentrated sulfuric acid in the bubbling of an air oxidant (Richardson 1997). Having been produced, the CuSO4.5H2O solution is converted into solid crystal through various methods of crystallization in which the size and purity of the crystals are two main parameters in evaluation of their quality (Arend and Hulliger 1989). They can be optimized and controlled with choosing the correct crystallization conditions which directly influence the nucleation and growth of the crystals, shapes and sizes of which are strongly affected by the crystallization environment including the temperature of the system, cooling rate, and changing structure of the solution, for example, through an anti-solvent component (Holden and Morrison 1982). It has been shown that it is possible to control the in a desired orientation and morphology by using various film templates such as Langmuir–Blodgett (LB) film, tuning the temperature of which administrate the nucleation and growth of crystals (Lu et al. 2008). Also, in an attempt to find a facile method to control of the morphologies of inorganic materials such as CuSO4·5H2O (chalcanthite), CuSO4·5H2O dendrite (chalcanthite), NiSO4·6H2O (retgersite), NiSO4·6H2O dendrite (retgersite), dendrite-shaped branched structures of the pure inorganic salts have been obtained by using nanocrystalline cellulose as an additive (Voronova and Surov 2015).
It is worth noting that the supersaturation is essential to all mentioned effective parameters. In general, these three methods of natural, slow, and fast are employed in cooling crystallization (Mohameed et al. 2002). In the methods, temperature and time are two determining parameters in that the rate of cooling determines the size of the crystals. In turn, slow cooling crystallization results in stable form of crystals with coarse particle distribution (Bakar et al. 2009). In contrast, fast cooling tends to favor numerous smaller crystals. Although extremely large crystals are to be avoided because they often include the solvent and its dissolved impurities, finely distributed crystals are also undesirable because it is difficult to wash off the solvent and the soluble impurities, and it takes longer time to dry them (Ault 1997).
Effective level of supersaturation as the driving force for both crystal growth and nucleation may be ensured by the use of a binary solvent system in which two liquids (for example, water and ethanol) are perfectly mixed. In this mixture, the copper sulfate is soluble in only one of them, in this case, the water. In these conditions, slow agitation of the binary solvent may help the better growth of the crystals.
Thermochemical characterization of natural chalcanthite and synthetic hydrous copper sulfate (blue vitriol) by using the melt solution calorimetry in accordance with Hess's laws shows that the standard molar enthalpies of formation were −(2267.2 ± 4.1) kJ.mol−1 for natural chalcanthite and −(2272.6 ± 6.0) kJ.mol−1 for synthetic hydrous copper sulfate (blue vitriol) at ΔfH0 m (T = 298.15 K) which can be used the quantitative modeling of the physicochemical conditions related to crystallization (Bissengaliyeva et al. 2016).
All in all, there are many parameters affecting the process, some of which have been scrutinized such as cooling rate, temperature, and additive impurities (Kundig et al. (2001), Mohameed et al. (2002)). Optimum the selection of the parameters in correct range directly lead to optimum crystals with uniform crystal size and narrow crystal size distribution (CSD). One of the most important parameters is anti-solvent, the optimum addition of which may determine the crystal morphology and its mean size (Roelands et al. 2006, Nagy et al. (2008)).
According to the comments above, this research focuses on the effect of cooling condition including the fast and the slow processes, and ethanol anti-solvent in 3 different ranges of copper sulfate (200, 220, and 240 gr) on the quality of the CuSO4.5H2O crystal from the pure copper cathode.
Theory
Crystallization kinetics
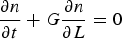
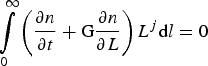
Interaction of the phenomena of nucleation, growth, and agglomeration strongly contribute to the crystal size distribution (CSD). It can be exactly characterized by using kinetic data through which appropriate scale-up data are obtained via a laboratory scale crystallizer. In the crystallizer, a series of transient-population-density data may determine both the growth and nucleation rates, for example, using the procedure of moments. For a perfectly mixed crystallizer, the population balance equation for a system having size independent growth rate and negligible agglomeration and breakage is (Tavare 1995):
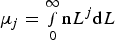
The jth moment (
 ) of the population density regarding the crystal size is defined as follows (Tavare 1995):
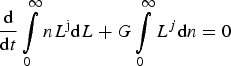


 . The kinetic parameters can be expressed in terms of the moments with respect to size (Tavare 1995):


 .
.
Nucleation and growth analysis
Empirical power law expressions provide a useful means to correlate the nucleation kinetics and use the resulting correlations in the process analysis. The general correlation form is (Manteghian and Ghader 2009):
 C/C*) is the relative super-saturation,
 is the magma density in (g/g), b is the nucleation order, and
 is the nucleation constant. To relate growth kinetics to super-saturation by fitting the growth-rate data with a power law function of the form, an empirical approach can also be applied (Manteghian and Ghader 2009):
The population density is calculated by the mass distributions of CSD (Manteghian and Ghader 2009):
 is the weight fraction of the crystals at size
 estimated by SEM analysis. Magma density (
 ) is defined as the mass of solids per unit volume of the slurry. The magma density signifies the total production of solids in the crystallizer. The mass of solids (Ms) can be determined from the magma density (
 ), where
 is the total volume of the slurry in the crystallizer.
Crystallization methods
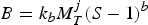
Two main methods to crystallize were slow cooling (process#1) and fast cooling (process#2). In the process#1, at first, in a 2-molar sulfuric acid at 70°C, a specific amount of copper sulfate penta-hydrate was dissolved. Subsequently, the temperature was reduced with a rate of 0.5°C/min until the initial growth of the crystal was observed at 23°C. In the process#2, primarily, in a 2M sulfuric acid at 70°C, a particular amount of the copper sulfate penta-hydrate was dissolved. Afterwards, the temperature was gradually reduced to 15°C every 5 min until the initial growth of the crystal was observed at 21°C. In all methods of the crystallization, the stirrer had a constant speed of 400 rpm. To analysis the kinetics of growth, the crystalline powder was sampled at different time intervals (30 and 60 min of the crystallization processes), and analyzed using SEM photomicrographs, the results of which is shown in Figure 1.
SEM photomicrographs of CuSO4.5H2O crystals obtained from the process#1(a:30 min, b:60 min h), and process #2 (c:30 min, d:60 min).
The characterization of the antisolvent ethanol in the crystallization
In a series of the experiments, CSD, nucleation, and crystal growth were studied by adding ethanol as the anti-solvent to the solution containing sulfuric acid, copper sulfate, and water as the solvent. The experiment was conducted at ambient temperature and in 3 various weights of CuSO4.5H2O, including 200 gr (process#3), 220 gr (process#4), and 240 gr (process#5). The morphology and size distribution of the as-synthesized CuSO4.5H2O crystals were scrutinized by using a scanning electron microscopy (SEM, Tescan Vega-II) equipped with an energy dispersive X-ray microanalyzer (EDAX)(Cam-Scan MV 2300). At last, the photomicrograph of the crystals is demonstrated in Figure 2. X-Ray diffraction (XRD, PHILIPS, X'pert-MPD system) using Cu Kα (λ = 1.54°A) radiation was used to characterize the crystalline structure.
Morphological studies of the crystals obtained through Process#3(a:30 min, b:60 min), Process #4 (c:30 min, d:60 min), and process#5(e:30 min, f:60 min).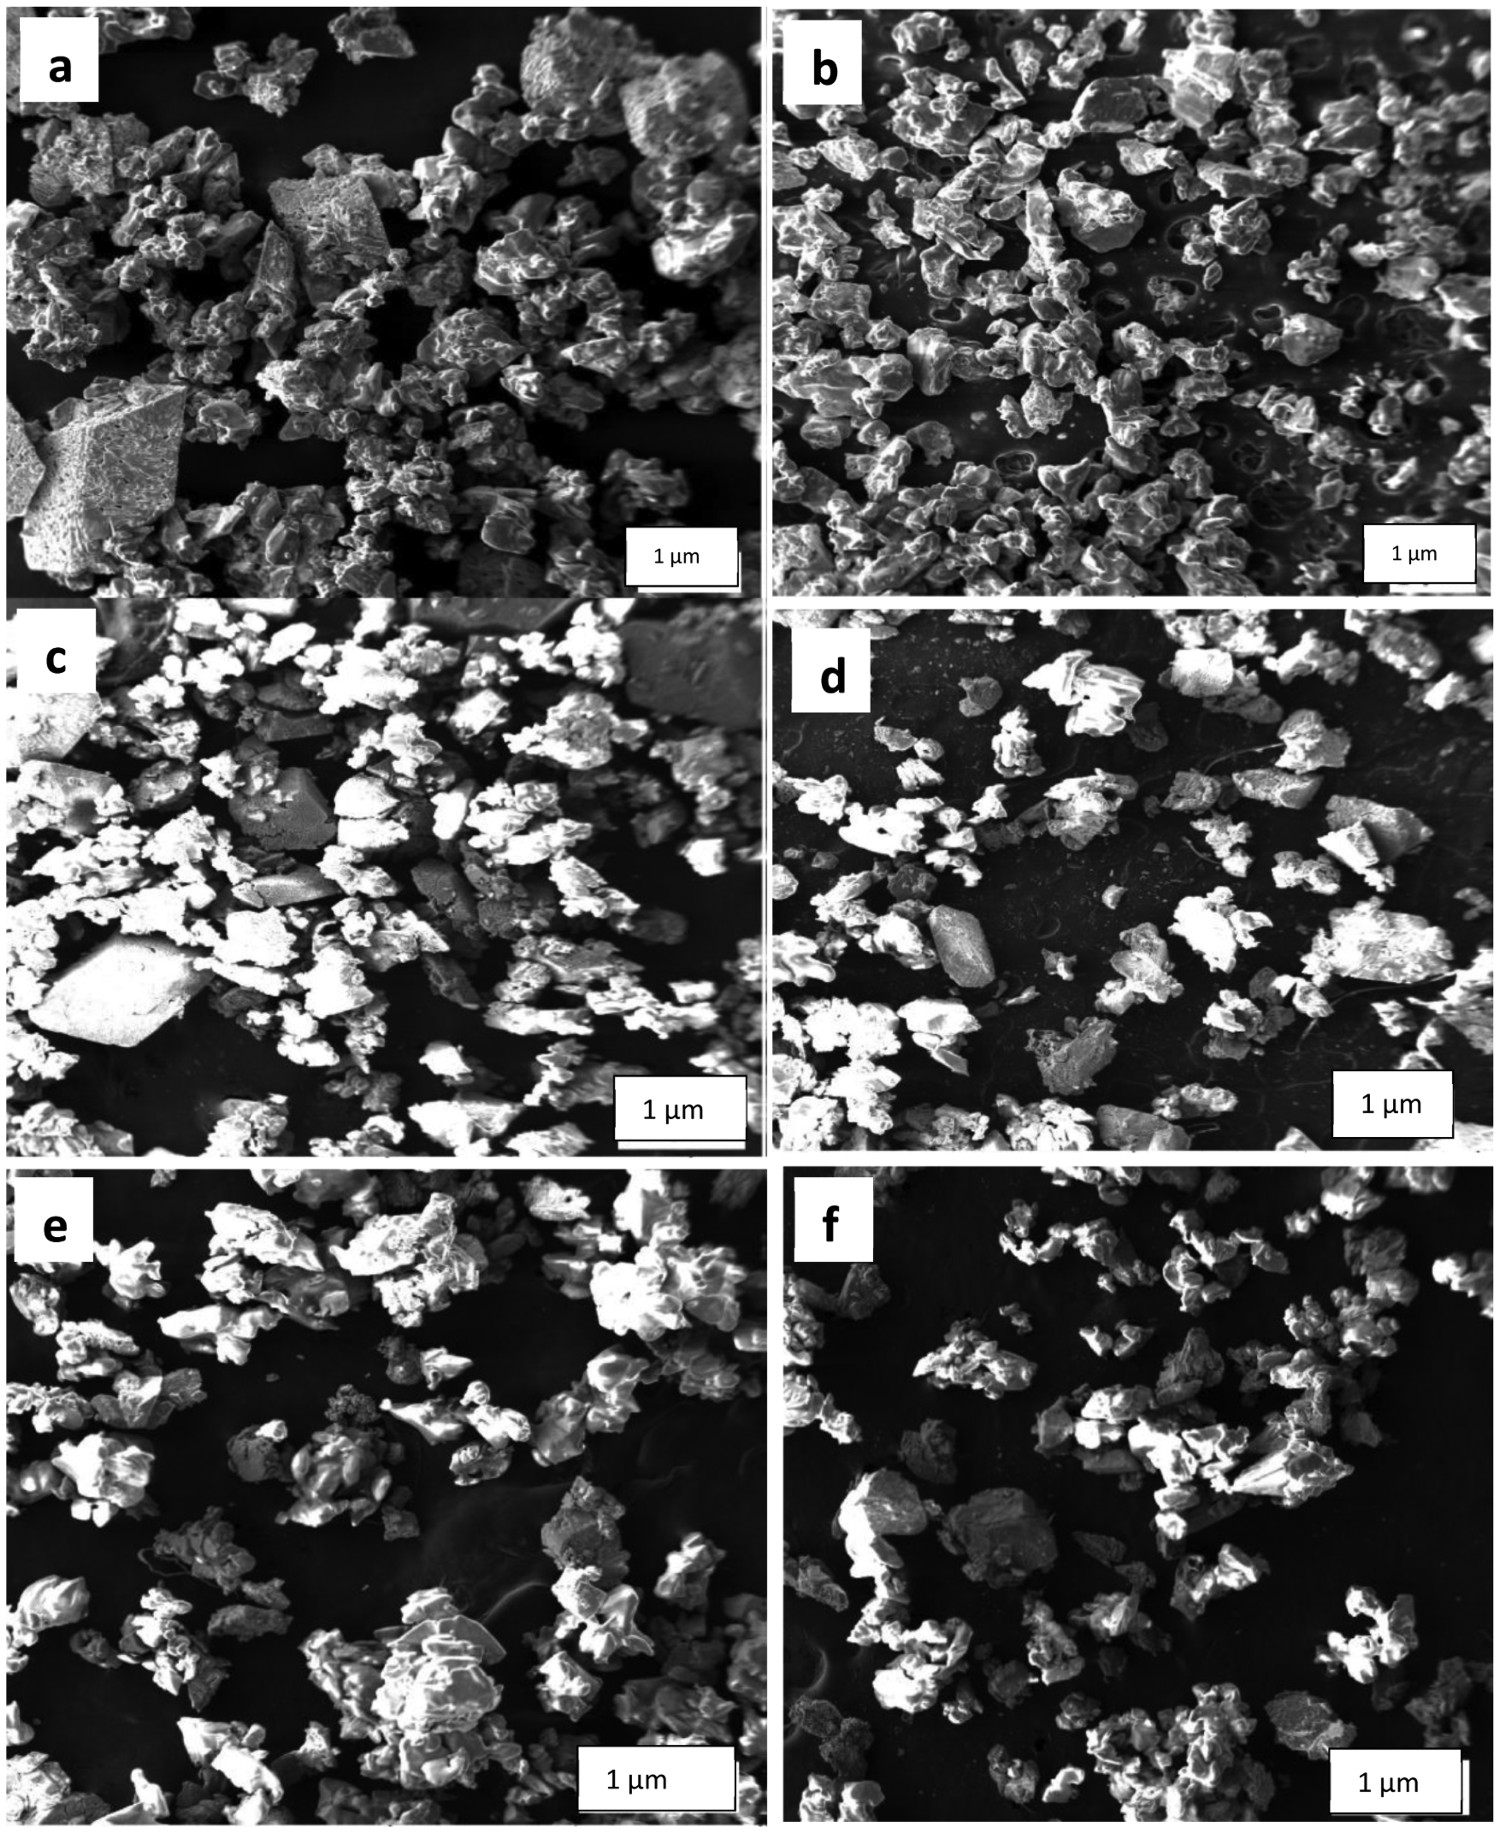
Results and Discussion
Crystalline structure of CuSO4.5H2O crystals
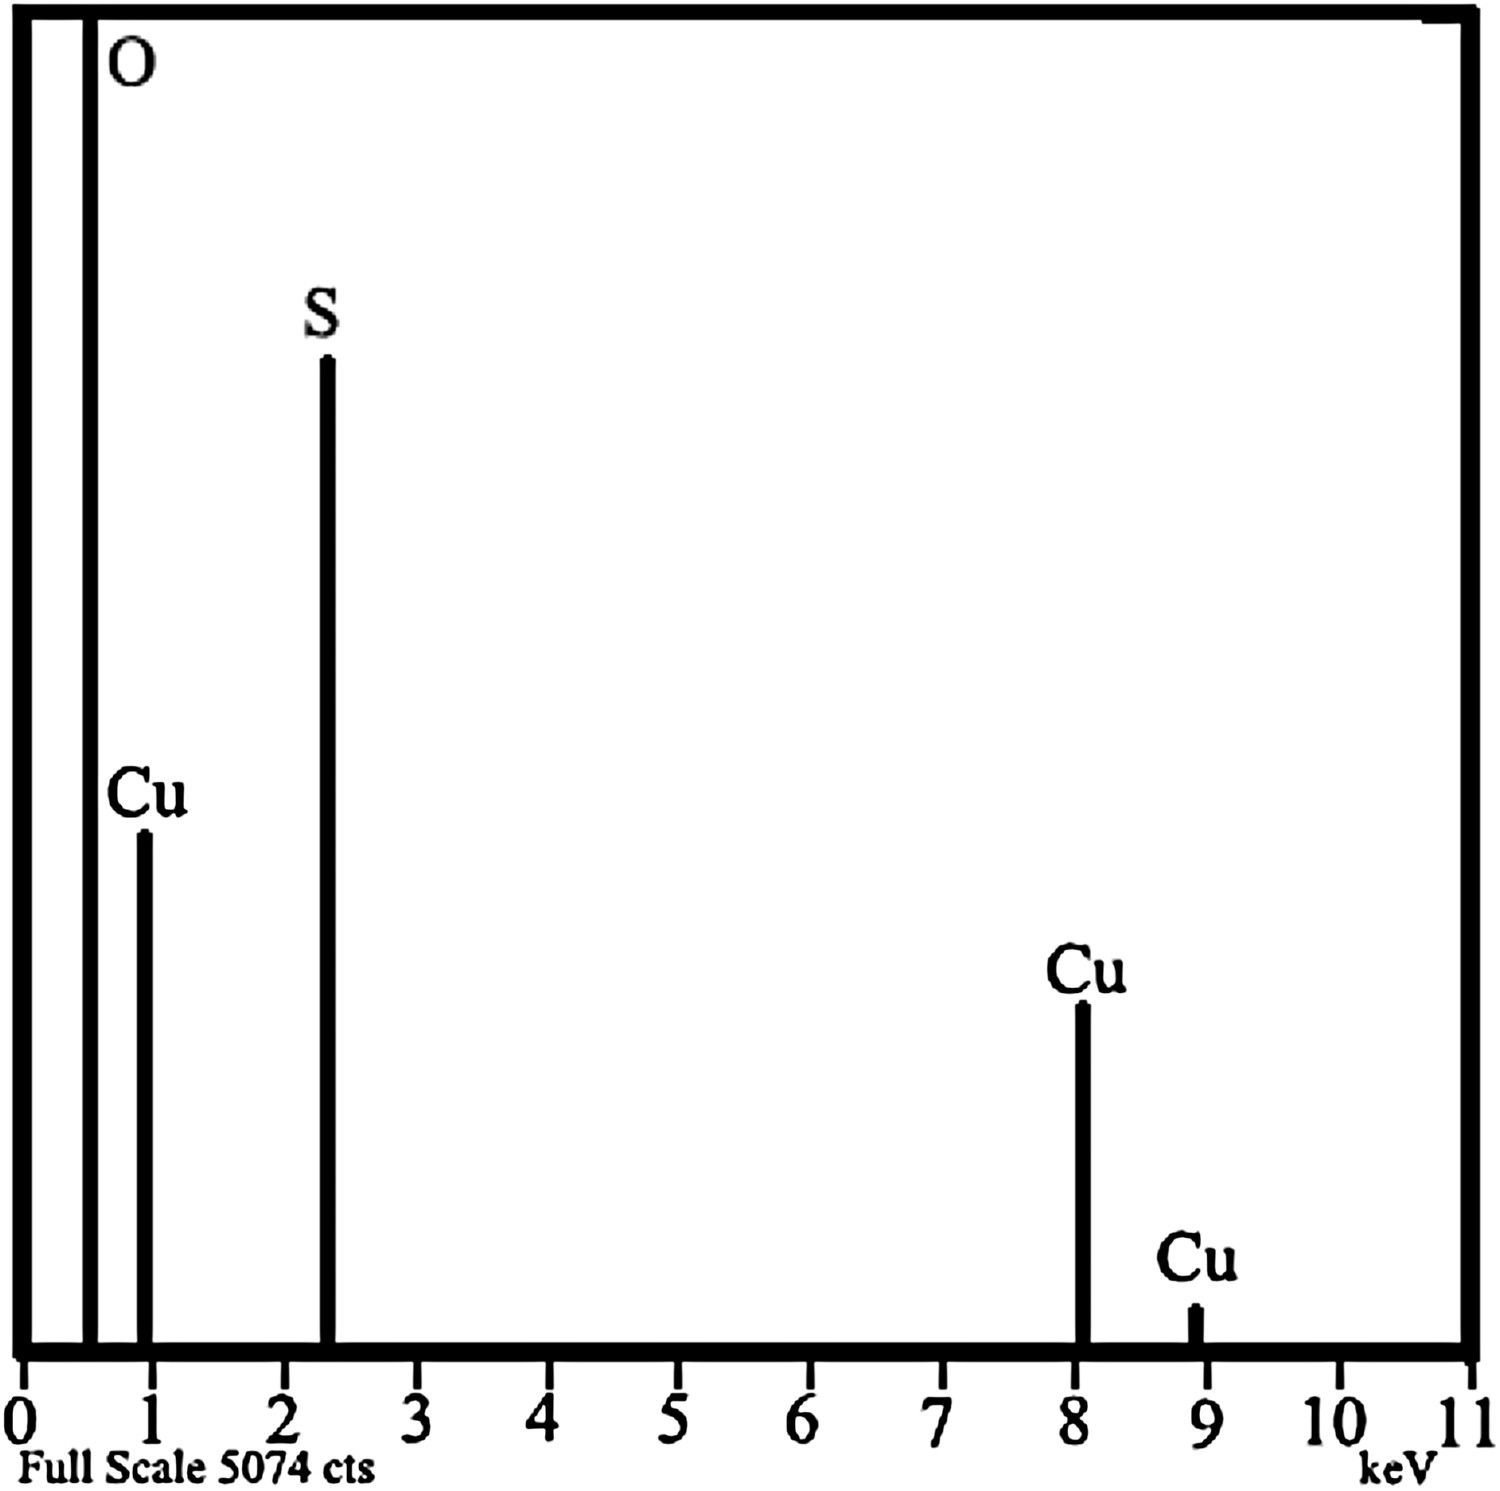
Although any change in crystallization process significantly changed the peaks of CuSO4.5H2O, all the diffraction peaks in Figures 3 a and b are consistent with the pure chalcanthite (CuSO4·5H2O) phase (JCPDS card No. 00-001-0301). In this case the chalcanthite crystals were anorthic with the lattice parameters: a = 5.12 A°, b = 10.70 A°, c = 5.97 °A (space group: P-1). Also, the EDS analyses of the CuSO4.5H2O crystals obtained from each of the various processes confirmed the purity of the crystals (Figure 4).
XRD analysis of the representative CuSO4.5H2O samples from the crystallization processes with (a) slow cooling, and (b) fast cooling paradigm. A typical EDS analysis of the as-synthesized, pure CuSO4.5H2O crystals.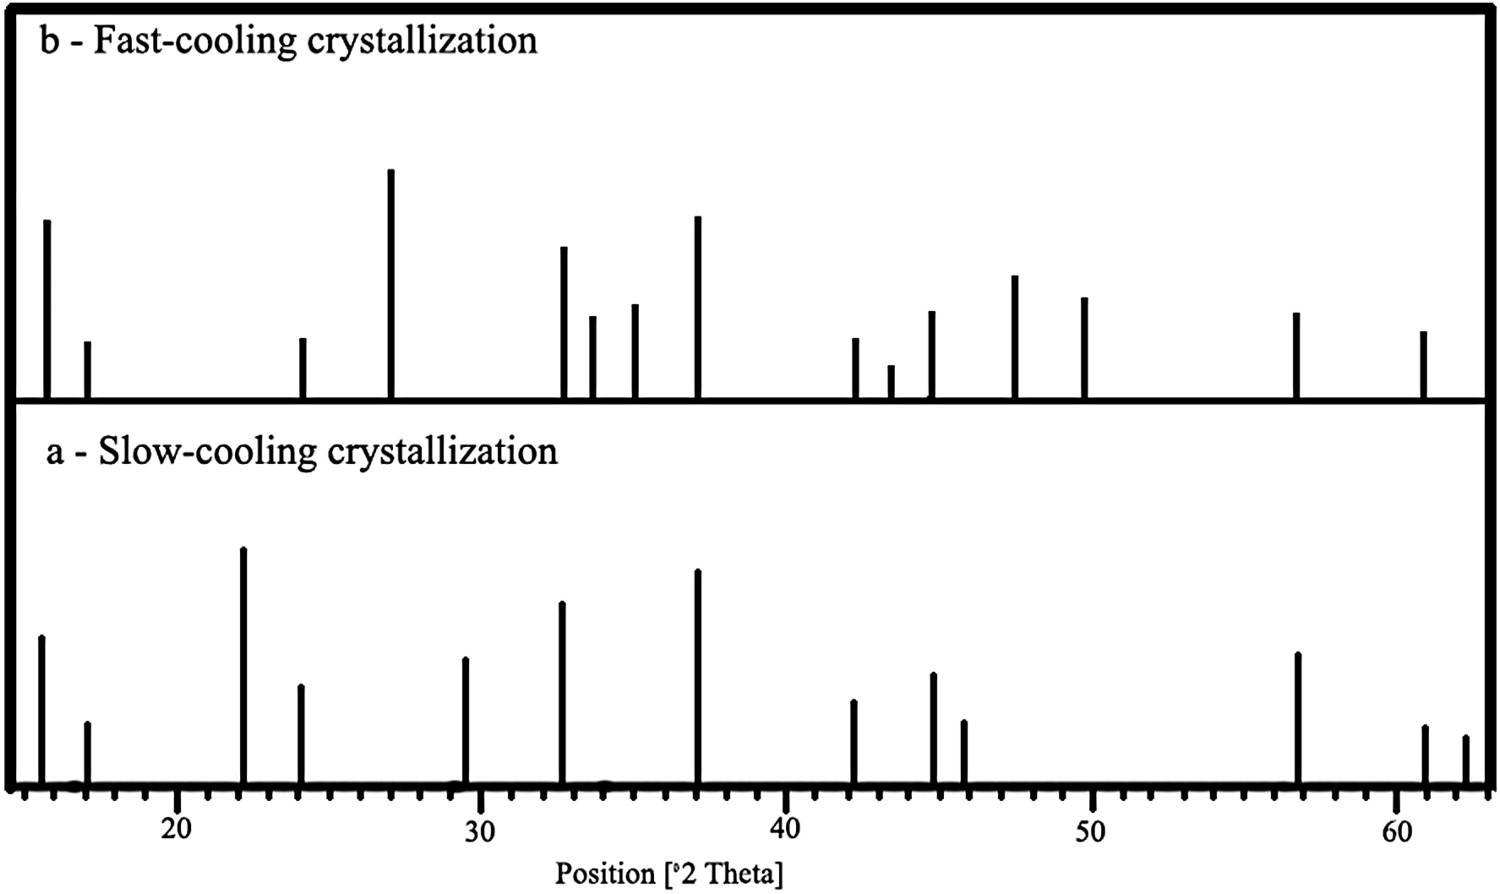
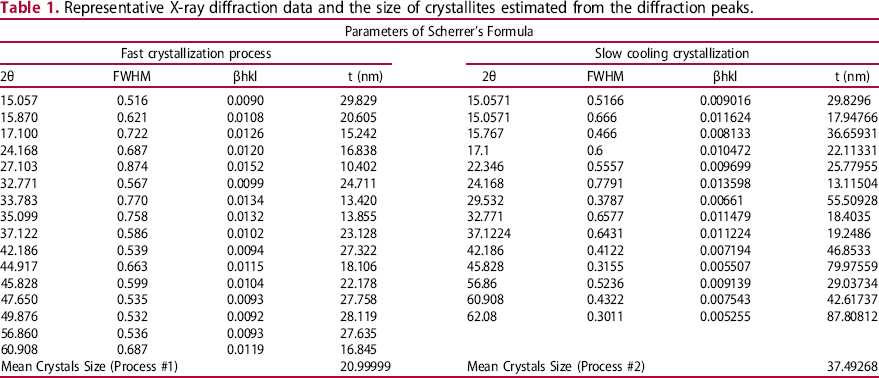
Representative X-ray diffraction data and the size of crystallites estimated from the diffraction peaks.
Growth behavior
According to SEM photomicrographs, the size of the crystals increased by increasing the cooling time. As shown in Figure 5, the mean size of the crystals in Process#1 (d80 = 350 nm in 60 min) was relatively greater than the fast one (Process#2) (d80 = 260 nm in 60 min), increasing the cooling time of which also made no changes in the crystal sizes. Increasing the residence time of the crystallization may significantly shift the CSD to the right side of the plot (Figure 5) meaning the growth of the coarse crystals. On the contrary, in the fast cooling rate (Process#2), increasing the residence time cannot significantly change the CSD because the fast nucleation and growth in the first 30 min of the process could limit the further growth in the next 30 min of the crystallization.
The CSD of the crystallization in the various cooling rates: Process#1 (slow rate) and Process#2 (fast rate).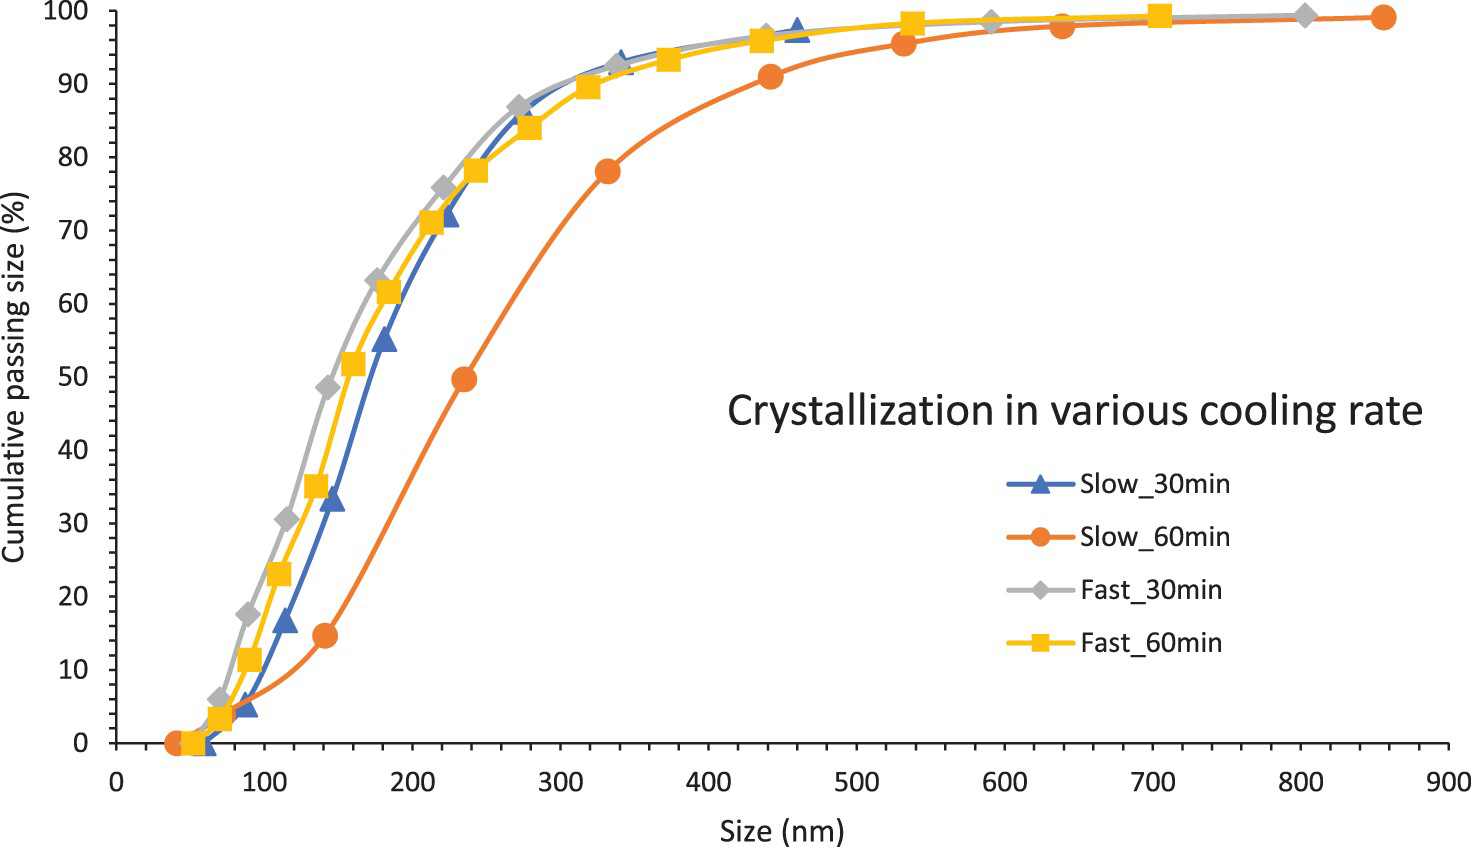
Effect of cooling rate on the CSD
Careful control of the cooling rate guarantees the CSD with desired specification. The findings showed that in Process#1, increasing the cooling time from 30 to 60 min boosted the average size of the crystals from 87 to 145
 , respectively (Figure 5). In Process#2, there were no significant variations in crystal sizes. Figure 5 illustrates CSD of the crystals in this process. Increasing the cooling rate generates faster super-saturation which is consumed by nucleation rather than growth.
Effect of anti-solvent ethanol on the CSD
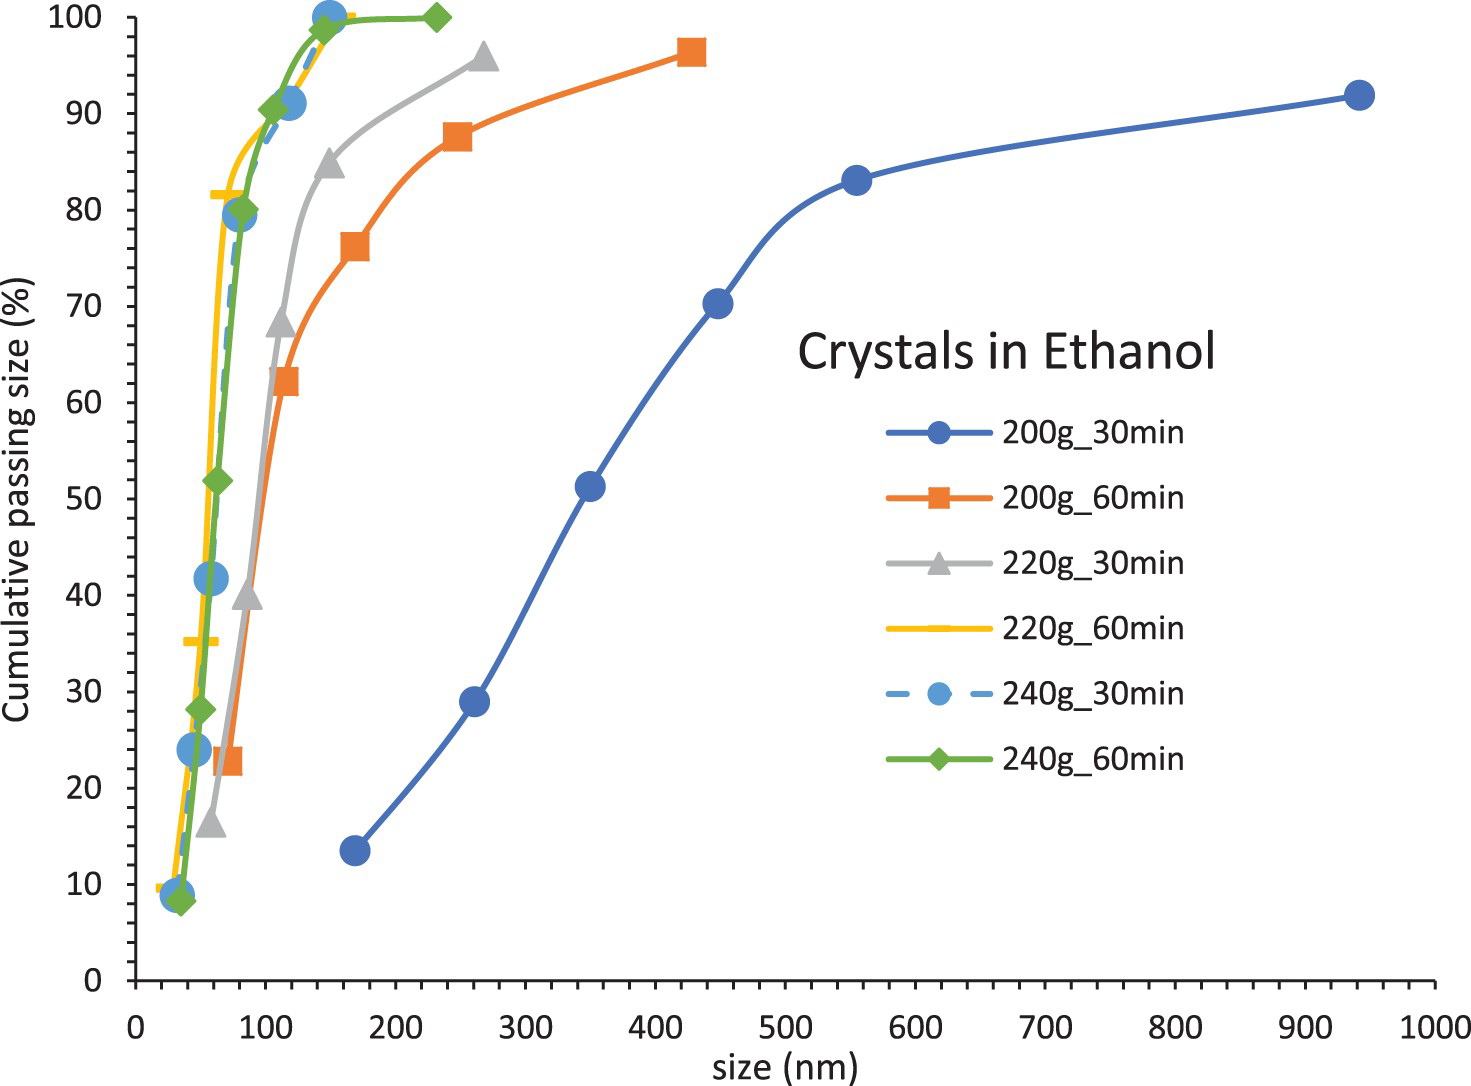
The more the copper sulfate, the more the nucleation sites, and consequently the finer the size of the formed crystals. Three different tests were conducted with the ethanol anti-solvent (Process #3–5). The results proved that in the magma with 200 gr of CuSO4.5H2O (process#3) (Figure 6), the mean crystal size became smaller in comparison with the previous processes (Process#1). All in all, in the presence of ethanol antisolvent, the mean crystalline size decreased from 261 to 63
The CSD of the crystallization processes affected by ethanol antisolvent: Process#3 with 200 g, Process#4 with 220 g, and Process#5 with 240 g of CuSO4.5H2O. in 30 min as a result of increasing CuSO4.5H2O from 200 to 240 g, respectively. As demonstrated in Figure 6, in the crystallization process by using anti-solvent, the size of the crystals could be declined due also to the high-speed stirring. In 220 g of copper sulfate (Process#4), according to the CSD, the percentage of larger particles was reduced by increasing the CuSO4.5H2O weight. And, the crystal size decreased accordingly. In general, the percentage of larger particles increased by augmenting the crystallization time. Still, in Process#3, the percentage of smaller particles in the two sampling time intervals was more than the other processes due to the dissolution of copper sulfate. In summary, Figure 6 shows that the addition of ethanol may reduce the mean crystal size. In the presence of the antisolvent, the very interesting general trend was decreased crystalline size with increased crystallization time which not only prevent to grow the crystals but decrease also the crystalline size. It may be postulated that increasing the crystallization time at these conditions could disperse the weakly agglomerated crystals. Additionally, from morphological point of view, utilization of ethanol as antisolvent could cause relatively sharp and rough surfaces in comparison with the processes #1 and #2 in which the surfaces were almost smooth. The most probable reason for this phenomenon may be the fast and highly numerous nucleation in the processes #3 to #5. At the same conditions, the CSD was shifted to the left side of the plot indicating the significant reduction in crystalline size with increased time (Figure 6).
Analysis of nucleation and growth in the presence of ethanol
The general effects of the process parameters on the nucleation and growth were studied to obtain an empirical correlation. To evaluate the population density and, thus, the kinetics of the nucleation and growth of CuSO4.5H2O crystals, two main parameters, i.e. mean size of the crystals and the magma density were studied. Two intervals, that is, 30 and 60 min were selected to the CSD analysis. The two sets of data, each including population density for different classes of the crystal size, were utilized to estimate the kinetic parameters. In the current research, the measured magma densities were in the range of 39–73 mg/L. The curve of population density in the samples in 30 and 60 min indicated that increasing CSD led to decreasing the population density. Figure 7 shows the population density which increased with increasing the residence time. To determine the crystallization kinetic parameters in Equations (10 and 11), the least square method was employed. The objective function was to minimize the difference between the measured and the predicted nucleation rates:.
Typical population-density curves of CuSO4.5H2O crystals obtained for (a) Process# 3 (200 g), (b) Process# 4 (220 g), and Process# 5 (240 g).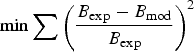


 is in g/g.
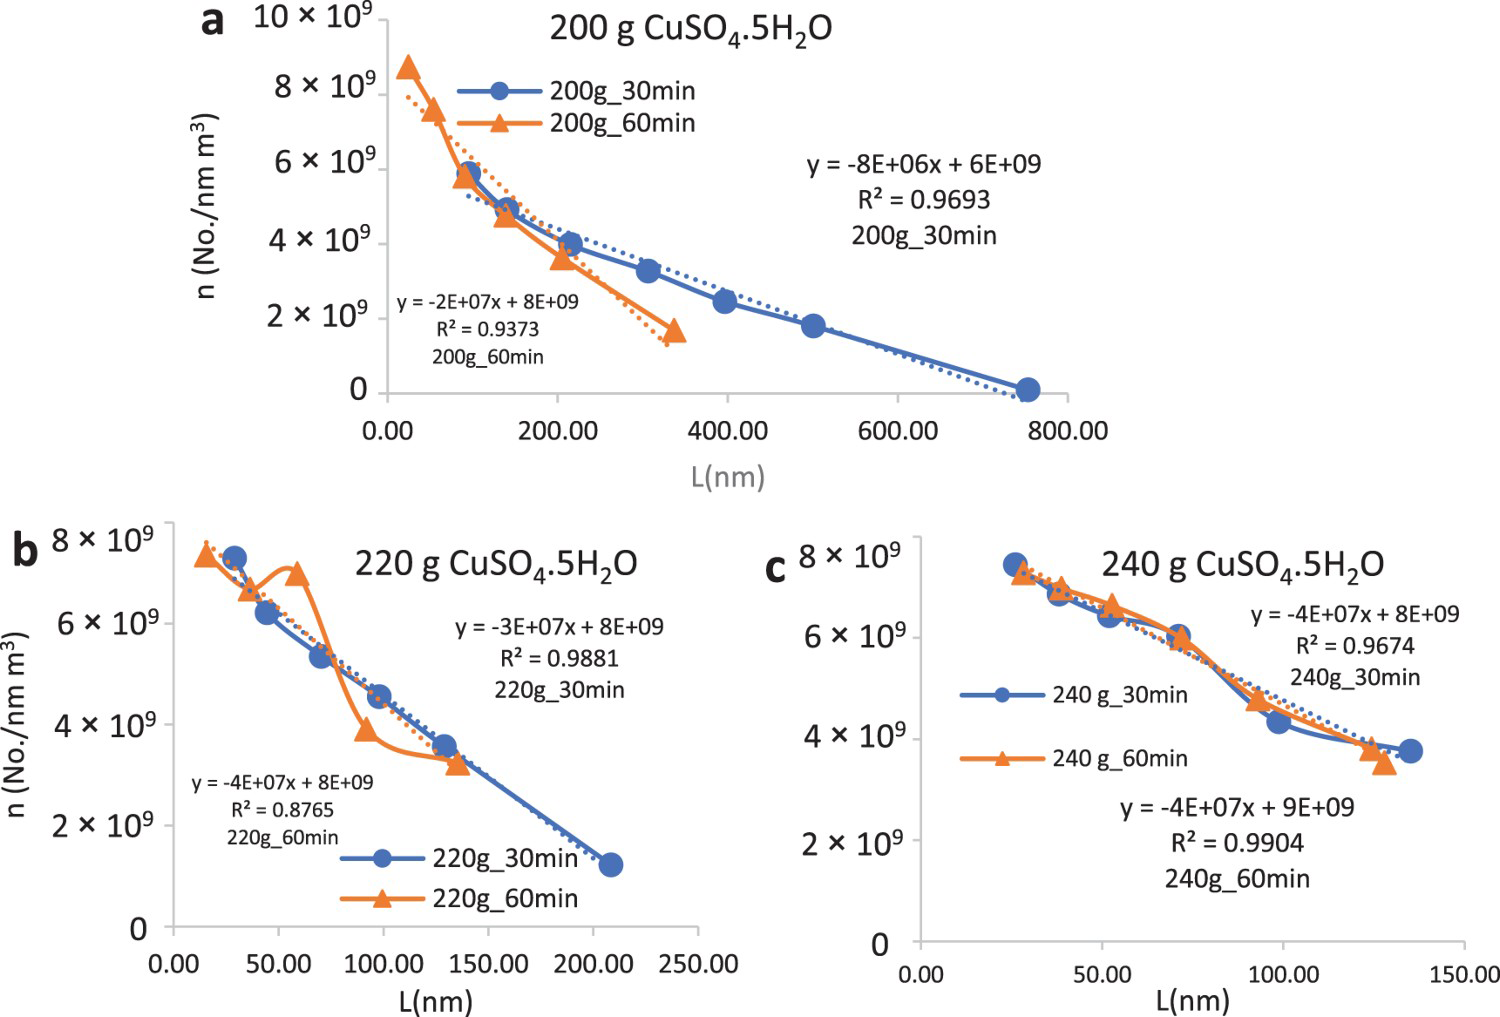
Interestingly, the population density was not significantly changed with increasing the residence time. It may be concluded that at higher amounts of sulfate (220 and 240 g of CuSO4.5H2O) meaning also the lower concentration of the antisolvent, the fast nucleation of the crystals could be occurred, and consequently, increasing the crystallization time could not significantly affect the population density. This conclusion is in line with the Figure 6 in which the CSD was shifted to the left side of the plot with increasing the CuSO4.5H2O weight, but the CSDs were not changed with increased residence time of crystallization.
Conclusion
In an attempt to optimize the crystallization process of CuSO4.5H2O crystals, we found that the parameters of the cooling rate and antisolvent significantly influenced the CSD, the controlling of which was possible through manipulation of the parameters. Regarding the results obtained from the crystallization processes at Process#1 (the slow cooling conditions), it was concluded that the size of the crystals increased with the increased cooling time meaning the gradual cooling process. In the slow cooling process, raising the cooling time from 30 to 60 min boosted the average size of the crystals. However, no change in the crystal sizes was observed in the fast cooling process by increasing the cooling time. Thus, the type of crystallization process was the affecting factor in the size of the crystals. In other words, with respect to the process mechanism, the temperature parameter can be considered as one of the most principal factors influencing the crystalline size, increasing of which made apparent decrease in the population density. In the presence of ethanol antisolvent, the CSD was almost completely controllable through tuning the concentration of CuSO4.5H2O in that increasing the concentration (from 200 to 240 gr of CuSO4.5H2O per liter) significantly reduced the mean crystalline size or shifting the CSD to the right side of the plot. At the beginning of the crystallization, since the numbers of nucleus and its abundance distribution were the most important factors affecting the crystalline size and the final product, based on the obtained results it was determined that nucleation rate was independent of the magma density. According to the SEM analyses, it was concluded that the crystal products with a smooth surface had a crystal system with a slow rate of nucleation, while those with a rough surface were the result of the fast rate of nucleation. XRD and EDS analyses confirmed the pure chalcanthite crystallization.
Footnotes
Acknowledgement
We would like to acknowledge the Research and Development Division Center of Sarcheshmeh Copper Complex for financial support.
Disclosure statement
No potential conflict of interest was reported by the authors.