
Abstract
In the current paper, extensive studies of the current authors on the modelling of non-metallic inclusions were summarised. Kinetic studies included the nucleation, collision and agglomeration of inclusions, the interaction between inclusion and bubble in the molten steel, the motion, collision, and removal of inclusions in the molten steel during refining and continuous casting and the entrapment of inclusions in a continuous casting slab strand. Thermodynamic studies included the deoxidation of steel and precise calcium treatment of Al-killed steels. The variation in the composition of inclusions during heating treatment of stainless steels was summarised. The studies ranged from nanoscale of molecules to sub-mili meter scale of inclusions within a meter scale metallurgical vessels, over 10 order in size, and clarified mechanisms for the generation, growth, motion and removal of inclusions in steel.
Keywords
Introduction
Non-metallic inclusions are the natural component of the steel due to two facts: one is the use of carbon materials to reduce the ferrous mineral ores into the iron, and the other is the complicated composition of the steel. Since carbon materials is used as the reducer during ironmaking, oxygen has to be injected into the hot metal to remove the excess carbon during steelmaking process, and a certain mass of alloys having metallic element more active than iron are used as deoxidiser so that oxide non-metallic inclusions generates. The complicated composition of the steel provides kinds of metallic elements that can react with the dissolved oxygen and sulfur during refining process of the molten steel so that non-metallic inclusions are naturally generated. It is impossible to remove all inclusions from the molten steel, especially it is very hard to remove sub-micro inclusions.
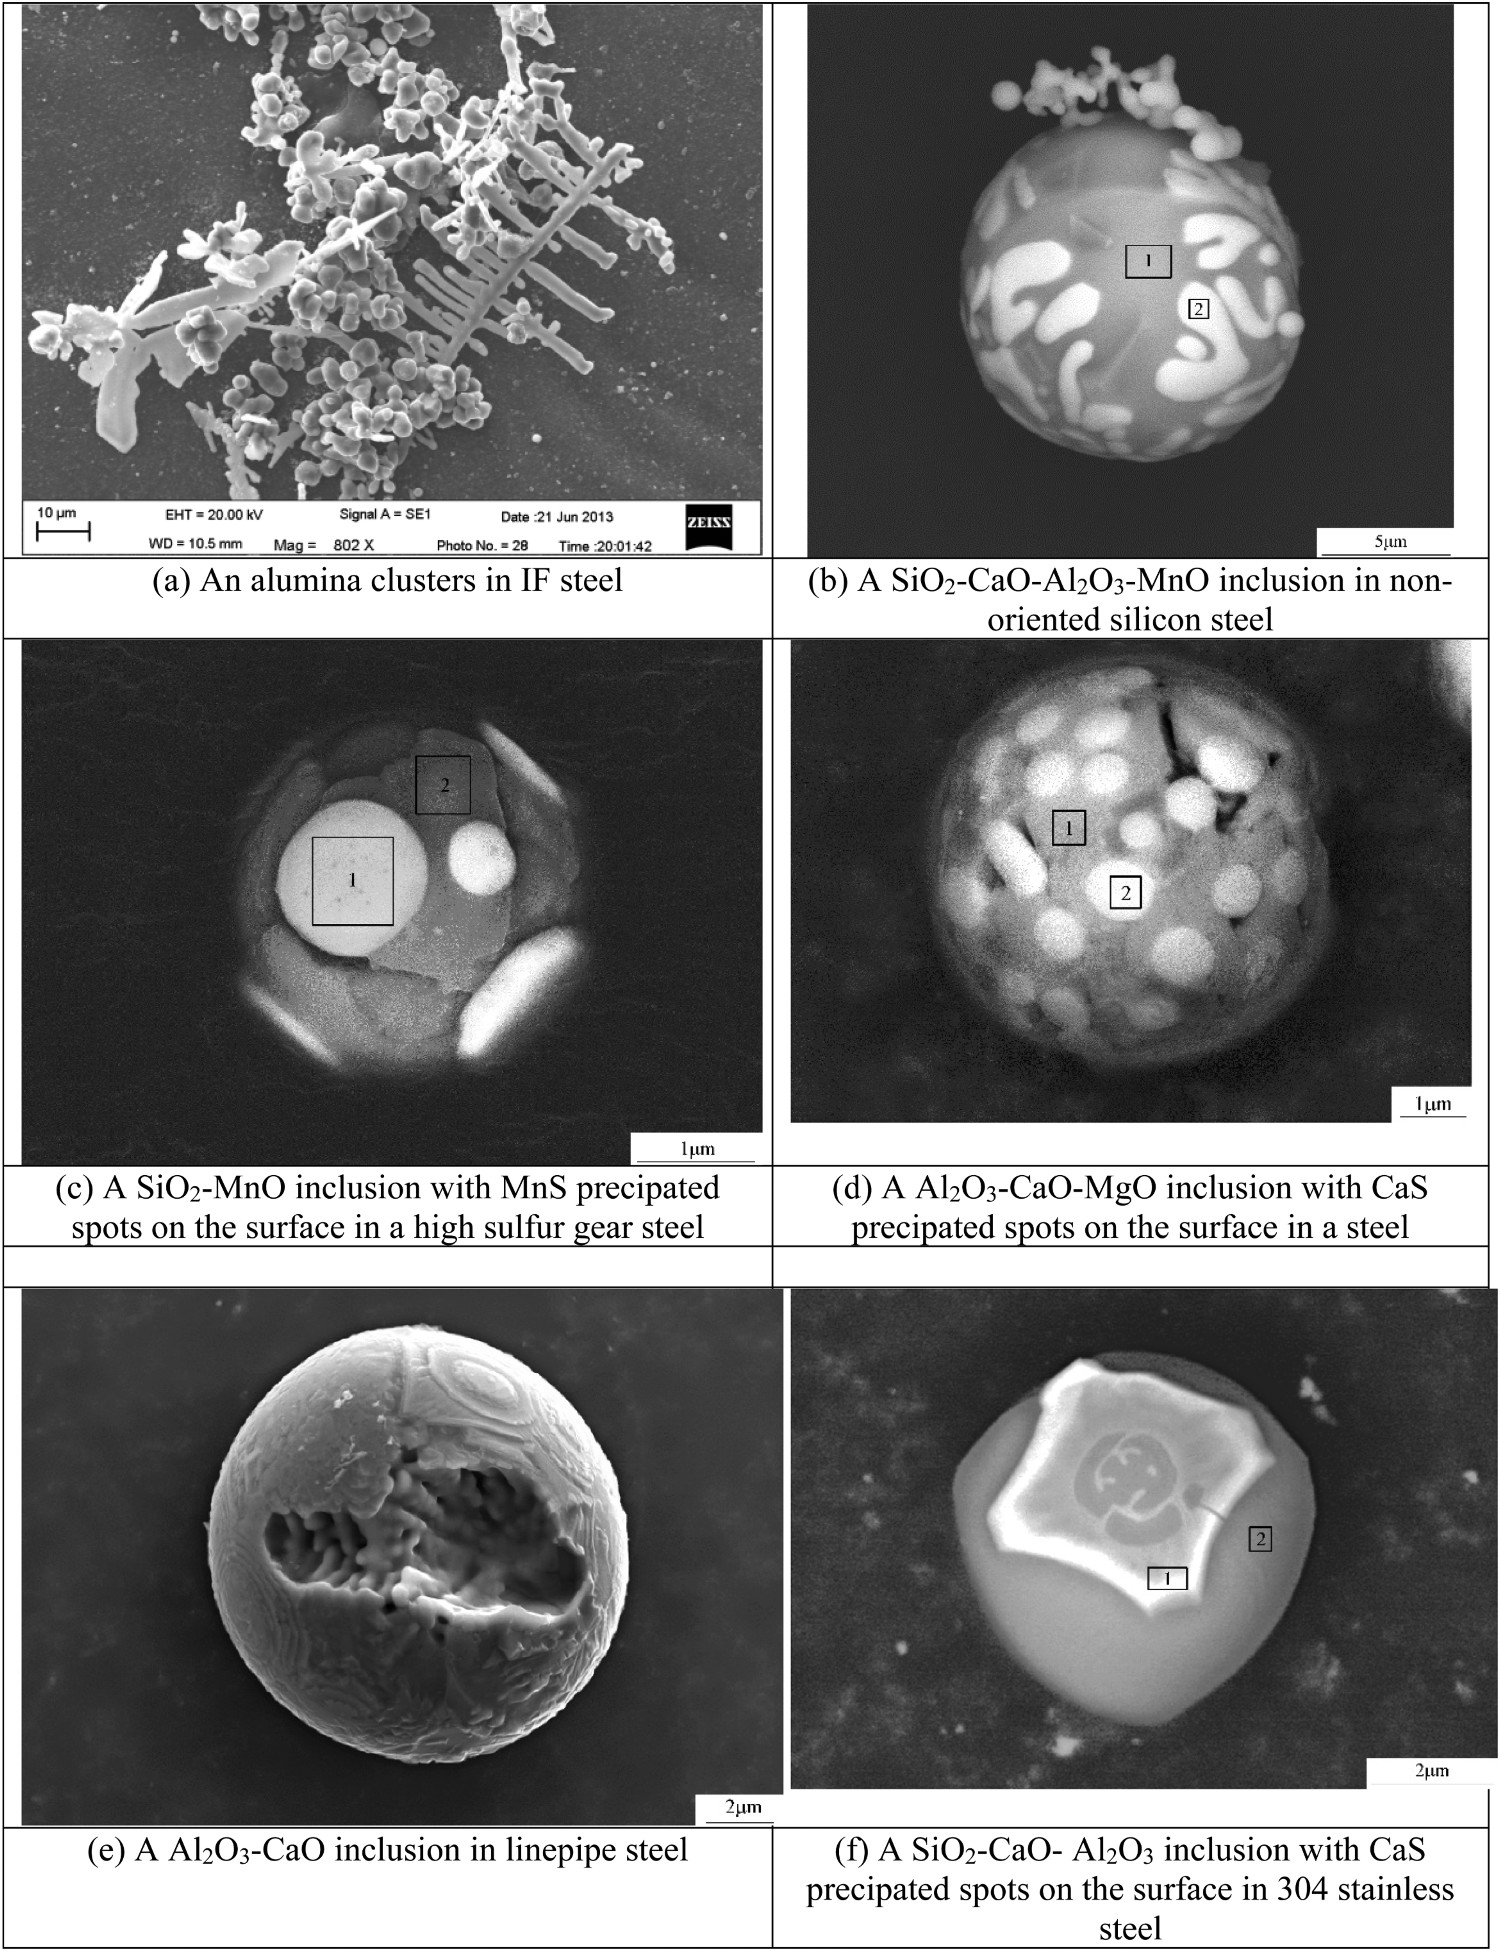
For a conventional steel plant, the molten steel produced in a basic oxygen furnace or electric furnace is tapped into a ladle for alloying and refining prior to casting. The first refining step is to deoxidise the steel by adding aluminum or silicon, or other elements with a thermodynamic affinity for oxygen in the form of a ferroalloy, in an argon-stirred vessel, sometimes in a vacuum degasser. Non-metallic inclusions nucleate by the reaction between alloy elements and the dissolved oxygen in the steel. The precipitated inclusions grow by colliding each other or by the diffusion of the dissolve elements named with Ostwald Refining. During the continuous casting process, the molten steel in the ladle flows into the tundish, and then exits down through a ceramic submerged entry nozzle and enters the mould. In the mould strand, molten steel flows within the solidifying steel shell and the flow can either encourage the removal of inclusions to the top slag layer, or generate defects in the casting product by bringing inclusions deeper to be entrapped in the solidification front (Zhang 2013). The typical morphology of oxide inclusions is shown in Figure 1 (Zhang 2019a, 2019b).
Steel cleanliness depends on the number, morphology, composition, size distribution of inclusions, as well as the spatial distribution of inclusions in the steel product. The methods to minimise inclusions mainly include the control of the composition of steel, slag, and refractory and the control of the fluid flow pattern in each vessel during refining and continuous casting of the molten steel. The size distribution is particularly important since large inclusions are the most harmful to mechanical properties of the steel. The deformability of inclusions is also important since tough and hard inclusions are more damaging than soft or brittle ones that can deform or break up during subsequent rolling and working operations (Zhang L, Guo, et al. 2018). The dominant factors having an influence on the deformability of inclusions during the casting, rolling and processing of the steel will be under hot investigation in next a few years. Entrapped inclusions with a poor deformability lead to internal cracks, slivers, and blisters in the final rolled product. For example, the ‘pencil pipe’ defect on the steel plate used for automobiles is caused by argon gas bubbles capturing alumina-based inclusions that are entrapped in the solidifying shell in the continuous casting and are broken in a line during the rolling process of the steel (Rocabois et al. 2003; Zhang et al. 2006; Zhang 2013). During steel rolling, rigid inclusion clusters elongate to create long slivers in the final product and large spherical inclusions either elongate into continuous or broken lines or are broken into pieces, as shown in Figure 2 (Li et al. 2014). These intermittent defects are particularly costly because they are often hardly detected until after painting the finished plate.
The morphology and composition of a chain like CaO-CaS inclusion on a steel plate inducing the ultrasonic test defects (Li et al. 2014).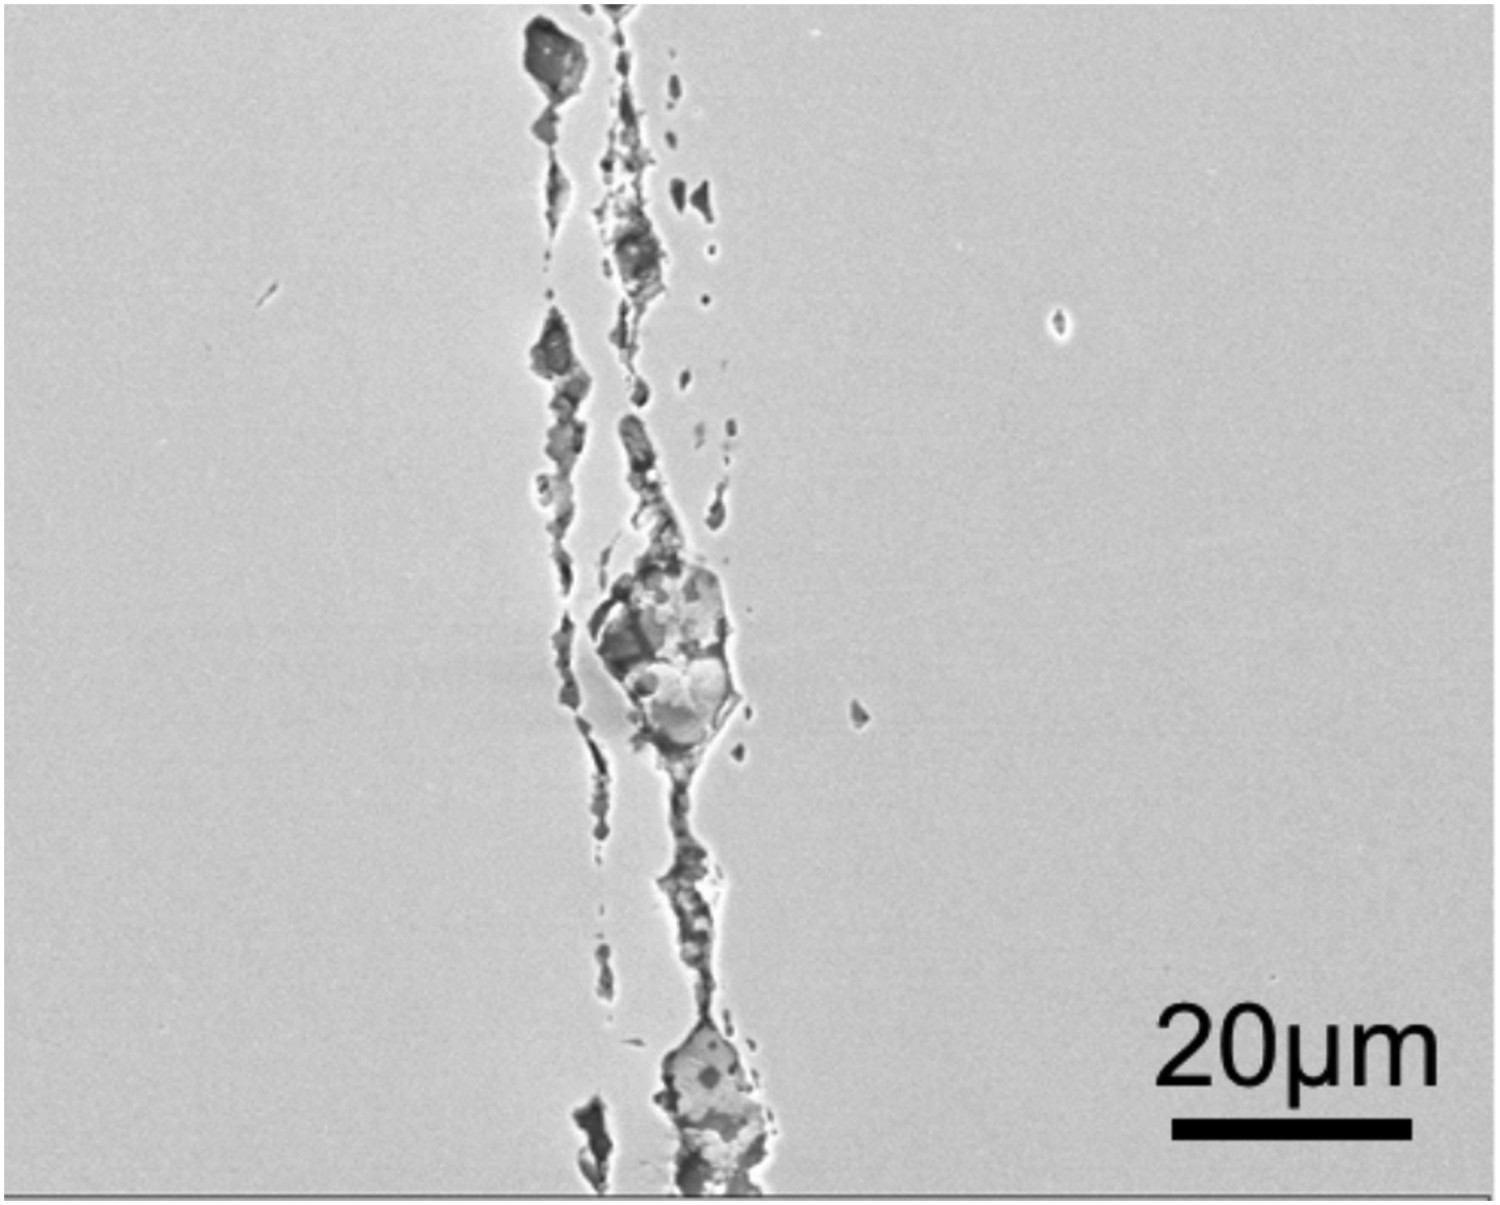
The optimal strategies to control inclusions well can hardly be found until the formation and removal mechanisms of inclusions can be properly quantified and compared. Thus, there is a great incentive to understand the formation mechanism of inclusions, and to develop models for the formation of inclusions in the steel. The research of the current authors focused on non-metallic inclusions in steel nearly thirty years, including the nucleation of inclusions during dexidation of the steel (Zhang and Pluschkell 2003; Zhang 2013; Yang et al. 2015; Li et al. 2018; Liu and Zhang 2018; Liu, Zhang, Zhang, Duan et al. 2018; Liu, Zhang, Zhang, Ren, et al. 2018; Zhang Y et al. 2018; Duan, Ren, et al. 2019; Duan et al. 2019c), the motion and removal of inclusions during steel argon stirring process (Yang et al. 2013; Guo et al. 2017; Zhang et al. 2017; Duan, Ren, et al. 2018; Duan, Zhang, et al. 2018; Ren and Zhang 2018; Duan et al. 2019a; Duan, Zhang, et al. 2019), RH vacuum degassing (Zhang and Li 2014; Ling, Li, et al. 2016; Ling, Guo, et al. 2017; Ling, Zhang, and Liu 2017; Duan, Ren, et al. 2018; Duan, Zhang, et al. 2018; Ling and Zhang 2018a, 2018b, 2019; Ling et al. 2018; Liu et al. 2019), continuous casting tundish (Zhang et al. 2000; Zhang 2005, 2010; Ling and Zhang 2013; Li et al. 2016; Ling, Zhang, et al. 2016; Ling, Zhang, and Wang 2017; Ren, Zhang, et al. 2017) and mould strand (Zhang et al. 2006; Zhang et al. 2008; Wang et al. 2011, 2013; Wang, Zhang, Sridhar, et al. 2016; Wang, Zhang, Wang, et al. 2016; Ren et al. 2018, 2019; Zhang X, Ren, and Zhang 2018; Zhang X, Ren, Zhang, and Yang 2018; Zhang X, Wang, et al. 2018; Zhang X, Chen, Ren, et al. 2019; Zhang X, Chen, Scheller, et al. 2019; Jiang et al. 2019; Zhang L, Zhang, Ren, et al. 2019), capturing of inclusions in the continuous casting strand and final entrapped location of inclusions in continuous casting slabs, (Zhang and Wang 2012; Ren et al. 2014; Chen, Li, et al. 2019) and transformation of inclusion during the solidification and cooling of molten and solid steels (Yang et al. 2017; Ren, Pistorius, et al. 2017; Zhang et al. 2017; Liu, Zhang, Zhang, Duan, et al. 2018; Luo, Liu, et al. 2018; Luo, Yang, et al. 2018; Luo, Zhang, et al. 2018; Wang, Ren, et al. 2018; Wang, Zhang, et al. 2018; Zhang L, Liu, et al. 2018; Cheng et al. 2019; Chen, Ren, and Zhang 2019; Chen, Ren, Zhang, and Scheller 2019; Luo, Li, et al. 2019; Luo, Zhang, et al. 2019; Wang, Li, et al. 2019). The author also published two 1.5-million-word books named by ‘Non-metallic Inclusions in Steel: Fundamentals’ (Zhang 2019c) and ‘Non-metallic Inclusions in Steel: Industrial Practice’ (Zhang 2020).
Kinetic modelling of non-metallic inclusions in molten steel
Nucleation and growth (Zhang and Pluschkell 2003)
In 2002, the current author described the mechanisms controlling the evolution of inclusions (Zhang and Pluschkell 2003), as shown in Figure 3 (Zhang 2013). After adding and dissolving the deoxidiser alloy, oxide particles nucleate, precipitate, and quickly grow. This stage is mainly controlled by the diffusion of deoxidiser elements and oxygen. ‘Ostwald-ripening’ causes larger particles to grow and smaller particles to shrink. Brownian motion of small particles contributes to the growth of <2 μm inclusions by random collision. After particles grow large enough, collisions in turbulent fluid flow become effective in the further growing of the inclusions. Buoyancy rising, bubble attachment, and fluid transport remove large inclusions from the bulk melt and transfer them to the top slag or to the refractory walls of the vessel. Small inclusions and some big inclusions remain in the liquid steel and are passed downstream to the next processing step. This general progression of inclusions is also disturbed by the oxygen absorption from the surroundings and by the slag emulsification.
Scale and control mechanisms during inclusion nucleation, growth and removal in steel (Zhang 2013).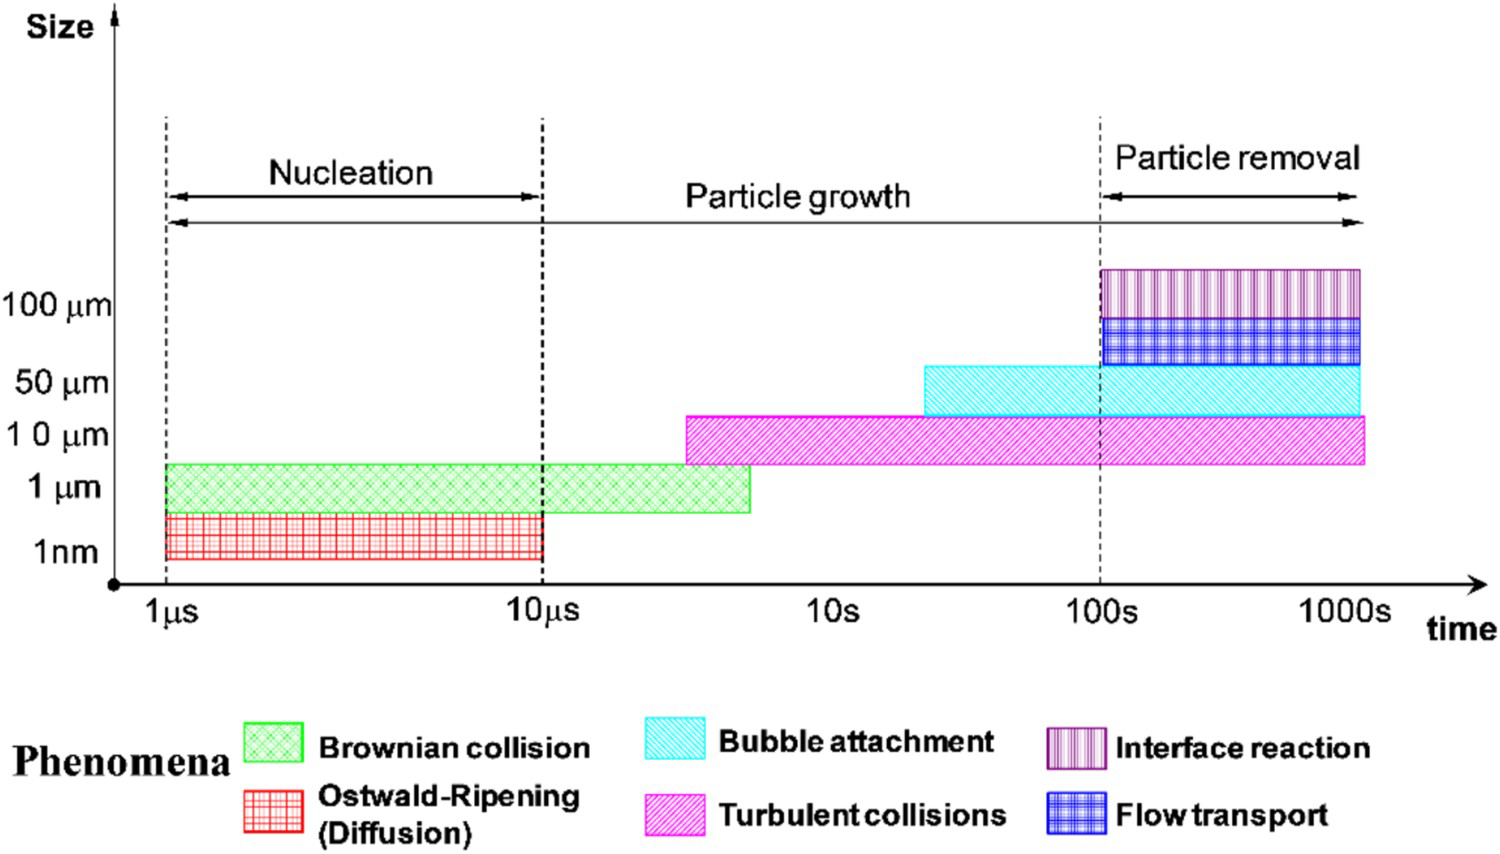
The metallurgical terms of the deoxidation of liquid metal by addition of an element with high oxygen affinity can be written as.


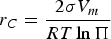
The classical nucleation theory gives the critical radius of nucleus rc as Equation (3).
If
 , nucleation occurs, and stable particles precipitate and start to grow. The critical size of nucleus decreases with increasing supersaturation and decreasing surface tension. Because supersaturation evolves with time during the deoxidation process, the critical nucleus size also evolves with time.
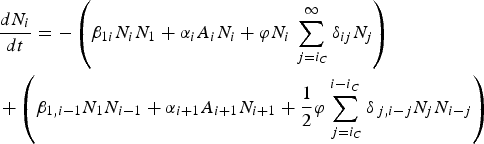
The time evolution of the group size Ni of inclusions is governed by the following particle number balance equation.
When r < 1 μm, the particle growth is dominated by diffusion of pseudo-molecules (Ostwald-ripening) and Brownian collision of particles. The irregular thermal motion that characterises Brownian collisions is independent of fluid flow, and is not directional. Thus, inclusions tend to grow in every direction, leading to a spherical product. When r > 2 μm, particle growth is dominated by the turbulent collision of particles. The inclusion morphology tends to become more jagged and it can retain a cluster shape. Thus, 1∼2 μm is a size threshold where the growth mechanism of inclusions changes.
Figure 4 shows the supersaturation, the critical nucleus size and the dimensionless number density of pseudo-molecules as a function of time. After aluminum addition, the aluminum and oxygen react to form pseudo-molecules. Groups of pseudo-molecules are generated from random diffusion only. With the further addition and dispersion of aluminum, the concentration of pseudo-molecules continues to increase. The supersaturation reaches 1 at time t*1. With further increase of the supersaturation, the critical radius rc decreases. After the incubation period t*2 (t2 = 0.53μs) groups of pseudo-molecules become equal to rc (ic = 42; rc = 8.3 Å), particles of this size nucleate, precipitate and start to grow. The supersaturation gradually increases to its maximum (46.7) at time t*3 = 8.07 (t3 = 3.40 μs). The nucleus size decreases correspondingly to its smallest configuration (ic = 10; rc = 5.15 Å). Nucleation is possible only during the time period t*2∼t*4 (0.53∼6.58 μs). After time t*4, no new particles nucleate. The supersaturation is asymptotic to 1 (equilibrium) as time approaches infinity. Stable particles remaining in the melt continue to grow by diffusion of pseudo-molecules and collision with other inclusions, or dissolve by Ostwald-ripening. Thus, the total number of particles gradually decreases after t4.
The evolution of the supersaturation, the critical size of nucleation and the dimensionless total number of alumina molecules after adding aluminum into a molten steel originally containing 300 ppm dissolved oxygen (Zhang and Pluschkell 2003).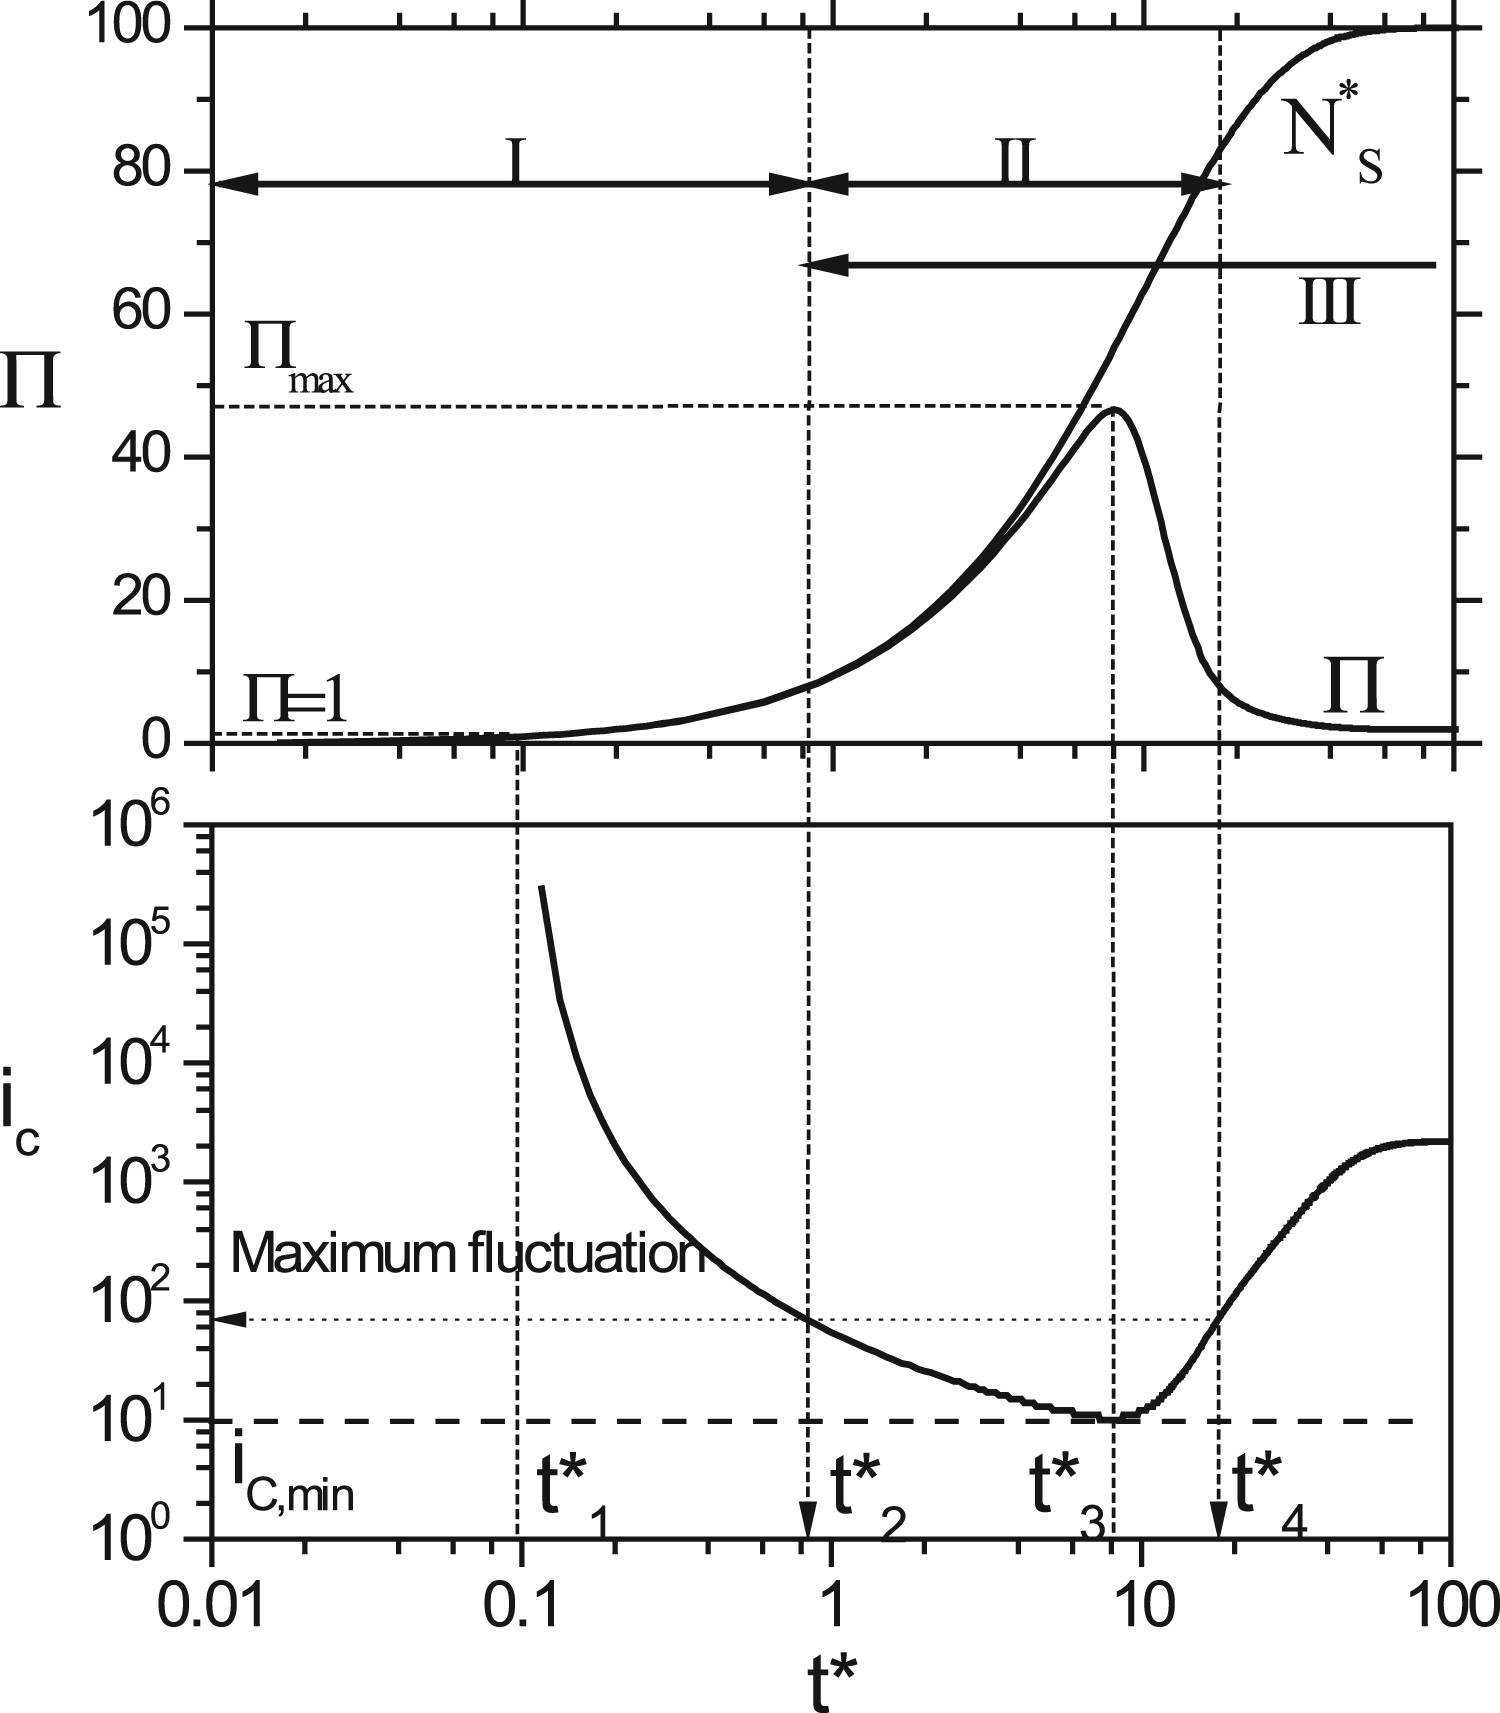
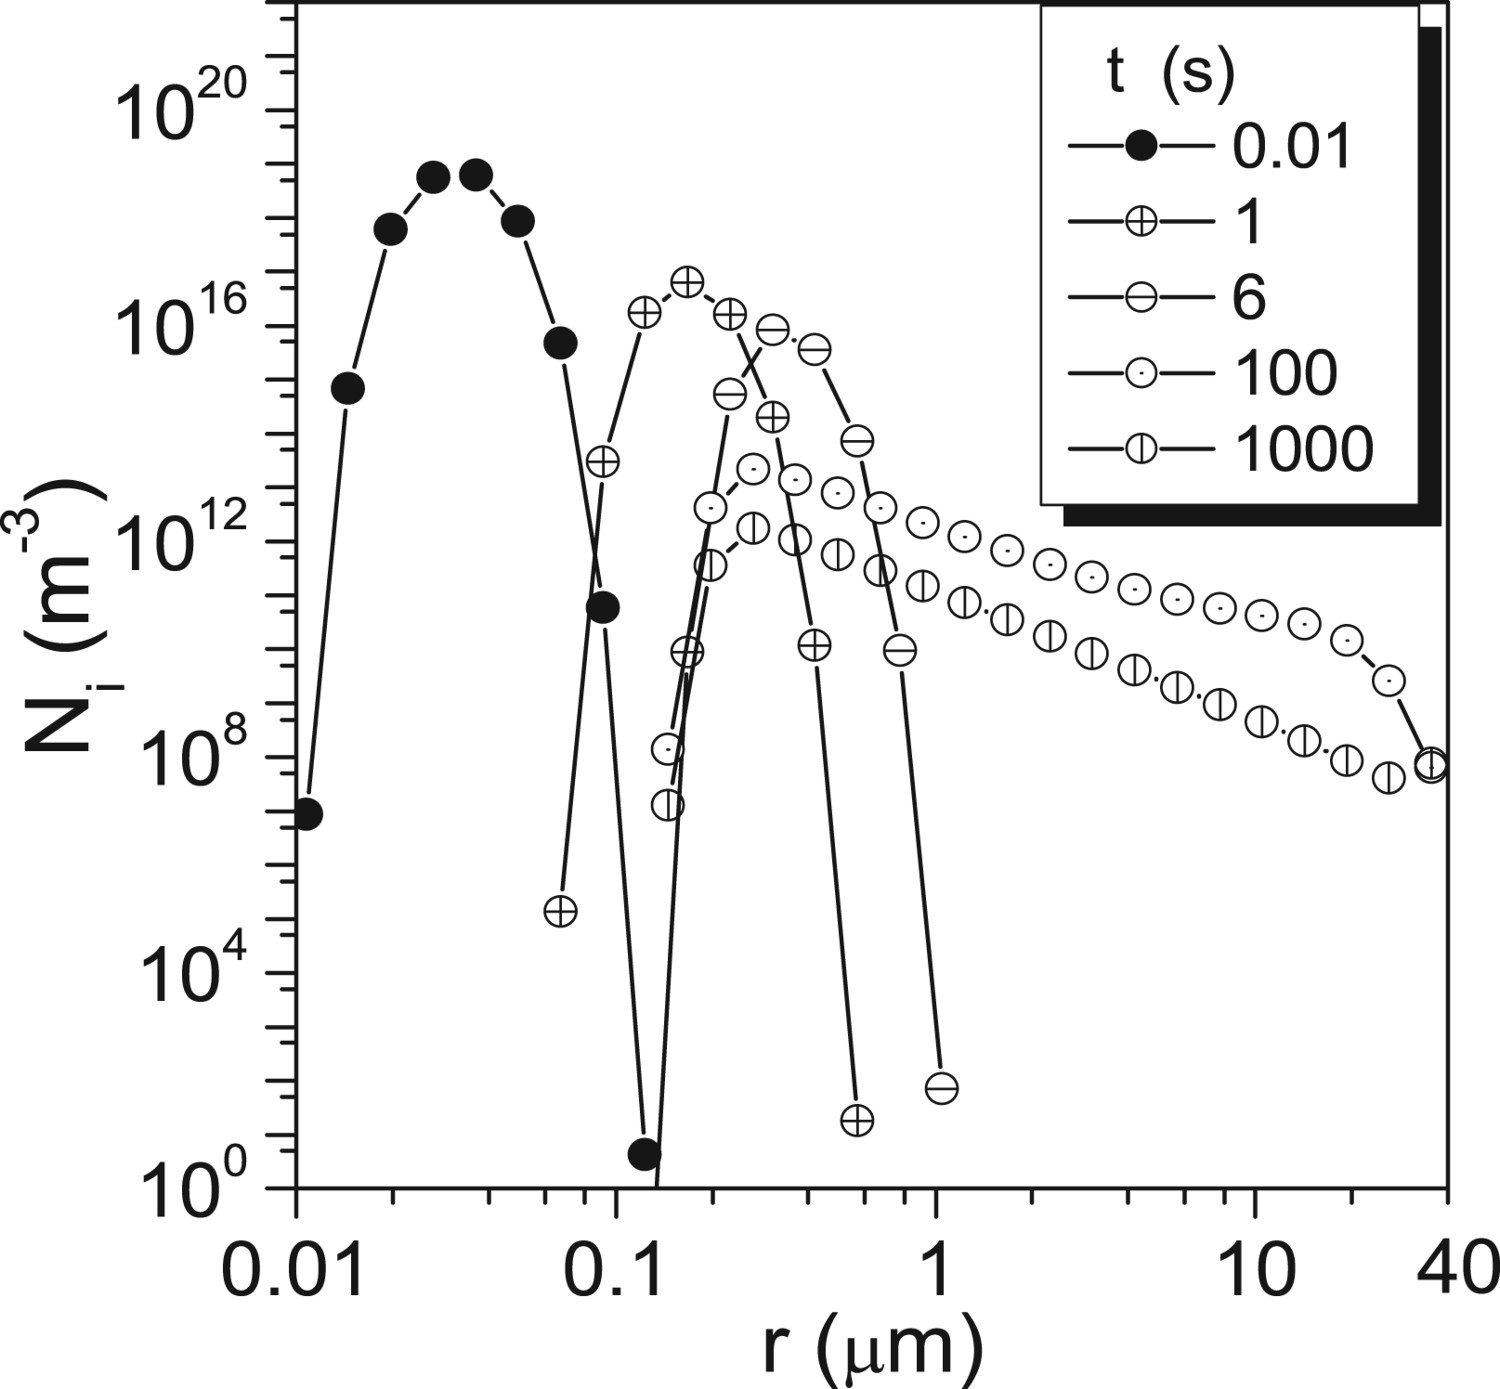
Figure 5 shows the calculated evolution of the particle population at different times. The number density of smaller inclusions decreases with time while that of the larger ones increases due to diffusion and Brownian collision. As shown in Figure 6, inclusions can precipitate and grow by diffusion of pseudo-molecules, and by collision with other inclusions, which starts a size distribution range. With increasing time, this size distribution range becomes larger and larger. After 6 s, the largest inclusion is approximately 2 μm in diameter, which agrees roughly with industrial experience. It takes about 100 s for the inclusions to grow into several tens of microns, which agrees well with the study of Kawawa and Ohkubo (1968).
Size distribution at different times (Zhang and Pluschkell 2003). Inclusion size distribution as a function of time (Zhang and Pluschkell 2003).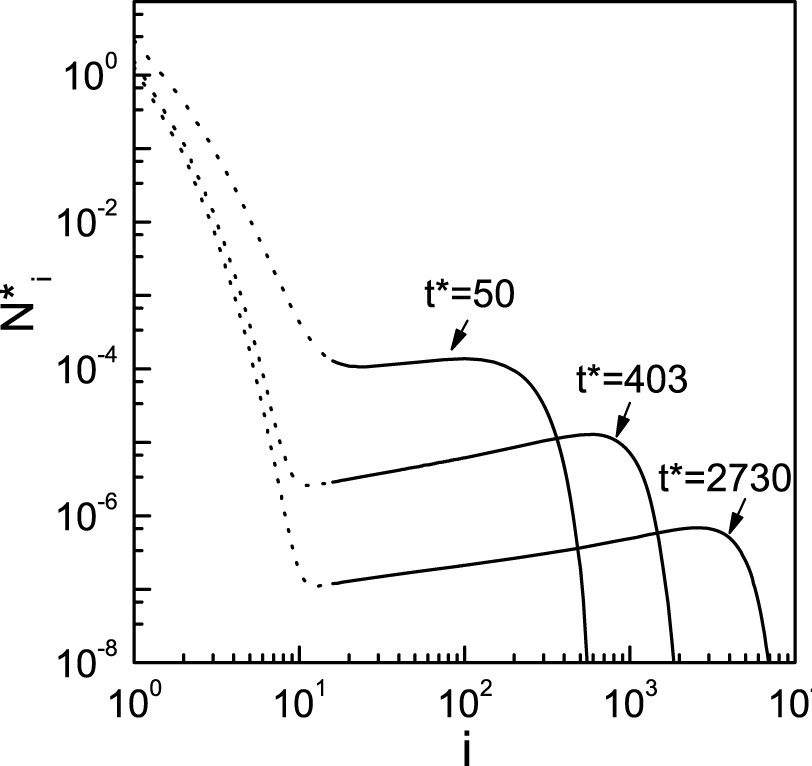
Initial agglomeration between two solid inclusions (Duan, Ren, et al. 2019)
After collision, small inclusions agglomerate into large ones or into large solid cluster ones that are detrimental to the mechanical properties and can easily deposit on the submerged entry nozzle causing clogging (Zhang et al. 2008; Li et al. 2009; Long et al. 2010). Thus, understanding the agglomeration mechanism of inclusions in molten steel is of great importance. Generally, the solid inclusions are non-wetted in the molten steel, such as 136o for alumina inclusions (Nogi and Ogino 1983) and 102o for silica inclusions (Ogino et al. 1973). Agglomeration is easily occurred among those inclusions to form clusters. Figure 7 shows the example of the agglomeration of alumina inclusions in IF steel.
Agglomeration of alumina inclusions in IF steel (Duan, Ren, et al. 2019).
Recently, the cavitation theory (Yaminsky et al. 1983; Yushchenko et al. 1983; Pashley et al. 1985; Christenson and Claesson 1988) that the liquid spontaneously expelled from the gap between solid particles to form a cavity as the solid particles approach each other was used to explain the agglomeration of inclusions in the molten steel. When two solid inclusions approach each other in the molten steel with a narrow space, a gas cavity is formed between inclusions due to the poor wettability, as shown in Figure 8.
Schematic of cavitation between inclusions (Duan, Ren, et al. 2019).
Based on the theory of interfacial chemical interactions, the free energy change during inclusion approaching is considered to involve three parts:
Total free energy change as a function of neck radius at different separation for alumina inclusions of 1 μm in radius (Duan, Ren, et al. 2019).
Figure 10 illustrates the typical curve of total free energy change with respect to the neck radius. Firstly, the total free energy change increases with the increase of the neck radius until reaching a local maximum. At the maximum, the system reaches the activation state and the maximum value represents the energy barrier for the cavitation. Subsequently, the total free energy change starts to decrease with the neck radius further increasing. The stable state is achieved by minimising the total free energy with respect to the neck radius when the cavity grows beyond the activation state. For the case of inclusions contacting each other, the stable energy reaches the minimum with respect to separation. Meantime, the system is also at the lowest energy state and thus the cavity is at the most stable state. Clearly, once the inclusions move close to a critical separation and the cavity is formed, they will approach each other spontaneously until they contact due to the decreasing of the free energy, as shown in Figure 11. Consequently, the ultimate state of the system is achieved as the inclusions contact each other, which can be defined as the equilibrium state. The absolute value of the stable energy is defined as the equilibrium energy.
Definition of activation state, stable state and equilibrium state (Duan, Ren, et al. 2019). Definition of critical separation (Duan, Ren, et al. 2019).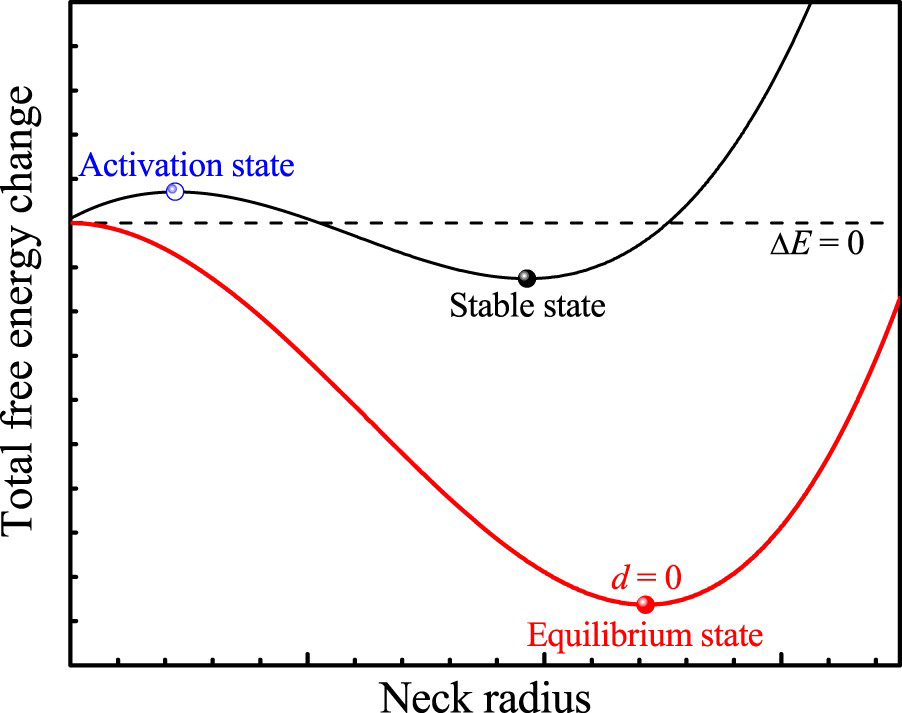
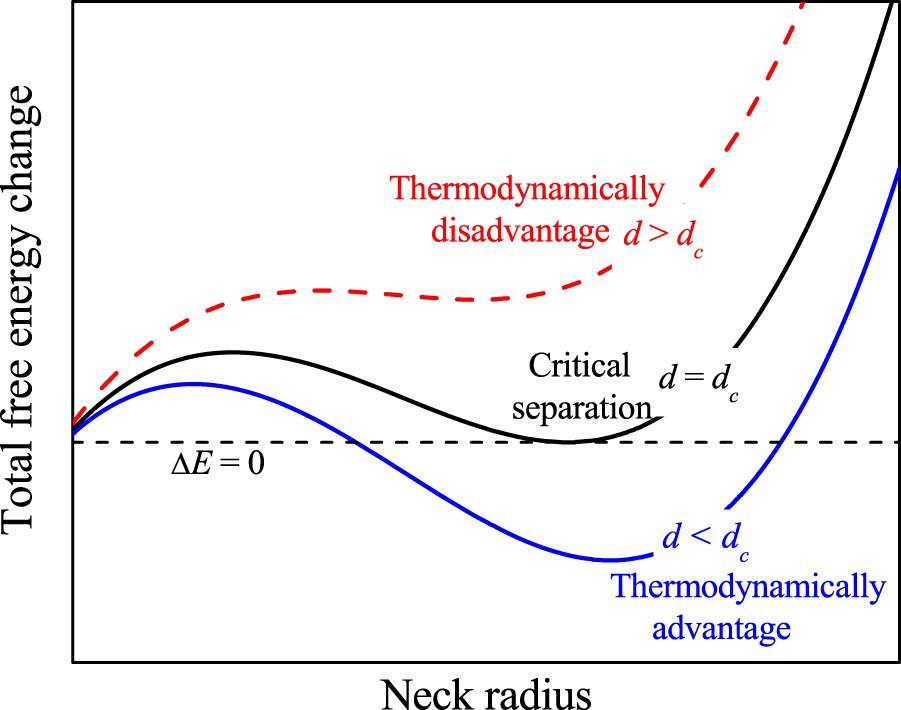
When a small gap appears between inclusions, the stable energy shows a negative value, indicating that the formation of the cavity is thermodynamically advantageous. However, with further increase in the separation, the stable energy increases beyond zero. At this moment, the formation of the cavity is thermodynamically disadvantageous. Thus, the critical separation is also achieved as the total free energy change turns into zero during the cavitation between spherical inclusions, as shown in Figure 11. Physically, the cavity can stable exist between inclusions only for the separation below the critical separation. It should be noticed that there still exists an energy barrier at the critical state. Thus, for the case of separation shorter than the critical separation, the cavity sustains spontaneous growth when the energy barrier has been overcome.
The agglomeration mechanism of solid inclusions in molten steel is proposed according to the free energy analysis, as shown in Figure 12. In the molten steel, the dispersed inclusions approach each other due to their random motion. Once the separation is shorter than the critical separation, the cavity is formed between inclusions when the energy barrier has been overcome. As shown in Figure 9, the system energy decreases during the approach process, and the lowest energy state is achieved when the inclusions contact each other. Thus, the inclusions continue to move close to each other spontaneously until contact to achieve the equilibrium state, which is the ultimate state of the cavitation. Sintering is occurred between inclusions after the equilibrium state. Future studies will focus on the sintering of solid inclusions in the molten steel that is the subsequent step after agglomeration.
Agglomeration mechanism of inclusions in molten steel (Duan, Ren, et al. 2019).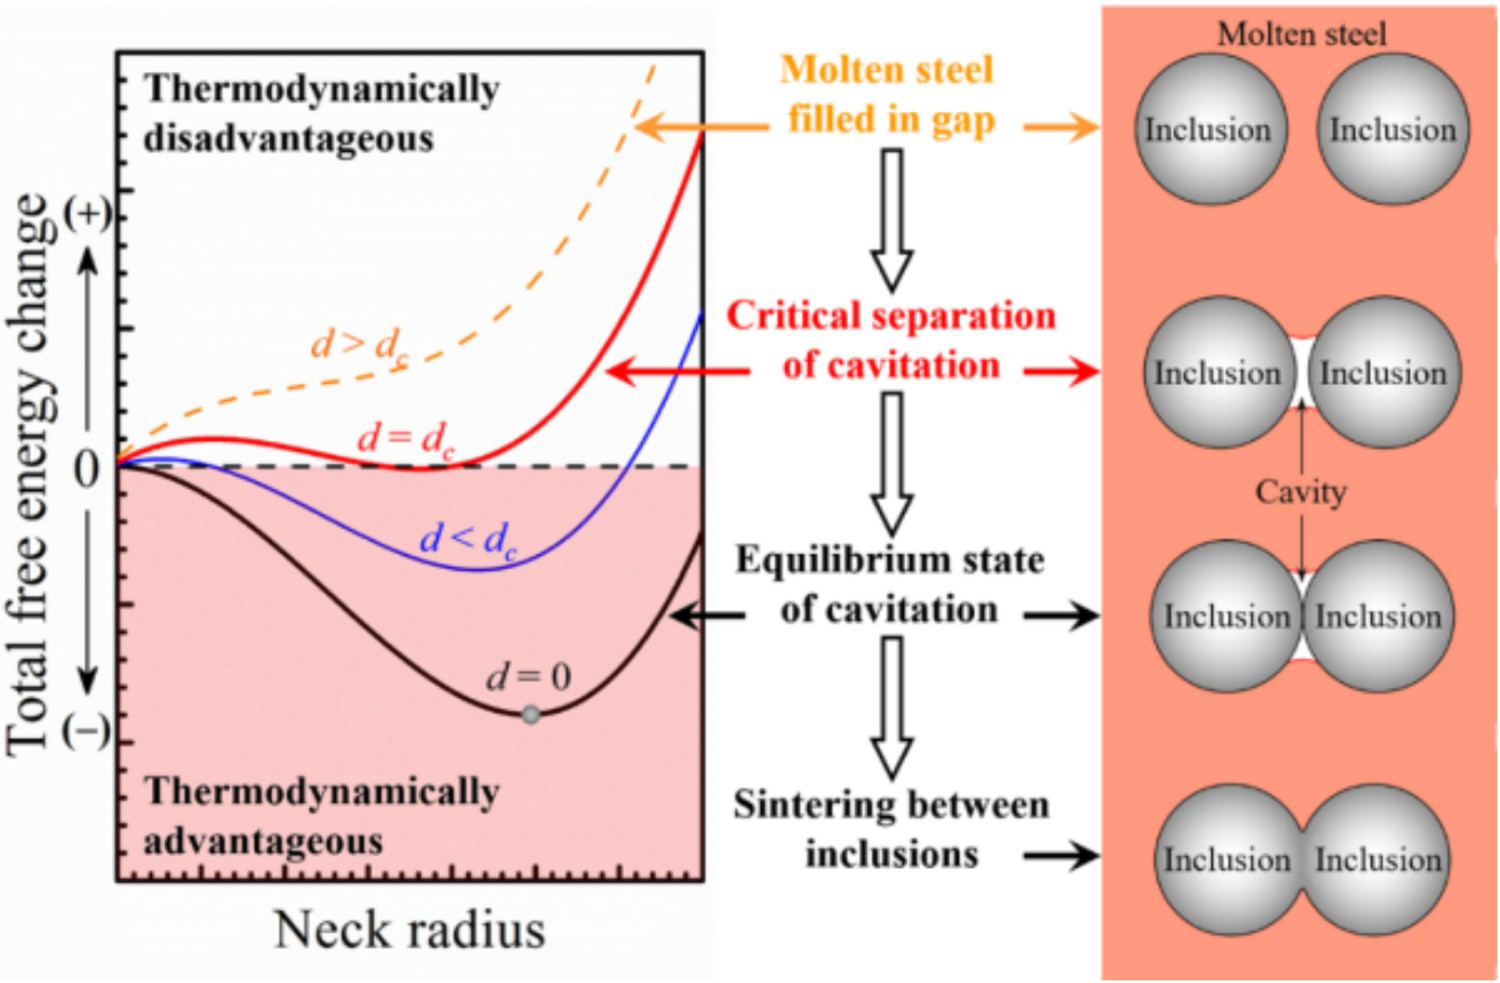
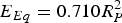
As discussed above, two crucial states are observed during cavitation: equilibrium state and critical state. The dependence of equilibrium energy and critical separation on the radius of inclusions is numerically calculated. It is novel for the present study to find that the equilibrium energy is a quadratic function of inclusion radius and the critical separation is directly proportional to the radius of inclusions.
The behaviour of inclusions in the molten steel is affected by the turbulent fluid flow. The contacted inclusions may breakup due to the random motion of the turbulence. It is assumed that the energy induced by the turbulence is the product of the inclusions mass and the local turbulence kinetic energy:
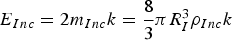
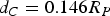
Physically, the equilibrium energy also represents the lowest energy that should be overcome for the disappearance of cavity between the contacted inclusions. Thus, combining Equation (8) with the equilibrium energy, the relationship between the turbulence kinetic energy which could separate the contacted inclusion and the radius of the inclusions is obtained for Al2O3 inclusions, as shown in Figure 13. Obviously, the smaller the inclusions are, the higher the turbulence kinetic energy is required to separate them. For micron scale inclusions, the local turbulence kinetic energy required to break the already contacted inclusions up should be larger than 1 m2/s2, while for millimetre scale inclusions, the value lies below 0.1 m2/s2. During the steelmaking process, the local turbulence kinetic energy hardly reaches 1.0 m2/s2 in the molten steel, as shown in Figure 13 (Lou and Zhu 2013; Duan, Ren, et al. 2018; Duan, Zhang, et al. 2018). Thus, the aggregation of the micron sized inclusions could exist in a stable state and the contacted inclusions are hardly separated by the turbulence.
Effect of local turbulence kinetic energy on inclusion agglomeration (Duan, Ren, et al. 2019).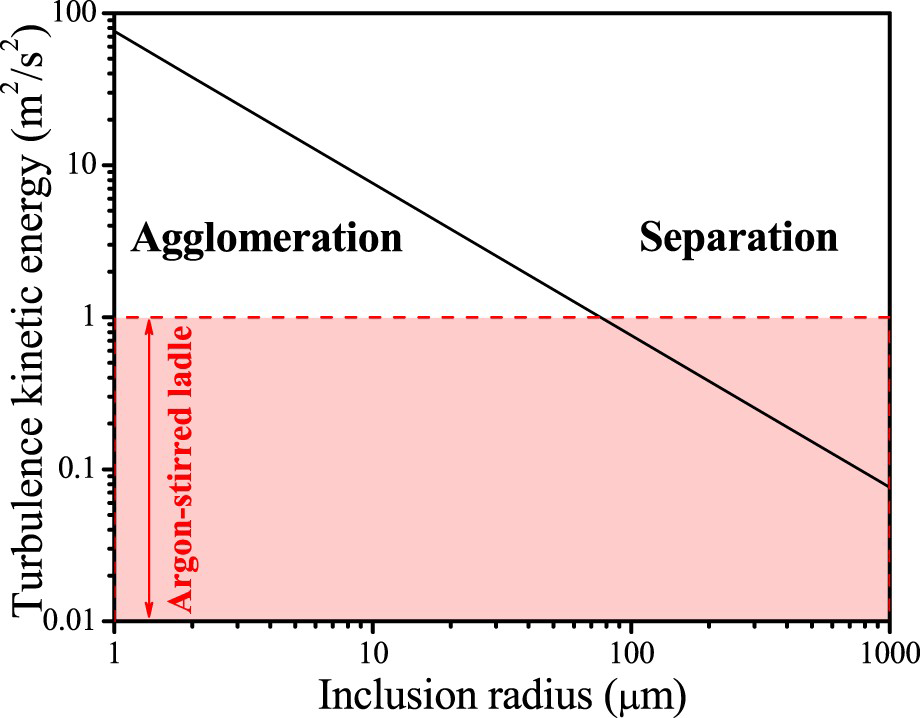
Interaction between inclusions and bubbles (Zhang et al. 2006; Duan et al. 2019b)
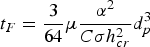
Removal of inclusions as many as possible from molten steel is a principal steelmaking objective since inclusions can lead to serious defects in the final product (Zhang and Thomas 2003). Gas injection is an effective approach to remove inclusions from the melt and widely used in secondary refining and continuous casting processes (Zhang et al. 2006). Based on the results from the field of mineral processing, Zhang and Taniguchi (2000) extensively reviewed and studied the fundamentals of inclusion removal from liquid steel by bubble flotation. For successful attachment, the formation and the rupture of the liquid film play a central role. The film drainage time, tF, is the period required for drainage of the liquid film before the critical film thickness is reached and rupture occurs. Schulze (1989) derived the film drainage time as:
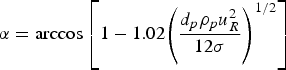

The conventional theory for the classic attachment probability is defined as the fraction of inclusions that pass the rising bubble and attach to it, which is related to the conditions of laminar fluid flow (Zhang et al. 2006):
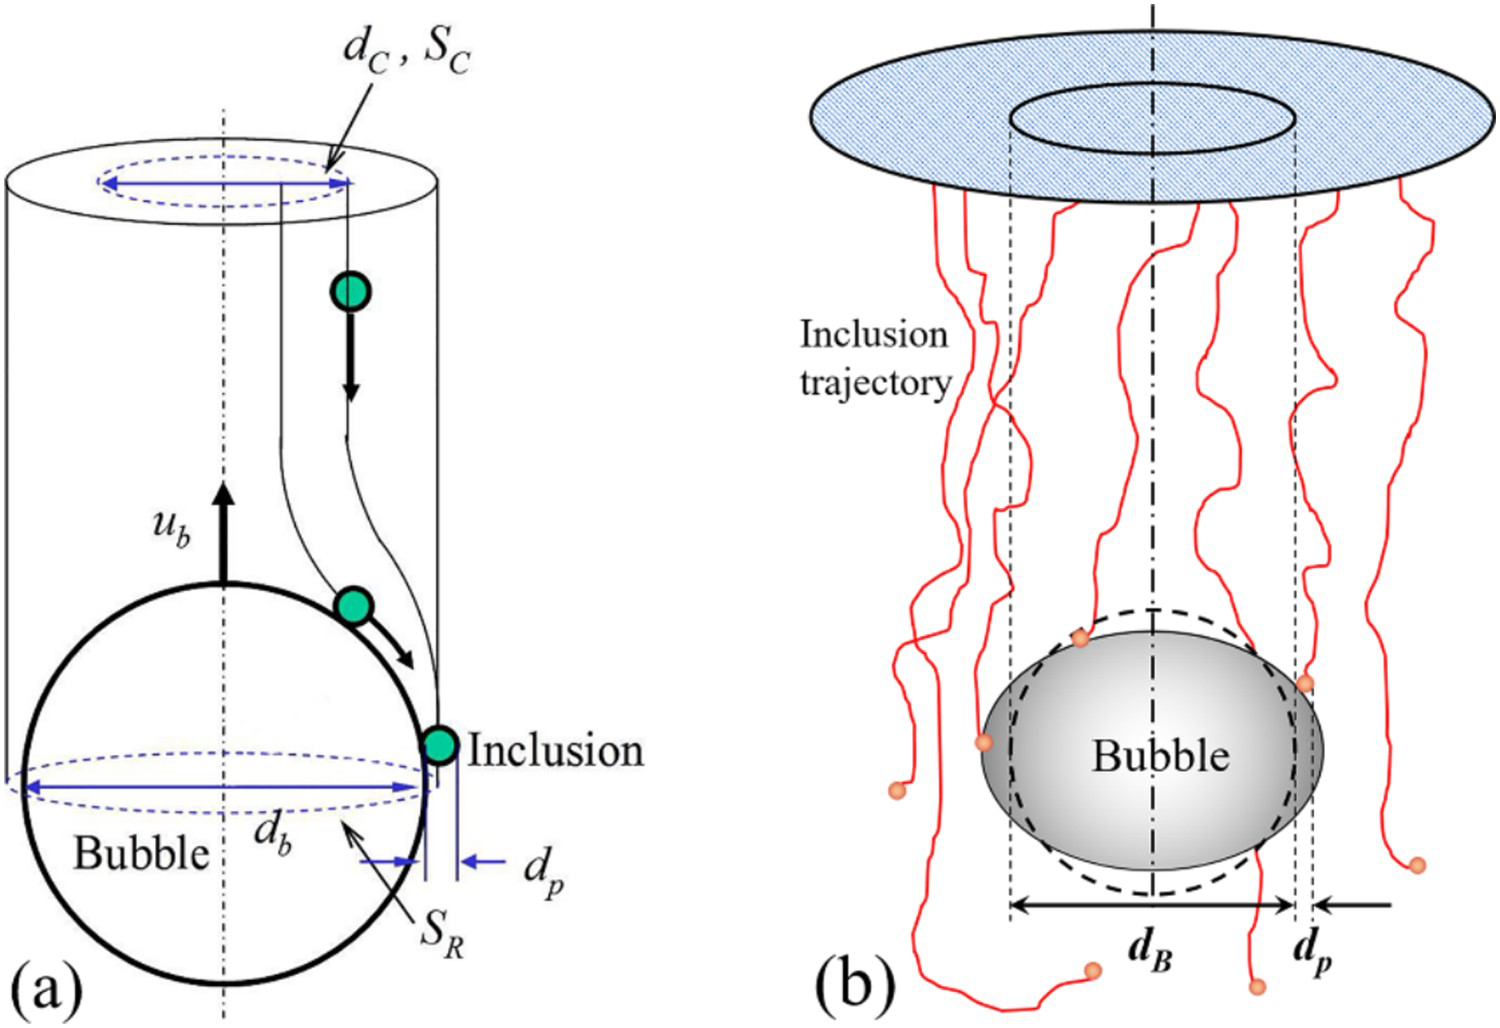
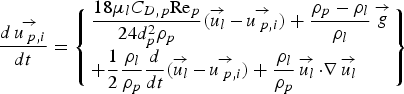
In order to investigate the interaction between the bubble and inclusions, the turbulent flow around an individual bubble was simulated firstly using the commercial CFD software FLUENT 14.0. The steady turbulent flow was calculated by solving the continuity equation and Navier-Stokes equations in a two-dimensional axisymmetric domain with the bubble fixed at the centre of the symmetry axis. The standard k-ε two-equation model was adopted for the fluid turbulence. The bubble shape changes with its equivalent sphere diameter, evolving from sphere (<3 mm), to spheroid (3∼10 mm), to spherical-cap (>10 mm) with increasing the equivalent sphere diameter (Zhang et al. 2006). To study the effect of turbulence on the fluid flow around bubbles and the bubble-inclusion interaction, the turbulent kinetic energy in the computational domain was specified to a given value. The transport of inclusions through the flow field around the bubble was then calculated using the Discrete Phase Model (DPM). Inclusion trajectories were computed by integrating the balance of the force in a Lagrangian frame of reference:
Inclusions were injected with the bubble terminal velocity in an upstream plane 5 times bubble diameter from the bubble centre. It was assumed that inclusions were distributed uniformly in the injecting plane with random positions. The interaction time between the bubble and the inclusion is calculated from the inclusion centreline trajectory results by tracking the sliding time that elapses while the distance from the inclusion centre to the surface of the bubble is less than the inclusion radius. Thus, the inclusion would be attached to the surface of the bubble for the interaction time greater than the film rupture time.
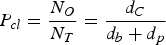
During each inclusion trajectory calculation, the attachment criterion was checked using a User Defined Function (UDF), and the information of attached inclusions was written to a text file. The attachment probability was redefined as:
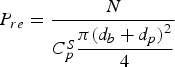
Figure 15(a and b) show the predictions for the attachment probability as a function of inclusion diameter under different turbulent conditions for 5-μm and 50-μm inclusion, respectively. As expected, the attachment probability is strongly affected by the turbulence. Although the interaction time decreases and the attachment of inclusions to the bubble becomes more difficult, the attachment probability increases with the level of turbulent kinetic energy since inclusions far from the bubble also have a chance to collide, interact, and attach onto the bubble surface in the intense turbulent flow.
Attachment probability of inclusions to (a) 5-mm spheroid bubbles and (b) 50-mm spherical-cap bubbles as a function of the inclusion diameter under different turbulence conditions (Duan et al. 2019b).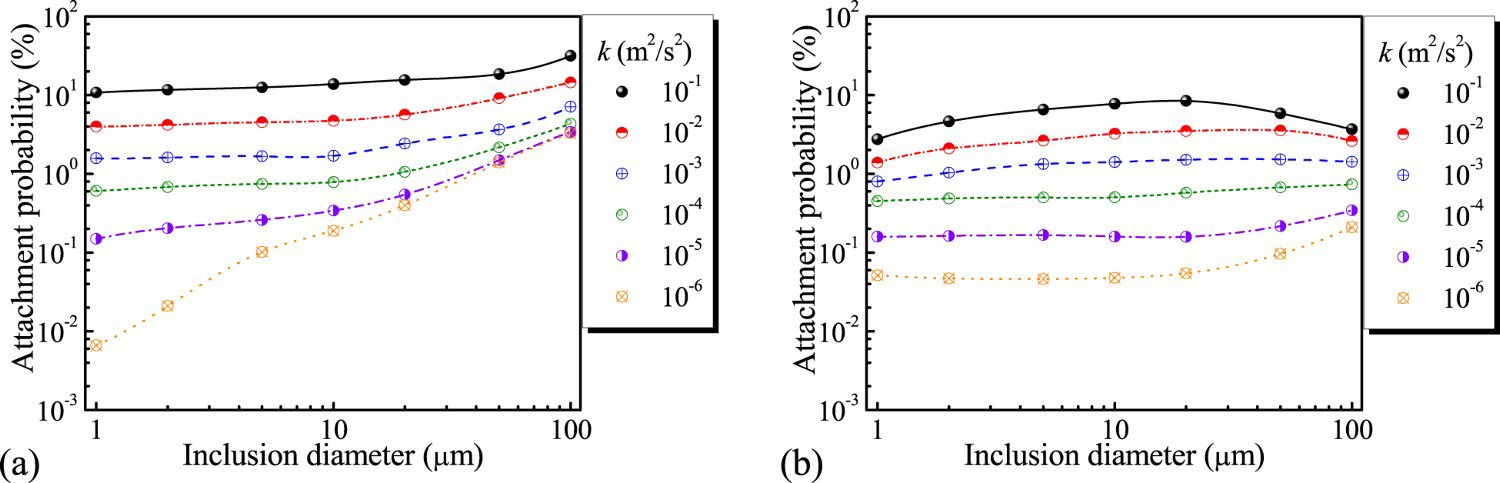
The wake is observed behind the spherical-cap bubble and the entrapment of inclusions by the wake is considered. Figure 16(a) shows the entrapment probability of inclusions by the bubble wake for db = 50 mm. Turbulence also significantly affect the entrapment of inclusions.
(a) Entrapment probability and (b) capture probability of inclusions to 50-mm spherical-cap bubbles as a function of the inclusion diameter under different turbulence conditions (Duan et al. 2019b).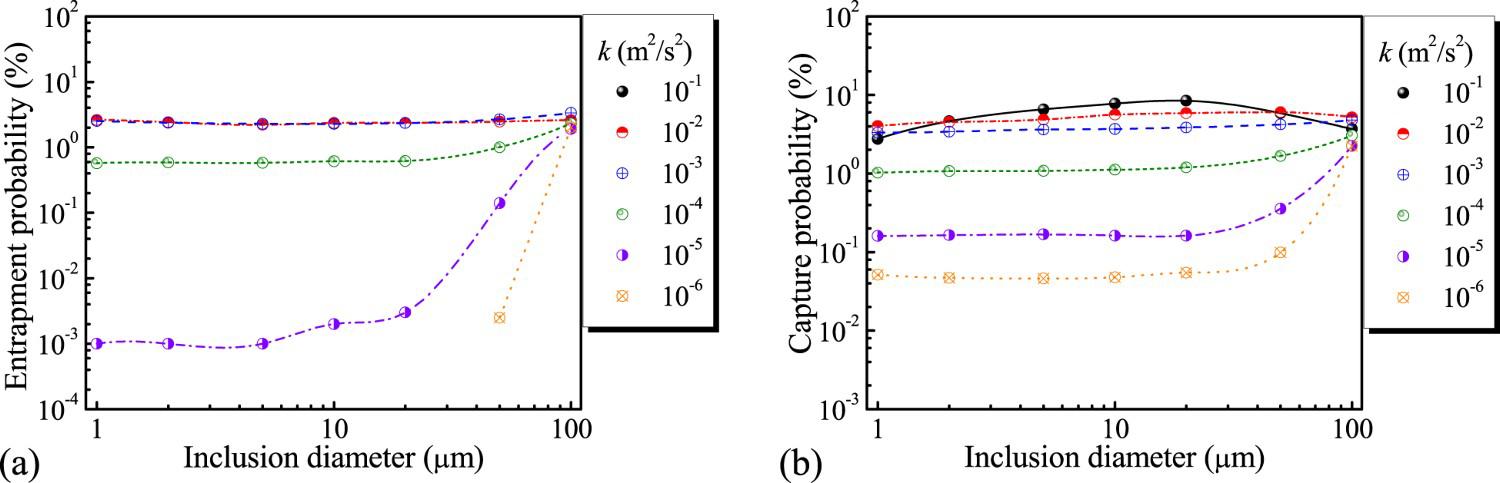
The capture probability is the sum of the attachment probability and the entrapment probability and the capture probability as a function of the inclusion diameter under different turbulence conditions is shown in Figure 16(b).
A model incorporated by a Graphical User Interface (GUI) is developed to predict the capture probability of inclusions to an individual bubble, as shown in Figure 17. Orthogonal capture probabilities for db = 1, 2, 5, 10, 20, 50, 100 mm, dp = 1, 2, 5, 10, 20, 50, 100 μm and k = 10−1, 10−2, 10−3, 10−4, 10−5, 10−6 m2/s2 are calculated by the simulation model developed above. The cubic spline interpolation is used to predict the capture probability for any given bubble diameter, inclusion diameter and turbulent kinetic energy.
Inclusion capture probability prediction model (Duan et al. 2019b).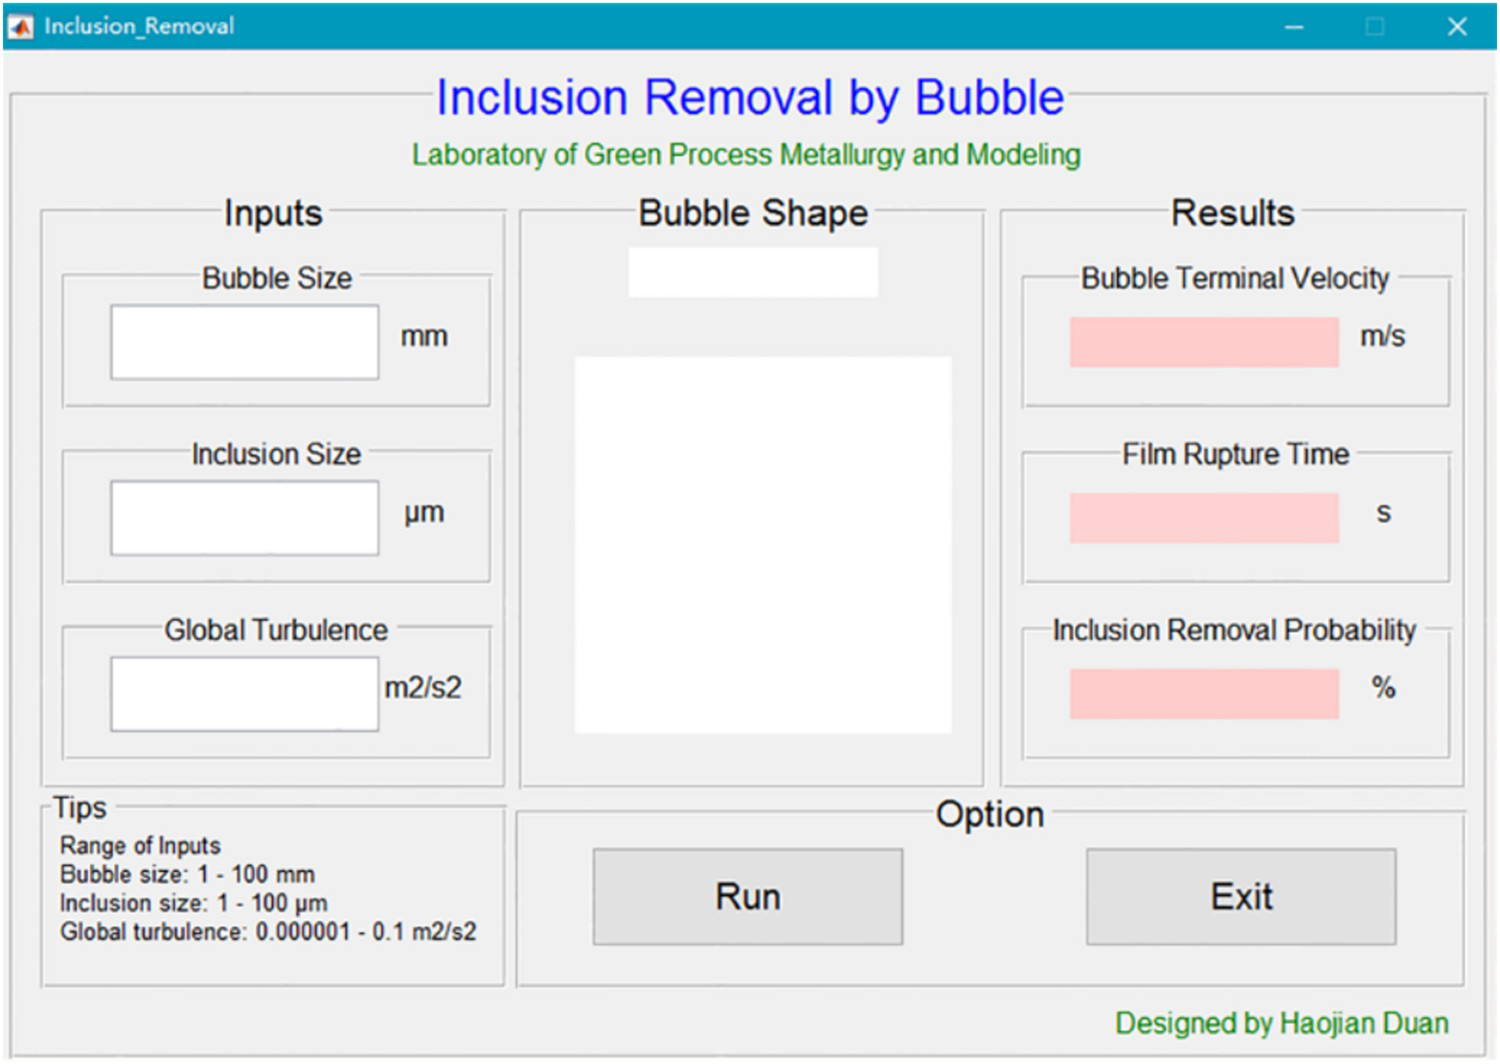
An inclusion-bubble interaction micro-scale model has been developed to predict the capture probability of inclusions to an individual bubble in the turbulent steel flow. The model is based on the trajectories of inclusions in the turbulent flow field around the bubble to account for the attachment onto the bubble surface and the entrapment by the bubble wake. The capture inclusion information is recorded using a User-defined Function (UDF) by checking the capture criterion and then the capture probability is calculated. For ease of implementation, the Graphical User Interface is developed. The capture probability is predicted for any bubble size, inclusion size and turbulent kinetic energy using the cubic spline interpolation.
Motion and removal of inclusions from molten steel during argon bubbling refining process
The transport of solid inclusions in the turbulent flow field is modelled by the following equation for transient diffusion and transport of a continuum species:

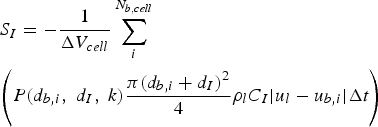
Figure 18 shows the normalised concentration of 10 μm inclusions as a function of time in a 150 ton ladle with the gas flow rate of 220 NL/min and the porous plug position of 0.68R only considering the removal of inclusions bubble flotation and ignoring the effect of collision between inclusions. Clearly, the inclusion concentration in the bubble plume is the lowest since numerous argon bubbles are collected in the plume. It should be noted that the legend in each picture decreases with the bubbling time and indicates that the inclusion concentration in the whole ladle decreases due to the fluid flow induced by argon injection.
Normalised concentration profiles of 10 μm inclusions as a function of time, only considering bubble flotation (Qb = 220 NL/min, r/R = 0.68).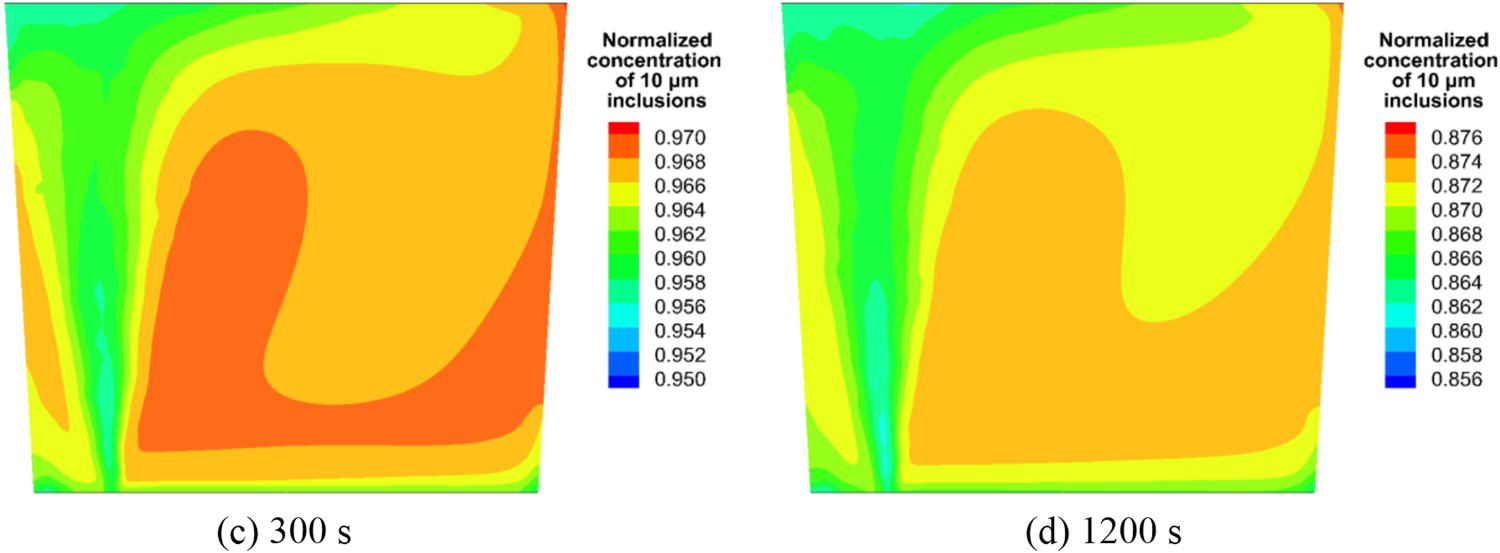
Collision, motion and removal of inclusions in the molten steel of continuous casting tundish (Ling, Zhang, et al. 2016)
The three-dimensional fluid flow and heat transfer of the molten steel, and the collision, motion and removal of inclusions in a two-strand 35-tonne tundish was simulated (Figure 19) (Ling, Zhang, et al. 2016). The casting speed was 1.0 m/min resulting in a 40-minute casting time per heat.
Schematic of the continuous casting tundish (Ling, Zhang, et al. 2016).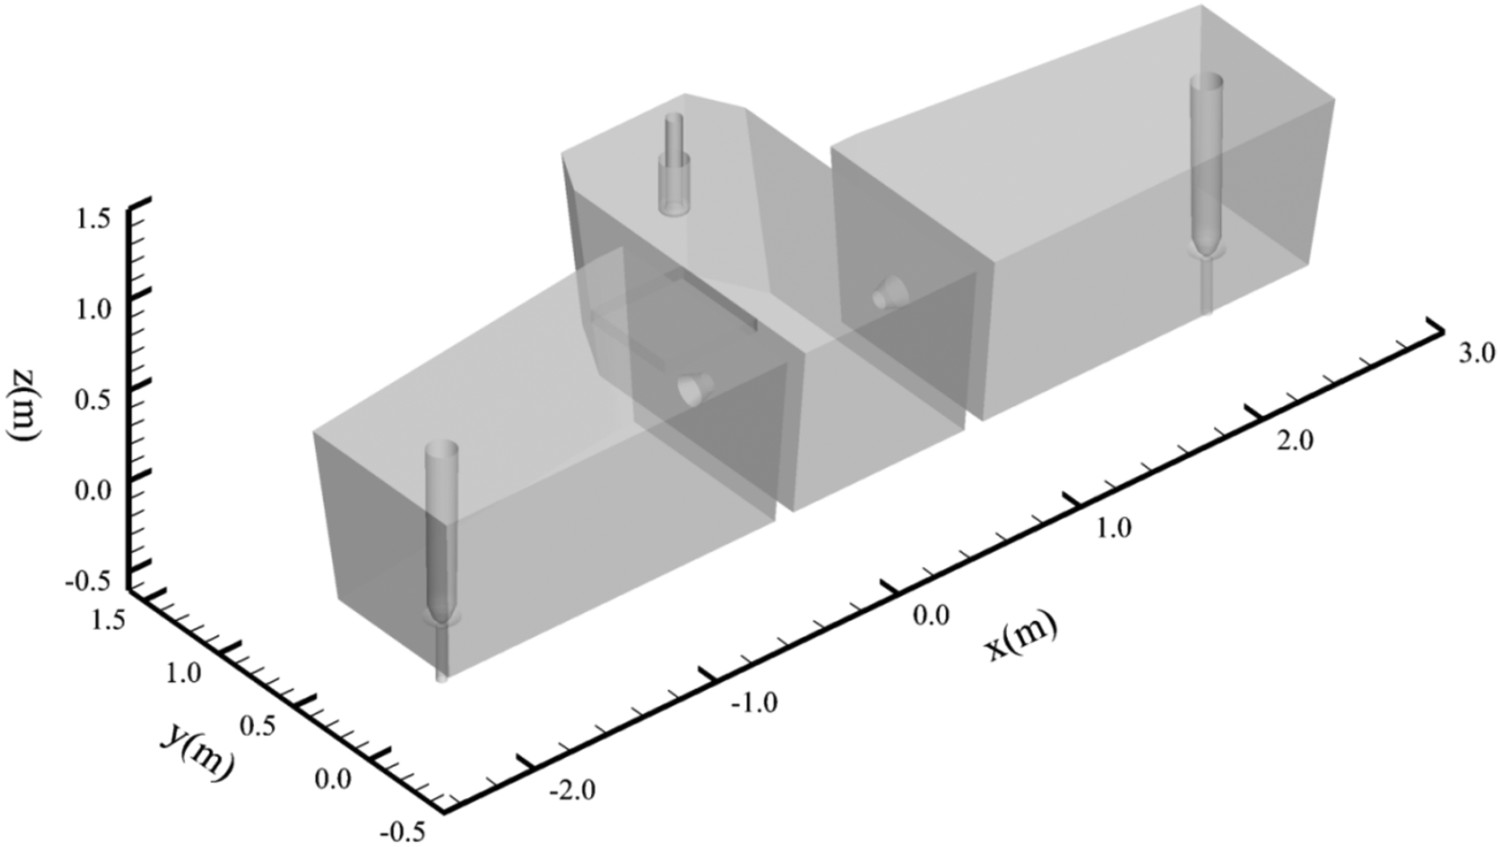
In the simulation, the top surface of the tundish was assumed as a free surface with a zero shear stress. The removal of inclusions at the interface between the molten steel and the slag was a very complicated process. The steps for the removal of inclusions from the molten steel to the top slag are shown in Figure 20 (Ling, Zhang, et al. 2016). Zhang and Taniguchi (2000) compared different models of the collision time and pointed out the following equation (Ye and Miller 1989) was to calculate the collision time, as listed by Equation (17).
Schematic of the interaction steps between the molten steel, slag and inclusion (I: Approaching of the inclusion to the slag-steel interface; II: Collision of the inclusion with the interface and formation of a thin steel film between the slag and the inclusion; III-1: Drainage and rupture of the thin film and the formation of a steady three phase contact line (TPCL); III-2: The inclusion backs to the bulk since no rupture of the film occurs during the collision between the inclusion and the slag) (Ling, Zhang, et al. 2016).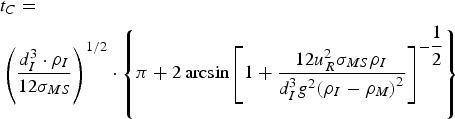
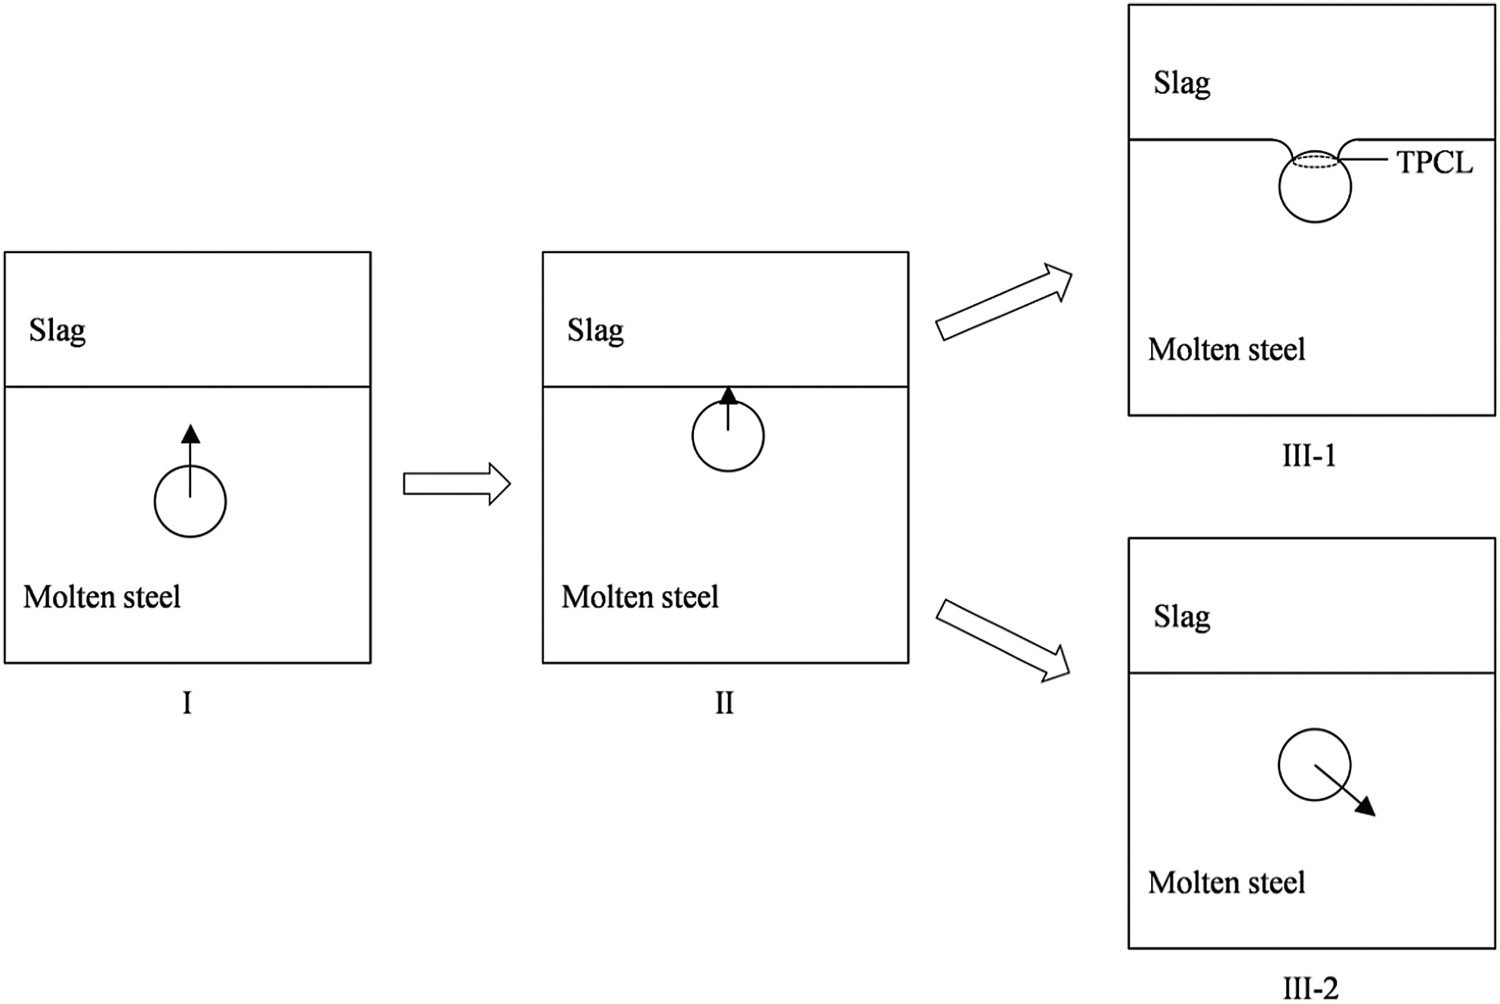
The removal condition of inclusions to the top slag is as follows: (i) If uR≤0, where a positive sign means upwards, the inclusion will not reach the slag thus can hardly be absorbed. (ii) If uR > 0 and tC < tF, the thin film is not able to rupture during the collision between the slag and the inclusion so that the inclusion will rebound from the slag and not be removed (iii). If uR > 0 and tC ≥ tF, the thin film is ruptured during collision between the inclusion and the slag so that a three-phase contact line is formed and the inclusion is steadily absorbed to the slag and is removed from the molten steel. The discussion above and the flux of inclusions to the slag can be summarised by.
Variation of number density of inclusions above the outlet at 10 min of casting (Ling, Zhang, et al. 2016).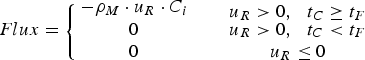
In actual operations, the new incoming steel from the ladle shroud was often mixed with the remaining molten steel in the tundish. The inclusions collided with not only each other but also the new different size inclusions moving together with the molten steel from the inlet. It was a combination of multi-complicated processes. Figure 22 (Ling, Zhang, et al. 2016) shows the concentration distribution of inclusions of three different sizes at three different moments, indicating that the concentration of 4.61 μm inclusions in inlet zones was significantly larger than that in other zones and the maximum value was 1.48 × 10⁻², larger than its dimensionless initial concentration of 1.46 × 10⁻². With increasing time, the generation rate of 4.61 μm inclusions in the entire tundish were smaller than their depletion rate, thus resulting in a decrease in their concentrations at 75 s. Furthermore, their concentration distribution reached a steady state at 625 s because the generation rate was equilibrated with the depletion rate.
The concentration distribution of 4.61 μm inclusions at different times (Ling, Zhang, et al. 2016).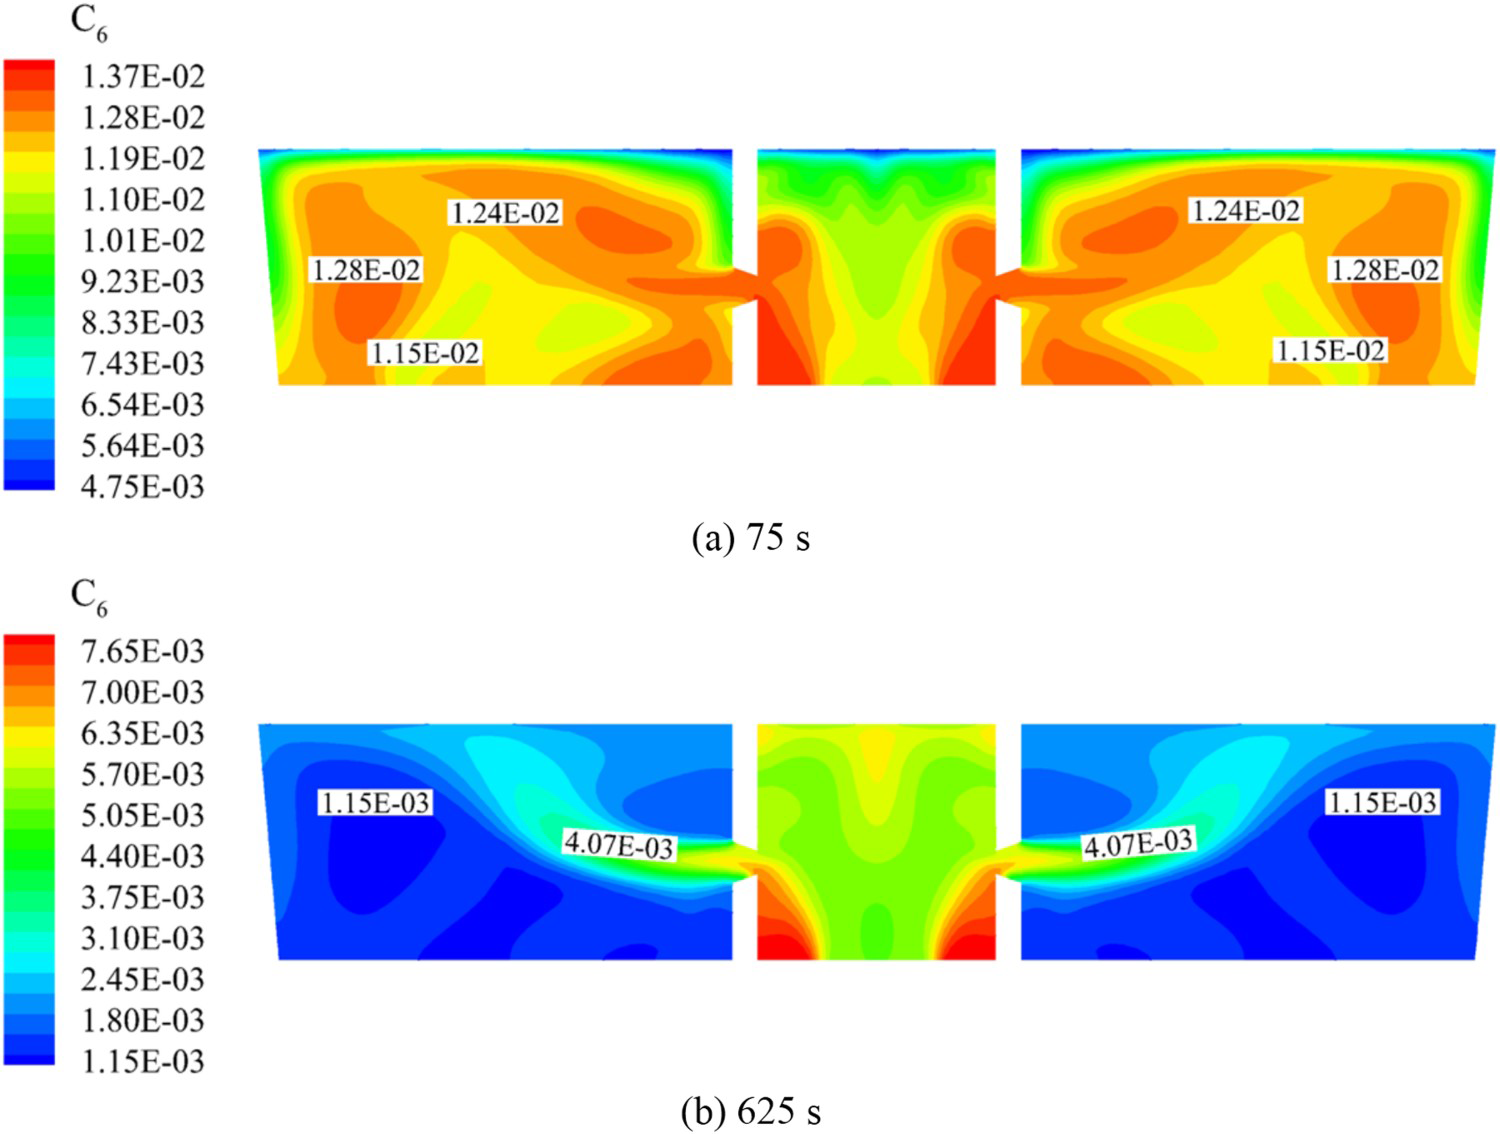
Figure 23 (Ling, Zhang, et al. 2016) shows the variation of the total oxygen and removal fraction of different type of inclusions in the tundish. In case of considering the effect of the turbulence on the inclusion removal, the total oxygen for alumina, MgO·Al2O3 spinel, silica and 12CaO·7Al2O3 inclusions showed a fluctuation descent tendency. Compared with 12CaO·7Al2O3 inclusions, the total oxygen for alumina and MgO·Al2O3 spinel inclusions was much lower and their removal fraction was 14.3∼18.0% larger than that of 12CaO·7Al2O3 inclusions at 625 s, which was caused by the larger contact angle between solid particles and the molten steel. There was an inverse proportion relationship between the contact angle and the rupture time. Therefore, it was much easier for solid inclusions with the smaller rupture time to be absorbed by the slag and removed. However, there were little difference in the total oxygen and removal fraction for alumina and MgO·Al2O3 spinel inclusions because they have almost the same density and contact angle with the molten steel and their removal fraction at 625 s was 53.5% and 57.2%, respectively. For silica inclusions, the generation process was mainly controlled by the coagulation coefficient through the Hamaker constant, and its density and contact angle with the molten steel were smaller than that of alumina inclusions, which gave rise to an increase in the number density of the maximum group inclusions.
Variation of total oxygen converted from mass concentration of four type of inclusions at the outlet (Ling, Zhang, et al. 2016).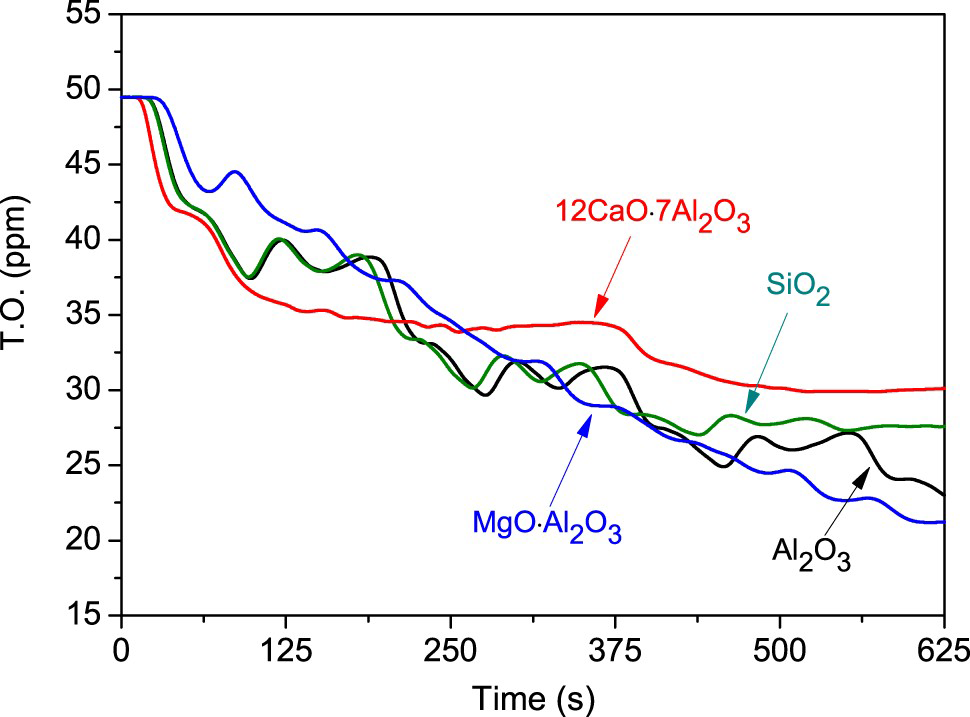
Behaviour of inclusions at steel solidification front and entrapment of inclusions to the solidified shell of continuous casting mould strands (Chen et al. 2018; Chen, Li, et al. 2019)
A three-dimensional mathematical model of a vertical-bending continuous casting strand were developed to predict the fluid flow, solidification, motion, and entrapment of inclusions. The section size of the slab was 1000 mm × 230 mm and the total length of the calculation domain was about 30.84 m. The whole calculation domain was divided into approximately 4.02 million structured mesh cells. The inclusion was removed when it reached the top surface and a reflection condition was employed at other walls. The inclusion was assumed to be entrapped by the shell during the movement to the solidification front where the liquid fraction was less than 0.6 and the speed of the fluid flow was less than 0.07 m/s. The removal of inclusions and the entrapment locations were recorded through a user defined function.
The thickness of a breakout continuous casting shell and an inclusion detection using ASPEX was employed to validate the solidification model and inclusion entrapped criteria, respectively. The results can be seen in Figure 24. The thickness of the solidified shell along the casting direction was not smoothly distributed, which caused by the transient flow field distribution. The predicted results of the inclusion distribution agree well with the measurement one.
Comparison of the predicted and measured results, (a) shell thickness, and (b) inclusion distribution along with the 1/4 width of the slab (Chen et al. 2018).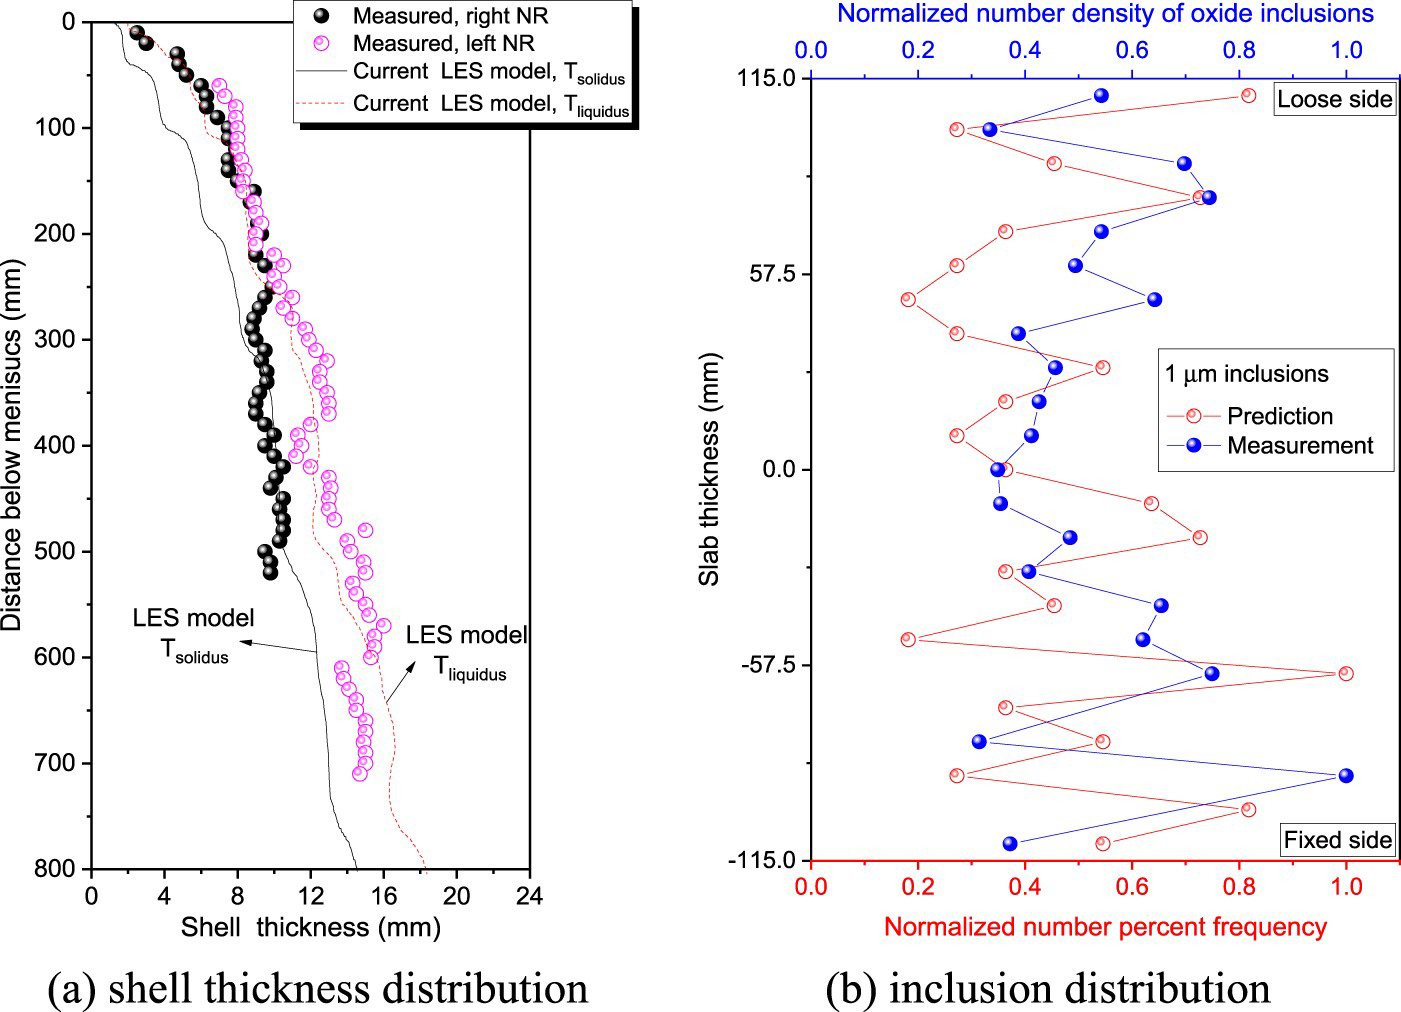
The fluid flow field, temperature field, and distribution of the solidified shell were the basis for predicting the distribution of inclusions in the CC slab. Figure 25 shows the three typical transient velocity and temperature distribution. The transport of the inclusion was mainly controlled by the bulk flow since the size of the inclusion was too small. At t = 939.75 and 957.75 s, the flow field in the left side was much stronger than the right side, thus the inclusions were more distributed on the right side. As shown in Figure 25(c), the small inclusion was easy to transport to the deep region. The asymmetric distribution of the flow field induced the asymmetric transport of the inclusion, generating the asymmetric distribution of the inclusion in the CC slab (Chen, Li, et al. 2019).
Flow field and inclusion distribution at four time shots (Chen, Li, et al. 2019), (a) t = 915.75 s, (b) t = 939.75 s, (c) t = 957.75 s.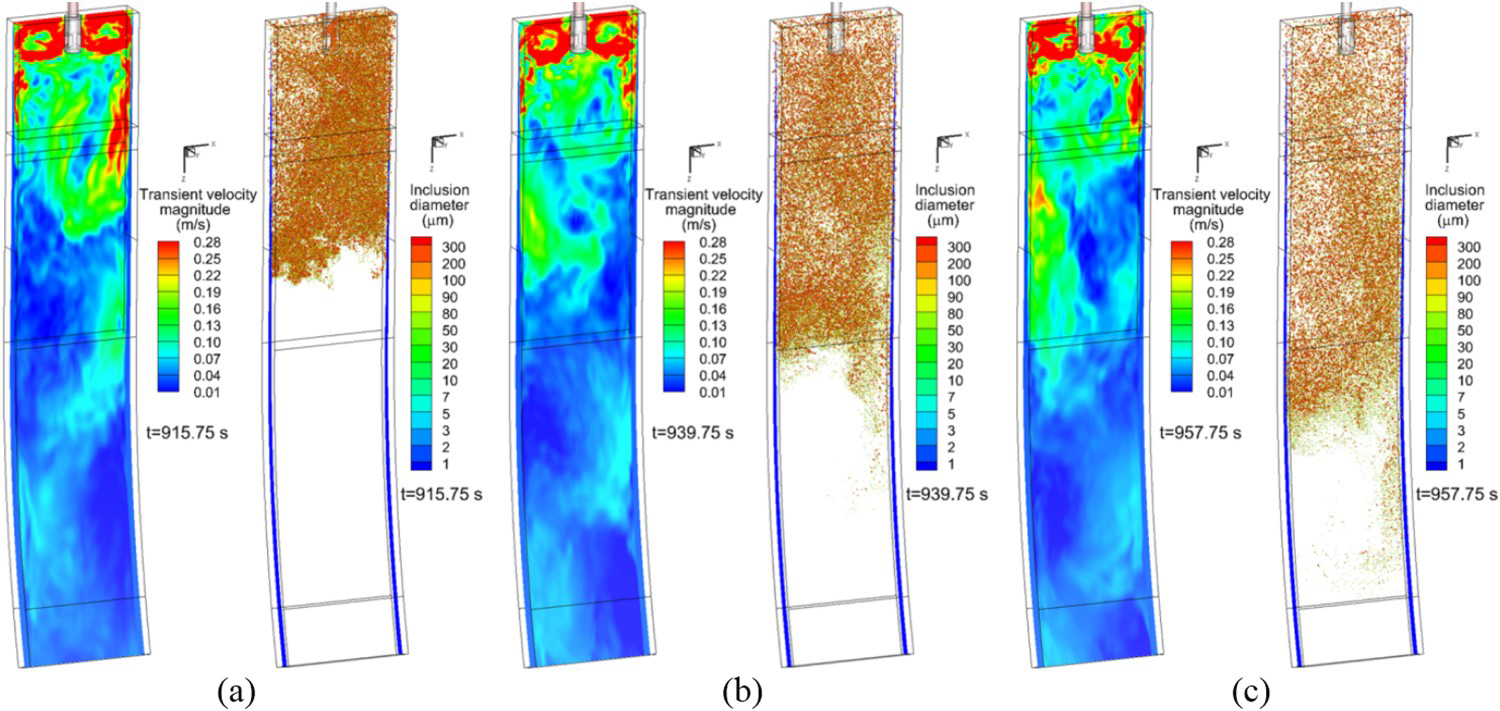
In addition to the inclusions floating on the upper surface, most of the inclusions are carried by the molten steel to the deep region and are eventually captured by the solidified shell. Figure 26 shows the number percent frequency distribution of small and large inclusions, which captured by the solidified shell. The negative value in thickness direction means the loose side. The entrapment of inclusions on the entire cross-section of CC slabs was successfully predicted using the full transient solidification model. Two inclusion accumulation zone can be observed in Figure 26 obviously. However, these two inclusion accumulation zones had the significantly different characteristics. One was located near the centreline of the slab thickness, and became more distinct as the inclusion diameter decreased. The other was located on 1/4 thickness from the loose side, and became more obvious as the inclusion diameter increased. The inclusions concentrated on 1/4 thickness from the loose side was caused by the existence of the curved segment. The small inclusions passed through the curved segment with the molten steel and were captured in horizontal segment eventually, while the large inclusions were captured at vertical and curved segment or removed at the top surface due to the large buoyancy force. Hence, two different inclusion accumulation zones formed.
Number percent frequency of different inclusion diameter (Chen et al. 2018).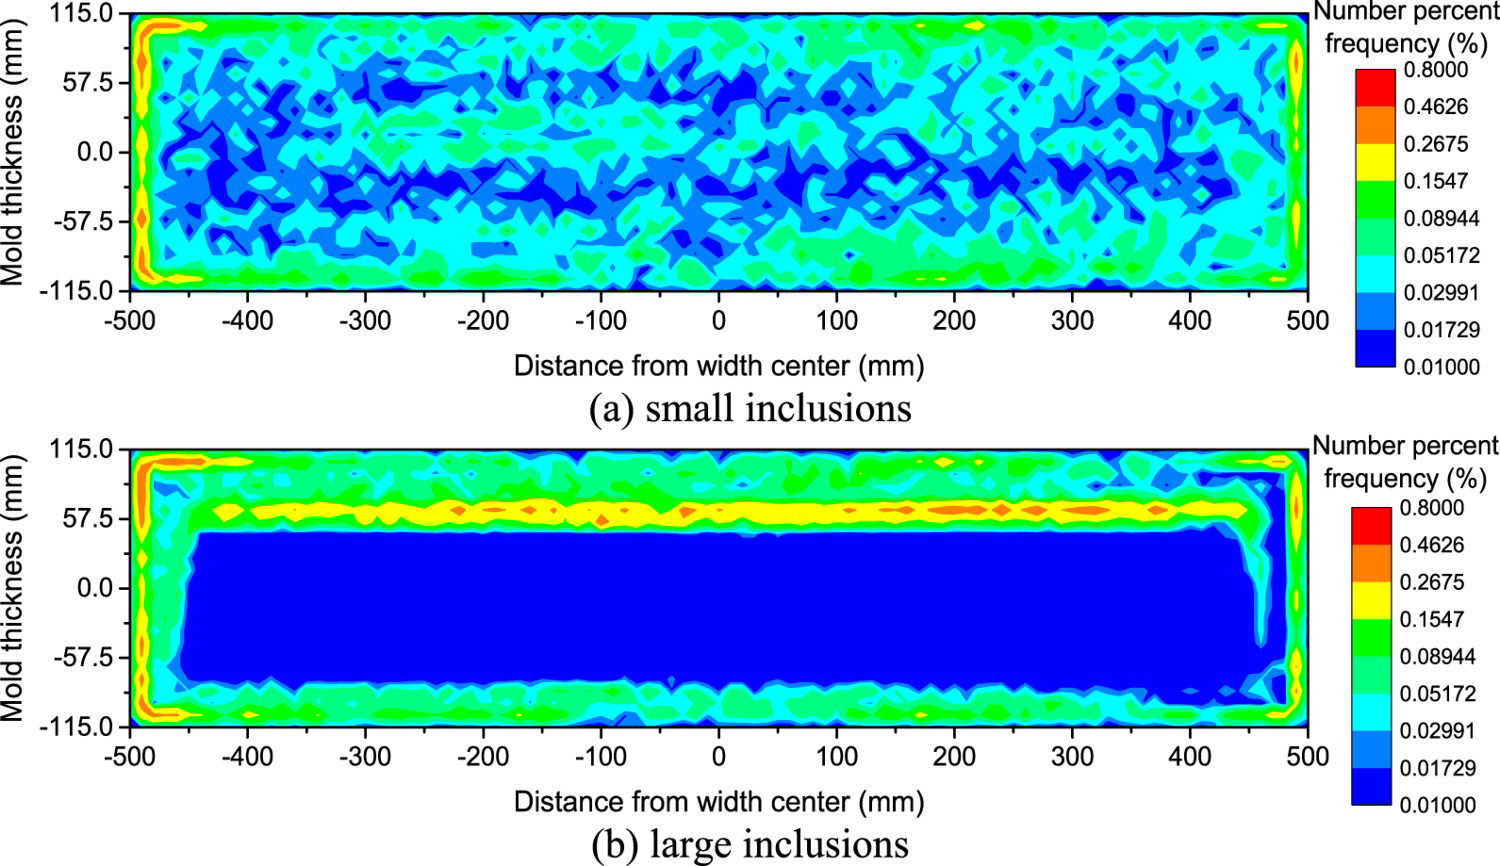
Thermodynamic modelling of non-metallic inclusions in molten steel
Deoxidation with one or multiple elements
An important source of non-metallic inclusions in steel is the deoxidation process of steel. Single-phase inclusions are produced after deoxidation with one element, and complex inclusions are produced after deoxidation with multiple elements. Deoxidation thermodynamics of pure iron has been well studied. However, only Fe, O, and the deoxidiser element are considered in deoxidation thermodynamics of pure iron, and the interaction between other elements in steel are ignored. There is no doubt that the deoxidation thermodynamics of the pure molten iron is very different from that of the actual molten steel. Therefore, deoxidation thermodynamics of the pure molten iron can hardly accurately predict the deoxidation of the actual molten steel.
In the current study, a heavy rail steel was used to introduce the deoxidation thermodynamics of the molten steel with one or multiple elements. Thermodynamic calculation was based on FactSage software, using FactPS, FToxide and FTmisc database. The heavy real steel (U75 V) contained 0.75% C, 0.65%Si, 0.95&Mn, 0.06% V and 0.0040% S. The production route of the steel was BOF → LF → VD → CC.
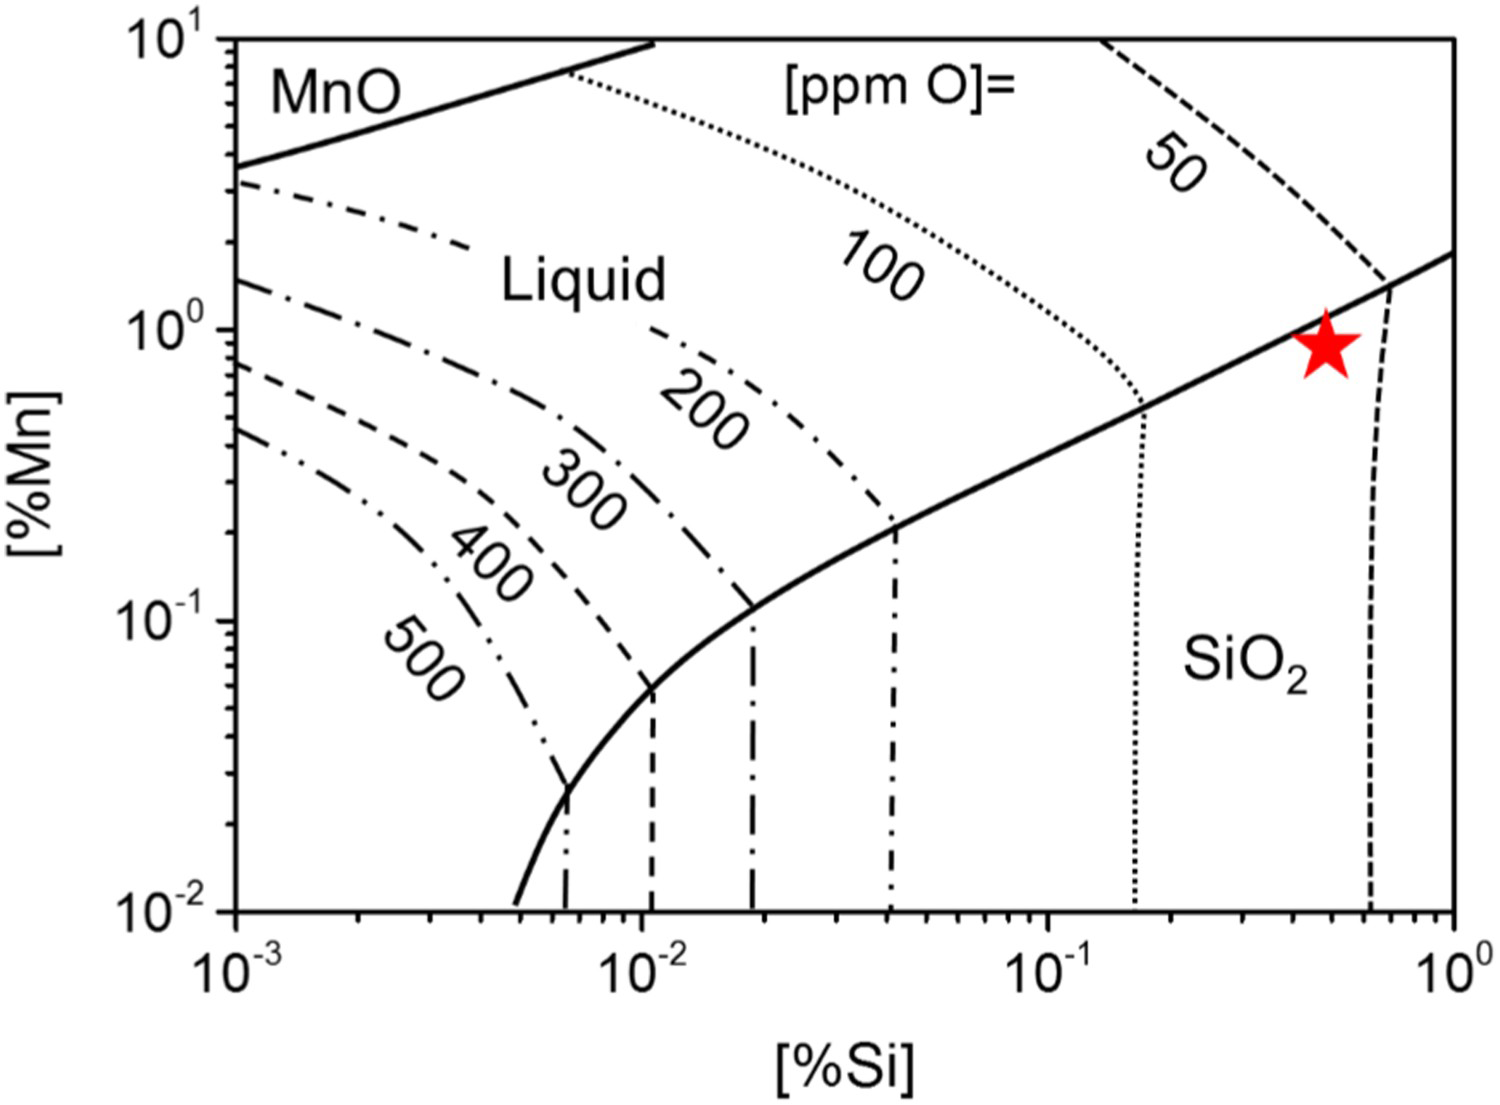
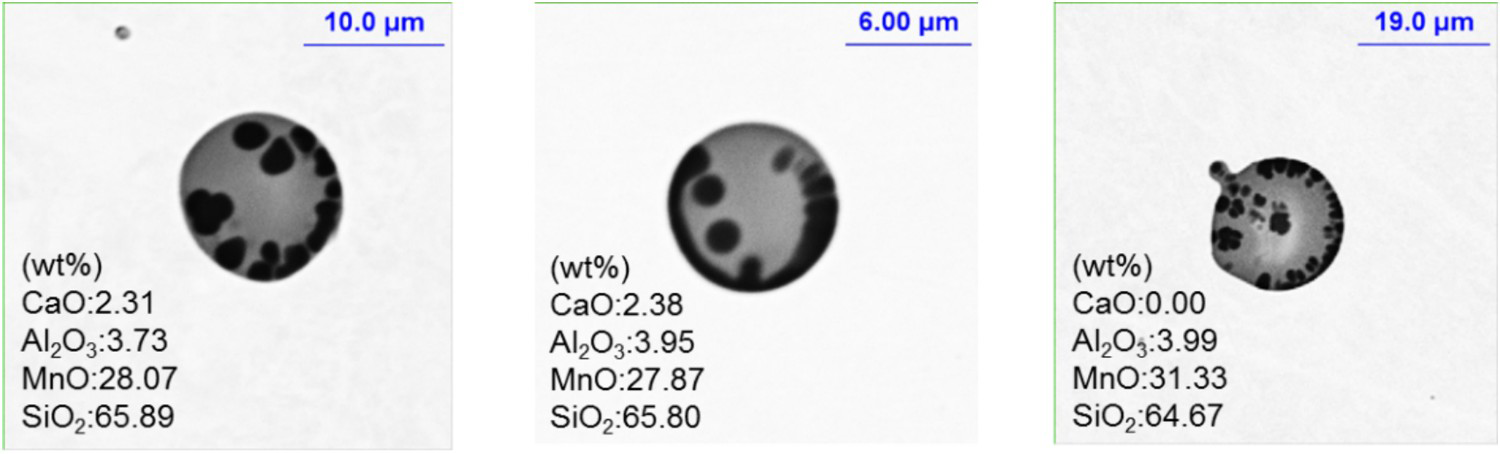
A certain amount of silicomanganese and ferrosilicon alloys were added into the molten steel during BOF tapping where the molten steel contained a high content dissolved oxygen. The reactions between Si, Mn in the alloy and the dissolved oxygen in the molten steel were rapidly and deoxidation products formed. The Si-O equilibrium curve calculated using FactSage is shown in Figure 27. Silicon is a weak deoxidiser and Si-Mn compound alloys are usually employed during steel deoxidation. Figure 28 shows the equilibrium stable phase diagram at 1873K of Si-Mn-O system calculated using FactSage. According to the content of Si, Mn and O in steel, solid MnO inclusions, solid SiO2 inclusions and liquid Si-Mn-O inclusions in steel can be effectively predicted. The star symbol in Figure 28 shows the content of Si, Mn of the U75 V steel, and the corresponding inclusion was at the junction position between the liquid SiO2-MnO phase and the solid SiO2 phase. The morphology of typical inclusions in the steel are shown in Figure 29, indicating that at the LF refining start, due to the high dissolved oxygen in the molten steel, the inclusion should mainly SiO2 and MnO, and a mixture of solid phase and liquid phase. While, inclusions found in the current sample, example by Figure 29, were in mainly liquid state at the temperature of the molten steel. The discrepancy was due to the fact that the dissolved aluminum existed in the steel which was ignored in the calculation of Figures 27 and 28.
Equilibrium curve for Si-O in the molten steel at 1873K. Equilibrium stable phase diagram of inclusions in Si-Mn-O system for the U75 V steel Morphology of typical inclusions in steel samples at LF refining start.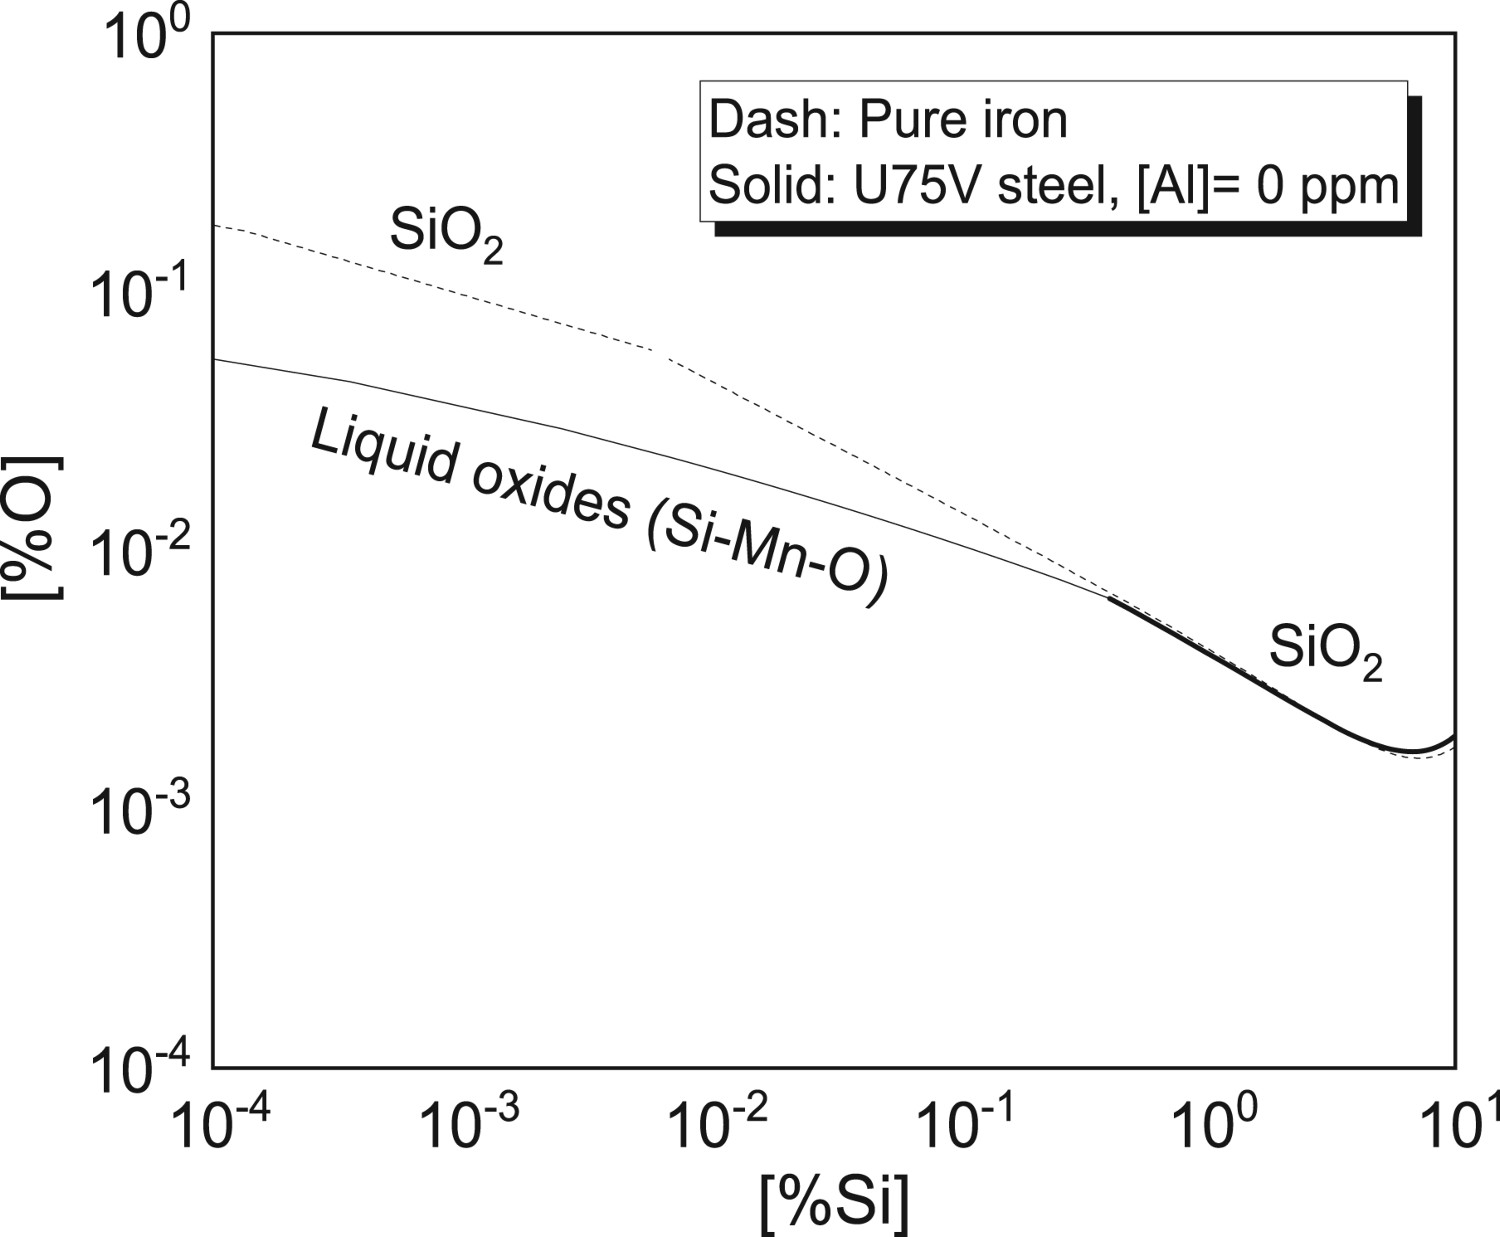
During the steel fining process of the heavy rail steel, the certain content of aluminum existed in the ferrosilicon alloy (Chu et al. 2018). The aluminum in the alloy generated a certain percentage of alumina in inclusions of the molten steel and achieved a total oxygen as low as 10 ppm which was hardly possible to achieve when pure silicon was used to deoxidise the molten steel. Thus, the aluminum should be considered in order to accurately predict the deoxidation product of the heavy rail steel. Figure 30 shows the effect of the aluminum on the stable phase diagram at 1873K of 0.0024%Al -Si-Mn-O system. Comparing with Figure 28, the addition of aluminum element changed the composition of inclusions into a full liquid phase. With the increase of [Si] and [Mn] content, the zones of Al2O3-SiO2 and MnO-Al2O3 phase were enlarged, and the liquid phase was gradually shrunk. With the existence of aluminum in the steel, inclusions were stabilised in the liquid region of Al2O3-SiO2-MnO phase.
Equilibrium stable phase diagram of inclusions in 0.0024%Al-Si-Mn-O system for U75 V steel at 1873K.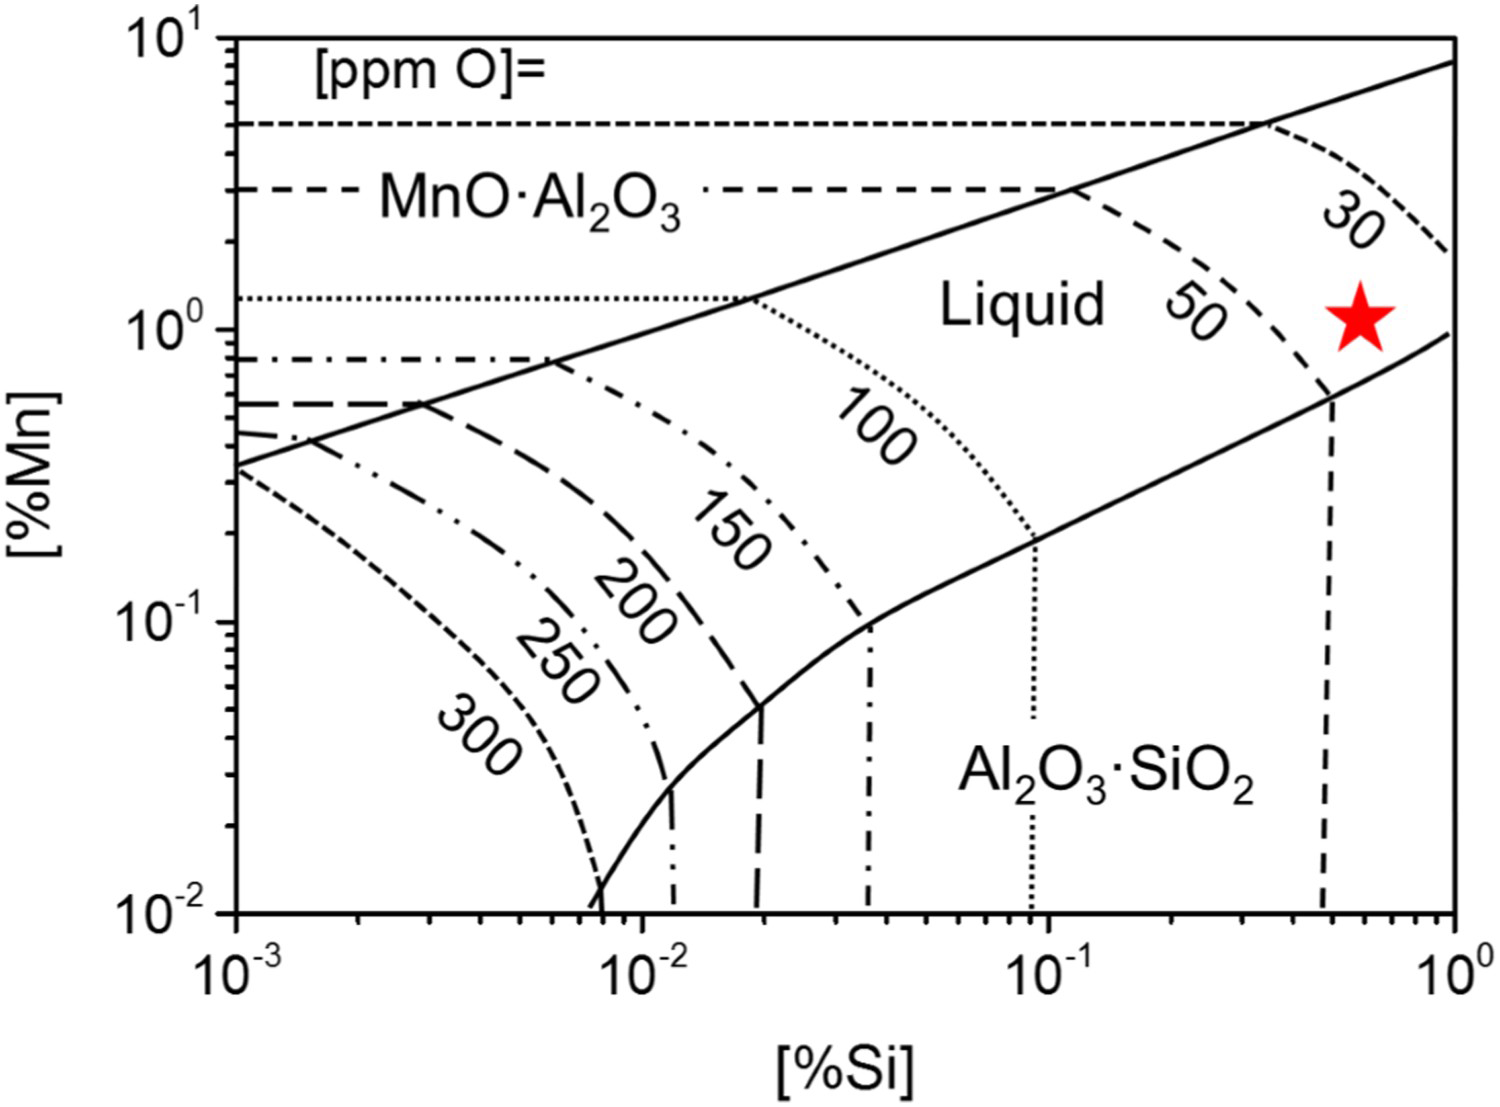
Furthermore, during refining process of the current heavy rail steel, the SiCaBa alloy was added to steel as a strengthening deoxidiser and a modifier of inclusions. After the addition of the SiCaBa alloy, inclusions in the molten steel were transformed from Al2O3-SiO2-MnO into CaO-Al2O3-SiO2. Equilibrium curve of Ca-O calculated using FactSage is shown in Figure 31. Calcium can easily reduce the dissolved oxygen in the molten steel to less than 10 ppm. For the pure iron, when the calcium content in steel exceeded 0.001%, the equilibrium dissolved oxygen was approximately 5 ppm, while for the heavy rail steel, due to the existence of other elements in the steel, the equilibrium relationship greatly varied. When the dissolved calcium content was less than 0.2 ppm, the Mg-Al–O spinel inclusion was the most stable. As the dissolved calcium content in the steel increased, the deoxidation product was transformed into liquid. The dissolved calcium in the heavy rail steel was approximately 1 ppm, and the deoxidation product at this [Ca] content was a liquid phase, and the dissolved oxygen content in the steel at equilibrium was in the range of 7–8 ppm. The detected dissolved oxygen content in the steel after steel refining was 7.9 ppm, consistent with the calculation.
Equilibrium curve for Ca-O in molten steel at 1873K (0.75%C-0.65%Si-0.95%Mn-0.0024%Al-0.0005%Mg-0.004%S-0.06%V).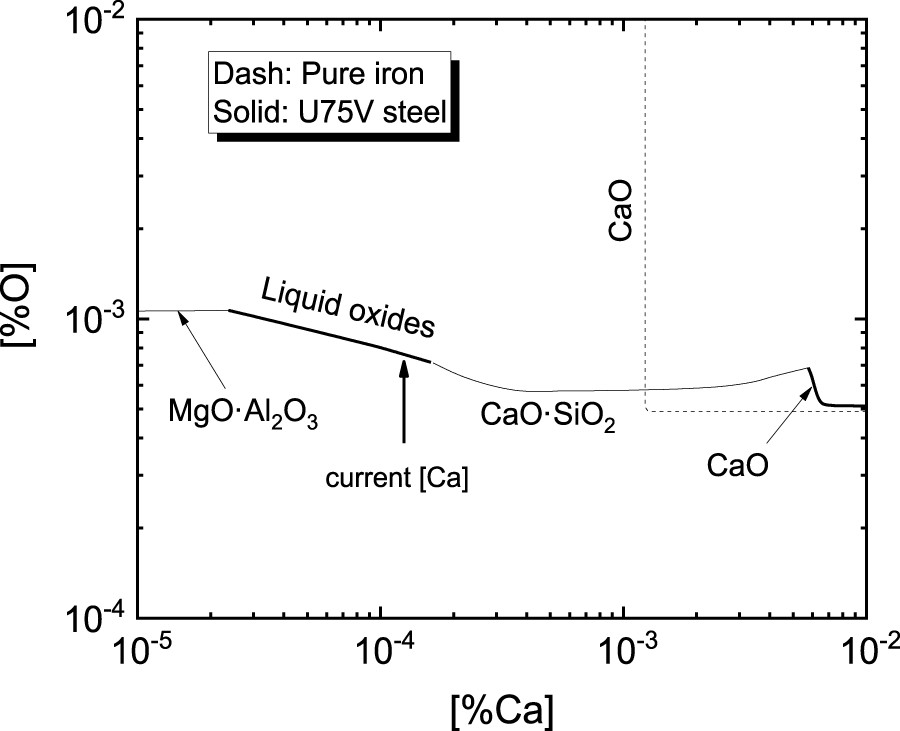
Precise calcium treatment (Zhang 2020)
In order to prevent the submersed nozzle from being clogged caused by the solid Al2O3-based inclusions, calcium wires are usually injected during steel refining so that inclusions are transformed into Al2O3-CaO liquid ones. While, insufficient or excessive addition of calcium into the steel will hardly solve the problem and generate new solid inclusions as well.
The thermodynamic equilibrium between the steel and the inclusion can be calculated using the thermodynamic software FactSage based on the principle of minimum Gibbs free energy. Figure 32 shows the variation of inclusions in a cold heading steel (SWRCH22A) with the increase of the calcium content added into the molten steel. Inclusions were solid Al2O3 ones before the addition of calcium into the steel and the amount of Al2O3 inclusions decreased while solid CaO·6Al2O3 inclusions generated with the increase of the calcium content in the steel. Solid CaO·2Al2O3 inclusions appeared and the amount of solid CaO·6Al2O3 ones began to descend when solid Al2O3 inclusions disappeared. Liquid inclusions formed and the amount of solid CaO·2Al2O3 ones started to decrease when solid CaO·6Al2O3 inclusions disappeared. Inclusions in the steel were only liquid calcium aluminate when the calcium content rose up to T.Camin, and solid CaS inclusions generated when the calcium content increased to T.Camax. The interval between T.Camin and T.Camax to achieve solid-free calcium aluminate and solid-free CaS inclusions in molten steel was defined ‘liquid window’. According to the calculated T.Camin, T.Camax, and the yield of calcium during steel refining process, the precise amount of calcium could be obtained under different conditions. The main factors affecting thermodynamic calculations included the aluminum, sulfur and oxygen in the steel.
Variation of inclusions in a cold heading steels with the increase of the calcium content added into the molten steel (Zhang 2020).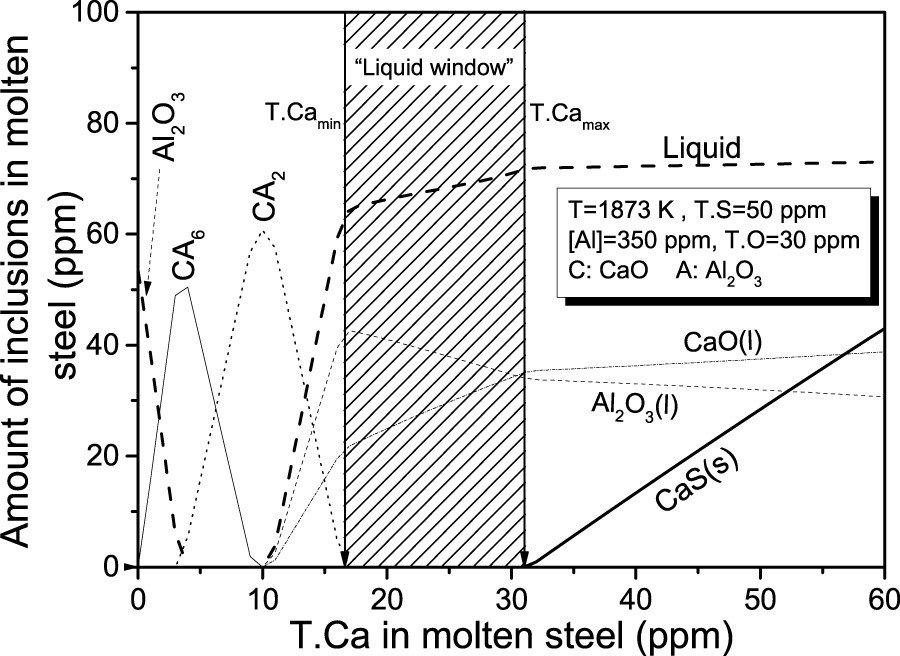
Figure 33 shows the effect of the sulfur and oxygen content with a 350 ppm soluble aluminum in the steel on the value of T.Camin and T.Camax at 1873K. As shown in Figure 33(a), the T.Camin and T.Camax value ascended with the increase of the initial oxygen content when the initial sulfur content in the steel was fixed. According to Figure 33(b), when the initial oxygen content in the steel was fixed, the T.Camax value decreased while the T.Camin value was constant with the increase of the initial sulfur content in the steel.
Effect of the sulfur and oxygen content in the steel with a 350 ppm soluble aluminum on the value of T.Camin and T.Camax at 1873K (Zhang 2020).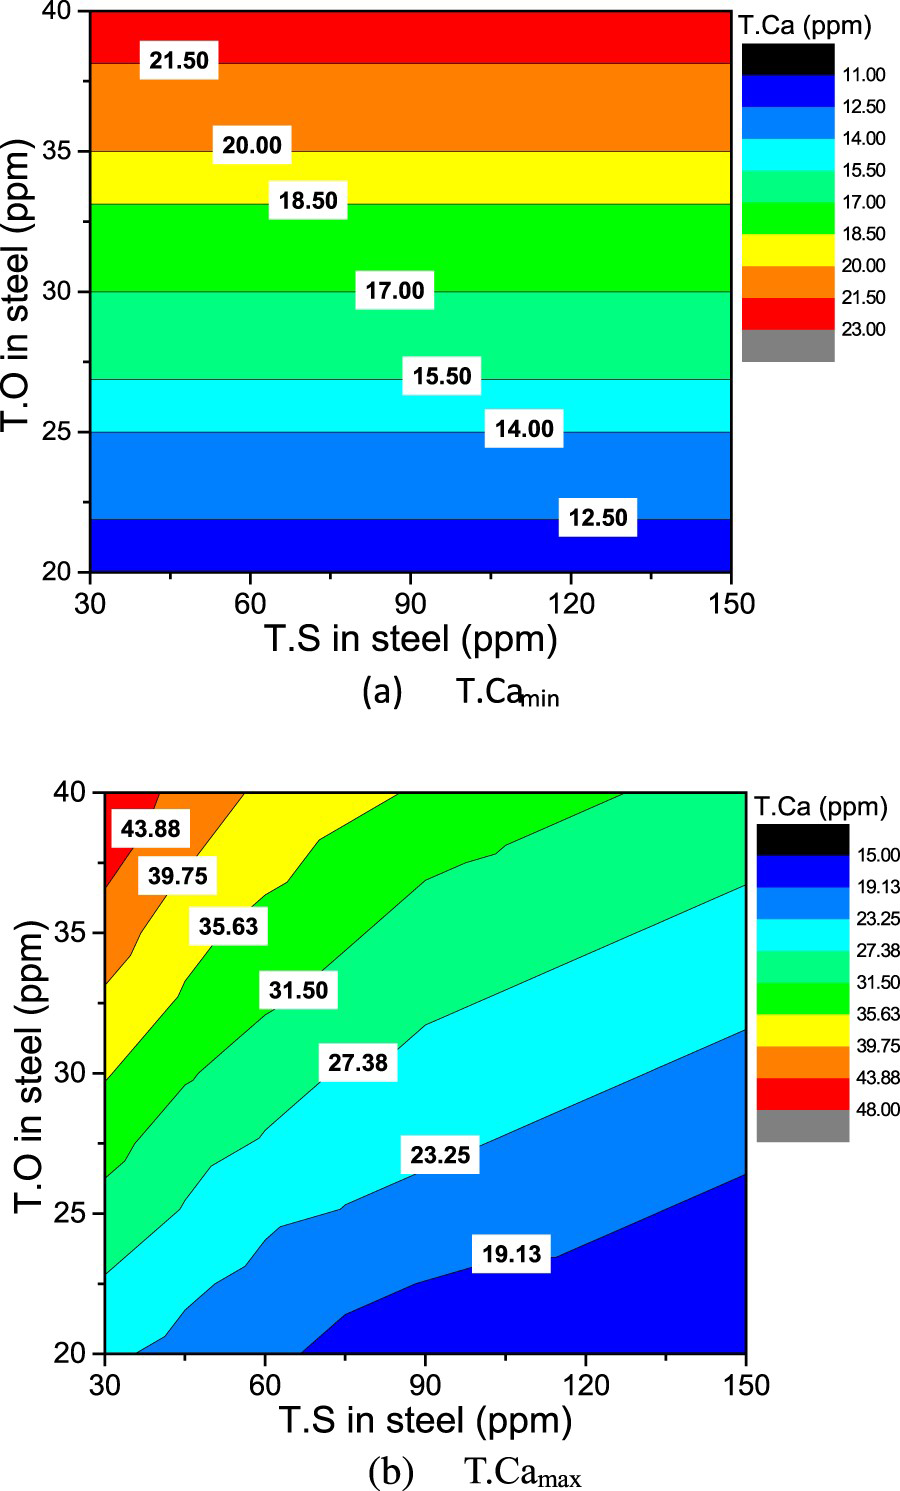
As an example of insufficient calcium addition to the steel, the addition of 500, 350 and 270 m of Ca-Al wires into the steel were compared. The wire contained 50-gram aluminum and 50-gram calcium per metre. Figure 34 shows the composition of inclusions in the steel after calcium treatment. For feeding 500-metre Ca-Al wires, inclusions were mainly CaO-CaS ones and the average composition of inclusions deviated from the low melting point zone. For feeding 350-metre Ca-Al wires, the mean composition of inclusions was near the low melting point zone while inclusions dispersed with varied CaS content, indicating an excessive addition of calcium. When 270-metre wires were injected, inclusions in the steel were mainly globular Al2O3-CaO and Al2O3-CaO-CaS ones within the 1873K low melting point zone.
Composition of inclusions in the steel after feeding Ca-Al wires (Zhang 2020).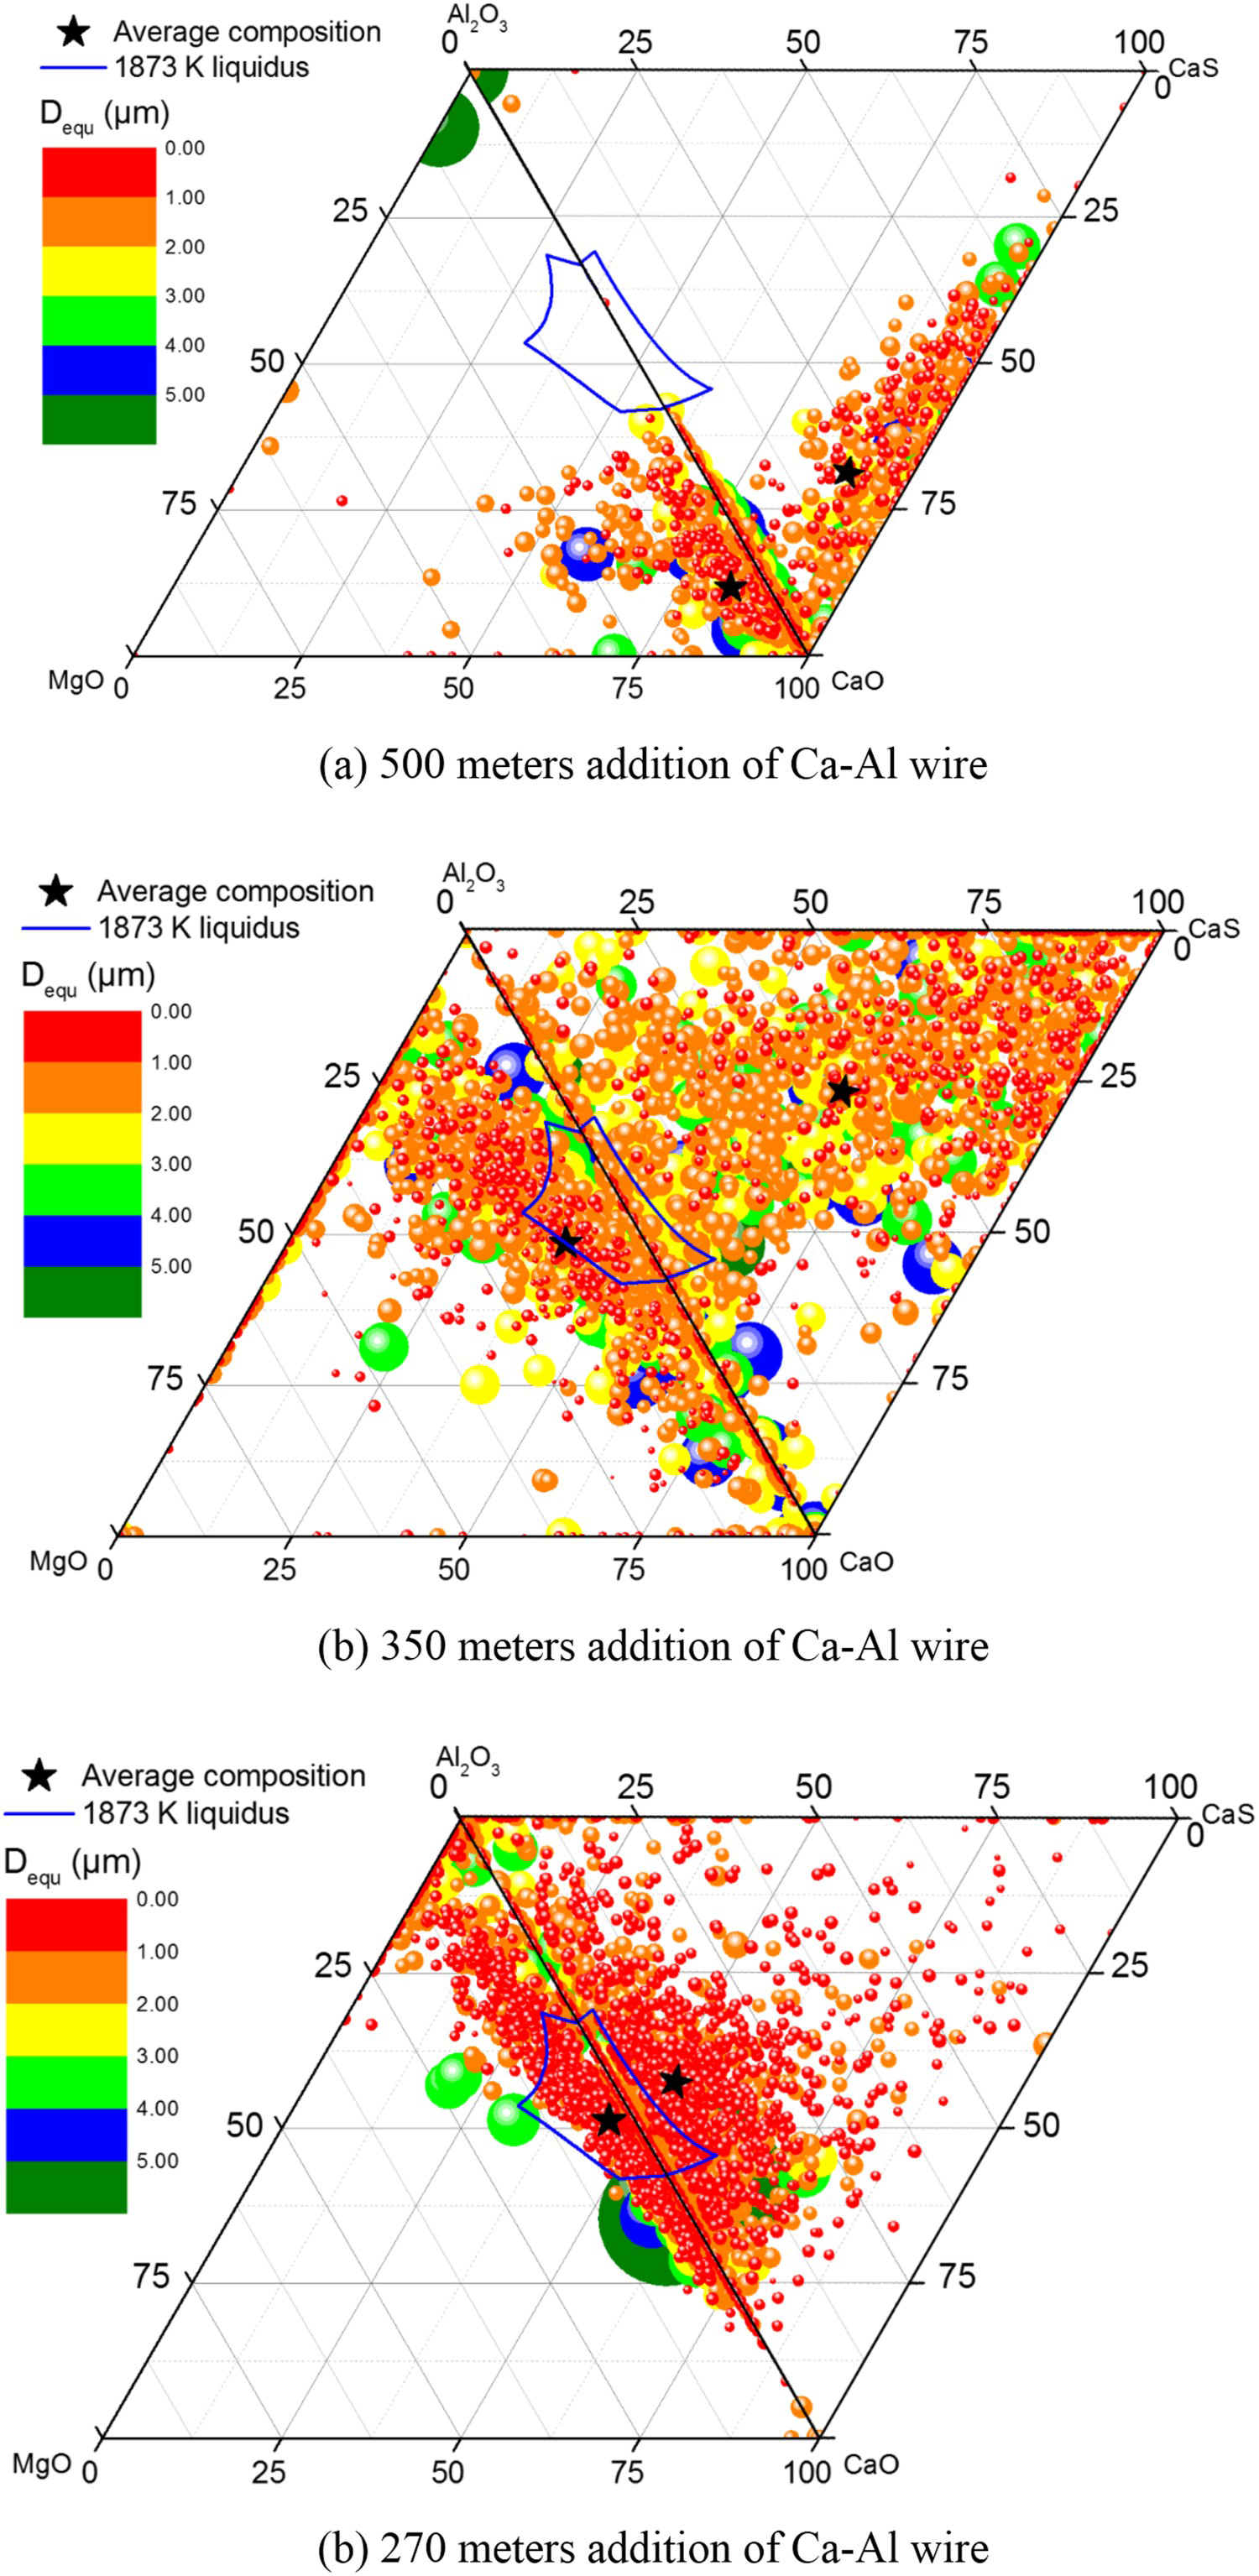
Coupling thermodynamic and kinetic studies: Variation of inclusions in stainless steel during solidification and cooling/heating (Ren, Pistorius, et al. 2017; Wang, Li, et al. 2019; Wang, Yang, et al. 2019)
The variation in the amount, size and composition of non-metallic inclusions in steel during the solidification and heat treatment has been paid more and more attention, (Luo et al. 2015; Ren, Zhang, et al. 2017; Yang et al. 2017; Cheng et al. 2019; Wang, Li, et al. 2019; Wang, Yang, et al. 2019; Zhang X et al. 2019) especially for stainless steels (Ren, Zhang, et al. 2017; Wang, Li, et al. 2019). Element segregation occurred during the solidification process leads to the enrichment of elements and the chemical equilibrium is usually temperature dependent and shifts during the solidification and cooling of steel, both of which cause the variation of inclusions in thermodynamics. Besides, the composition and size of inclusions after solidification and heating are also influenced by kinetic conditions.
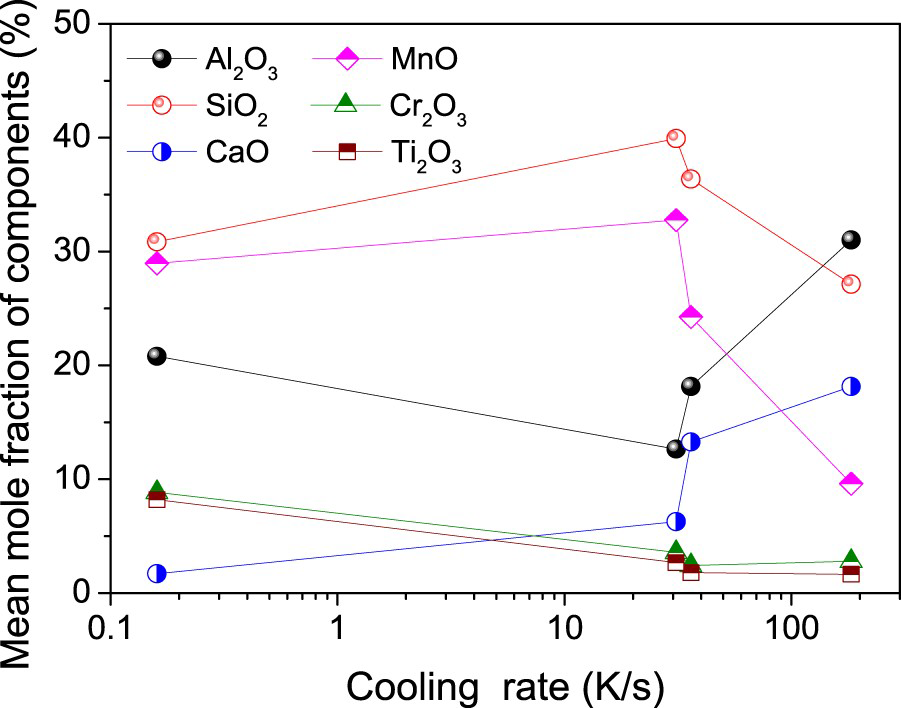
Figure 35 shows the morphology of typical inclusions in a stainless continuous casting and in steel samples after they were remelted and cooled with different cooling rates. Inclusions were nearly spherical. The inclusion in the 183 K/s sample appeared homogeneous in the element, and the size was smallest. As the cooling rate decreased, other phases precipitated inside or on the surface of the inclusions, shown as the grey phase in the particles of (a) and (c)-(e) in the figure, inducing the inhomogeneous morphology of inclusions, and the fraction of new phase was high under smaller cooling rate. The MnCr2O4 phase in inclusions of the stainless steel precipitated at the temperature lower than 1350 °C, at which the steel was completely solidified. There should be little Cr2O3 formed in inclusions during solidification. Thus, the relatively stable composition of large inclusions with lower Cr2O3 content was assumed as the composition at the end of solidification. The relationship between the average composition of inclusions at the end of solidification and the cooling rate is shown in Figure 36. For inclusions under >30 K/s cooling rates, as the cooling rate decreased, the contents of Al2O3 and CaO decreased, while the contents of SiO2 and MnO increased. When the cooling rate decreased to 0.16 K/s, the average composition of inclusions slightly varied.
Typical morphology and mass percent composition of inclusions (a) in the initial CC slab and in steel samples under cooling rates of (b) 183 K/s, (c) 36 K/s, (d) 31 K/s, and (e) 0.16 K/s (Wang, Yang, et al. 2019). Effect of the cooling rate of the molten steel on the average composition of inclusions at the end of solidification (Wang, Yang, et al. 2019).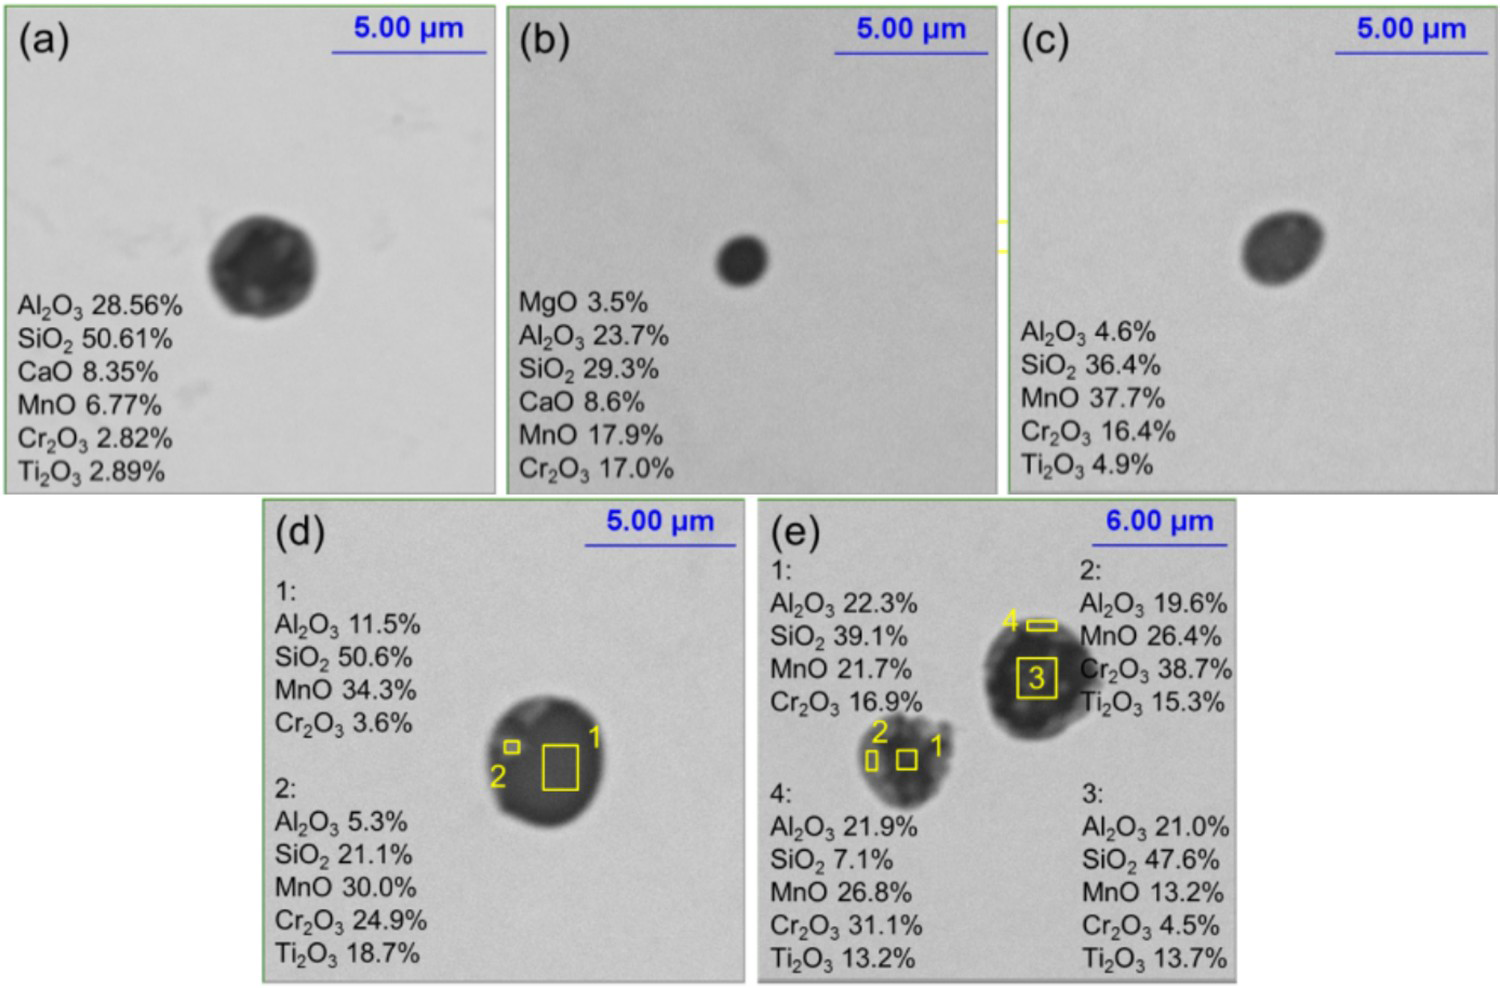
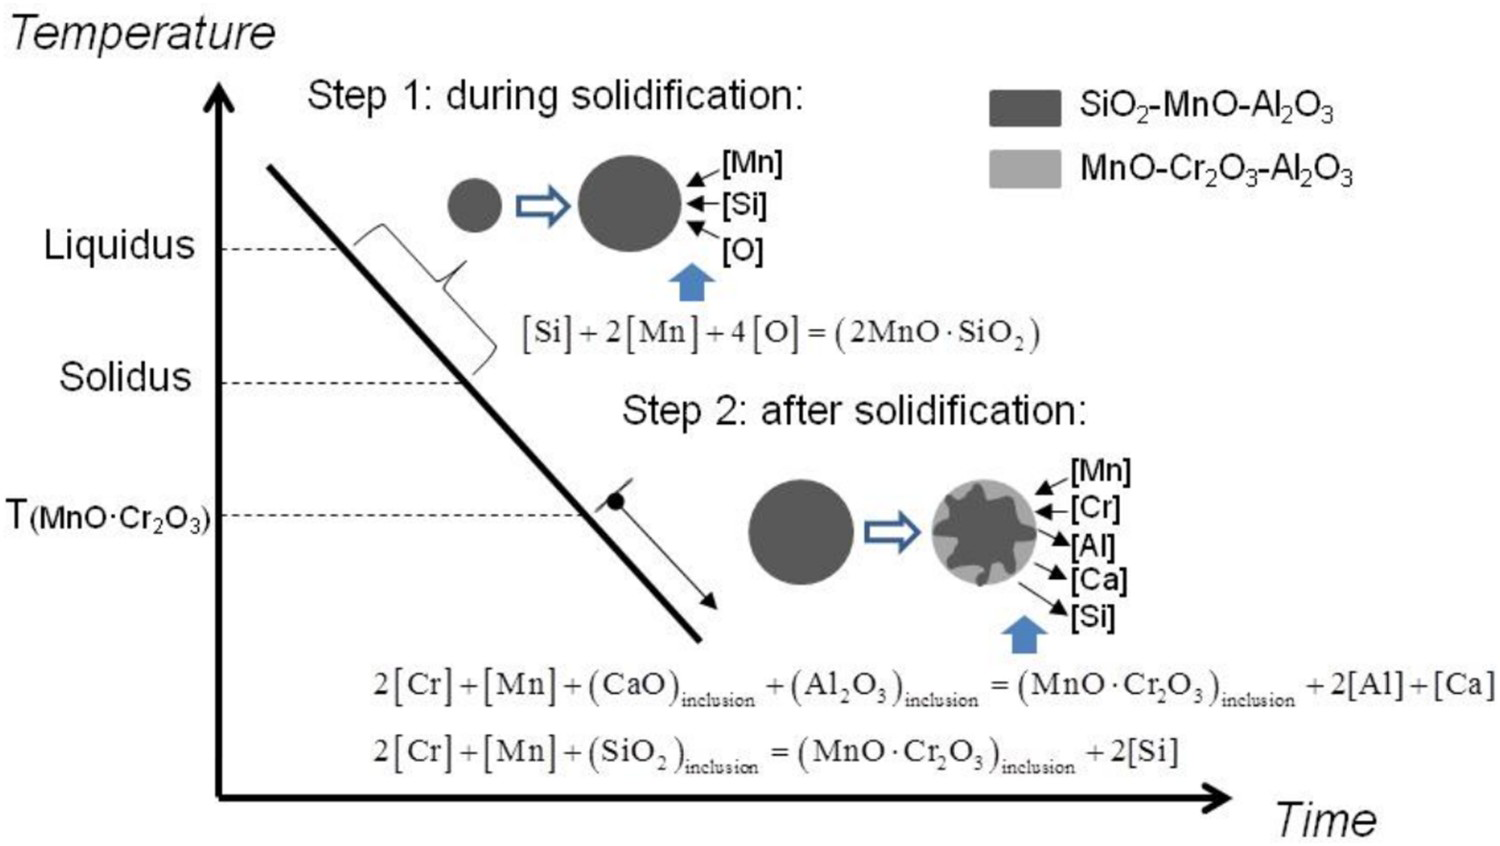
Thus, the variation of inclusions during the cooling process of the steel was estimated to two steps, as shown in Figure 37. The first step was the precipitation and growth of SiO2-MnO-Al2O3 type inclusions during the solidification process. The main reaction occurred during solidification was the formation of 2MnO·SiO2. In this stage, the cooling rate might affect the composition, size, and number of inclusions. The second step was the transformation of inclusions into the MnO-Cr2O3-Al2O3 system in solid steel by the interaction between the inclusion and the steel matrix when the temperature decreased to the formation temperature of MnO-Cr2O3,
Illustration of the inclusion transformation during the cooling process of the steel (Wang, Yang, et al. 2019). in the figure that was approximately 1310 °C.
The evolution route of oxide inclusions during the heat treatment of a 18Cr-8Ni stainless steel at 1373 K are shown in Figures 38 and 39. Inclusions in the unheated steel were liquid MnO-SiO2-rich ones. During the heat treatment, the [Cr] in steel transferred from steel to the interface between the steel matrix and MnO-SiO2-rich phase. The [Cr] primarily reduced the MnO and SiO2 in inclusions as reaction given in Equation (19). Then, MnO·Cr2O3 spinel formed on the surface of MnO-SiO2-rich core phase. Meanwhile, the formed [Si] and [Mn] transferred back to the steel matrix from the reaction interface. The reaction surfaces grew concave with consumption of MnO and SiO2 from the MnO-SiO2-rich core phase. As time progressed, the [Cr], [Si] and [Mn] continued to transfer between steel matrix and the steel/MnO-SiO2-rich inclusion interface. The generated MnO·Cr2O3 grew and trended to be angular. Finally, inclusions were fully modified to pure MnO·Cr2O3 spinel.
Morphology of typical inclusions in steel under 1373 K heat: (a) Before heat treatment, (b) after 15 min heat treatment, (c) after 60 min heat treatment (Ren, Pistorius, et al. 2017). Schematic of the evolution mechanism of oxide inclusions during heat treatment of 18Cr-8Ni stainless steel at 1373K (Ren, Pistorius, et al. 2017).
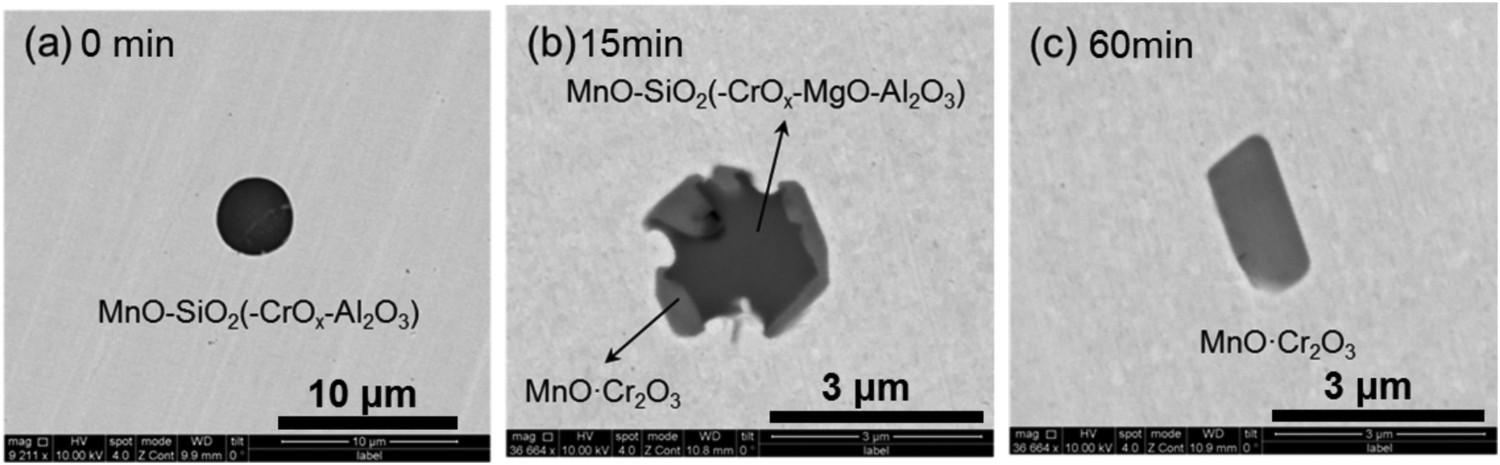
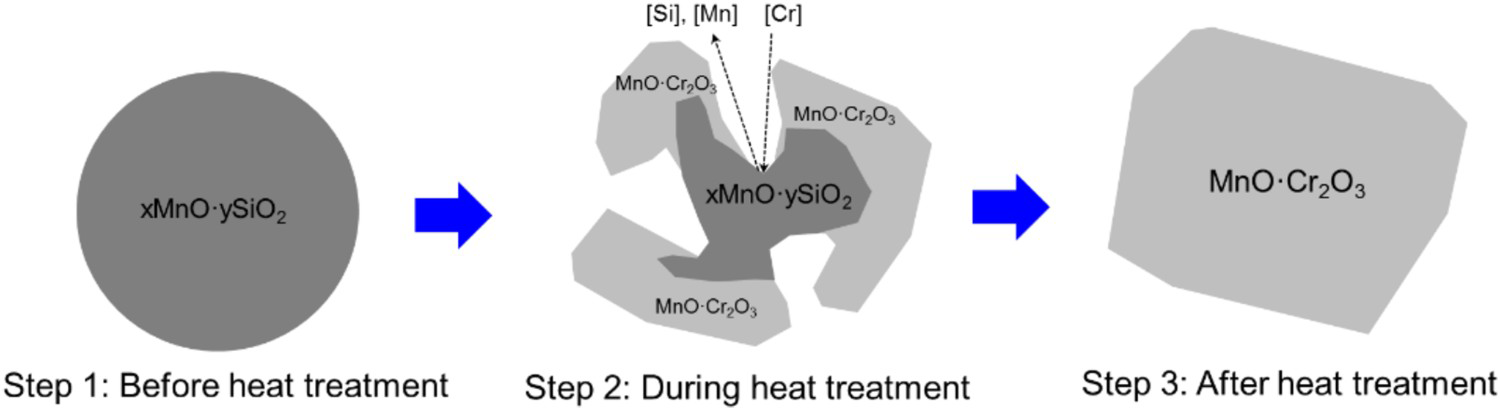
Figure 40 shows the average composition of inclusions in steel samples as a function of heating temperature. The transformation tendency of MnO was identical to SiO2, indicating that MnO and SiO2 had similar reactions with the steel during heating. When the heating temperature was below 1100oC, the decreasing rate of MnO and SiO2 and the increasing rate of Cr2O3 over temperature were quite small, compared to those under heating over 1100oC.
Mean composition of inclusions in steel after heating for one hour (Wang, Li, et al. 2019).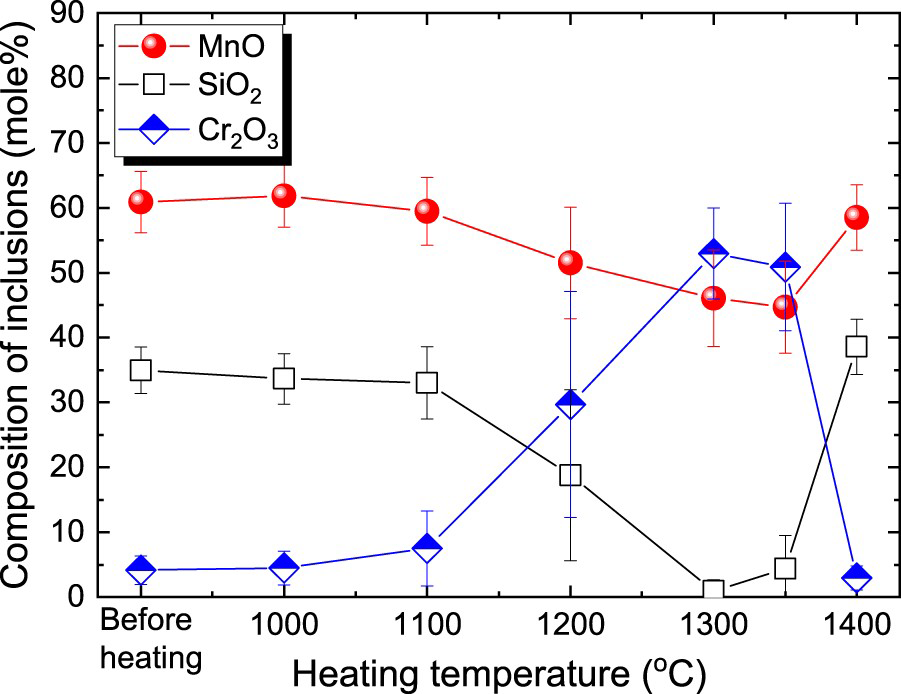
Equilibrium precipitation of inclusions in 18Cr-8Ni stainless steel during heat treatment from 1073 K to 1673 K was calculated using FactSage 6.4 and is given in Figure 41. The equilibrium inclusions above 1573 K were MnO-SiO2-rich liquid inclusions. There was a wide stability range of MnO·Cr2O3 spinel inclusions between 1253 and 1573 K, in line with the observed results in Figure 38. Below 1173 K, the MnO·Cr2O3 spinel inclusions were predicted to transform to MnO·SiO2 ones again. MnS was expected to precipitate with the oxides below 1573 K. Thus, the transforamtion of inclusions during heating process was significantly influced by the heating temperature.
Equilibrium precipitation of inclusions in 18Cr-8Ni stainless steel during heat treatment from 1073 K to 1673K (Ren, Pistorius, et al. 2017).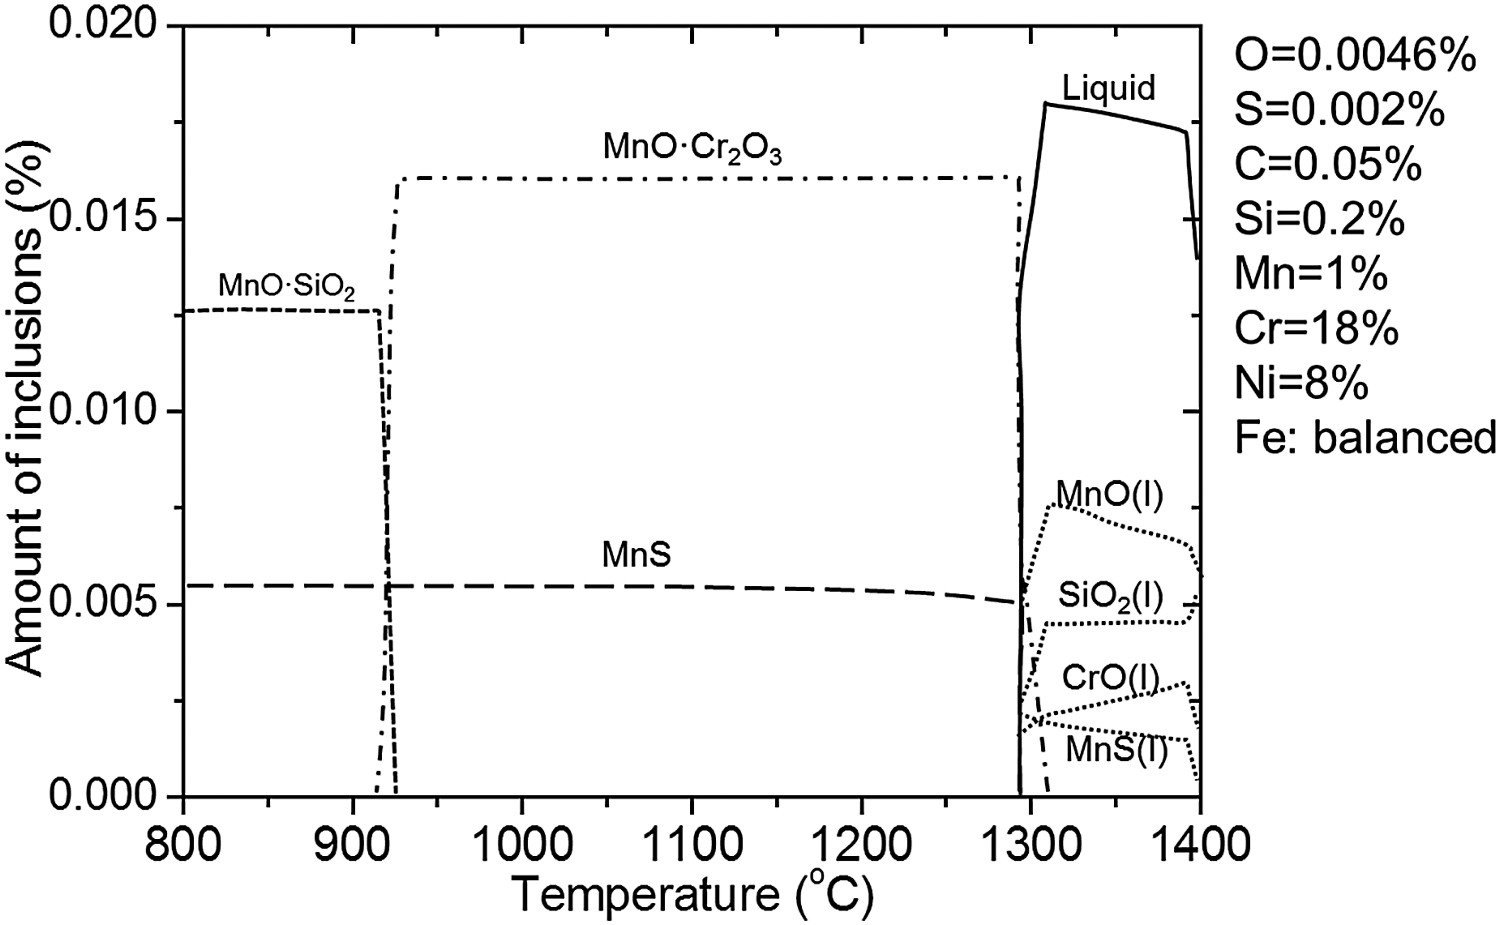
Summary
The current review summarised studies of the current authors on the modelling of non-metallic inclusions in steel. Both kinetic studies including the nucleation, collision and agglomeration of inclusions, the interaction between the inclusion and the bubble in the molten steel, the behaviour of inclusions in the molten steel of the argon-stirred ladle, the continuous casting tundish and mould strands were included. Thermodynamic studies included the deoxidation, the precise calcium treatment, and the precipitation of inclusions during cooling and heating of the steel.
Though the studies were very extensive, more future innovative investigations on the modelling of inclusions in steel should be performed, including
Numerically but not analytically solving the nucleation, collision and growth of inclusions in the molten steel with pseudo-molecules as a starting point; Combining nanoscale and microscale phenomena of the nucleation and growth of inclusions, and the entrapment of inclusions to the solidifying shell, slag and bubble surface with the macroscale fluid flow in the molten steel; Predicting the composition, quantity, and size distribution evolution of inclusions in the molten steel during refining and casting processes; Predicting the spatial distribution of the composition, size and number density in the cast product; Considering the newly generated inclusions from air absorption, the reaction between molten steel and slag and lining refractory, and from the precipitation during cooling process; Predicting the steel properties with predicted inclusions in the final steel product.
The long-term objective of the modelling of inclusions is to predict and control the inclusion-related defects, approximately one third of the total defect of the steel, and to apply the proposed models to optimise production operations to achieve high quality clean steels.
Footnotes
Acknowledgements
The authors are grateful for support from the National Science Foundation China (grant number U1860206, No. 51725402), the High Steel Center (HSC) at Yanshan University, and Beijing International Center of Advanced and Intelligent Manufacturing of High Quality Steel Materials (ICSM), Beijing Key Laboratory of Green Recycling and Extraction of Metals (GREM) and the High Quality Steel Consortium (HQSC) at University of Science and Technology Beijing, China.
Disclosure statement
No potential conflict of interest was reported by the author(s).