
Abstract
The optimum conditions for manganese dioxide (MnO2) removal were investigated in two simulated conditions, purification and electrowinning, using a Pb-0.7 wt.% Ag electrode. Linear sweep voltammetry and Cyclic voltammetry tests were conducted to study the effect of temperature and concentrations. SEM-EDS and XRD were employed to study the surface characterisations and chemical compositions. The results revealed that the electrowinning operating conditions are more appropriate than the purification conditions for MnO2 removal. The highest current efficiency of manganese removal was 21% which was obtained in the EW electrolyte at 125 A m−2 at 40°C after 2 h of electrolysis. The Current Efficiency was increased significantly at lower Mn ion concentrations (0.1–1.0 g L−1) while it stayed constant beyond the concentration of 1.0 g L−1. The results showed that an increase in temperature depolarised the oxygen evolution reaction and the addition of Mn2+ suppressed formation of PbO2 on anode surface.
Keywords
Introduction
Lead-based anodes are conventional electrodes, widely used in the zinc electrowinning (EW) process. The main advantages of these anodes are their relatively low cost, long life of 2–8 years, good electrical conductivity and robustness (Moats 2008). Lead-based anodes, however, require a high overpotential for the oxygen evolution reaction (OER), ranging between 600 and 800 mV (Moats 2008). Approximately 20% to 25% of the overall cell potential is due to the OER overpotential on Pb-Ag anodes during zinc EW process (Schmachtel et al. 2008).
Lead-based anodes also play an important role in controlling manganese concentration in the process. The primary source of manganese in the roasting-leaching-EW process of zinc is the manganese associated with zinc sphalerite flotation concentrates. The non-ferritic zinc and manganese are first dissolved in a neutral leach liquor while ferritic zinc and manganese, remaining in neutral leach residue, are then dissolved in hot acid leach (Verbaan and Mullinder 1981; Zhang and Cheng 2007). Oxidative pressure leach process extracts higher zinc and manganese (Verbaan and Mullinder 1981). A secondary source of manganese is the addition of manganese in the form of KMnO4 (potassium permanganate) or in form of manganese dioxide as an oxidant to the leaching circuit for oxidising iron impurities (Zhang and Cheng 2007).
Manganese may have either positive or negative effect on the process, depending on its concentration in the electrolyte (Verbaan and Mullinder 1981; Zhang and Cheng 2007). Low concentration of manganese (1–5) g L−1 can minimise the corrosion rate of lead-silver anodes and reduce the contamination of zinc by lead. Excess amounts of manganese in the electrolyte decrease significantly the current efficiency of zinc deposition causing detrimental effects on the overall efficiency of the operation (Tilak et al. 1986). Therefore, manganese concentration should be controlled in an optimum range during zinc EW. The concentration of Mn is normally controlled during electrolysis by the oxidation of manganese ions at the Pb-Ag anode by forming insoluble MnO2 deposits. This layer must be periodically removed from the anode surface to allow a uniform current distribution (Li et al. 2019a, 2019b, 2019c, 2020a). The formation of MnO2 and its subsequent removal from the anodes is an important function of the Pb-Ag anodes as it removes the excess manganese from the electrolyte.
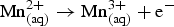
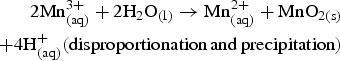
The overall reaction of MnO2 formation on anode in sulfate acidic electrolyte containing Mn (II) can be written as following:.

The rate of manganese dioxide formation on the anode surface can be controlled by two mechanisms: activation-control (in which rate is governed by the ability of the reactants to acquire enough energy to react) (Eqs. 2–4) or diffusion control (Eqs. 5–7) (Clarke et al. 2006; Mahon and Alfantazi 2014; Mohammadi and Alfantazi 2015). As reported by Clarke et al. (2006), activation-control is the dominant mechanism in low acid concentration (<1.0 M). In this mechanism, the permanganate is formed at high anodic potentials (Eq. 2) and then via a chemical reaction, permanganate is combined with Mn (II) (Eq. 3) and finally disproportional reaction of Mn (III) can result in the MnO2 formation (Eq. 3) (Mohammadi and Alfantazi 2015).


In concentrated acid electrolyte, the diffusion-controlled has been proposed to be the favoured mechanism for MnO2 deposition. In this mechanism, the Electrochemical-Chemical-Electrochemical reactions (ECE) yield MnOOH as an intermediate during Mn oxidation process (Eqs. 5–7).


Other important Mn2+ reactions on anode are as followings:.


Replacement of lead-based anode by the Dimensionally Stable Anode (DSA), also known as Coated Titanium Anode (CTA), became a popular research subject since their application for the first time in the chlor-alkali industry in the 1960s when Henri Beer invented the titanium electrode coated with mostly precious metal oxides (Duby 1993). These anodes are typically made of a Ti substrate coated by Mixed Metal Oxides (MMO) with high melting and recrystallization points. They offer a very good dimensional stability in the cell (Lee et al. 2011). The overpotential of OER on MMO anodes is also substantially lower, thus offering considerable energy saving possibilities (Moats et al. 2003). A number of oxides and mixed oxides have been proposed as catalytic coating on Ti substrate, mostly based on Ta2O5, IrO2, RuO2, Sb2O5, SnO2 and Co3O4 (Ueda et al. 1995; Kulandaisamy et al. 1997; Otogawa et al. 1998; Morimitsu et al. 2000; Chen et al. 2001; De Mussy et al. 2003; Msindo et al. 2010). Among these compounds, IrO2-Ta2O5 has been reported to be the best choice for anodes designed for oxygen evolution, primarily due to its low OER overpotential of 300 mV (Moats 2008; Schmachtel et al. 2009) and its high corrosion resistance (Kulandaisamy et al. 1997; Xu and Scantlebury 2003; Sandoval et al. 2010). These anodes are being very successfully used in chlor-alkali industry and started to be used in copper EW process (Sandoval et al. 2010). However, there is no consensus on their performance and lifespan under Zn electrolysis conditions.
Due to the presence of impurities in the zinc electrolyte, especially manganese, the MMO anodes has not been implemented till now. The principal issue encountered with manganese is that manganese ions in the electrolyte are oxidised to MnO2 which may block the active sites of the catalytic coating on the anode (Li et al. 2020b, 2020c, 2020d, 2021). Moreover, it has been reported that MnO2 growth at the interface of the electrode base material and the active coating, may result in flaking off of the coating at the anode surface (Nijjer et al. 2000). It turns out that, contrary to lead-based anodes, removing manganese from the electrolyte through anode washing by water pressure would not be conceivable with MMO anodes because of the presence of coating. Therefore, for replacing lead-based anodes with MMO anodes, the control of manganese in EW tank becomes crucial.
The focus of this research was on exploring the possibility of removing manganese from the zinc electrolyte using lead-based anodes, with the aim of providing suitable conditions for using MMO anodes. Although several ways have been proposed in the literature to oxidise manganese in the electrolyte, i.e. ozone oxidation or injection of SO2/O2 mixture, none of them has been industrially implemented yet in zinc electrowinning process. Oxidation of manganese on lead-based anodes has been widely researched, although not for the same purpose, and quite valuable technical data are available in this regard. Electrochemical removal of manganese was never fully optimised as a means of controlling the manganese ion concentration in the electrolyte. Manganese oxidation was studied extensively in connection with the corrosion stability of the lead anodes. Our purpose in this research was to investigate the feasibility of using an auxiliary electrochemical system to remove Mn from the electrolyte before entering into the main electrowinning (EW) cell. Such an auxiliary system would not necessarily operate under the same conditions as those of the EW cell. Since such a system is independent from the EW cell, it has the flexibility to operate under conditions maximising the Mn removal.
The auxiliary system could be implemented in one of two locations in the zinc EW process: after the purification of the electrolyte process or near the electrolysis section, either in parallel or in series mode (Figure 1). The operating conditions at these locations are quite different; the former consisting of an electrolyte at 80°C and pH=4 and the latter with an electrolyte at 40°C and pH=1. The manganese concentration is kept at l.0 g L−1 as required for a better electrochemical performance of a MMO anode. The use of lead-based anode is one of the natural choices for such an auxiliary system due to the known performance and low cost of these electrodes. The optimum operating conditions at the two locations must therefore be determined to assess the technical and economic viability of the electrochemical purification system and in turn establish the best location for implementation. To answer these questions, we chose a commercial Pb-0.7 wt.% Ag anode as the target anode to study the effect of operating conditions such as pH, temperature and current density on Mn removal efficiency.
Two possibilities for implementation of Mn removal system in the zinc electrowinning process; (a) after the purification process or (b) in close loop with the electrolysis process.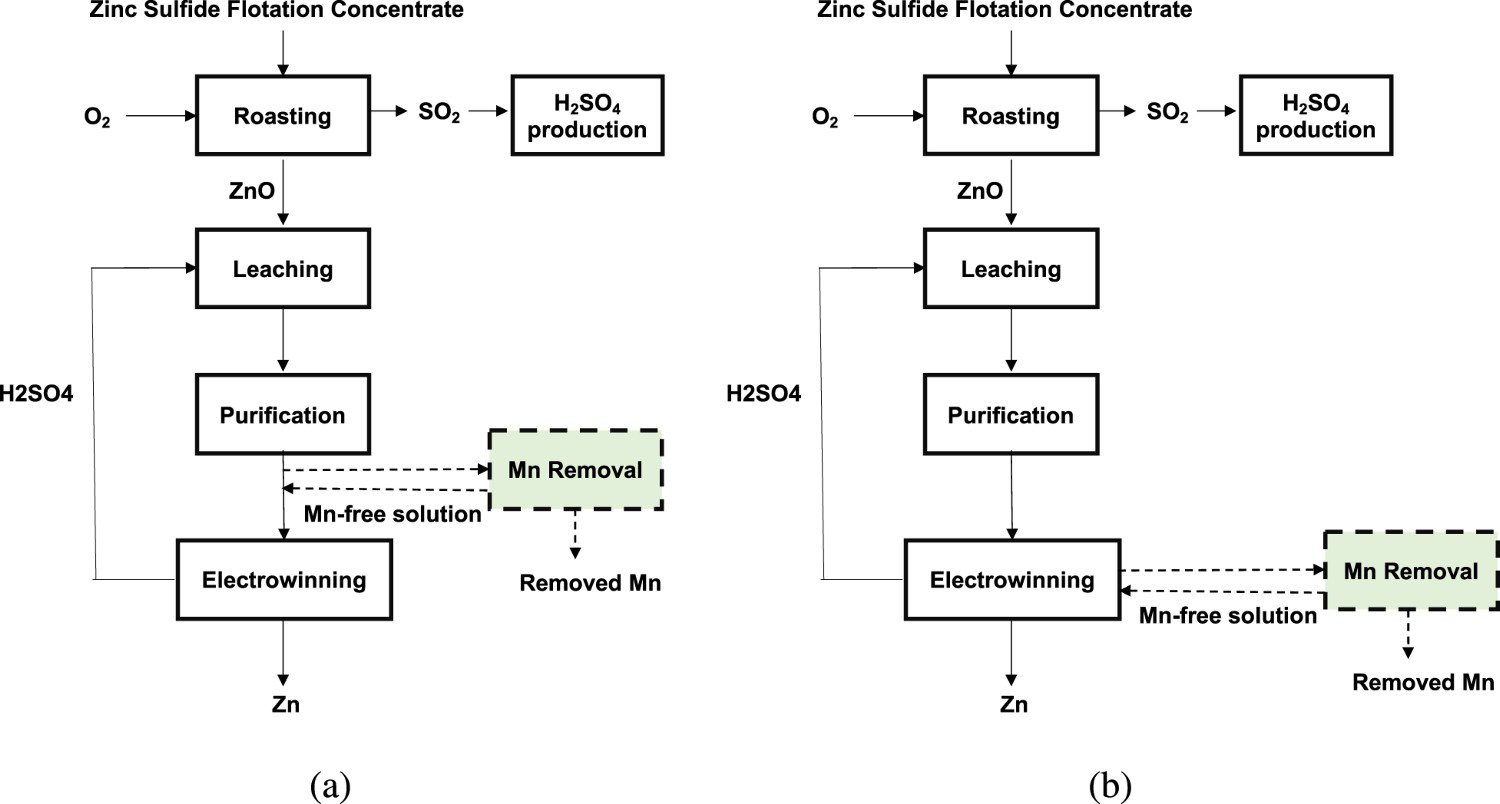
Experimental
Electrolyte composition and electrolysis parameters
Two types of electrolytes were used, corresponding to the simulated conditions of purification or electrolysis process. The purification electrolyte was prepared by dissolving ZnO in sulfuric acid to a concentration of 150 g L−1 Zn2+. MnSO4.H2O was added as the Mn precursor to give a target concentration of l.0 g L−1 Mn2+ and the pH was adjusted at 4.0. The standard EW solution including 55 g L−1 Zn2+, l.0 g L−1 MnSO4.H2O and 170 g L−1 H2SO4 was also prepared. All chemicals were analytical grade reagents and distilled water was used for all experiments. A power supply was employed to apply a constant current for each experiment and four current densities of 65, 125, 250 and 500 A cm−2 were used. Experiments were conducted at four temperatures: 25°C, 40°C, 60°C and 80°C. The electrolyte temperature was maintained constant using a water thermostated double–wall cell. Five Mn2+ concentrations were tested (0.1, 0.5, 1.0, 2.0 and 4.0 g L−1).
The electrochemical tests were conducted in 500 mL solution magnetically stirred at 200 rpm using a magnet bar of 2 cm in length and 0.5 cm in diameter. Silver chloride (Ag, AgCl/KClsat; 0.197 V (SHE)) was used as reference electrode during the galvanostatic tests. The experiments were conducted using a three-electrode set-up, comprising of two Al cathodes (counter electrodes) and one Pb-0.7 wt.% Ag anode (working electrode). The distance between anode and cathode was kept at 2.5 cm. The Pb-Ag anode was placed between the two Al electrodes in which only one side of Al cathode was electrochemically active; the other side was covered by a non-conducting and acid resistant lacquer (Miccrostop Stop-off Lacquer- M59012 Tolber). The exposed surface area of each cathode was 40 cm2 and the available anode surface on each side was 40 cm2. Prior to testing, the exposed surface of the cathodes was manually polished with emery papers of 600 and 1200 grit of SiC while the Pb-Ag anode surface was gently cleaned using a plastic spatula in order to hold the manganese dioxide. However, for the tests using fresh anode, the Pb-Ag surface was polished, similar to the cathode. Before each electrochemical test, the working and counter electrodes were rinsed with distilled water and ethanol and dried by an air drier. The galvanostatic tests were performed over a period of 2 h; sampling of the electrolyte was carried out at 0, 15, 30, 45, 60, 90 and 120 min.
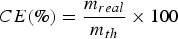
The current efficiency (CE) was calculated according to the following equations:.

For the linear sweep voltammetry (LSV) tests, two electrodes, Al as auxiliary and Pb-0.7%Ag as working electrode, were used. The cyclic voltammetry experiments were performed using Pt as counter electrode and Pb-0.7%Ag as working electrode. For some of the CV experiments, two Pt electrodes were employed. All the electrodes were cast in polyester resin with an exposed surface area of 1 cm2. The electrodes as well as the reference electrode were mounted in a Teflon holder set-up and a GAMRY® interface 1010E potentiostat was used to conduct the experiments in different potential ranges.
The manganese concentration in the electrolyte solutions was determined by Micro Plasma-Atomic Emission Spectroscopy- 4200 by Agilent (MP-AES). A Tescan VEGA3 scanning electron microscope with energy dispersive spectroscopy (SEM-EDS) was used for the surface characterisation and chemical analysis. X-ray diffraction (Aeris by Panalytical) and X-ray Fluorescence (Rigaku, Model ZSX-Primus II) were used to evaluate the composition of anodic oxide layers.
Results and Discussion
Galvanostatic experiments
The galvanostatic experiments were carried out for 2 h using electrolyte, simulating the EW and purification process, under different operating conditions. The chronopotentiograms recorded for different current densities and temperatures for both electrowinning and purification are presented in Figure 2(a, b) and (c, d), respectively. It is observed that in EW condition (Figure 2(a, b)) by increasing the current density the anodic voltage increases while increasing the temperature results in a decrease in the voltage. Similar tendency for the current density variations and the temperature changes was observed in the case of purification condition (Figure. 2(c, d)).
Effect of temperature and current density on chronopotentiograms obtained in different electrowinning and purification conditions.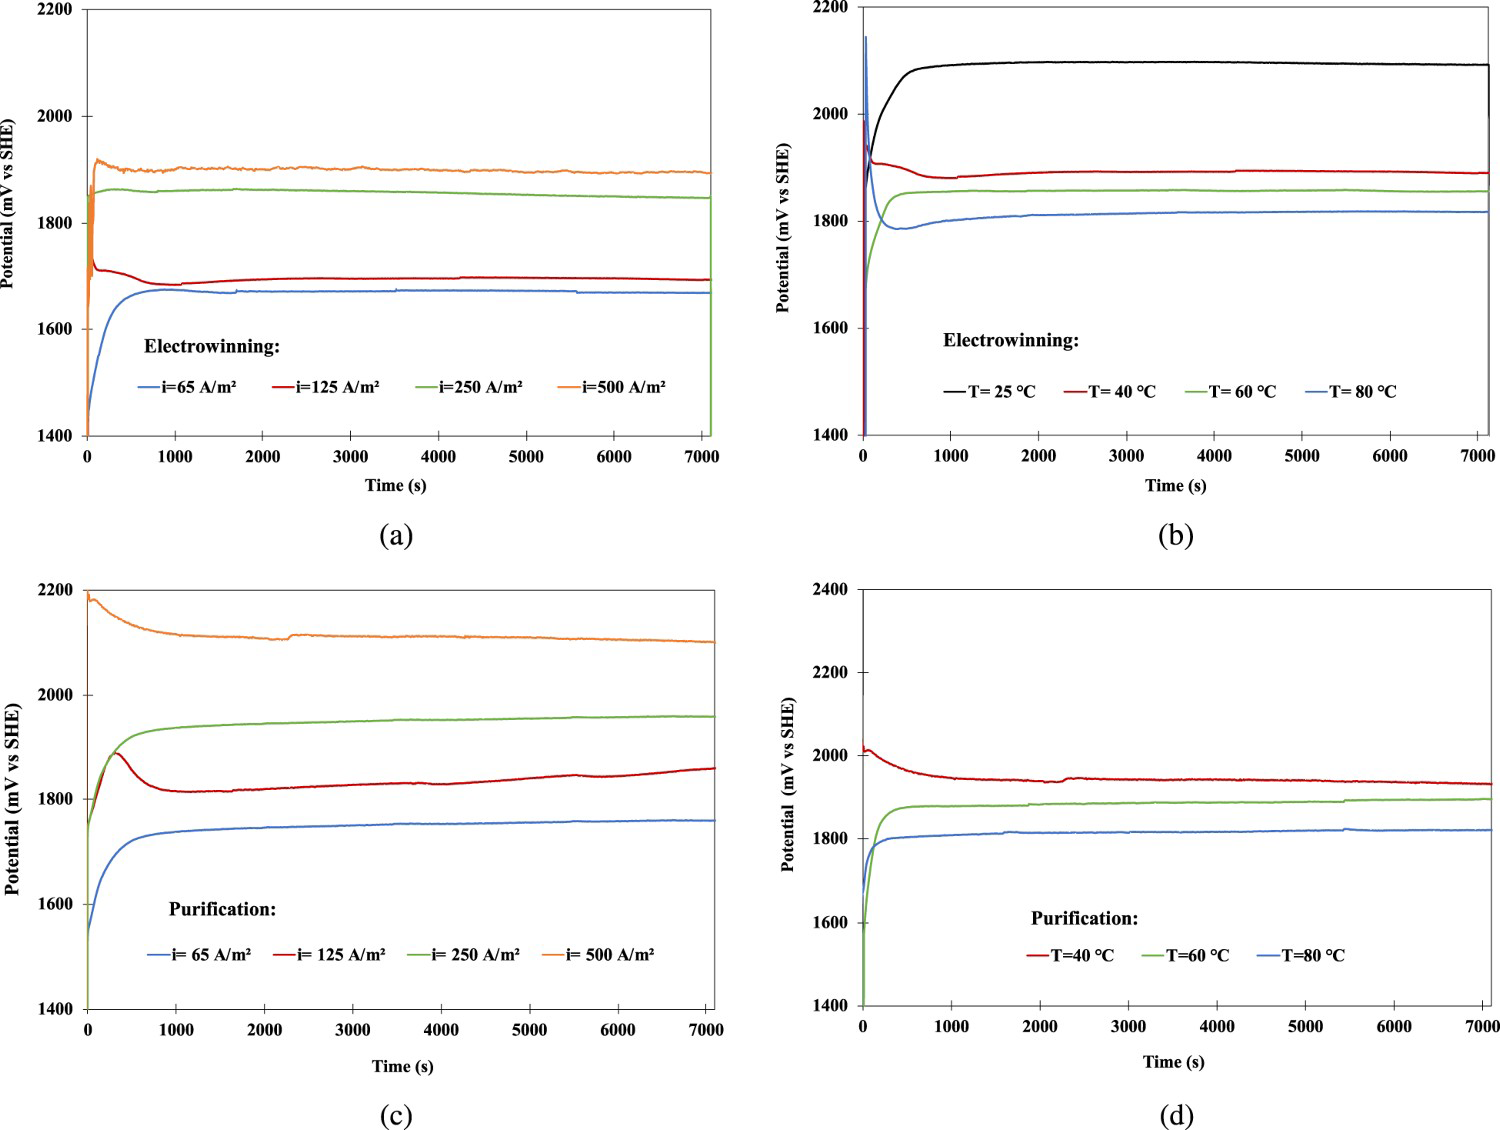
Current efficiency
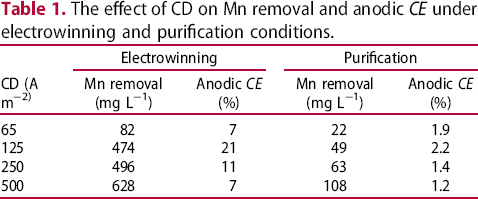
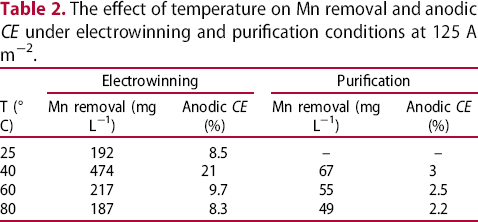
The current efficiencies as a function of current density and temperature are shown in Figure 3. According to these results, for both EW and purification conditions, the highest current efficiency for manganese removal was obtained at 125 A m−2 (Figure 3(a)) and at 40°C (Figure 3(b)). The current efficiency values in electrowinning condition were much higher than those in purification condition. The highest current efficiency value for manganese dioxide formation, with an initial concentration of 1 g L−1 of Mn2+ as needed for better functionality of MMO anodes, was 21% which was obtained in the EW condition after 2 h. The highest CE value in the purification condition was 2% after the same time. More details are presented in Tables 1 and 2. Table 1 shows that, although higher Mn removal is obtained at 500 A m−2 in comparison to 125 A m−2 (628 ppm compared to 474 ppm), the CE is lower due to high applied current density. The cathodic CEs were also measured for these two current densities. The cathodic CE at 125 A m−2 was 90% and at 500 A m−2 was 95%, respectively.
The current efficiency as a function of current density (a) and temperature (b) for standard EW: 55 g L−1 Zn2+, 170 g L−1 H2SO4 and l g L−1 Mn2+ and standard purification electrolytes: 150 g L−1 Zn2+, l g L−1 Mn2+, pH 4 during 2 h. The effect of CD on Mn removal and anodic CE under electrowinning and purification conditions. The effect of temperature on Mn removal and anodic CE under electrowinning and purification conditions at 125 A m−2.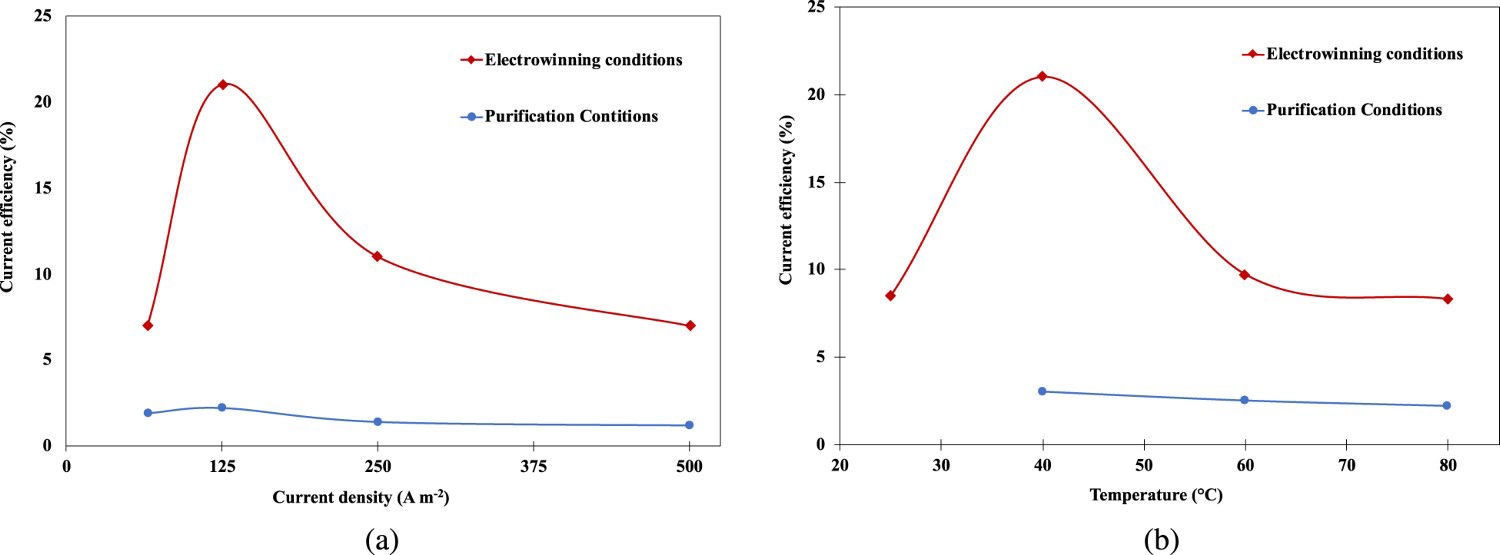
Verbaan and Mullinder (1981) studied the effect of temperature and current density in a solution containing 160 g L−1 Zn2+, 20 g L−1 Mn2+ and 10 g L−1 of H2SO4. They reported that the progressive increase of the anodic current density from 50 A m−2 to 150 A m−2 greatly decreases the CE of MnO2 deposition. They also observed that the increase of temperature from 70°C to 90°C increases significantly the current efficiency. Moreover, they found the increase of sulfuric acid concentration from 0 to 30 g L−1 has no great effect on CE and even its increase to higher concentration of 50 g L−1 decreases the current efficiency. These results are not in accordance with our results, probably because of difference in electrolyte composition. They used very high concentrations of Mn2+ and low acid concentration resulting in lower ionic conductivity. Our results show that the current efficiency is low at very low current densities. This is most likely due to the competition between oxygen evolution and manganese oxidation, the former being dominant. By increasing the current density, the overvoltage of oxygen evolution increases, thus favouring manganese oxidation. Further increase in current density may generate a depletion layer at the anode surface rendering the reaction controlled by diffusion rate. This hypothesis is supported by the fact that the current efficiency at 250 A m2 is not significantly different from that at 500 A m2. The slight difference is most likely due to the fact that at 500 A m2 more manganese is removed after 2 h than that at 250 A m2, making the diffusion rate slightly lower at the latter case.
Hrussanova et al. (2004) studied the influence of temperature and current density on oxygen overpotential in lead alloy anodes. They reported that the anode potential increased when temperature decreased, and current density increased. Moreover, increasing the temperature results in oxygen overpotential at lower potential on the anode and this reaction prevents the deposition of manganese on the anode. In conclusion, current efficiency of manganese deposition decreases when temperature increases.
The effect of pH on current efficiency of manganese removal was also explored using similar EW electrolyte containing 55 g L−1 Zn2+, l g L−1 Mn2+ with the pH adjusted at 4.0. This solution was electrolysed under optimum conditions, i.e. at 125 A m−2 and at 40°C for 2 h. The results of were compared with that of the standard EW electrolyte having pH = 0.5 and showed that Mn removal decreased approximately 5 times from 492 g L−1 at pH 0.5 to 93 g L−1 at pH 4.0. This means the EW condition is more favourable for Mn removal compared to purification condition.
Considering all the results, the EW solution containing 170 g L−1 free sulfuric acid and 55 g L−1 Zn2+ is the best medium for Mn removal under optimum operational condition (125 A m−2 at 40°C).
The effect of Mn2+ concentration on anodic current efficiency was studied in under the optimum operating conditions. The current efficiency was calculated at the end 2 h of galvanostatic tests, for each concentration of Mn2+ ions. Figure 4 shows the current efficiency as a function of initial Mn2+ concentration in the solution. For Mn2+ concentrations up to 0.5 g L−1 the current efficiency was low (less than 2%). Then it increased quickly when the Mn2+ concentration increased to 1.0 g L−1. Further increase in Mn2+ concentration did not change the current efficiency. This behaviour indicates that the Mn oxidation rate is primarily governed by diffusion at low concentrations. When the concentration is lower than 1.0 g L−1, a lack of Mn2+ mass transfer towards anode surface can be created. At higher concentrations, diffusion is quick and the Mn deposition is governed by the surface reaction kinetics, and the current efficiency stayed remained beyond the concentration of 1.0 g L−1.
The current efficiency obtained for various concentrations of Mn2+ in EW electrolyte at 40°C and at 125 A m−2 after 2 h of electrolysis.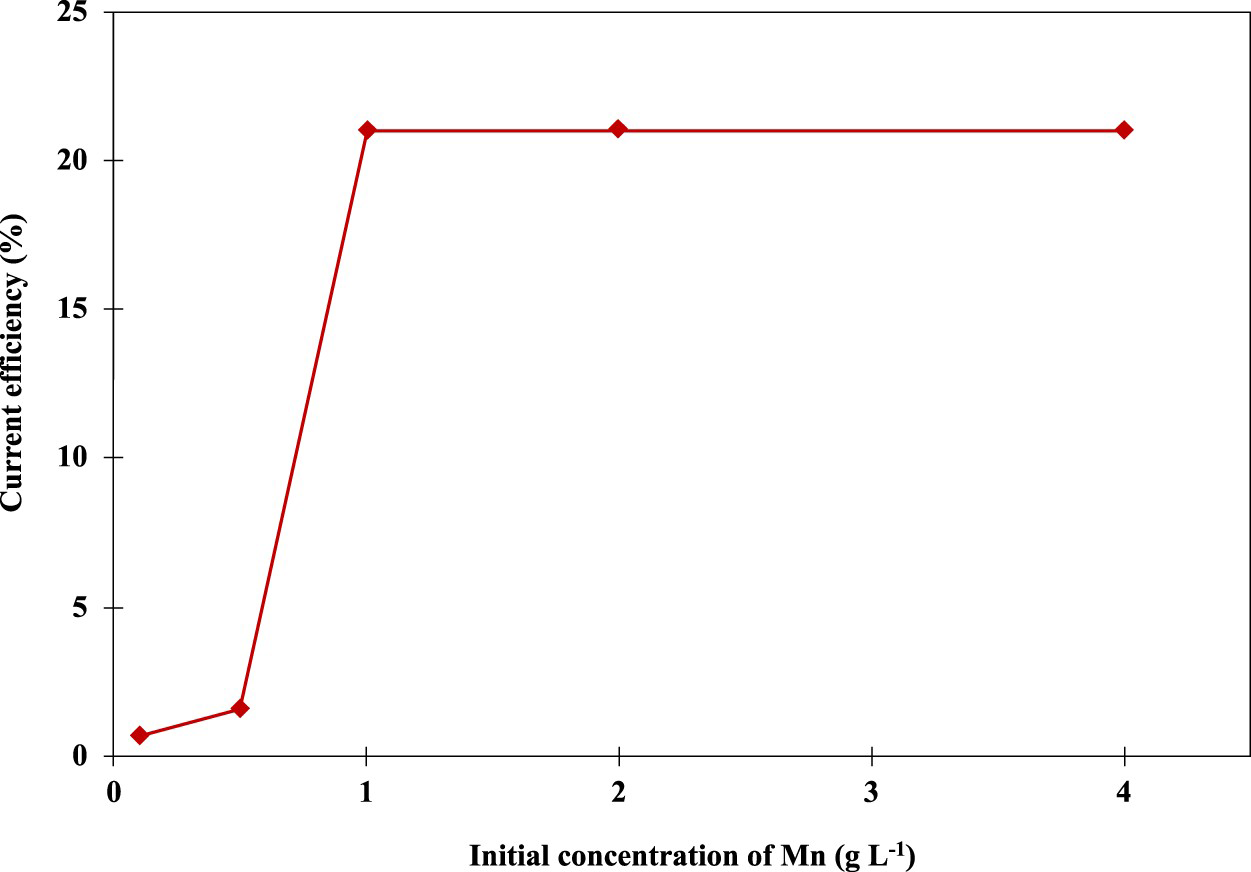
To obtain the CE at different time intervals (instead of at the end of 2 h period), the cumulative current efficiency is presented as a function of time for different manganese concentrations in Figure 5. For this series of tests, fresh lead-silver anodes were used at the beginning of each electrolysis. The results show that at lower manganese concentrations (0.1–0.5 g L−1), the cumulative current efficiency stays quasi-constant during 120 min of electrolysis. However, for Mn2+ concentrations higher than 1.0 g L−1 the cumulative CE decreased significantly during the first hour and then continued to decrease at a lower rate till the end of the second hour. The current efficiency for each interval of 30 min was also calculated independently, revealing that it is around 32% for the first interval and about 11% for the last interval. This strongly suggests that the cleanliness of surface can considerably influence the CE of manganese removal.
Accumulative current efficiency obtained for various concentrations of Mn2+ in EW electrolyte at 40°C under 125 A m−2 after 30, 60, 90 and 120 min of electrolysis.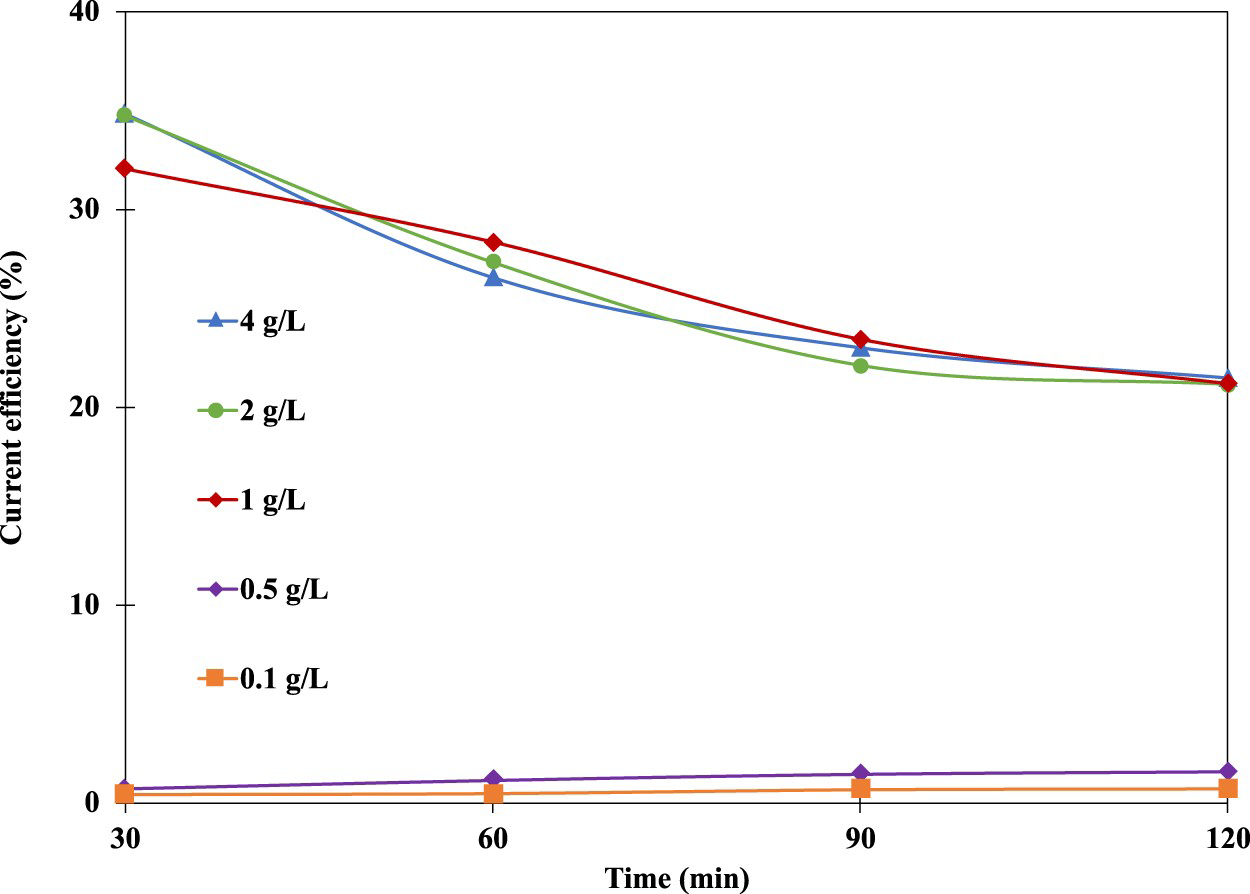
In order to confirm the influence of anode surface cleanliness on the cumulative CE over time, further tests were conducted. The used Pb-Ag anode was replaced by a fresh anode after each 30 min of time interval and the current efficiency was calculated. The results were compared with those of the previous experiment in the presence of 1.0 g L−1 Mn2+ (Figure 6). It can be clearly observed that for the first-time interval (after 30 min), both electrodes having clean surface has similar CE while the difference of calculated CE for the next time intervals increases significantly. The CE decreases at a much lower rate for the test performed with the clean anodes. The slight decrease of the CE from 31% at the first interval to 28% at the last interval is attributed to fact that the concentration of Mn2+ decreases slightly in the electrolyte with time of consuming during 2 h of electrolysis. Thus, the decrease of the Mn2+ concentration influences the diffusion rate, slightly reducing the current efficiency.
Cumulative current efficiency calculated for 1 g L−1 Mn2+ concentration in EW electrolyte at 40°C under 125 A m−2 after 30, 60, 90 and 120 min of electrolysis.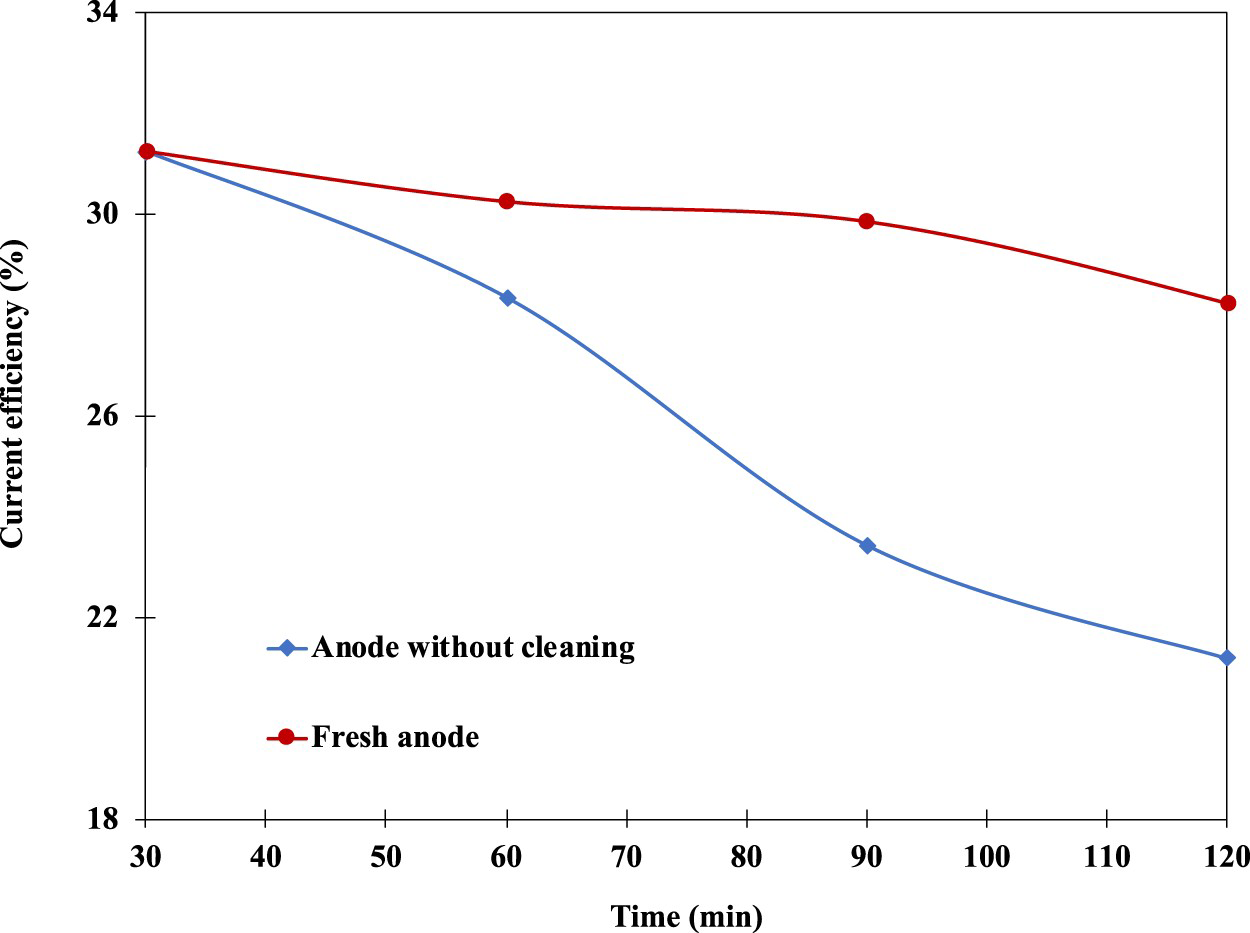
Linear sweep voltammetry (LSV)
The effect of temperature and Mn2+ concentration on the oxygen evolution reaction (OER) on Pb-0.7%Ag anode was studied in the zinc sulfate electrolyte at three temperatures: 40°C, 60°C and 80°C. The anodic polarisation curves for fresh lead-silver anode at different temperatures are shown in Figure 7. The results indicate that the increase of temperature positively affects the OER and depolarises this reaction. Zhang et al. (2018) observed similar tendency for a fresh lead-based anode in zinc sulfate electrolyte without manganese in the range of 20°C to 50°C. They calculated the exchange current density (j0) values for OER and drew the Arrhenius plot and showed that with the increase of temperature, the values of log(j0) decreases and consequently the oxygen evolution reaction is promoted. These results can also explain why the current efficiency of Mn oxidation decreases by increasing the temperature beyond 40°C, as presented in Figure 3(b). Indeed, high temperature decreases the OER overpotential and less current is used for Mn oxidation.
LSV curves obtained in the electrolyte including 55 g L−1 Zn2+, 170 g L−1 H2SO4, 1 g L−1 Mn2+ at 40, 60 and 80°C.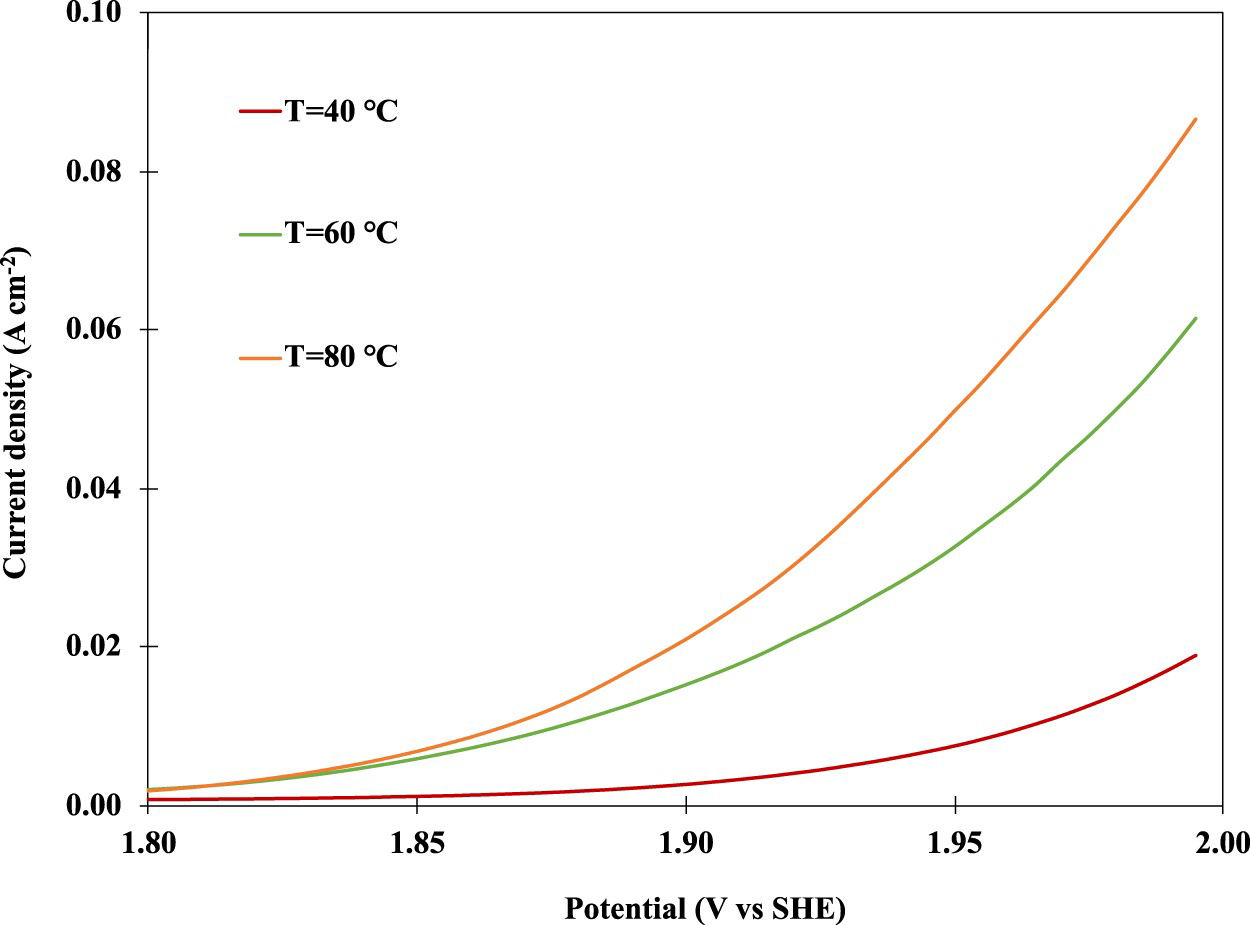
Cyclic voltammetry (CV)
Cyclic voltammetry technique was used to study the electrochemical formation of PbO2 and MnO2 on the surface of Pb-0.7%Ag anode in similar condition of zinc electrowinning. It is well known that the sweep rate and the range of the potential polarisation can affect the appearance of different peaks on cyclic voltammograms (Visscher 1976; Czerwiński et al. 2000). Figure 8(a) depicts the cyclic voltammograms of Pb-Ag electrode in the standard EW electrolyte. It can be observed depending on the sweeping potential range, two different voltammograms were obtained.
Cyclic voltamograms of Pb-Ag electrode in the electrolyte including 170 g L−1 H2SO4 at 40°C in two regions of potential sweeping (A: −0.8 V–2.4 V) and (B: 0.7 V–2.2 V). Sweeping rate: 10 mV s−1.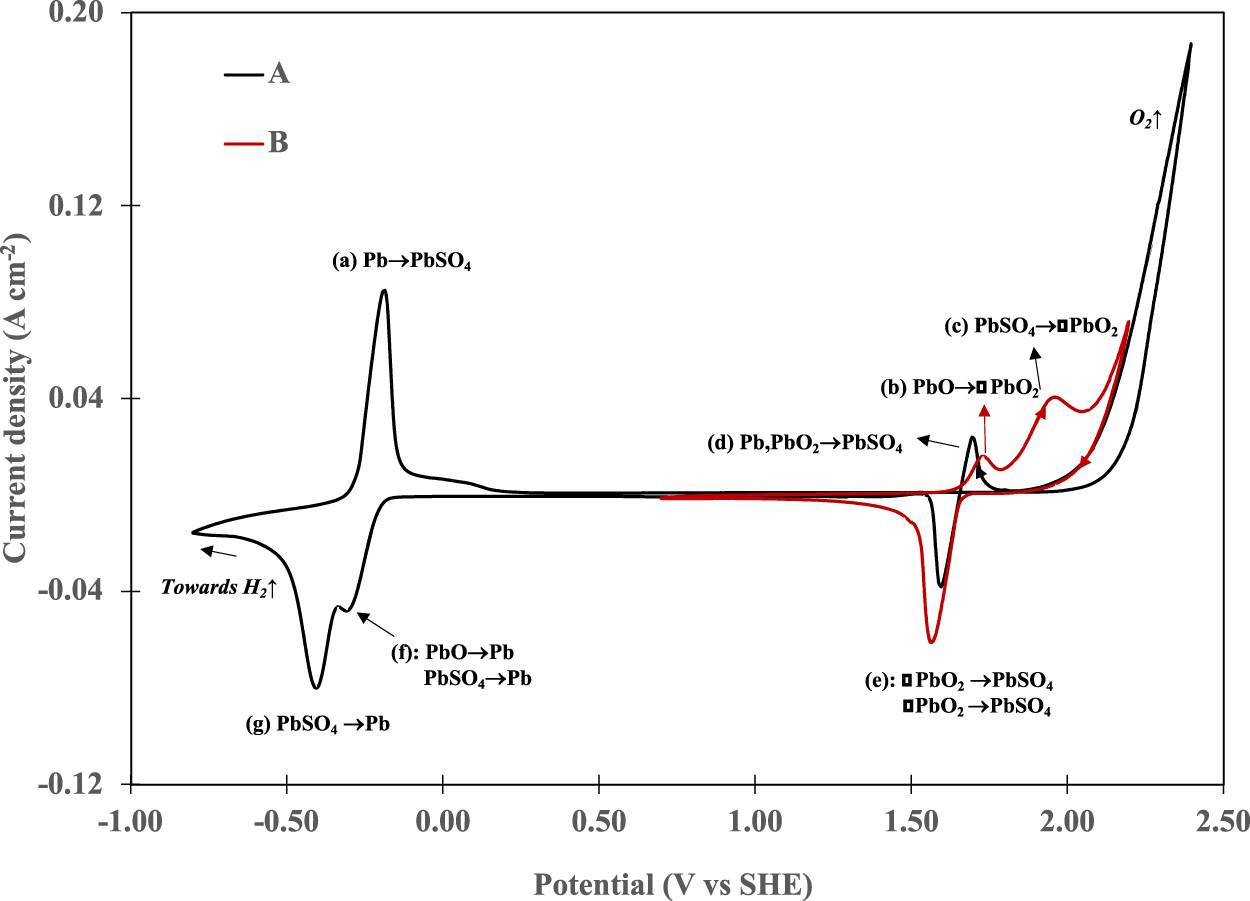
Both voltammograms were obtained on the electrode surface at the steady state (after the 10th cycle). Voltammogram A was obtained by sweeping the potential anodically, in the range (–0.8 to –2.4) V and then reversing it cathodically to the initial point. Voltammogram B was cycled between 0.7 V and oxygen evolution. Yamamoto et al. (1992) observed peaks similar to those shown on Voltammogram 9b (Figure 9) when sweeping the potential range between hydrogen evolution and oxygen evolution. However, we obtained the voltammogram presented in Figure 9 when the sweeping was performed over the whole range of potential between the H2 and O2 evolution reactions.
Cyclic voltamograms of Pb-Ag electrode in the electrolyte including 170 g L−1 H2SO4 at 40°C in two regions of potential sweeping (A: −0.8 V––2.4 V) and (C: −1.8 V–2.7 V). Sweeping rate: 10 mV s−1.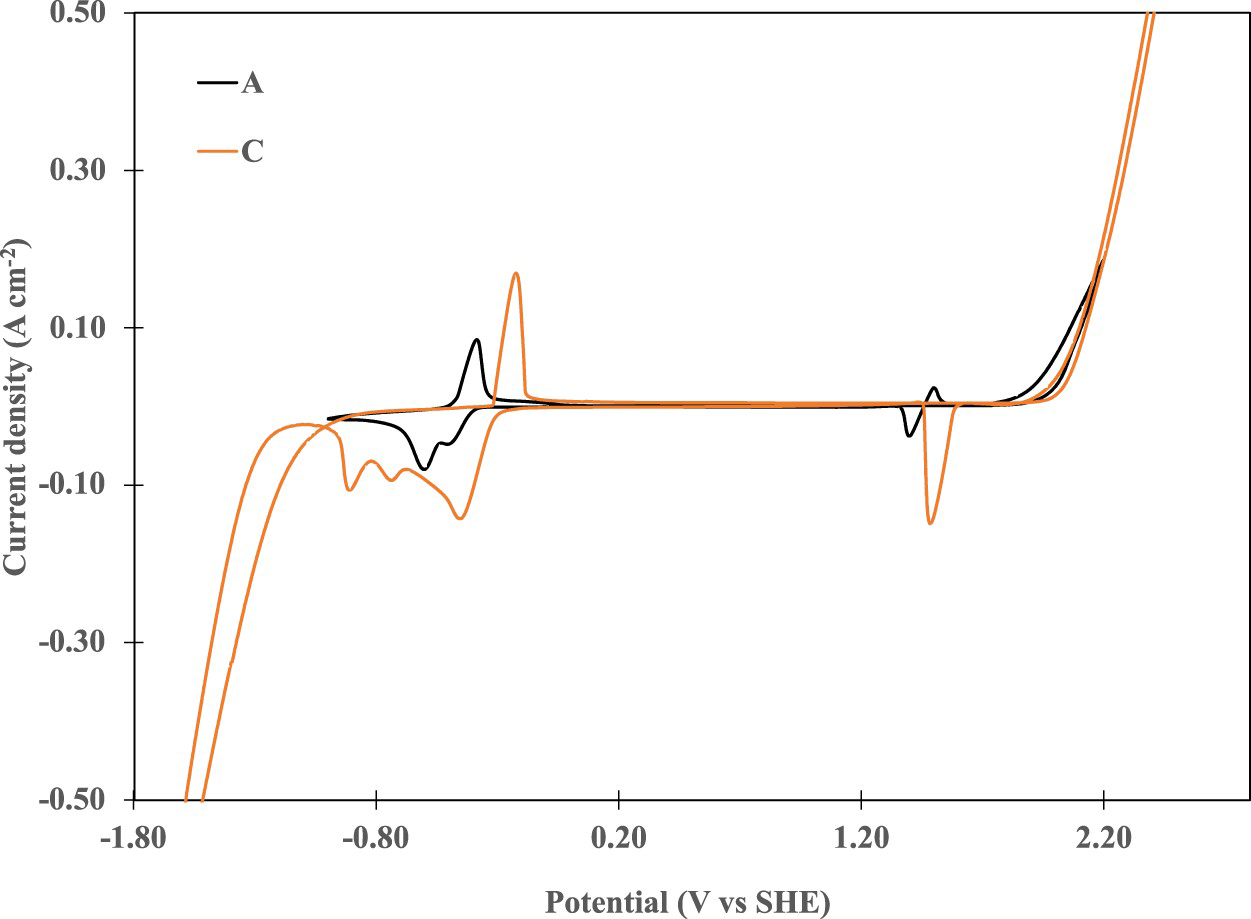
In Voltammogram A, the unusual and sharp anodic peak (anodic excursion peak (d)) appeared at the outset in reversing potential cathodically from the oxygen evolution region towards hydrogen evolution. The anodic excursion peak is well known and already referred by other authors (Yamamoto et al. 1992; Czerwiński et al. 2000). This peak was absent when the potential sweep was carried out in larger potential range on Voltammogram C. The main reduction peak around 1.5 V stayed present on all voltammograms disregarding swept potential range. Two new lead component reduction peaks were also observed at –0.73 V and –0.91 V. Although these peaks were not identified by Yamamoto et al. (1992), similar peaks can be observed in the work of Czerwiński et al. (2000).
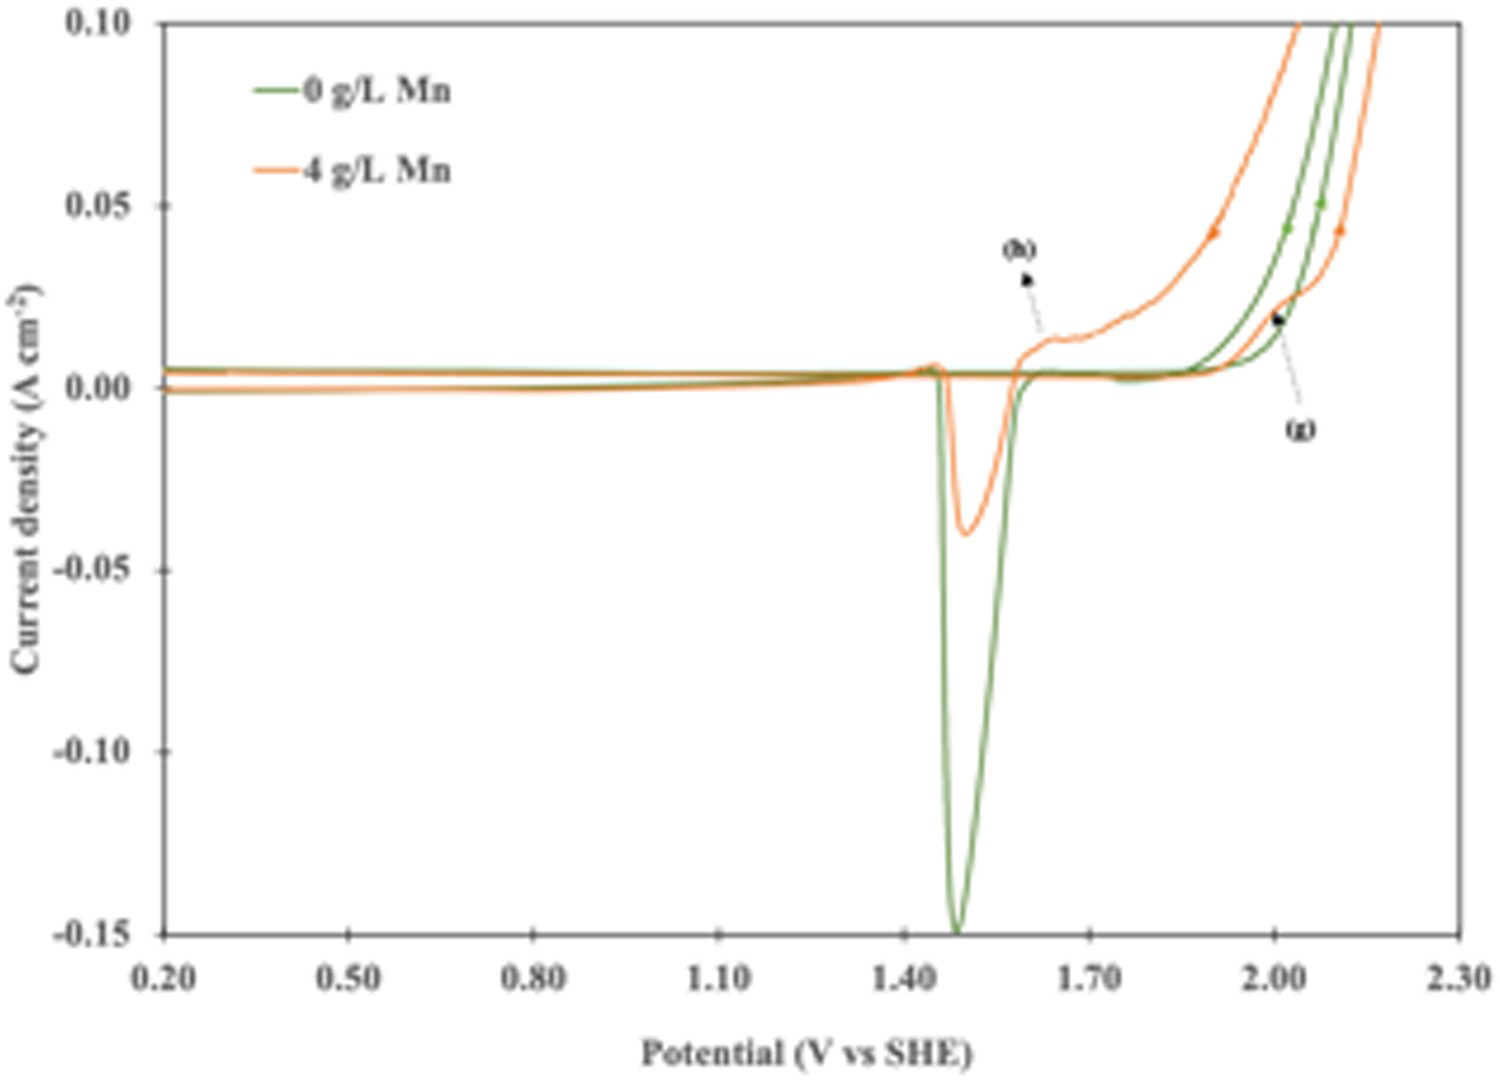
In order to study the effect of Mn ions on lead silver electrode, the same test was performed in the presence of 4.0 g L−1 Mn2+ in the standard EW electrolyte. The voltammogram is shown in Figure 10. In general, the voltammograms show an intensity decrease of current density for all Pb by-products peaks after addition of Mn2+ ions to the electrolyte. More details can be seen by zooming into the region between 0.2 V- 2.3 V (Figure 11). Comparing these two voltammograms, two new oxidation peaks, g and h, are detected in the presence of 4.0 g L−1 Mn2+. These peaks were observed more clearly in the presence of 8.0 g L−1 of Mn (II) by Recéndiz et al. (2008). Small anodic excursion peaks occur after reduction peak at 1.5 V on both voltammograms, in the reverse scan direction, reflecting the oxidation of metallic lead uncovered by the preceding reduction reaction (Czerwiński et al. 2000).
Voltamograms of Pb-Ag electrode in the electrolyte including 170 g L−1 H2SO4 at 40°C in the same region of potential scanning (−1.8 V–2.7 V) in the absence and the presence of Mn ions (4 g L−1). Sweeping rate was 10 mV s−1. A zoom on the voltammograms presented in Figure 10, in the potential region between (0.2–2.3) V.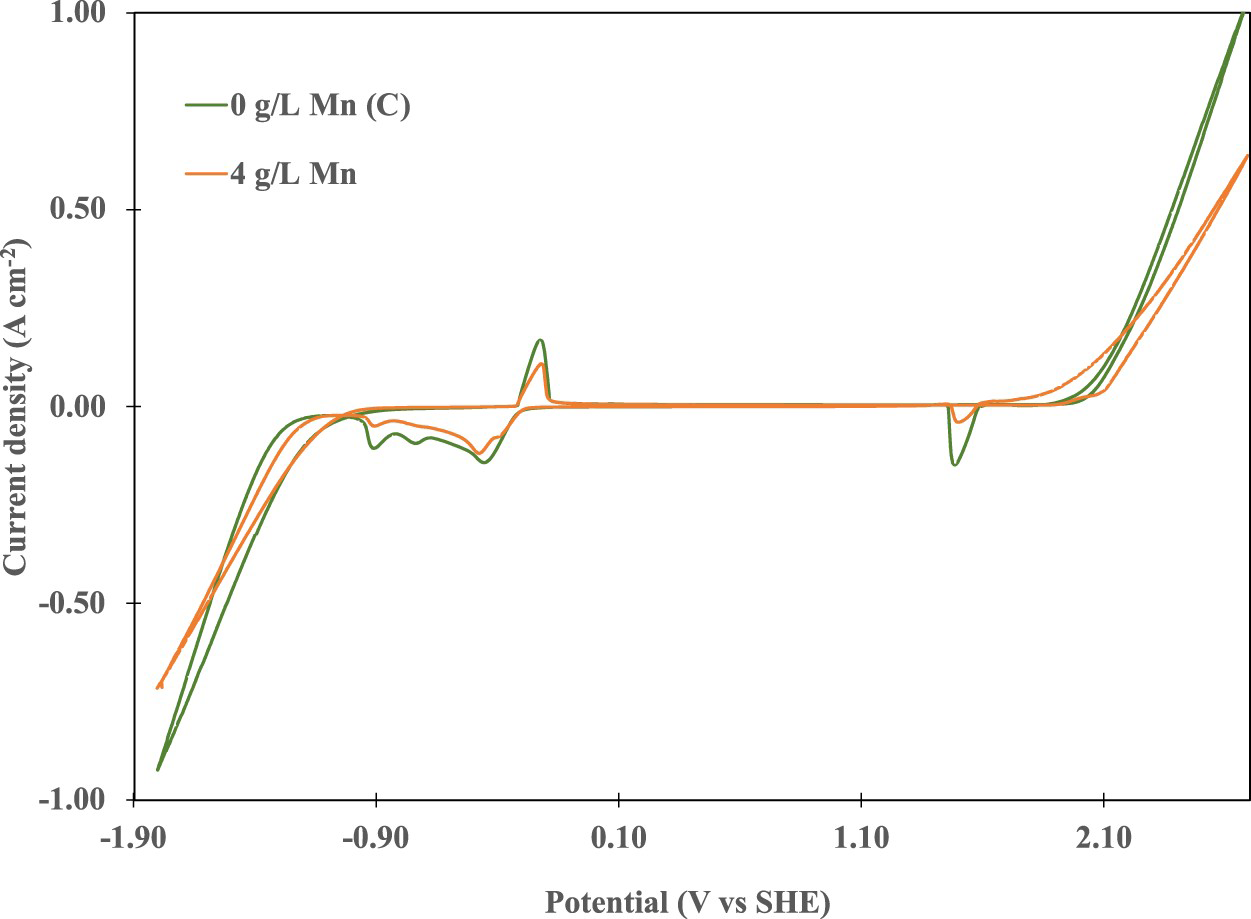
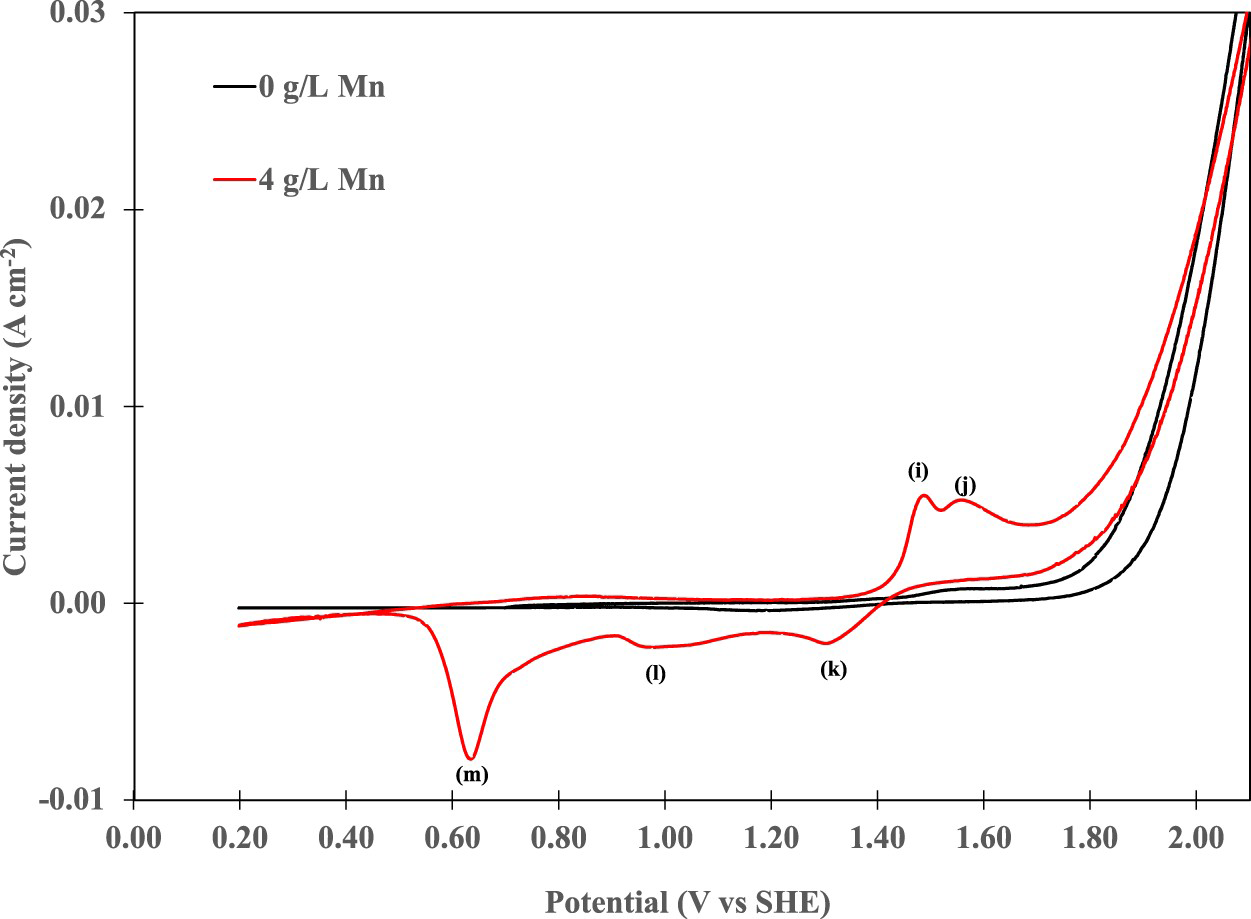
The MnO2 deposition and reduction on platinum electrodes was also studied. Figure 12 illustrates the voltammograms of the Pt electrodes in H2SO4 solution without manganese and with 4.0 g L−1 Mn2+. Both voltammograms presented in this figure. Were obtained on the electrode after the 5th cycle. In the absence of Mn ions, two small round peaks appeared at 1.6 and 1.2 V, which are probably due to formation of platinum oxide and its reduction as reported by Nijjer et al. (2000). In the presence of 4.0 g L−1 Mn2+, two anodic peaks, marked as (i) and (j), in addition to oxygen evolution reaction appeared in the forward scan direction. Peak (i) corresponds to the oxidation of Mn2+ to Mn3+ (reaction 5) and peak (j) is due to the oxidation of MnOOH to MnO2 (reaction 7) (Nijjer et al. 2000; Mohammadi and Alfantazi 2016). Three reduction peaks identified as (k), (l) and (m) on the reverse scan sweep were also observed by different research groups (Lee et al. 1977; Rodrigues et al. 1998; Nijjer et al. 2000). These authors attribute the presence of the peaks (k) and (m) to the reduction of MnO2 to MnOOH (reaction 7) and the reduction of Mn3+ to Mn2+ (reaction 5), respectively. However, as the potential of peak (m) is pH dependent, reactions 11a and 12 for the peaks (k) and (m) were proposed, respectively.
Voltammograms of Pt electrode in the electrolyte including 170 g L−1 H2SO4 at 40°C in the absence and the presence of manganese. Sweeping rate: 5 mV s−1.

Lee et al. (1977) confirmed the same reaction reductions (reactions 11a to 12); however they speculated that the MnO2 could also be reduced to MnOOH by the following reaction (11b):.

Ruetschi and Angstadt (1964) suggested multi-step reactions of 13–16 for manganese dioxide reduction in 2 M H2SO4 electrolyte.


Mohammadi and Alfantazi (2016) also observed the appearance of the plateau (l) after the first reduction peak on voltammograms in the electrolyte containing manganese ions. They attributed the formation to the reduction of MnO2 which became exposed to the electrolyte due to the solution of the MnOOH passive layer.
Figure 13 shows the cyclic voltammograms of the Pb-Ag sample in Mn2+-free and Mn2+-containing electrolytes in the potential range (0.7–2.2) V. All voltammograms were compared on the electrode at the 5th cycle. As it can be seen in Figure 8, the major peaks detected on Pb-Ag electrode in Mn2+-free electrolyte, in the region of potentials are the oxidation of PbO, PbSO4, oxygen evolution and the reduction of PbO2 via following reactions.
Voltamograms of Pb-Ag electrode in Mn2+-free and Mn2+-containing electrolytes (1 and 4 g L−1) at 40°C. Sweeping rate: 5 mV s−1.

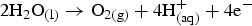


The oxygen evolution reaction seems to be enhanced by the addition of Mn2+ concentration in the electrolyte exhibiting lower overpotentials. The decrease of the oxygen evolution overpotential can be attributed to the catalytic role and depolarisation effect of Mn2+ ions on this reaction, as previously reported by (Cachet et al. 1999; Zhang and Hua 2009).
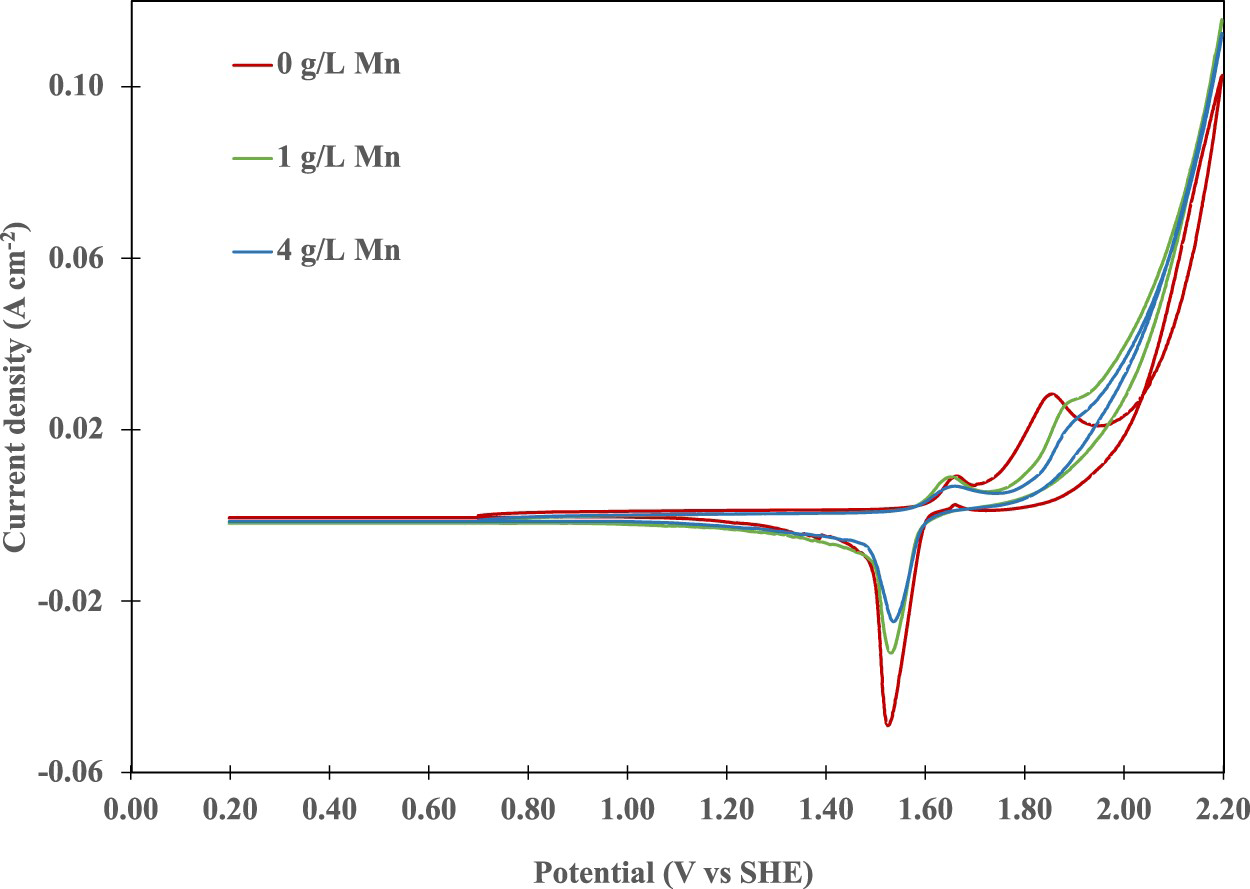
With addition of Mn to the electrolyte, the intensity of all peaks assigned to the oxidation and reduction of lead components are decreased. Furthermore, none of the peaks attributed to the Mn species formed on Pt electrode surface were observed. Figure 14(a, b) is illustrated the cyclic voltammograms of Pb-Ag electrode in Mn-free (a) and in presence of 4.0 g L−1 Mn2+ (b), as a function of cycle number.
Voltamograms of Pb-Ag electrode in Mn2+-free electrolyte (a) and the electrolyte including 4 g L−1 Mn2+ (b) at 40°C with sweeping rate of 5 mV s−1.
All major anodic-cathodic reactions formed on Pb-Ag electrode, in absence of Mn2+ ions can be clearly observed on these figures; however, the intensity of the peaks is lower in the presence of Mn ions. After all, it would be wrong to assert that no Mn redox reactions have proceeded and no MnO2 deposition on Pb-Ag anode has formed.
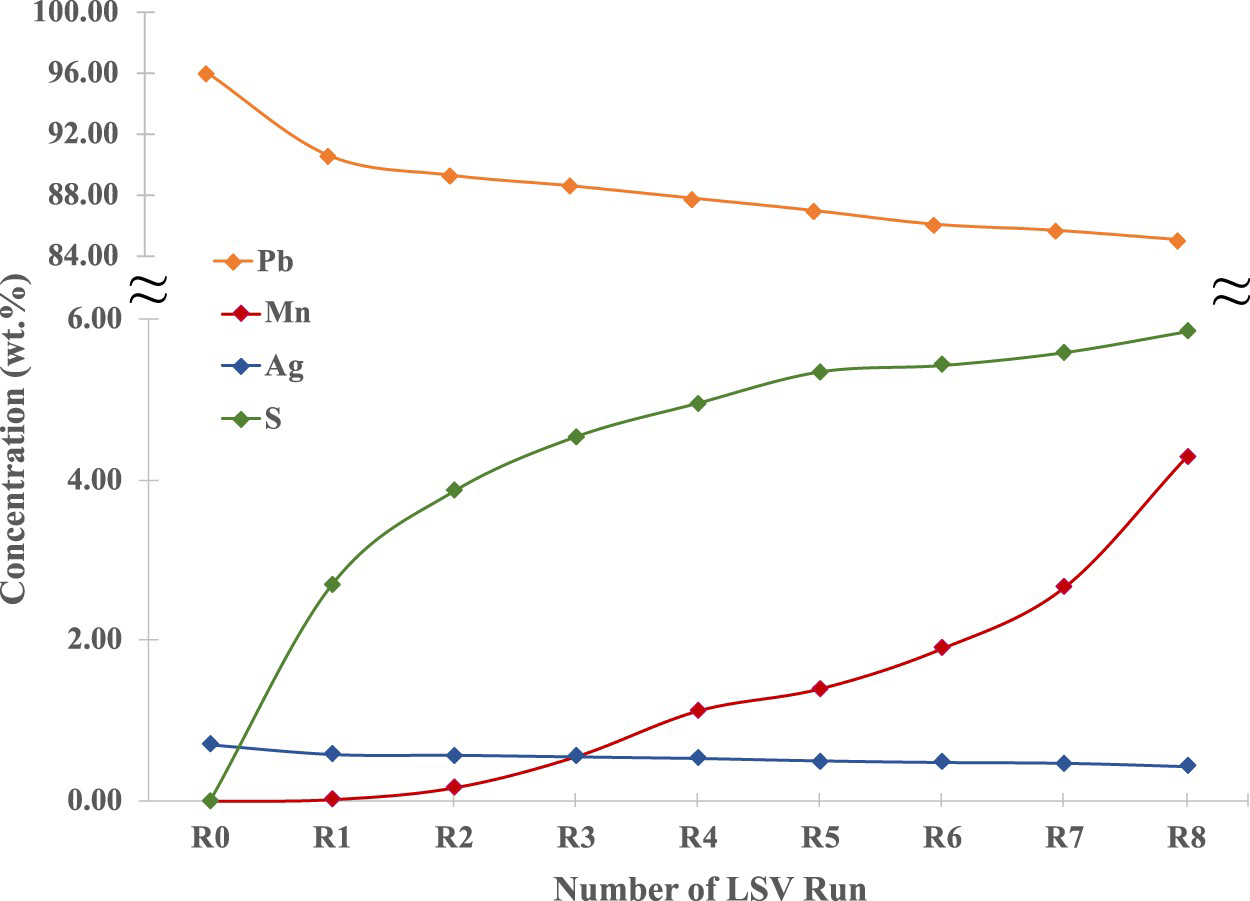
To better understand this phenomenon, a Linear Sweep Voltammery (LSV) sequence test was performed in a standard EW electrolyte including 4.0 g L−1 Mn2+. The LSV sequence test involved 8 runs carried out in the potential range of 0.7 V to 2.2 V. The results are presented in Figure 15. At the end of each sweep, the surface of Pb-Ag anode was analyzed by XRF technique (Figure 16). The results show clearly the increase of Mn content on the surface of the sample. This is indicative of Mn oxidation reaction and formation of MnO2 deposition layer on the anode surface. It can be deduced that, despite the absence of the peaks attributed to the Mn species on voltammogram (Figure 13), the Mn redox reactions are actively proceeded on the electrode surface. Mohammadi and Alfantazi (2016) inferred that the absence of MnO2 deposition peak on voltammograms is due to the deposition of highly porous MnO2 layer and its detachment from the electrode surface. Meanwhile, it should be notied that Pb and Ag contents are decreased with the number of LSV sweeps. This confirms the theory concerning the suppression effect of MnO2. In fact, addition of Mn2+ in the electrolyte results in gradual formation of MnO2 layer on Pb-Ag surface electrode supressing formation of Pb by-products at lower voltages. It can be concluded that the addition of Mn ions to the electrolyte decelerate the oxidation of Pb and lead components such as PbO, PbSO4 and consequently lower content of reduction products is resulted in.
LSV curves obtained in the electrolyte including 55 g L−1 Zn2+, 170 g L−1 H2SO4 and various concentrations of Mn2+ at 40°C. Sweeping rate = 10 mV s−1. Evolution of XRF analysis results on Pb-Ag electrode surface before the LSV (R0) and at the end of each LSV sweep (R2-R8).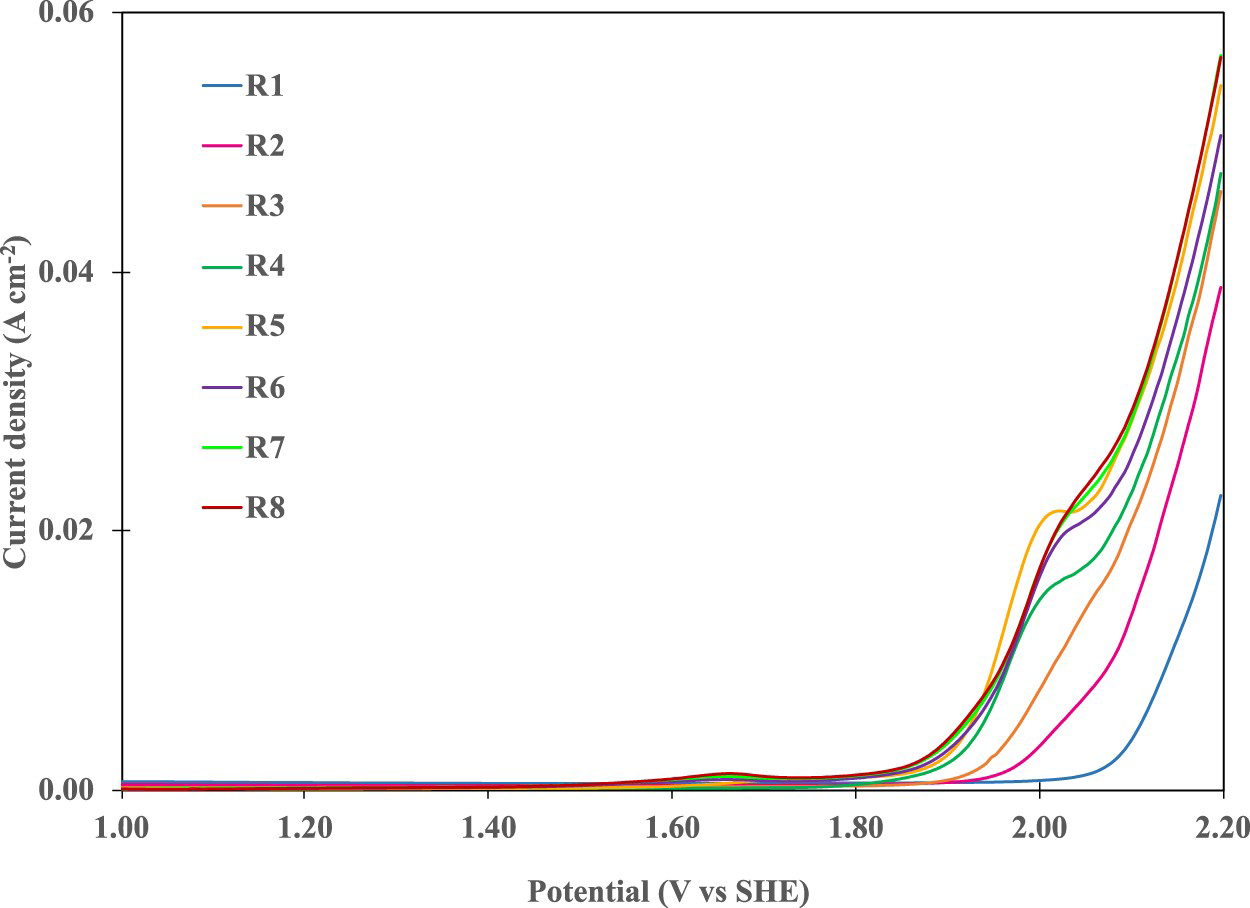
Surface characterization
Figure 17 presents the SEM images of the oxide layers formed on the anode surface after 2 h galvanostatic test at 40°C. The tests were performed in EW electrolyte, with and without 1 g L−1 Mn2+ and a fresh anode surface was used for all experiments. The oxide layer formed on Pb-Ag anode surface (Figure 17(a)) illustrates a coral-like structure with many cavities and deep holes. According to the EDS analysis, the oxide layer is primarily composed of PbO2 in which the prismatic crystals of PbSO4, having a size of about 5 μm, are distributed on some zones on the surface. In the presence of 1 g L−1 Mn2+ (Figure 17(b)), the oxide layer is covered by a large number of layered irregular PbSO4 crystals. The MnO2 layer is characterised by spherical particles however, the sublayer is composed of three different phases of MnO2, PbO2 and PbSO4.
SEM micrographs of Pb-Ag anodes after 2 h galvanostatic tests in standard EW solution (a) without manganese and (b) with 1 g L−1 Mn2+ at 40°C (both at 2000X).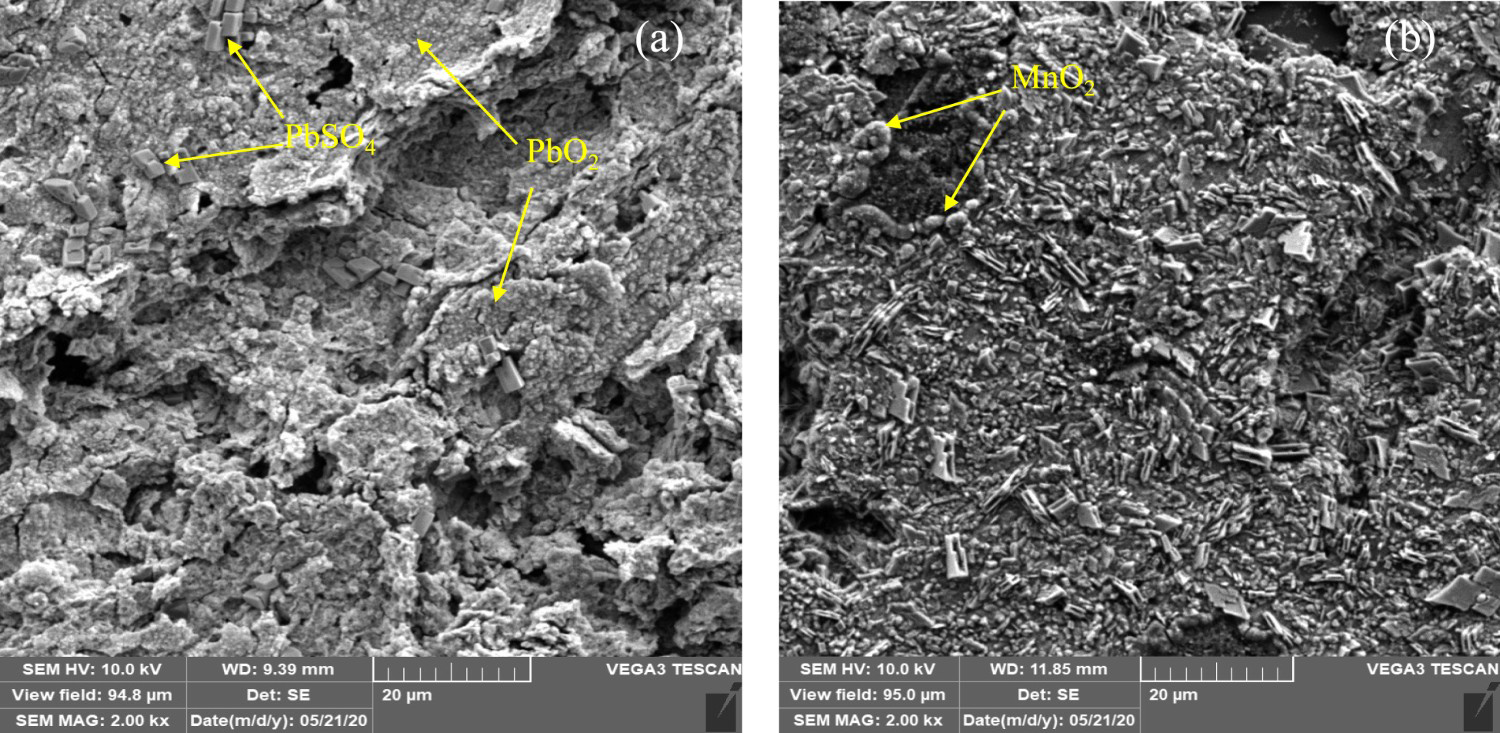
XRD analysis was used to identify the phases and reveal their crystalline structure on the surface of the anodes. After 2 h of galvanostatic test, the surface layer was gently removed from the surface of the anode and collected for analysis. For the fresh anode, the analysis was performed directly on the polished surface of the anode. Figure 18 shows the XRD diffractograms for three samples, i.e. fresh anode (a), after galvanostatic test without Mn (b) and with Mn (c). As expected, only Pb peaks are observed for the fresh anode sample. The surface of the anode in the Mn-free electrolyte is essentially composed of PbSO4, PbO and PbO2 (Figure 18(b)). These analyses confirm our interpretation of the results obtained by CV experiments, stipulating the formation of PbO, PbSO4 and PbO2 on the anode surface. Very small amounts of PbSO4 and strong peaks of PbO2, observed in the pattern (b), suggest that PbSO4 oxidised quickly to PbO2 when there is no manganese in the solution. The surface of the anode in the electrolyte containing 1.0 g L−1 Mn is essentially composed of MnO2, PbSO4, PbO and PbO2 (Figure 18(c)). In addition to the presence of MnO2 in this sample, the peaks related to PbSO4 are much stronger, compared to those observed in pattern (b). This confirms that, in the presence of Mn, the oxidation of PbSO4 to PbO2 (reaction 18) is suppressed, thus offering a protection against lead oxidation.
XRD patterns of Pb-Ag anodes (a) before galvanostatic test, (b) after 2 h galvanostatic tests without manganese and (c) with 1 g L−1 Mn2+ at 40°C.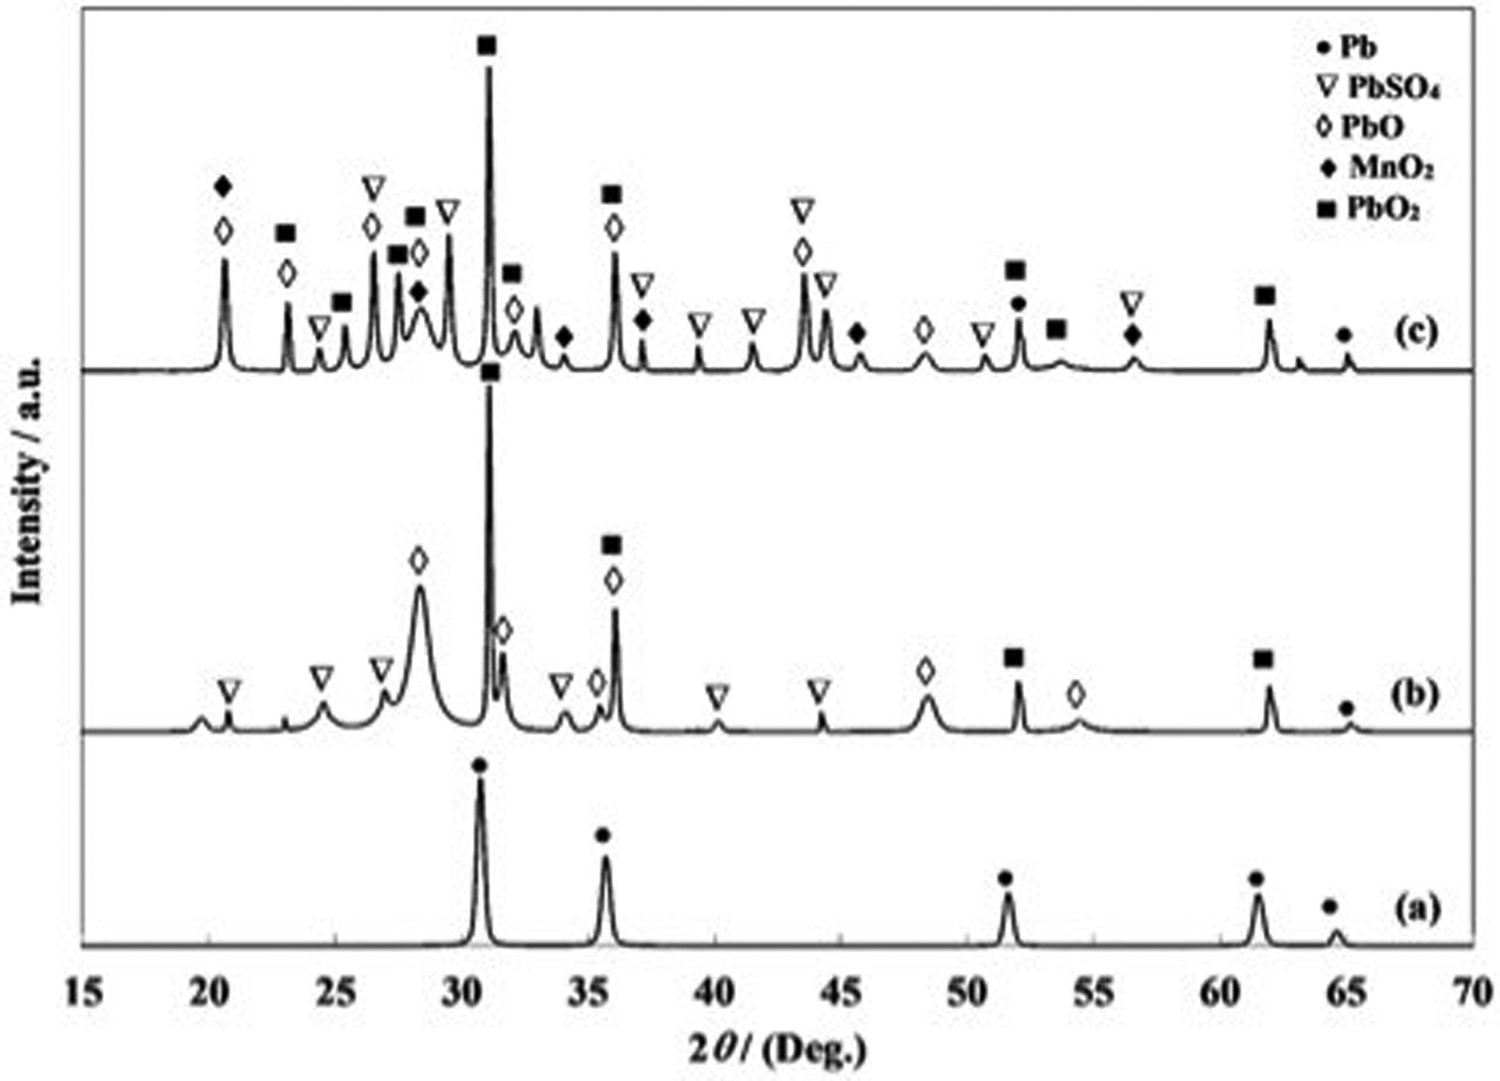
Conclusions
In this study, the optimum operational conditions for obtaining high yield MnO2 deposition on Pb-0.7%Ag electrode were investigated. Two types of electrolytes were used to simulate the conditions of electrowinning and purification. In both electrolytes, the anodic voltage values increased with rising current density and decreased when the temperature increased. The highest CE for manganese removal (21%) was obtained in the EW electrolyte containing 1.0 g L−1 Mn at 125 A m−2 at 40°C after 2 h of electrolysis. The effect of Mn2+ concentrations on anodic current efficiency was also studied under optimal conditions, i.e. at 40°C at 125 A m−2. The results show a fast increase in CE for Mn2+ concentrations between 0.1 g L−1 and 1.0 g L−1. However, for higher concentrations, between 1.0 and 4.0 g L−1, the current efficiency stayed quasi-constant. The LSV tests showed increasing the electrolyte temperature positively affects the OER and depolarised this reaction. The cyclic voltammetry studies showed that the addition of Mn ions to the electrolyte results in gradual formation of a MnO2 layer on Pb-Ag surface electrode supressing formation of Pb by-products and decelerates the oxidation of Pb and lead components such as PbO, PbSO4. These results show that the current efficiency of Mn removal of 21% at a current density of 125 A m−2 is not enough to enable the proper functioning of MMO anodes at the required low Mn concentrations (less than 100 mg L−1). Under these conditions, a great number of anodes would be required to purify the electrolyte, rendering uneconomic the proposed process for controlling manganese concentration in solution. We would therefore suggest increasing the current efficiency of Mn deposition by using other methods. One suggested method may be studying the effect of additives. Alternatively, one can look for other types of anodes exhibiting higher oxygen overpotential, thus suppressing the oxygen evolution reaction.
Footnotes
Disclosure statement
No potential conflict of interest was reported by the author(s).