
Abstract
Back-analyses have been carried out at 5 Australian longwall mine sites (10 longwall panels in total) to determine threshold values of critical leg pressure and convergence load cycle features capable of determining if roof control problems are likely to occur in advance. These threshold values were concluded to correctly predict roof cavities before they occurred approximately 80% of the time. This compares well with other rock mechanic empirical techniques. Threshold values were exceeded typically one–three shears in advance of cavities occurrence. This means that a pre-warning is possible in time for operational controls to be enacted that are aimed at preventing the roof control problems deteriorating to such an extent that the longwall has to stop production in the majority of cases.
Keywords
Introduction
Modern longwall roof supports (shields) have been equipped with pressure sensors for some considerable time and hydraulic leg pressures can be displayed in real time. Draw-wire extensometers (also known as cable actuated position transducers, string or yoyo potentiometers) were often also installed to measure shield convergence but these have been found to be highly unreliable. Over the last five years, some shield support manufacturers have begun to install tilt sensors on the canopy, lemniscate and base of shields for new longwalls. With knowledge of the support dimensions, signals from these three sensors can be used to determine support closure. As there are no moving mechanical components to this system, the signals have been found to be very reliable. As will be discussed later in this paper, the resolution of the sensors that are currently being used are not optimal but do nevertheless provide useful results.
The results from shield monitoring are only useful if the signals can be understood in the context of how the shield is interacting with the strata. In this paper, the authors discuss what the signals mean using the concept of load cycle analysis. It is also necessary to be able to visualise the results of the monitoring in a way that is useful to understand how the shield and strata interact.
The majority of longwalls in Australia have to deal with roof cavities and the cost of remedial action and lost production can be very substantial. For example, Galvin (2016) estimates that for an Australian longwall mine, the cost of unplanned stoppages is in excess of A$500,000 per day for some premium coking coal operations. It is not unusual for delays due to roof control issues such as roof cavity formation to extend for more than a day and occur numerous times during the extraction of a panel on many Australian longwalls.
In many cases, operational controls can be enacted to ameliorate or even eliminate the formation of roof cavities but their timely enactment depends upon identifying the precursors to cavity formation. With respect to this, when shield set conditions deteriorate and manual setting is practised, it is not unusual for low manual set pressures to exacerbate roof control problems.
A model was developed to predict the onset of roof control problems before they occur from shield monitoring data are described, together with operational controls that can be enacted that have the potential to prevent roof control problems deteriorating to the extent that production has to cease. The accuracy of this model is assessed together with the time between roof control problems being predicted and when they actually occur.
Using shield monitoring data to predict roof control problems
A number of authors have used shield monitoring data to assess roof control issues on a longwall face.
Peng et al. (1987) used shield leg pressure monitoring data to develop an empirical nomograph model, which takes into consideration the existence of higher loading mechanisms and stressed the importance of both the main and immediate roof. This model utilised load cycle delineation (a load cycle is from set to release of the shield) as a means of analysing the strata-support interactions. However, the model was based on limited amounts of data. This model was extensively tested from data accessed from an Australian longwall by Callan (2005) and found to be fundamentally flawed. It was found to have no practical use in predicting the onset of roof control issues before they occur.
Park et al. (1992), also conducted research into the field of longwall support specification using shield monitoring data. Analysis was performed on the collected data in order to initially classify the typical load cycle into various components and then collate various shield performance indicators such as set load, maximum load and load increment (developing load). Statistical analysis was applied to the shield performance indicators in order to determine any relationships which existed between them. The focus of the work then shifted towards the development of software capable of delineating the load cycles from raw monitoring data and performing the required analysis. The analysis of the monitoring data depended upon the relationship between set pressure and developing pressure developed by Peng et al. (1987), which was found to be fundamentally flawed by Callan (2005) after being tested on data from Australian longwalls as previously noted. Again the technique was found to have no practical value in predicting roof control problems in advance of them occurring.
Peng (1998) introduced the idea of classifying pressure–time profiles of support legs and correlating them to the geotechnical conditions. However, the classifications only consisted of three categories and completely neglected the occurrence of support yielding as well as the importance of loading rate and stabilisation within load cycles. Attempts were also made to develop software for the purpose of load cycle analysis using the characterisations developed. However, the developed software was very simple and became outdated through technological advancements of the supports and associated monitoring equipment (Callan 2005). The limitations noted likewise made the technique unsuitable for predicting roof control problems in advance of their occurrence.
Trueman et al. (2005, 2009) describe a number of leg pressure load cycle features that they considered are critical to the understanding of how shields interact with the strata. These load cycle features are: the set pressure; whether or not the shield reaches the yield pressure and the number of yield events during a load cycle; the pre-yield loading rate; and the time-weighted average pressure (TWAP). Threshold values of these features were not established with which to predict in advance longwall roof control problems. Also the use of yielding and the number of yield events as critical load cycle features were later found to be not as useful as these authors had concluded (Trueman and Hutchinson 2017). They had not fully understood that individual yield events do not necessarily lead to a similar amount of convergence. The amount of fluid lost per yield event controls the amount of convergence in an individual yield event and this is a variable. Although containing some very useful ideas, the work did not progress far enough to be used for predicting roof control problems in advance of their occurrence.
Medhurst (2005) published convergence limits and rates that that he claimed could be used to infer the initiation of face spall, cavity development, the weighting environment and the periodic weighting cycle for Australian conditions. He does not give any details of how he arrived at these conclusions however. These claims are surprising to the authors of this paper as reliable convergence measurements on Australian longwalls did not exist in 2005 and he presented no evidence as to where or how the convergence data were measured. It is only over the last four or five years that reliable shield convergence measurements have become routinely available on Australian longwalls and then only on installations with new equipment. Before that, reliable routine measurement of support convergence did not exist. Noting that the equipment described earlier to measure shield convergence has been found to be so unreliable as to be practically useless. Reliable convergence measurement equipment can be retrofitted to longwalls and the authors of this paper did that for two of the sites where they conducted back-analyses. However, it is not at all clear that Medhurst had access to such equipment. The convergence and convergence rate threshold values noted by Medhurst also differ significantly from the ones presented in this paper. The amount of time that was available to enact operational controls to mitigate against roof control problems deteriorating to the extent that the longwall had to cease production was not discussed in this work or leg pressure threshold values that could lead to roof control issues. Neither was the accuracy of the threshold values that he gave. Given the significant differences between the convergence threshold values noted in this paper and those outlined by Medhurst and the noted uncertainties relating to whether or not the values were predicated on actual measurements, the authors of this paper do not consider the threshold values reliable enough to be used to predict roof control on a longwall face in advance of them occurring.
Hoyer (2012) developed an early warning of the development of longwall cavities. This was based on his observation that very low leg pressures preceded major roof cavities. The authors of this paper back-analysed shield leg pressure data from a number of longwalls to test this hypothesis. They concluded that the low pressures were actually a result of the fact that roof control issues had already started to occur. Shield operators would have disabled automation and resorted to manual setting of the supports so would have therefore been aware that roof control issues were occurring. The authors of this paper therefore concluded that this so-called early warning was not actually an advanced warning of the onset of roof control issues at all.
Verma et al. (2016) used shield leg pressure monitoring data to train a neural network model. This model was then used to predict the maximum leg pressures in shield legs for a variety of geological and geometry factors. It was unclear how these predicted leg pressures could be used to predict in advance the likelihood of roof control problems occurring or how the problems could be ameliorated. The model is more based towards determining appropriate support capacity than predicting in advance roof control issues from the shield monitoring data.
Prusek et al. (2017) also incorporate shield monitoring data into their method of assessing roof control risk in longwall coal mines. The method is aimed at determining the inherent risk of roof falls at the design stage rather than predicting roof control issues in advance on working longwalls. The work, although undoubtedly useful, was therefore concluded not to have the same operational impact as the work described in this paper.
Australian longwall coal mines now have shield leg pressure monitoring in real time and most that have been commissioned over the last four or five years also have reliable convergence monitoring in real time. Leg pressure and convergence data from a total of 5 Australian longwall mines (10 longwall panels) have been back-analysed and the results are presented in this paper. This has enabled the development of threshold values of critical load cycle features that indicate the onset of roof control problems in advance of their occurrence. (A load cycle is from set to release of the shield in preparation for advancement.)
The load cycle features that are important in understanding the development of roof control problems are described. Back-analysis results of shield convergence and leg pressure at a single mine are noted in detail with threshold values of critical load cycle features resulting in cavities for that particular mine. Back-analysis results for other mine sites are then summarised. The amount of time between threshold values being exceeded and roof control problems eventuating are determined. Operational controls that can be enacted to prevent or ameliorate roof control problems deteriorating to such an extent that the longwall has to cease production are discussed, with particular emphasis on set pressures.
Load cycle analysis
Leg pressure and shield convergence signals are time based. In order to help understand what these signals mean, they have to be defined in terms of the load cycles of every individual shield due to the asynchronous nature of the movements of the shields across the face.
The critical load cycle features that are important in understanding the development of roof control problems on a longwall face include, for all shields across the face, the TWAP, the set pressure, the pre-yield loading rate, the convergence in a single load cycle, the cumulative convergence over three consecutive load cycles and the average convergence rate throughout the load cycle (Trueman and Hutchinson 2017). Other convergence signals that would be useful are the pre-yield convergence and the post-yield peak convergence rates, however the resolution of the sensors that are currently installed by shield manufacturers are limited in their ability to determine these parameters at this time.
Trueman et al. (2009) describe the development of software capable of accurate load cycle analysis. This software was never commercialised. Many of the ideas encapsulated in that software were incorporated into the commercial longwall visualisation analysis (LVA) software with the aid of the authors of this paper. The major difference between the LVA software and the software described by Trueman et al. (2009) was the method delineating the load cycle for every shield. In the LVA programme only drops in the leg pressure is used. In the software described by Trueman et al. (2009) both leg pressure drop and the position of the shearer were used. This made cycle delineation >95% accurate, whereas in the LVA programme it is about 80% much of the time. Cycle delineation can be very problematic on occasions when roof control problems are experienced. The use of pressure drop alone to delineate load cycles has nevertheless enabled the LVA software to be much more robust for real-time analysis.
Use has been made of the commercial LVA Software to extract and visualise critical load cycle features (Hoyer 2012). Although the authors of this paper have contributed significantly to the development of this programme they do not have any commercial association with it. Back-analysis has also benefitted from a programme developed by the authors of this paper that is more accurate in delineating the load cycles. This software is not developed enough to be used commercially but the authors of this paper have used it extensively for the back-analysis described in this paper and it has enabled them to achieve a better understanding of the interaction between the shield and strata on many occasions.
In the main, the commercial software is able to be used to accurately assess the interaction between the shields and the strata. Cycle delineation can become problematic when roof control problems are encountered, however. The authors of this paper have developed software that is capable of >95% accuracy in delineating the load cycles of every shield on the face. This is achieved using the position of the shearer and/or the position of the DA (double acting) ram, in addition to the leg pressure drop. The DA ram is the horizontally mounted ram on the shield that is used to push the armoured face conveyor into the next cut and to pull the shield forward when that operation has been concluded. This software is also capable of delineating load cycles part way through a cut, whereas the LVA software can only delineate cycles once a cut has been completed. It should be noted though that LVA software can provide real-time alarms to operators of triggered events mid-load cycle.
In the commercial software, the following features are extracted from the delineated load cycle of every shield and visualised as heat maps and most are also available in the software developed by the authors of this paper that has an improved load cycle detection:
map of the TWAP; map of yield events; map of the set pressures lower than a user-defined threshold; map of cycle times (time from set to release); map of the pre-yield loading rate; map of support legs not carrying their full rated load due to faults associated with yield or check valves; map of noisy pressure sensor signals that indicate incipient sensor failure; map of the convergence in a single load cycle; map of the cumulative convergence over 3 consecutive load cycles; and map of the average convergence rate throughout the load cycle.
However, the convergence resolution of tilt sensors currently installed by the support manufacturers is of the order of 8 mm. This resolution could be significantly improved. If better resolution sensors were installed a number of other useful load cycle features could be extracted and visualised in the software. These would include: the pre-yield convergence rate and post yield peak convergence rates. At the current convergence resolution it is not possible to measure these parameters.
Back-analysis
As noted earlier, back-analyses of both the pressure and convergence signals have been carried out at five longwall mines. Two of the sites did not have convergence monitoring installed. Six shields on both longwalls were retrofitted with a system developed by CSIRO in order to measure convergence. The convergence resolution of the tilt sensors in the CSIRO system is about 0.8 mm. Roof control difficulties were experienced on all of these longwalls. The critical load cycle features were extracted and threshold values that lead to cavity formation were derived.
Various values of the critical load cycle features were extracted and visualised and compared to the formation of roof cavities. Examples of the load cycle features for Australian Mine A are presented in this paper. The back-analysis details for all the other mines are described in detail in an end of grant ACARP report (Trueman and Hutchinson 2017).
Two of the mines were located in the Bowen Basin of Queensland, one in the Gunnedah Basin of New South Wales, one in the Hunter Valley of New South Wales and one in the southern coalfield of New South Wales. The mining depths of the Queensland mines varied between 100 and 300 m. Two of the New South Wales mines were operating at depths of up to 550 m during the period of back-analysis. As is the case at a significant percentage of coal mines in Australia, four out of five of the mines had relatively thick and competent sandstone channels in the relatively near (the bases of the channels being from 20 to 70 m above the extraction horizon) overburden over parts of the areas where back-analyses were carried out. One of the mines had a thick sandstone channel in the near overburden but this was considered to be relatively weak. The subject of the impact of sandstone channels on shield loading has been the subject of significant research (see e.g. Frith 2005) but more research is required. More background data on the mines including their names is included in the previously mentioned ACARP final report.
Mine A example analysis
Figure 1 shows the TWAP map for the case study of mine site A. High values are visualised in red and low values in blue, with the transition between low and high values progressing through green and yellow. Three longwall panels were back-analysed as part of the ACARP C21013 research project but only the LW11 panel is described in detail here. Cavities are illustrated by very low pressures which are shown as blue on the TWAP heat maps in Figure 1. As can be seen in Figure 1, the cavities extended over up to two thirds of the width of the face on occasions. The height of the cavities varied from about 0.3 m to in excess of 3 m. It was often the case that the smaller cavities extended in height in subsequent load cycles. Longwall production had to be stopped in the majority of cases where cavities are shown. This was also the case at the other mines where back-analyses were carried out.
TWAP map for Australian Mine A.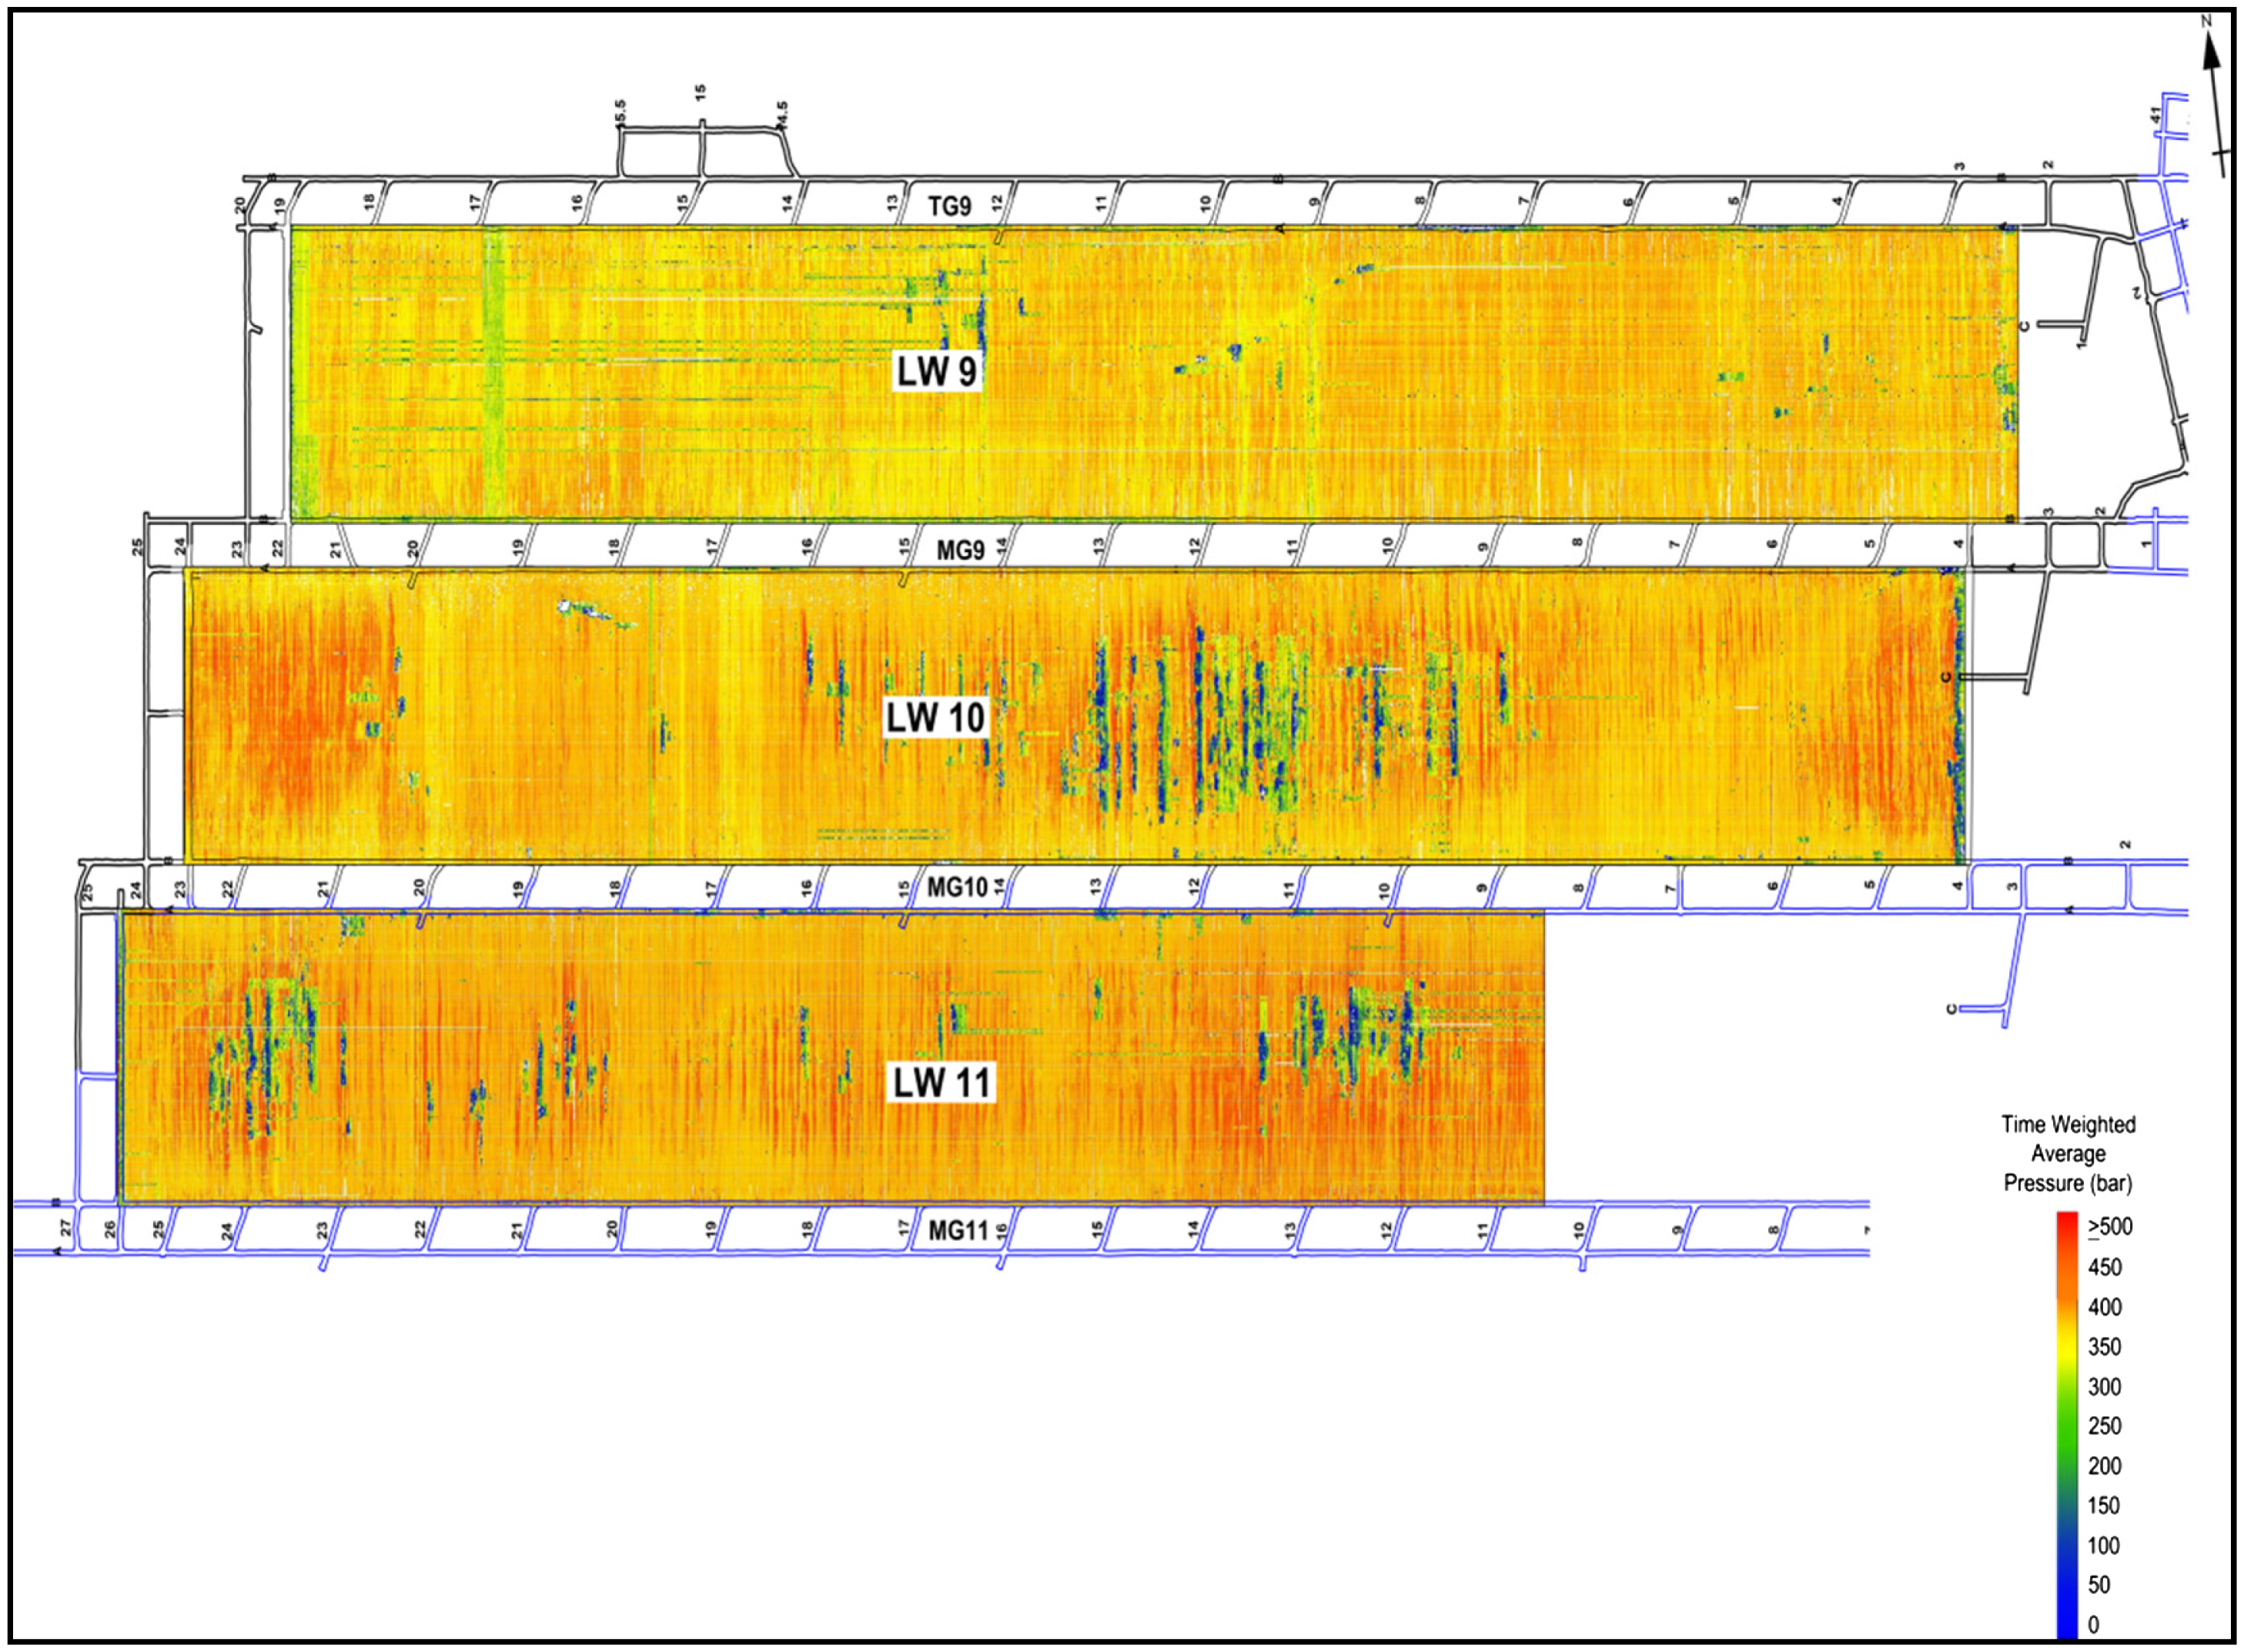
In Figure 2, the pre-yield loading rate is visualised for panel 11. When predetermined values of this parameter are exceeded on individual shields they are coloured red. The cavities are shown in blue. The shields that reached the pre-yield loading rate threshold that best predicted the cavities are shown as red stripes. Several values were trailed to arrive at the value. For this particular longwall, the best pre-yield loading rate threshold was 10 bar/minute. For the other two longwalls at this site, the threshold varied between 9 and 10 bar/minute.
Pre-yield loading rate Australian Mine A.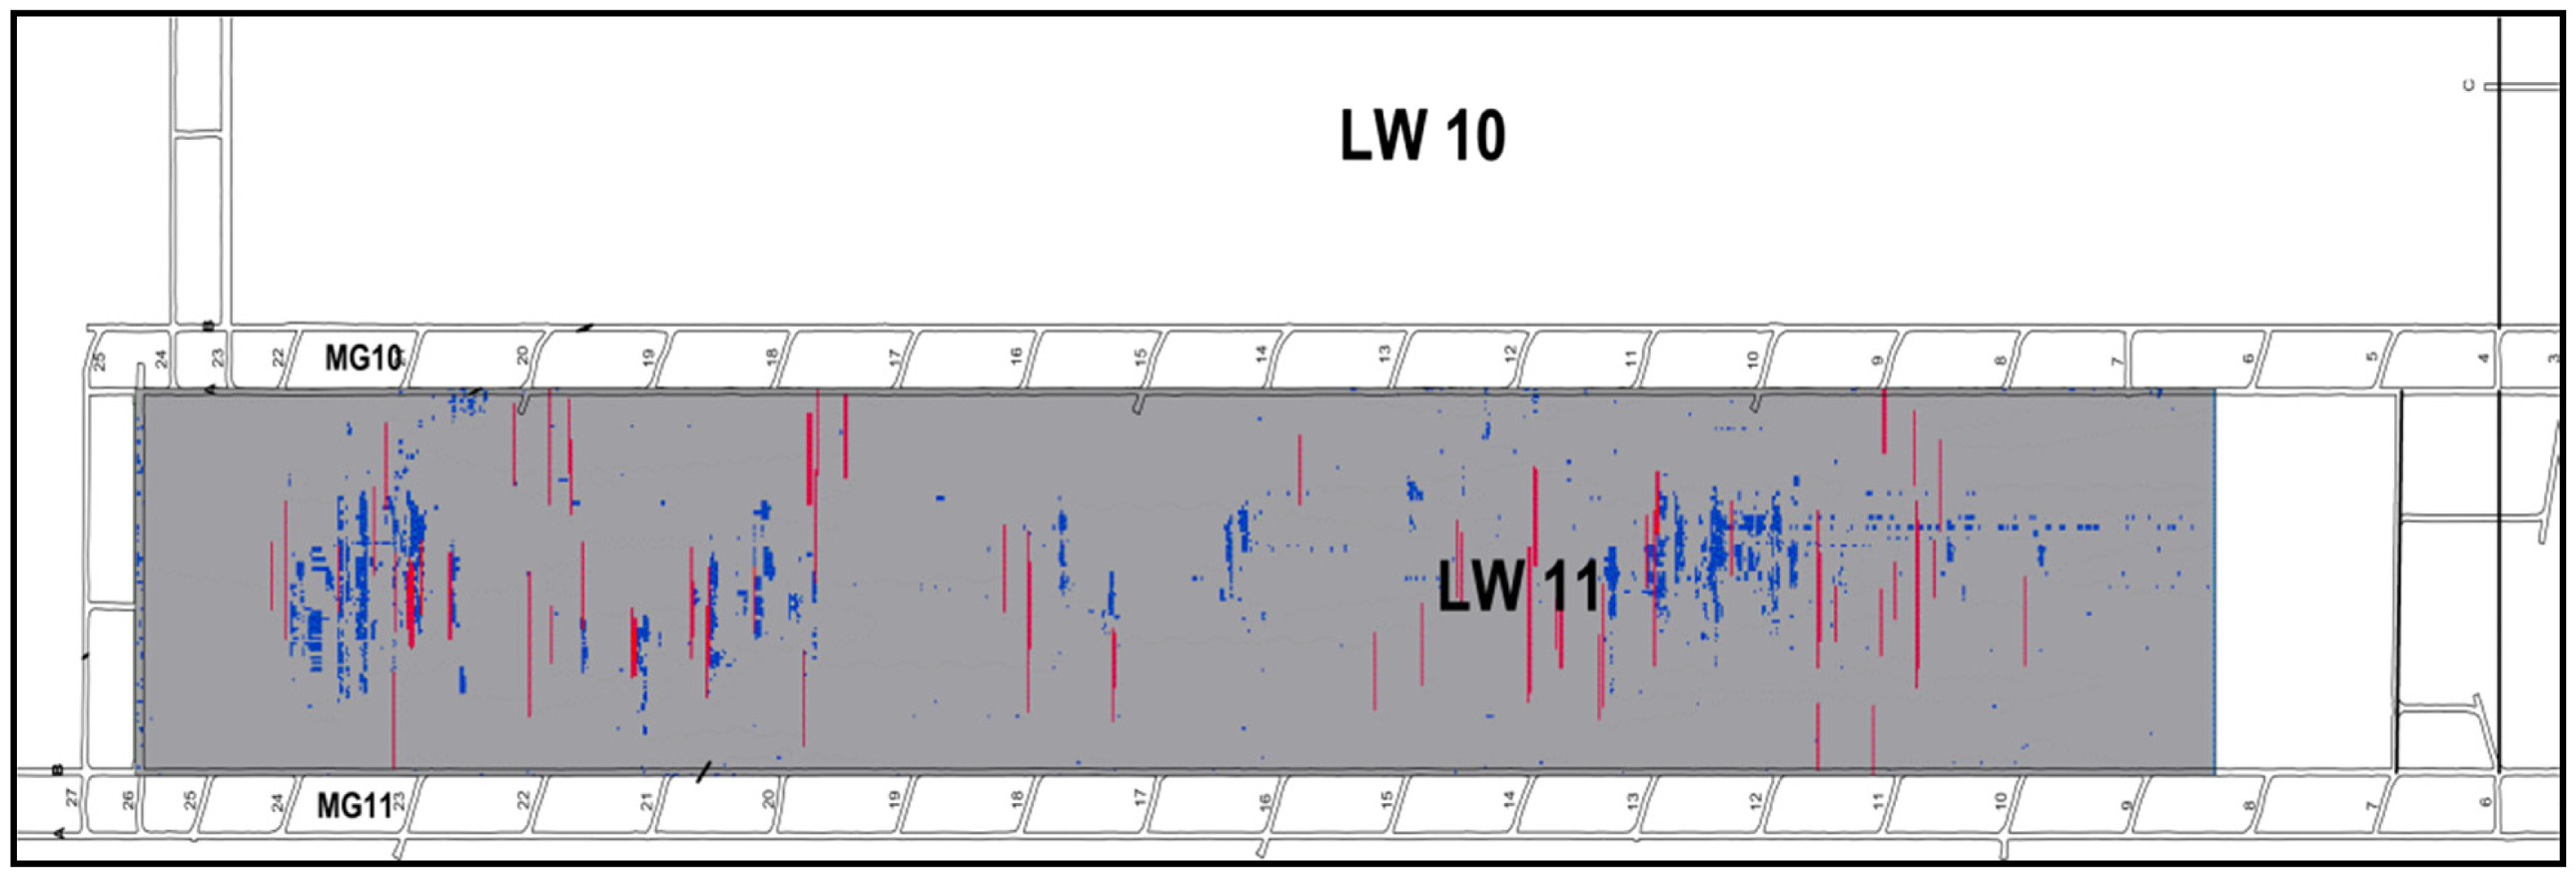
Figure 3 likewise shows the average closure rate threshold that best predicted the cavities. The closure rate for this particular longwall was found to be 55 mm/h. The other two longwalls at this site had the same threshold.
Average closure rate per load cycle Australian Mine A. Images are available in colour online.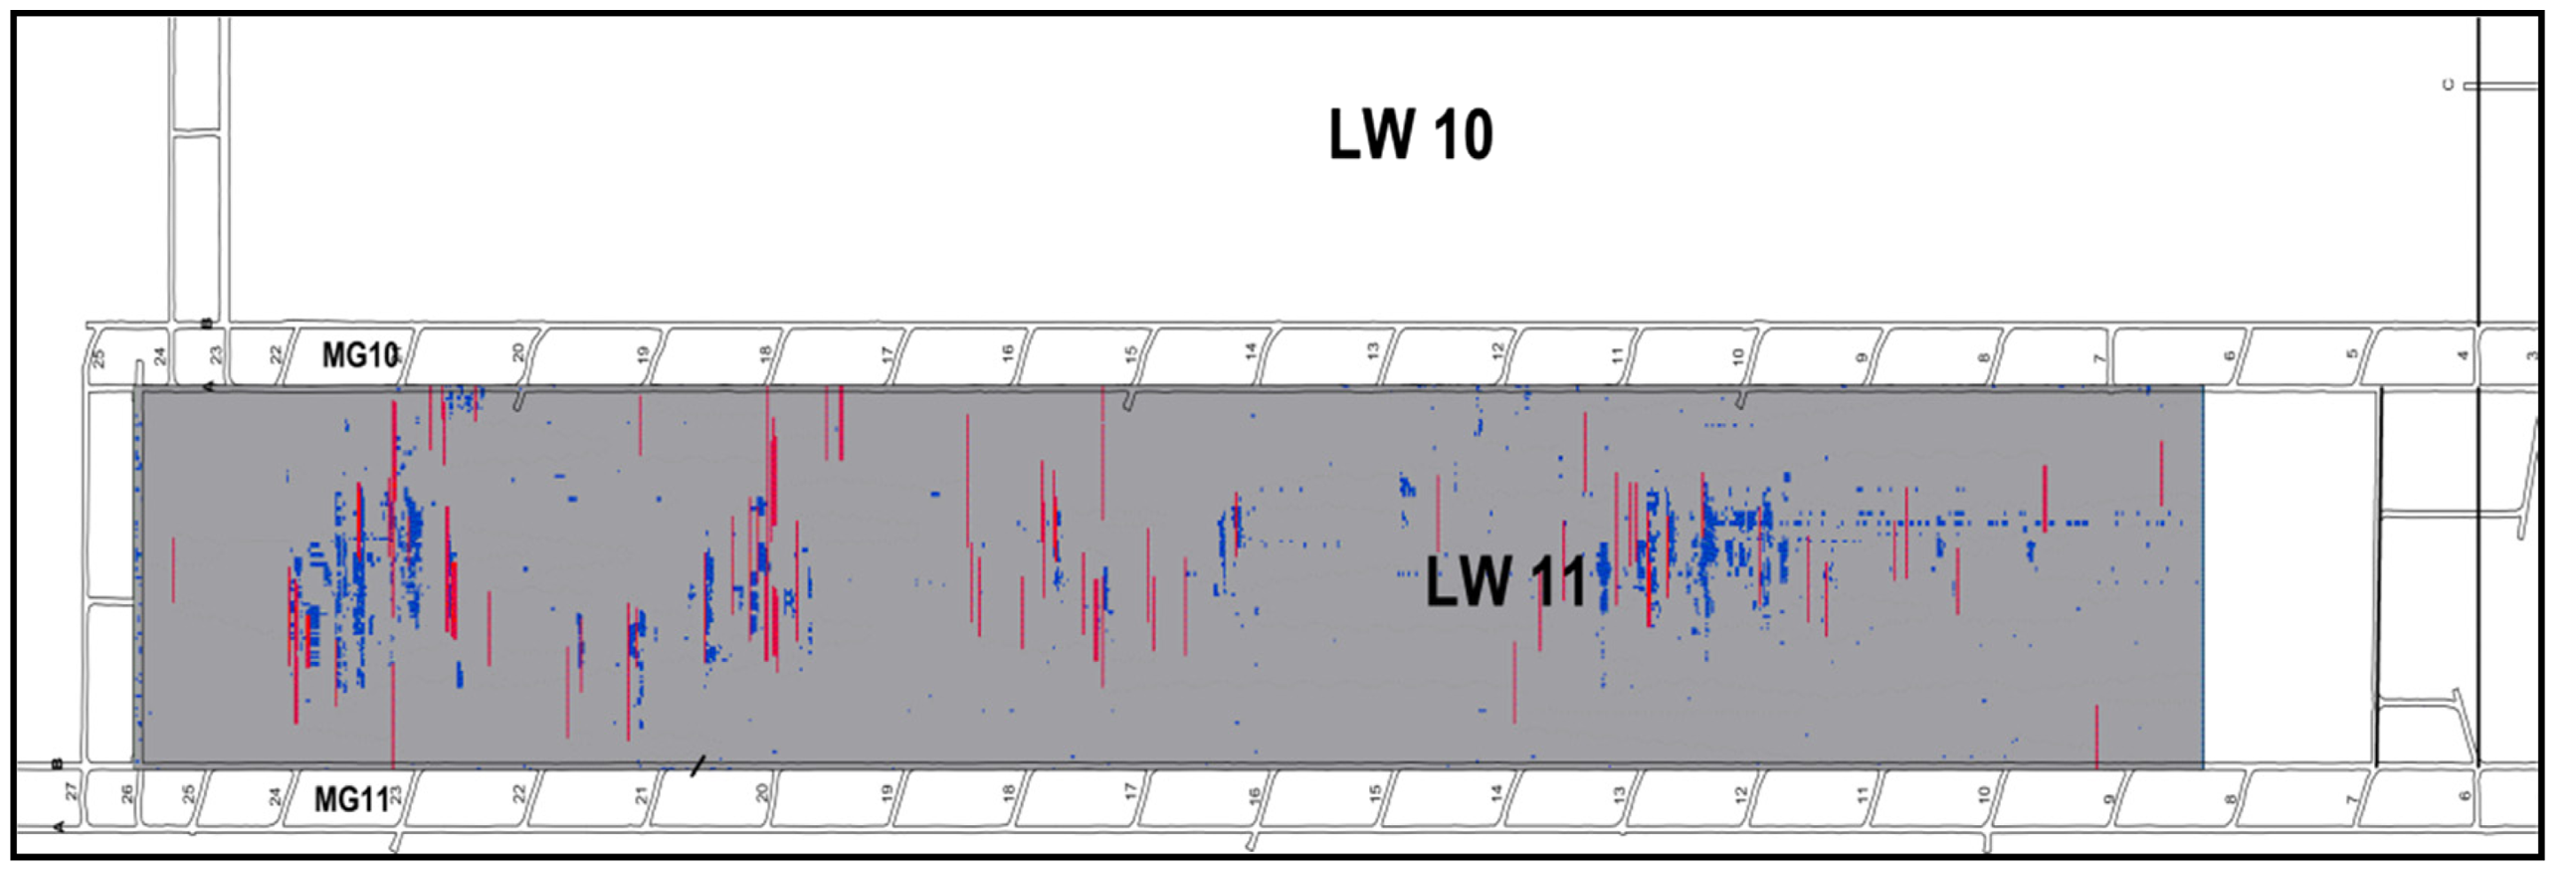
Figure 4 shows the cumulative closure over three consecutive cycles that best predicted cavities. The value for this particular longwall was found to be 250 mm and the value was the same for the other two longwalls.
Cumulative convergence over three load cycles Australian Mine A. Images are available in colour online.
Figure 5 shows the convergence in a single cycle that best predicted cavities. The value for this particular longwall was found to be 80 mm. It varied between 70 and 80 mm for the other two longwalls.
Convergence in a single load cycle Australian Mine A. Images are available in colour online.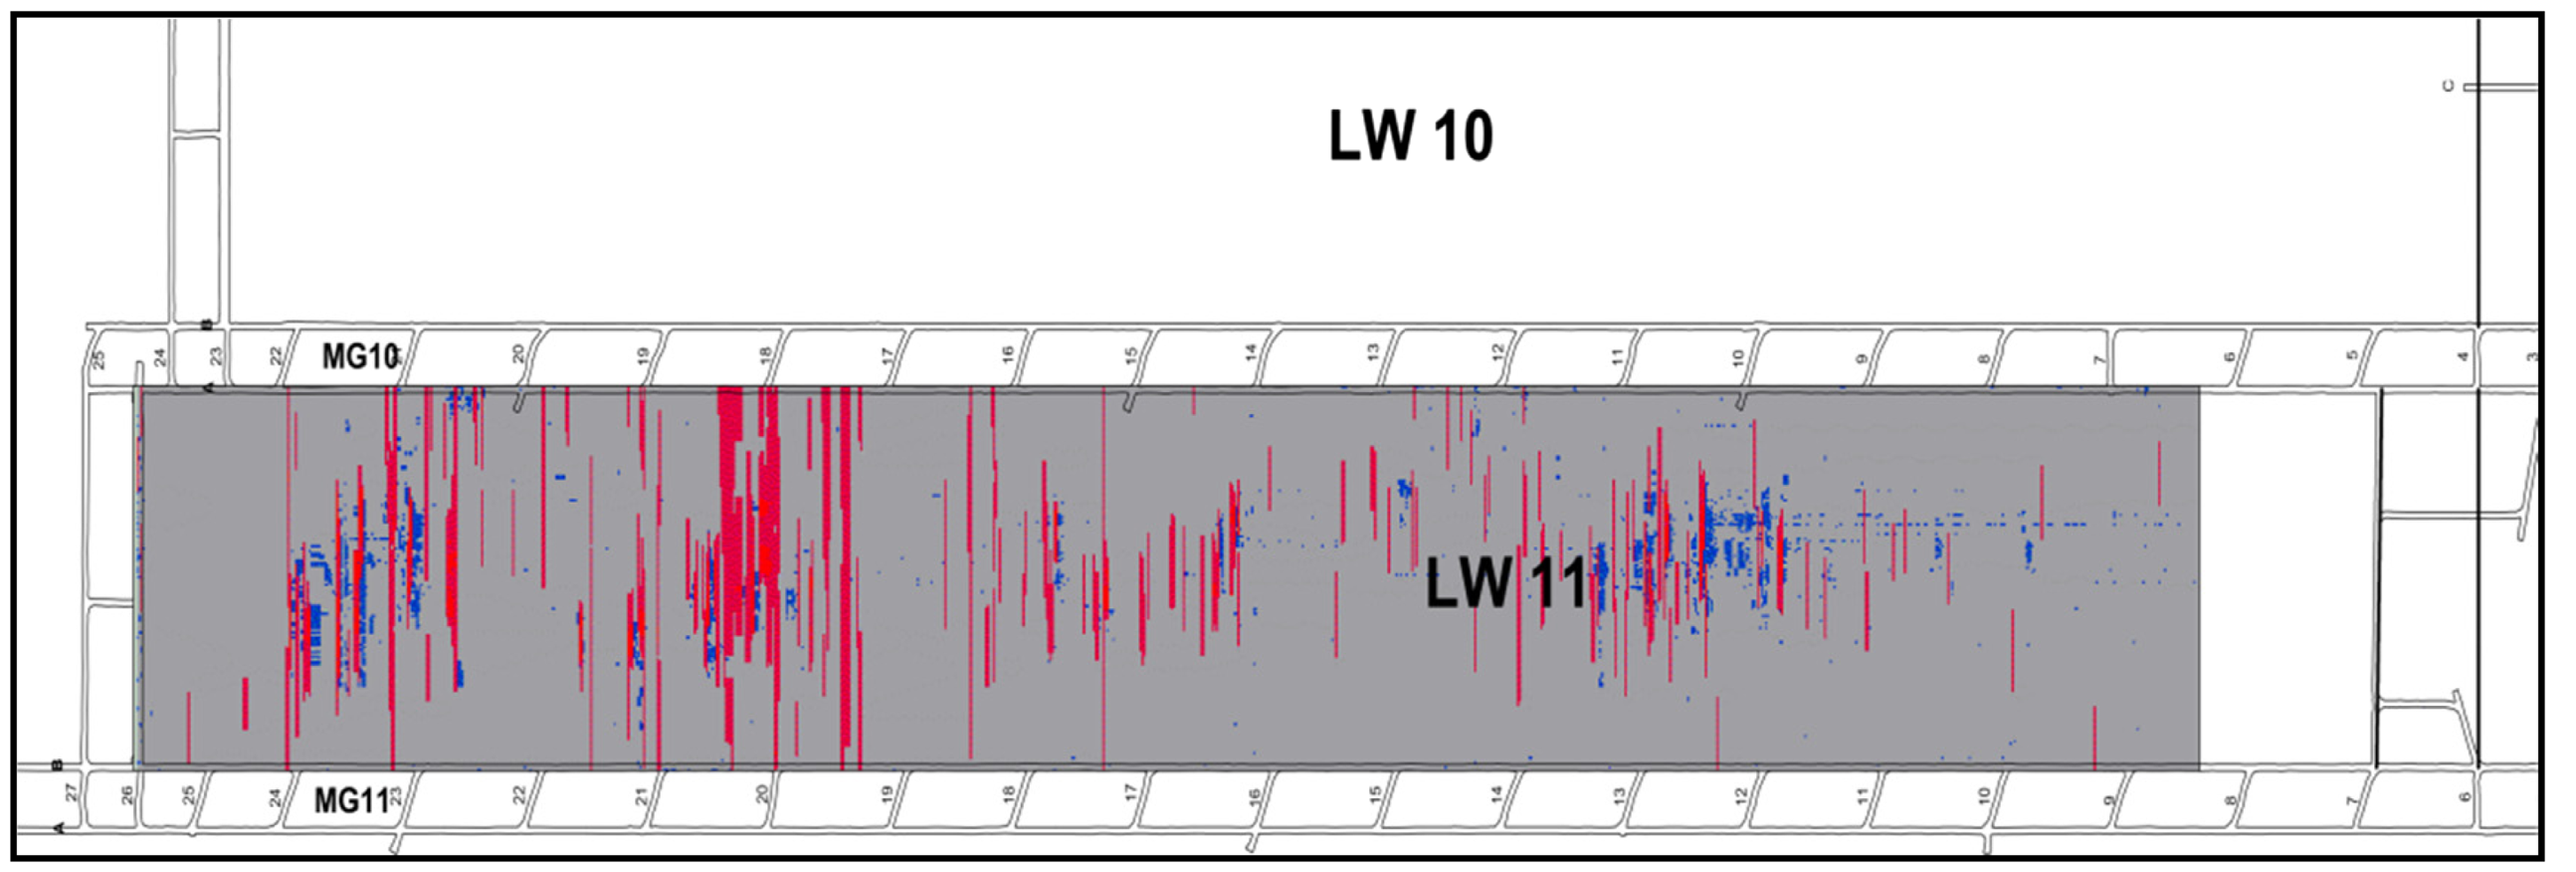
Threshold values at other sites
The threshold values at all the other sites were similar to the example mine described above. There were some specificity between sites and a small amount for different longwalls at the same site. Because two of the longwalls only had six shields each monitored for convergence it was difficult to give very accurate threshold values for these, although it was clear that they were similar to the other longwalls that had all shields monitored. Table 1 shows the threshold values that best predicted cavities for the three sites where all shields were monitored for convergence.
Pressure and convergence thresholds that best predicted cavities at mine sites A, B and C.
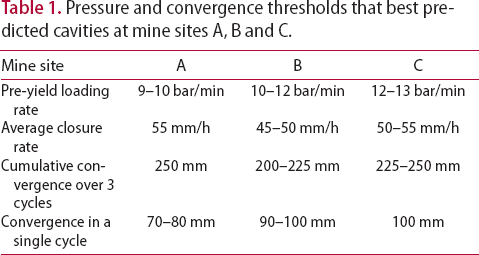
It must be noted that the pre-yield loading rate as an individual load cycle feature performed just as well with respect to predicting cavities as the convergence measurements. This was a surprise to the authors of this paper, who having envisaged this parameter as an inference only of post-yield convergence in the absence of reliable convergence measurements, considered that actual convergence measurements would perform better at predicting roof control problems. It is fortuitous that this is the case as most longwalls in Australia and elsewhere do not currently have reliable convergence monitoring.
The pre-yield loading rate can nevertheless be a fragile signal on some longwalls, particular those that use high set pumps. It is sometimes difficult to determine the difference between the high set pump loading the roof and the roof loading the shield. The loading rate also has to be determined immediately after the shield has been set when high set to yield pressures are used because when the loading rate is high the shield reaches its yield pressure value very quickly.
The predictive accuracy of the described indicators is increased when using more than one parameter to predict when roof control problems are likely to occur as all indicator threshold values will not necessarily be reached at the same time. Predictions are currently made on single threshold values as a way to combine them has not as yet been developed.
It was found that when these threshold values were reached or exceeded, cavities occurred approximately 80% of the time on all the longwalls at all of the mines where back-analysis was carried out (Trueman and Hutchinson 2017). Where cavities were not correctly predicted most were false positives; i.e. the threshold values were exceeded but cavities did not eventuate. These values compare well with the majority of rock mechanics empirical models. For example, Trueman and Mawdesley (2003) report that approximately 80% of the case studies predicted open stope stability and cavability correctly in their empirical stability graph. An exception was the last longwall back-analysed at Mine B. For two other longwalls at this mine, where back-analysis had been carried out and over the first third of the longwall in question, the accuracy of the predictions was also approximately 80%. Over the next two-thirds of that particular longwall, the apparent accuracy fell to about 40%. The probable reasons for this will be discussed in a later part of this paper.
Pre-warning of cavities
In Figure 6, a histogram is presented of the percentage of the cavities that occurred for the number of shears in advance that the pre-warning of a cavity occurring was given for Mine B. It can be seen that in about 28% of the time, the cavity occurred in the same shear as the thresholds were reached. However, in the majority of cases (>70%), pre-warnings could be given mainly between one and three shears and up to five shears in advance on occasions.
Number of shears pre-warning after the single cycle convergence trigger at Australian Mine B.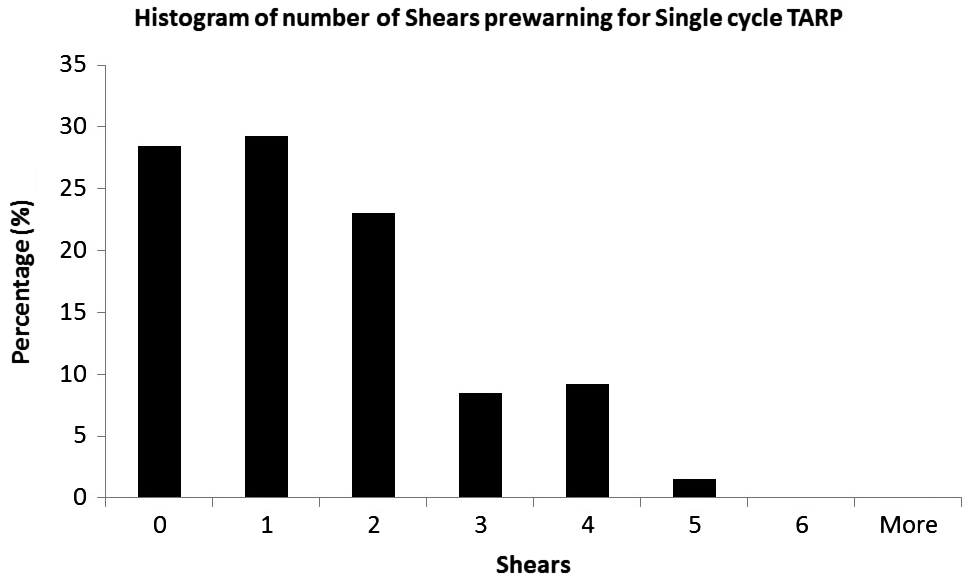
In Figure 7, the pre-warning time between the threshold values being triggered and cavities occurring can be seen. Cavities occurred in less than an hour after the triggering in only about 7% of the time.
Pre-warning time after the single cycle convergence trigger at Australian Mine B.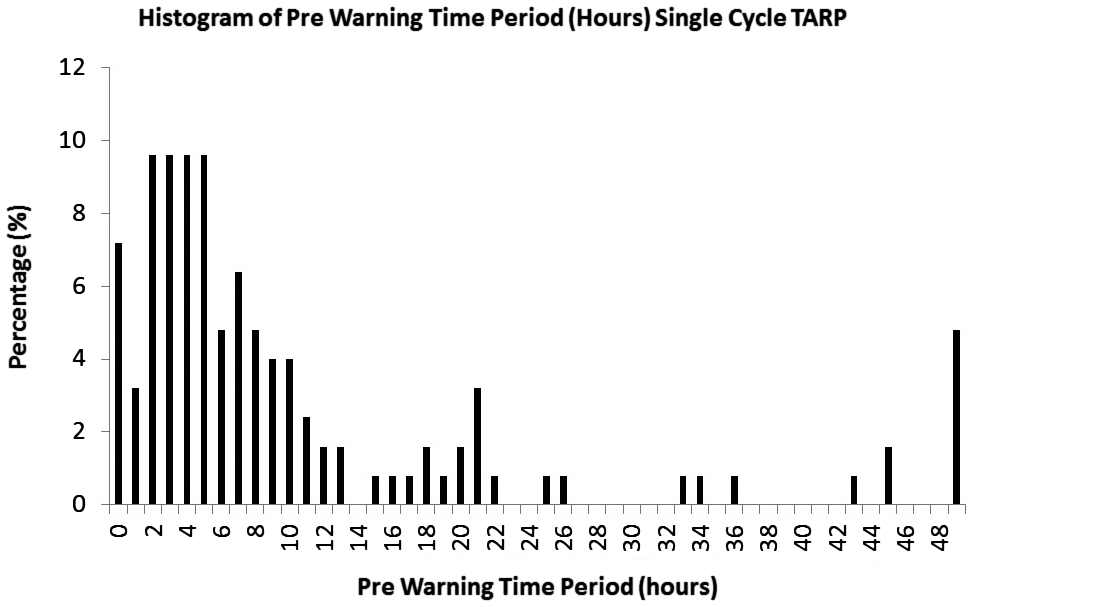
The above figures illustrates that sufficient pre-warning of impending cavities can be given within a time frame such that ameliorating action can be initiated on the majority of occasions.
Operational controls
Operational controls in poor roof conditions that are usually enacted are to minimise tip-to-face distance (the distance between the end of the shield canopy and the coal face, noting that this parameter can only be manually assessed on the majority of shields at the current time), reducing shearer speed if appropriate to ensure that supports are advanced one at a time and ensuring the hydraulic health of the supports (Galvin 2016). These controls can be effective in minimising roof control problems.
One of the operational controls that appear to be a subject of debate is set pressure. It is almost universally accepted that the set pressure is a critical factor during the normal operation of the longwall. However, once set conditions deteriorate because of roof guttering and small cavities and manual operation of the shields is enacted, the authors of this paper have observed at many longwall sites that set pressure tends in the main to be low to very low. One of the reasons given by mine operators to the authors of this paper is that the shield manufacturers recommend placing the tip of the support underneath the face side lip of a cavity thereby maintaining a flat canopy. To achieve this often means that high manual set pressures cannot be achieved. The authors of this paper have long suggested that very low set pressures will fail to eliminate tension in the subsiding roof plate and that this will lead to natural and mining induced fractures dilating. Thus, the mechanical interlock of the roof strata deteriorates leading to an unravelling of the roof strata. The authors of this paper have long espoused a compromise between canopy attitude and set pressure maybe a better strategy to deal with roof control problems.
This led the authors to the apparent significant fall in accuracy of the predictions over the last two thirds of the last longwall back-analysed at Mine B. They wondered if this operation had indeed compromised canopy attitude to achieve higher set pressures when roof guttering and small cavities had occurred. They could not get a definitive answer from the mine itself. Should this be the case then the identification of cavities from the sections of the TWAP map showing very low set pressure would be an unreliable method for the indication of cavities. Cavities or roof guttering could therefore have occurred in many of the false positive cases.
To investigate whether cavities were indeed forming, but managed better, step increases in tip height of the support, H1 and the difference of H1 and H3 (the height of the support at the rear of the canopy) were investigated to give an indication if the canopy attitude could be used to identify where potential cavities were occurring if high manual set pressures were being achieved. The results of this method were compared with the areas of the longwall where cavity formation was reliably detected using low set pressure and then used to imply where cavities may have been occurring later in the panel where there was a much higher incident of false positives in cavity detection using the load cycle parameters. Figure 8 shows a typical 3D contour of H1 for the month of August 2014. Regions where H1 lies above the general cutting horizon of nominally 3.8 m appears to correlate well with low set pressure areas from the TWAP map, possibly indicating that the tip of the supports has been placed up into a cavity. (This can be seen in the 3D graph of H1 as where the colour intensity is a deeper red and is significantly above the nominal cutting horizon)
Example of support canopy tip height H1 vs. chainage month of August 2014 Australian Mine B. Images are available in colour online.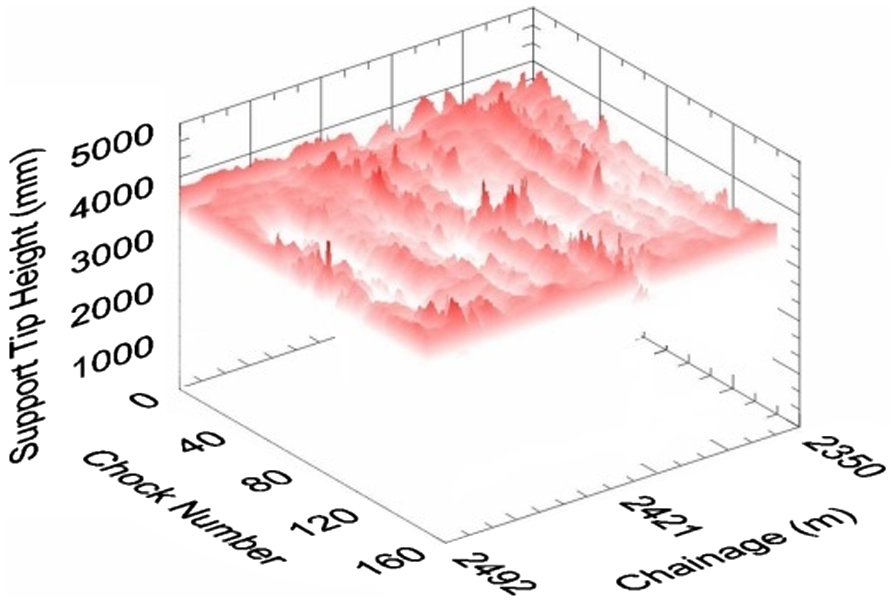
The value of H1 between release and set was used to infer that roof cavities or guttering may have occurred. It was found that if this signal stepped up by around 50 to 100 mm and that this trend was continued for several load cycles, this was a reliable indicator of cavities against those indicated by low set pressure on the TWAP map. In most cases the indication was within 1 shear of the low set pressure indication of at least 10 supports across the face not being set adequately. Hence, the H1 step at release to set of the supports was used to indicate the possibility of a cavity not detected by low set pressure from the TWAP map. These areas were then examined for indication of threshold pressure and convergence triggers preceding them. Using this method, it was found that the success rate of the threshold triggers for single cycle convergence improved from the aforementioned 40–76%. For much of the panel investigated, the success rate was improved to better than 80%. This indicates that the drop in accuracy of the threshold values in identifying roof control issues in advance may not be real, but a function of the method then being used to identify cavities. The latter is not reliable if operators are setting adequately in the presence of cavities or roof guttering. This conclusion, if correct, validates the researchers’ hypothesis that many roof control issues can be ameliorated, if operators set adequately as roof conditions deteriorate.
It was found that preceding the majority of these areas of potential cavity/roof issues, there were periods of high level periodic weighting with convergences in a single load cycle in excess of 80 mm. It is possible that after each weighting, the operators resumed the nominal roof horizon by cutting up. This could possibly be confirmed by shearer ranging arm signals, if they were available. It is also possible that the operators use the cavity formation to aid regaining the cutting horizon after a roof weighting. Also, it is possible that the cavities only occurred in the coal roof (Mine B being a top coal caving operation); if the cavities were small, they would not affect mining operations with the result of the cavities possibly only being some extra coal on the Armoured Face Conveyer.
Nonetheless these steps up in the roof were sudden, mainly within four shears after the weighting and often accumulating over several cycles to be in the order of 400 mm vertically or more, which would appear to be more in line with an indication of a cavity or roof softening, than cutting up in the roof to resume the roof horizon. The researchers’ are therefore of the opinion that their conclusion that most of the false positives recorded at Mine B were indeed a result of the operators maintaining adequate set pressures when roof conditions deteriorated. More work is required to enable the detection of cavities in the absence of low set pressures signals within the software if this is correct.
Conclusions
The following convergence and leg pressure triggers on at least 10 out of 20 adjacent shields have been found to correlate well with the formation of cavities:
An initial pre-yield loading rate of ≥9–13 bar/min, noting that the loading rate can be very difficult to determine when high set is enabled at some sites. A convergence in a single cycle of ≥70–100 mm. An average convergence rate of ≥45–55 mm/h. A cumulative convergence over three consecutive cycles of ≥200–250 mm.
There was a relatively small difference in threshold values between sites indicating some site specificity as would be expected, hence the ranges of the values noted above.
The triggers were subjected to time-consuming analyses that required a non commercial version of the software used in the analyses to be developed and a great deal of manual checking of raw data. In general, it was found that the triggers were approximately 80% accurate. There was a period of analysis on one of the longwalls at Mine B where the accuracy appeared to drop to 40%, with a large increase in apparent false positives. The analyses concluded that the most likely reason was that operators were setting adequately, when roof cavities and/or guttering was occurring and that this meant that cavities were not able to be detected by the use of low set pressure from the TWAP map. Change in shield height between load cycles was used to determine if cavities had possibly occurred and the accuracy of the triggers was determined to be approaching 80% using this method of cavity detection. If this is correct, this validates the authors of this paper hypothesis that a compromise between canopy attitude and set pressure can often prevent roof control problems deteriorating to the extent that the longwall has to stop operation when roof cavities occur. Low manual set pressures when roof cavities and/or roof guttering occurs will likely lead to larger (both in height and area) cavities and a deterioration in roof conditions to the extent that the longwall has to stop operating. Whereas, maintaining an adequate set pressure in the presence of cavities may enable the longwall to mine through the area of roof control difficulties by preventing the cavities increasing in size to the extent that the longwall has to cease operation.
In the majority of occasions, threshold values were triggered ≥1 shear in advance of roof cavities occurring and up to five shears in advance. In about a quarter of occasions, the threshold values were triggered within the shear that the roof control problems occurred. This means that adequate warning of impending roof control issues can be given for ameliorating operational controls to be enacted in the majority of occasions. In many cases, initiating these controls can prevent roof conditions deteriorating to such an extent that production on the longwall has to stop.
Disclosure statement
No potential conflict of interest was reported by the authors.
Footnotes
Acknowledgements
The authors would like to acknowledge financial support from the Australian Coal Association Research Programme, the industry monitors Dan Payne, Adrian Moodie, Dion Pastors and Peter Corbett and the personnel from the various Australian mine sites who assisted in the data gathering operations.