
Abstract
A trial on de-stressing a dyke that was located 60 m ahead of mining faces was conducted through drilling face-perpendicular preconditioning holes that intersected and passed the dyke by two metres. A sticky explosive (Ug101s) with a density of 1.1 g/cc, charging amass of 30.4 kg, powder factor of 1.3 kg/tonne, with gassing gap and 5 m long tamping material were used. After detonating the holes, a small seismic magnitude was noted. As mining progressed towards the dyke and passing through the dyke, good ground conditions were observed. Numerical modelling was conducted to simulate rate of energy release (RER), major principal stress ahead of the mining faces and simulation of the ride. The results of the study showed a gradual decrease of sigma 1,RER and high possibility of large seismic events to occur when mining through the dyke and also increase in the ride at the vicinity of the dyke.
Keywords
Introduction
Historically, Toper (2003) mentioned that in the mid-1980s, the Chamber of Mines Research Organisation (COMRO) initiated a research programme to investigate an active rockburst control technique in South African mines, specifically gold mines. The investigation was focused on developing an effective preconditioning method that can transfer stress far ahead of the mining faces and also assess the potential of this technique to be implemented in deep gold mines (Brummer 1988).
According to Rorke et al. (1989), the COMRO involvement in preconditioning began in 1987 with experimentation at West Driefontein Gold Mine where 32-12W stope was mined into a large remnant ground along the Western Deep Levels (WDL) boundary. Toper (2003) reported that long face-parallel preconditioning holes were implemented at the mining panel which was approximately 30 m. In order to achieve the objective of the study 76 mm diameter holes were positioned between 2.5 and 3.5 m ahead of the face and drilled within a shift (Toper 2003). Successful implementation was achieved by applying preconditioning beyond the line of the previous preconditioning holes; hence, the spacing between the preconditioning holes is approximately 8 m, on average (Toper 2003).
A few months after the implementation of the technique several mining stopes that were associated with the problem were able to be mined out safely (Toper 2003). Similar to other rockburst research, ground convergence was also taken into consideration and a convergence of approximately 5–40 mm was recorded, with face scaling of approximately 300 mm, and a lack of damage at the face following large seismic events was reported (Toper 2003). In a further analysis by Toper (2003), a reduction in shallow dipping fracturing was also noted as result of effective preconditioning practice. Eventually, the project was terminated because it could not be implemented in the mining layout at the mine.
Rorke et al. (1990) and Toper (2003) reported that a preconditioning experiment was also initiated on Blyvooruitzicht Gold Mine (BGM) in the 18-13W stope, on an up-dip panel along a protection pillar which was adjacent to a seismically active fault. In order to achieve the objective of the experiment a series of 30 m long, 76 mm diameter holes fanning out from the dip gullies were planned to be drilled throughout the full length of the pillar with the purpose of preconditioning the pillar with one blast. However, some difficulties were reported which limited the number of holes drilled along the pillar and it was reported that only 10 m holes were achieved (Toper 2003). Surprisingly, the experiment was reported to be successful with no seismicity or rockburst related accidents being reported.
Lightfoot et al. (1996) and Toper (2003) reported that the first experiment on mining the dip pillar with preconditioning commenced in mid-1990 at the BGM. This dip pillar has been reported to be 40 m wide and 150 m long with the top of the pillar terminating on a stabilizing pillar. Furthermore, analysis has shown this pillar was historically mined using conventional mining techniques, however, due to ground instability and seismic events that were plotted along the pillar, the mine decided to introduce preconditioning prior to mining the pillar. During this implementation, COMRO were requested to monitor the rockmass response and behaviour of the pillar. Similar to other projects mentioned above, the method used for this project was similar to the 18–13 W stope: 10 m long holes fanned out from the dip gullies. As usual, difficulties were experienced during drilling due to fractured and highly stressed ground conditions. However, eventually the practice became successful and the dip pillar was mined out without injuries or major damage.
Toper (2003) pointed out that in late 1994, gold mining companies recognised that although the implementation of face-parallel preconditioning found to be more suitable when mining with long and narrow in-stope pillars, it was noted that the method can be much more difficult to implement in a deep-level longwall production environment without compromising the time of the mining cycle. As a result, a new experiment was initiated to assess the use of short face-perpendicular preconditioning holes that were blasted with production holes; the first experiment was conducted at South Mine (Toper 2003). It was then noted that the practice could be implemented in a deep-level longwall mining environment without compromising the mining cycle time (Lightfoot et al. 1996).
According to Adams and Geyser (1999), in early 1999 a successful face-perpendicular preconditioning experiment was carried in Kloof gold mine No.4 shaft. This experiment was conducted within development ends also known as new mine development. This study was initiated due to ground instability and strain bursts that were reported along the haulage which intersected a seismically active geological structure (dyke). Further study by Toper (2003) showed that this haulage was associated with a dyke that was weaker than the surrounding lava and rockmass.
In order to mine through the dyke, a face-perpendicular preconditioning pattern 14 preconditioning blasts was implemented in one of the conventional stopes or this was conducted with constant face advance (Toper 2003). The mining faces were then driven through the dyke without any reported injuries and face burst problems. After this experience, the preconditioning technique on this site was found to be very successful in reducing face bursts as well as eliminating injuries.
Toper (2003) compared the un-preconditioned and preconditioned blasts on the mining panel. His findings indicated that the preconditioned faces resulted in improvement of face fracturing, transfer of stress from the mining faces, improvement of hanging wall conditions, a significant improvement in the face advance, and a rapid decrease of rockburst occurrences. However, as his work was conducted in a conventional mine it has limited relevance to the implementation of these methods in a mechanized gold mine.
Research approach
The research started with an extensive literature review on preconditioning practice, rockburst, instrumentation and monitoring systems related to the effectiveness of preconditioning. The purpose was to obtain an enhanced understanding of the face-perpendicular preconditioning practice when de-stressing geological structures that are far ahead of the mining faces. The research was carried out in three sections where the mining faces were intersecting the same dyke. Underground observations (visual examination), recordings and data collection were also conducted within the sections. The fracturing on the mining excavations before and after the practice and general ground conditions were observed and photographs were taken after the observations. Core logging was also conducted to understand the strength of the dyke and also to be able to estimate the stress levels through the use of core discing concepts.
Microseismic monitoring, Ground Penetrating Radar (GPR) and Borehole cameras were used for monitoring the effectiveness of face-perpendicular preconditioning practice. Vantage and Abaqus modelling software were used to simulate sigma 1(major principal stress) ahead of the mining faces and in the vicinity of the dyke and were also used to simulate Rate of Energy Release (RER).MAP3D was used to simulate ride/displacement along the dyke and the results were used to estimate seismicity within the section. The methods used for each monitoring system are as follows:
Microseismic
This section provides a detailed explanation of the methodology used to monitor microseismicity in the study area including the recording and processing of the seismic events and the processing of a particular event.
Recording and processing seismic data
The seismic system was designed to run continuously and record seismic events whenever they occur. Ground vibrations caused by seismic events were recorded at each underground seismic site and were then sent automatically to the Desktop Run Time System (DRTS). If the DRTS was down when a seismic event occurred, the data were recorded in the seismometer and were in most cases, retrieved when the DRTS came back online. Normally, the DRTS requests seismic triggers, groups them into seismic events and records the information on a hard disc.
Seismic events were then automatically processed, which involved the automatic picking of P-wave and S-wave arrivals on seismograms and the calculation of the location and source parameters. The automatically processed seismograms were then saved to the database. However, the automatic processing was not developed to a reliable level and all seismograms of seismic events ML ≥ 0.5 were manually processed by Seismic Data Processors.
Seismogram processing
The software programs, JMTS or Trace (TM), were used for the processing and analysis of seismograms. Routine seismic data processing was carried out at the IMS by trained Seismic Data Processors. They manually processed all seismic events that were recorded during their shifts and communicated any problems encountered to their supervisors. The Seismic System Administrator performed quality control on the recorded data. The status and health of the seismic networks were communicated to the mine by means of daily and weekly reports.
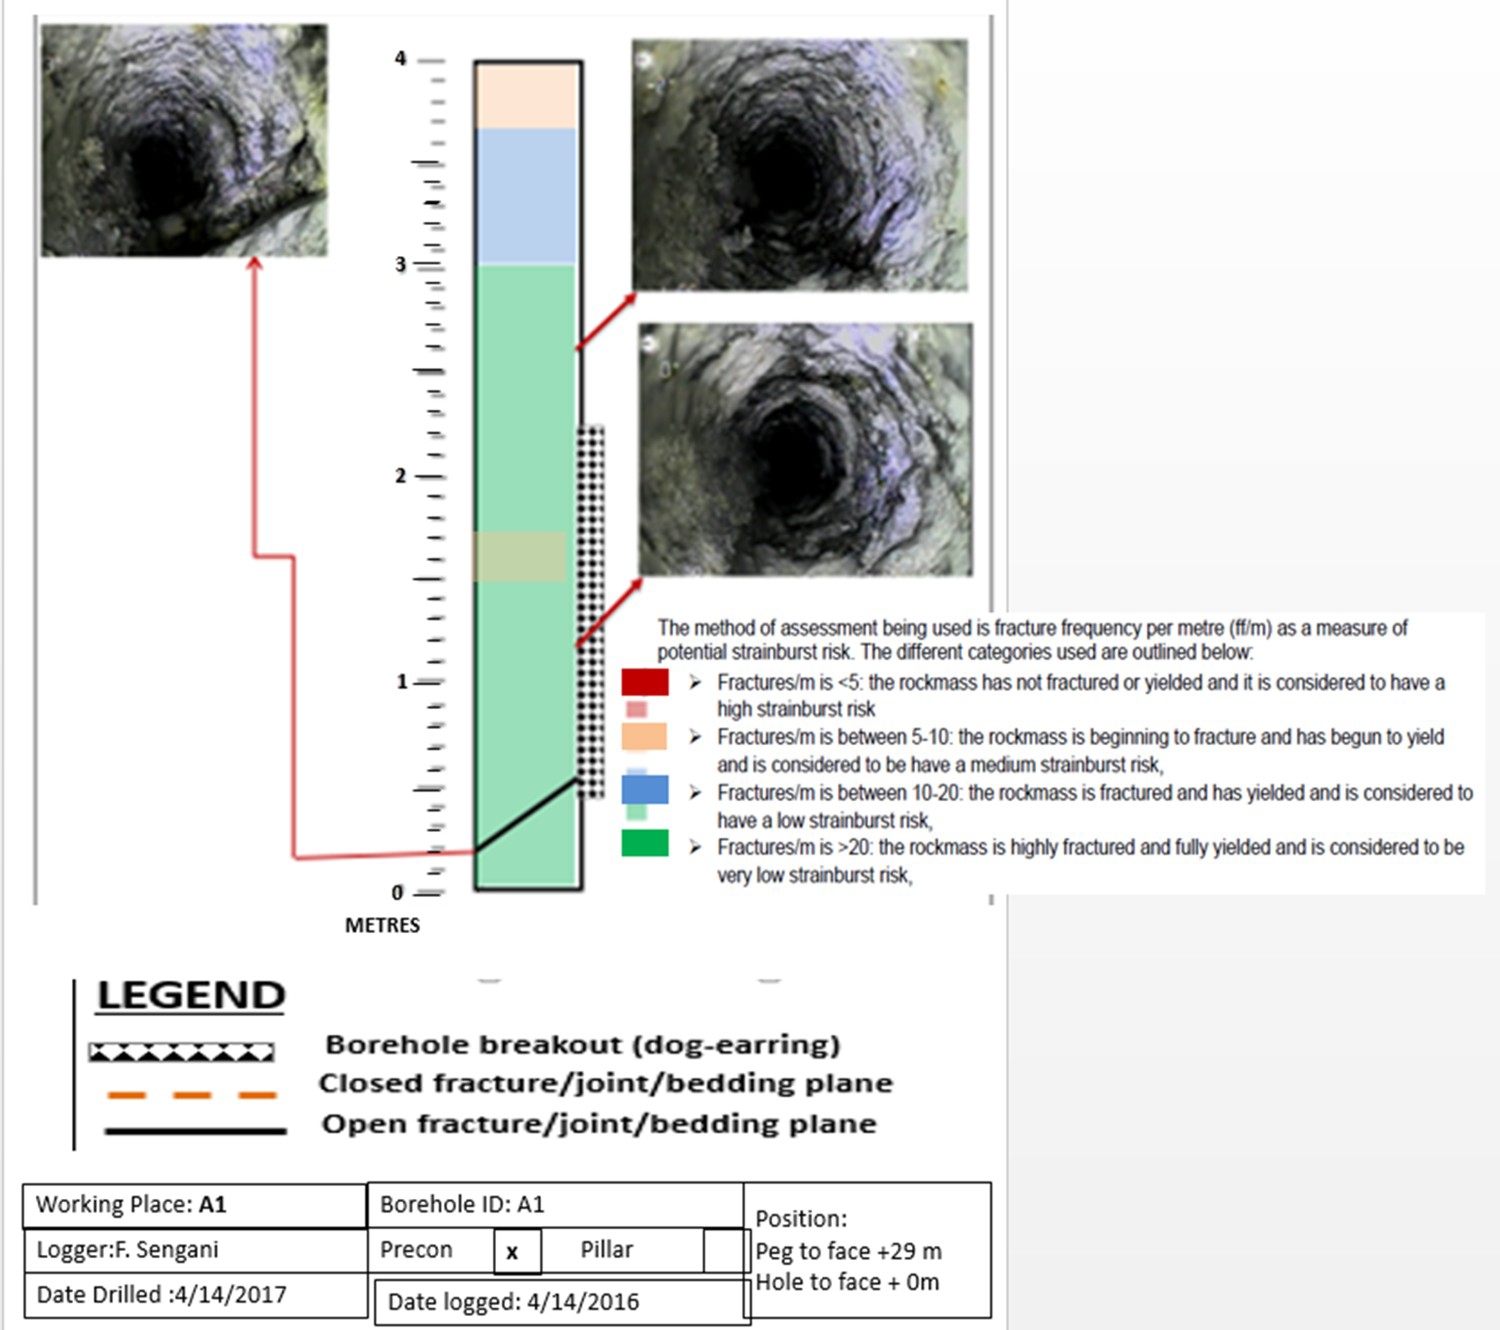
Borehole log methodology
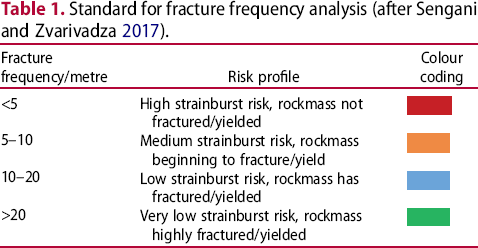
Standard for fracture frequency analysis (after Sengani and Zvarivadza 2017).
Ground penetration radar
Ground penetration radar was used to analyse the effectiveness of the long-holes face-perpendicular preconditioning practices by studying the fractures. The analysis was conducted before and after the implementation. From the GPR images, it was possible to study the fracture depth and intensity of fracturing ahead of the face to define the zone of influence of individual preconditioning holes. The fracture patterns before the implementation of the long-holes face-perpendicular preconditioning blasting and after the implementation of the practice were compared.
Implementation of the practice
In September 2016, the Grey Ghost Dyke was intersected by three de-stress sections at the mine. Immediately after intersecting the dyke, a rapid increase in seismicity was experienced at the mining faces, and ahead of the mining faces. As described earlier in this paper, it was postulated that the dyke contains a build-up of stress as the mining front approaches it. This built up stress eventually exceeds the strength of the dyke material and results in increased seismic activity. The dyke also acts as a barrier for stress to propagate further south and thus result in increased seismicity between the dyke and the mining front. For this reason, it was decided to implement long-hole preconditioning in order to fracture the dyke and thus negate the ability of the dyke to build-up stress as well as to allow stress to naturally propagate south of the structure (see Figure 1).
Plan view of how the dyke was de-stressed.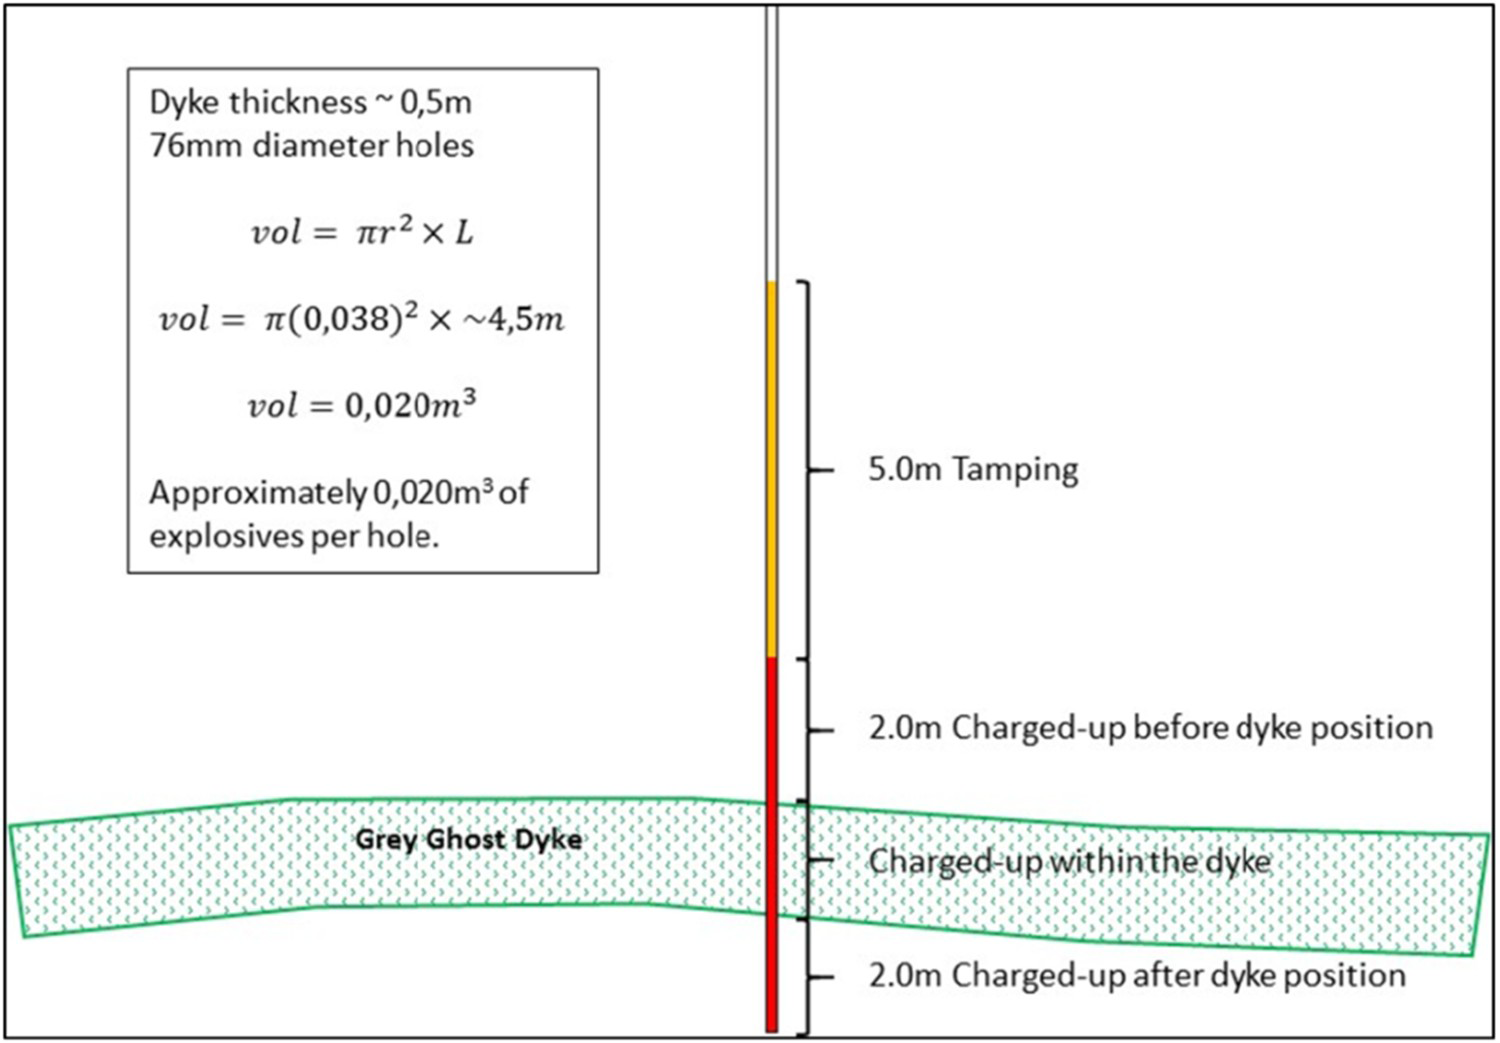
As a result, a number of strategies were employed together with long-hole preconditioning, which include the following:
Precautionary zones Face advance Additional support
The seismically active geological structure is demarcated on the plan and a precautionary area, 15.0 m ahead, and 15.0 m beyond the structure (including the actual structure) is highlighted in orange on the plan. This precautionary zone indicates the onset of a number of special precautions to be taken in order to safely negotiate the geological anomaly.
Once in the demarcated precautionary zone, face advance is limited to a maximum of 1.5 m. This ensures unsupported spans are limited to a minimum following the blast and assists with shift cleaning and re-supporting of the blasted face.
Although the support system in general caters for the anticipated seismicity expected at the deep-level gold mine, additional support was required within the precautionary zone. The normal square pattern of support was supplemented with an additional bolt in the middle of every four bolts installed, effectively doubling up on the support requirements.
Results of the study and discussion
This section provides detailed results of the study, results of the laboratory tests on the dyke material, stress analysis using core discing concept, ground conditions before and after the implementation of the practice, seismic monitoring results, numerical modelling results including Rate of Energy Release, major principal stress ahead of the mining faces and ride along the dyke.
Laboratory analysis
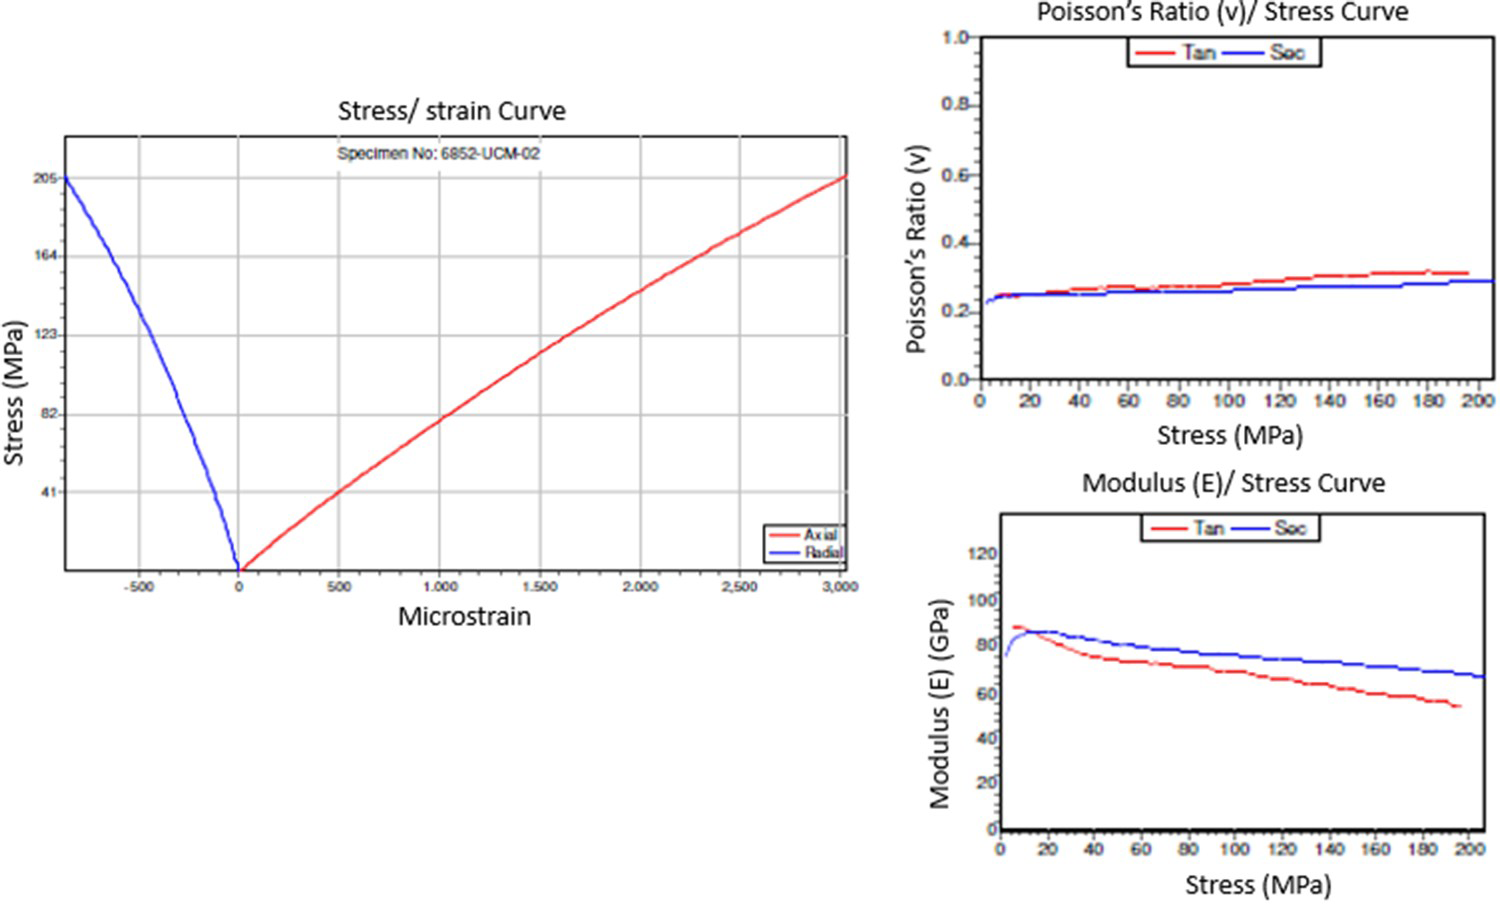
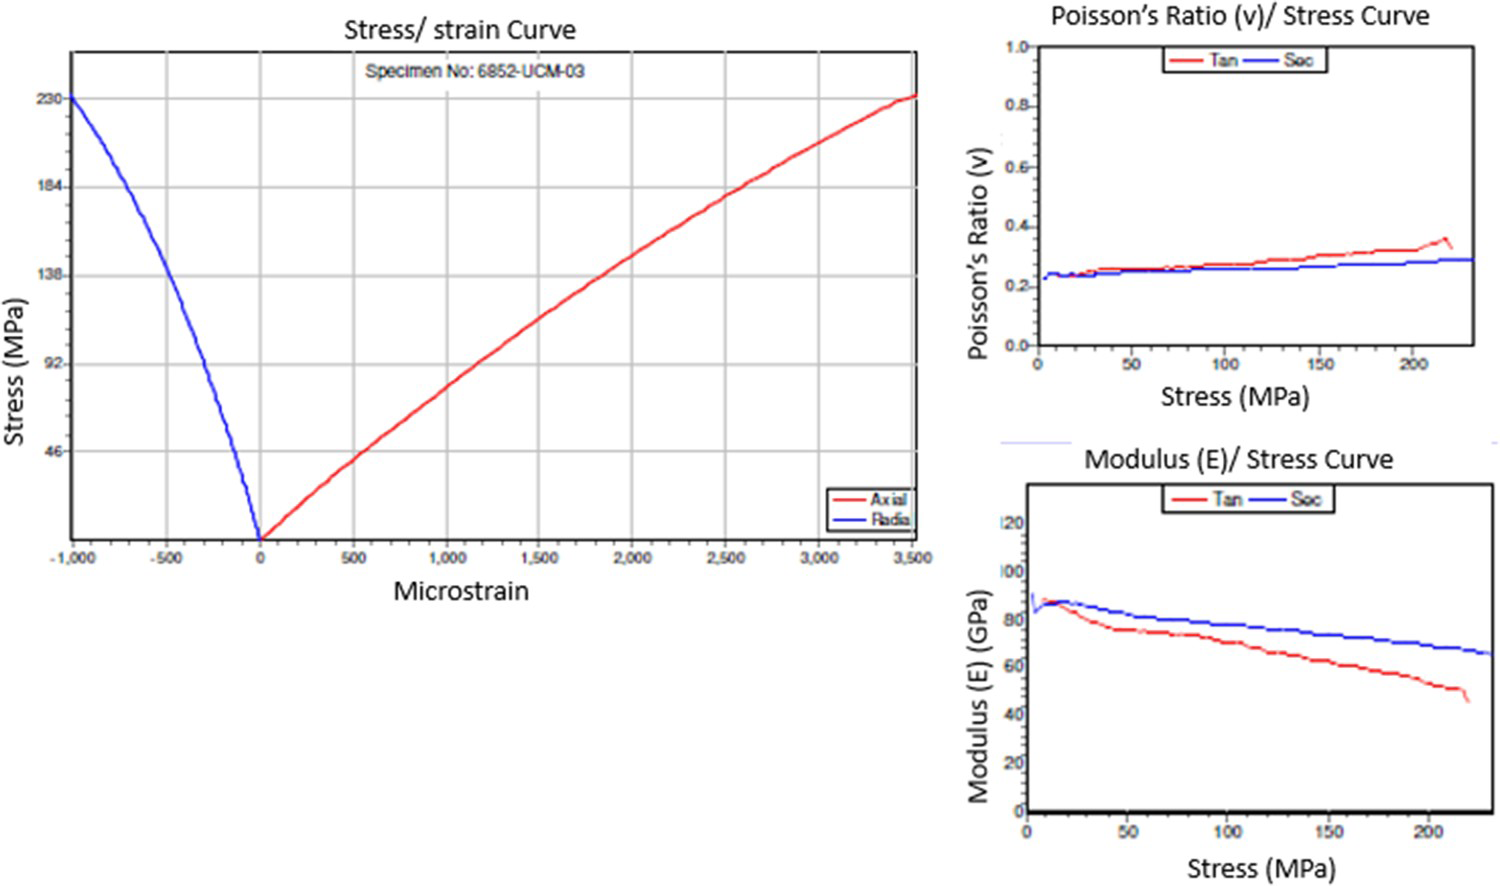
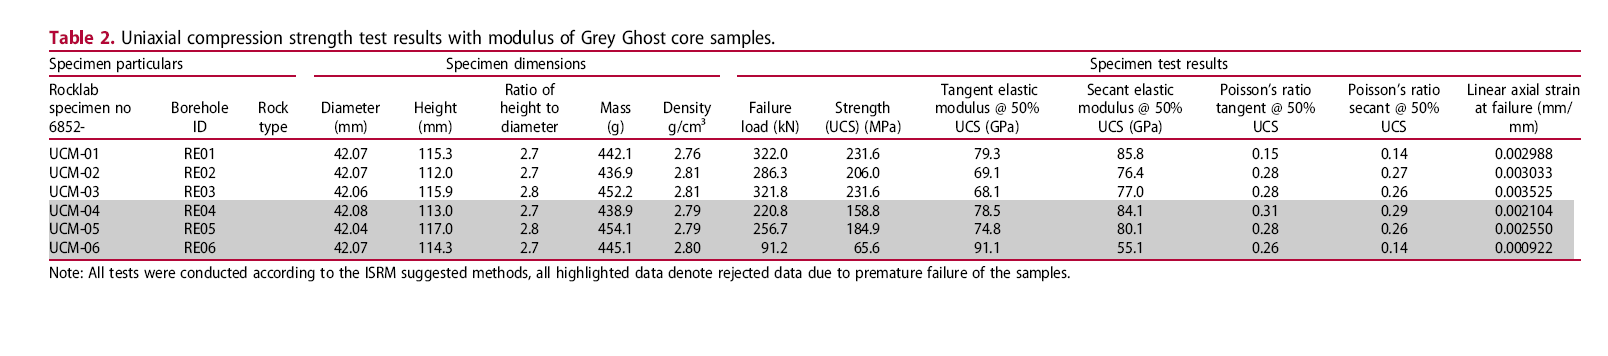
Laboratory testing confirmed the high stiffness and strength of the dyke material. Core recovered from the diamond drill holes used to fix the position of the dyke confirmed the laboratory testing and suggests the dyke material strength is superior to that of the host quartzite (see Table 1, Figures 2–4). The contacts between the dyke and the country rock did not show extraordinarily weak or sheared surfaces and, in fact, showed relatively competent contact surfaces. The laboratory testing data support the initial postulation that, as a result of the higher stiffness (and strength) of the dyke, stresses are concentrated in the dyke and when the strength of the dyke material is exceeded, violent bursting of the dyke material may occur resulting in seismicity along the feature (see Table 2, Figures 2–4). It was believed that the dyke also acts as a barrier for stress to propagate further south and thus results in increased seismicity between the dyke and the mining front. Table 2 and Figures 2–4 show the laboratory results.
Sample 1 – stress–strain curve, Poisson ratio–stress curve and modulus–stress curve. Sample 2 – stress–strain curve, Poisson ratio–stress curve and modulus–stress curve. Sample 3 – stress–strain curve, poisson ratio–stress curve and modulus–stress curve. Uniaxial compression strength test results with modulus of Grey Ghost core samples. Note: All tests were conducted according to the ISRM suggested methods, all highlighted data denote rejected data due to premature failure of the samples.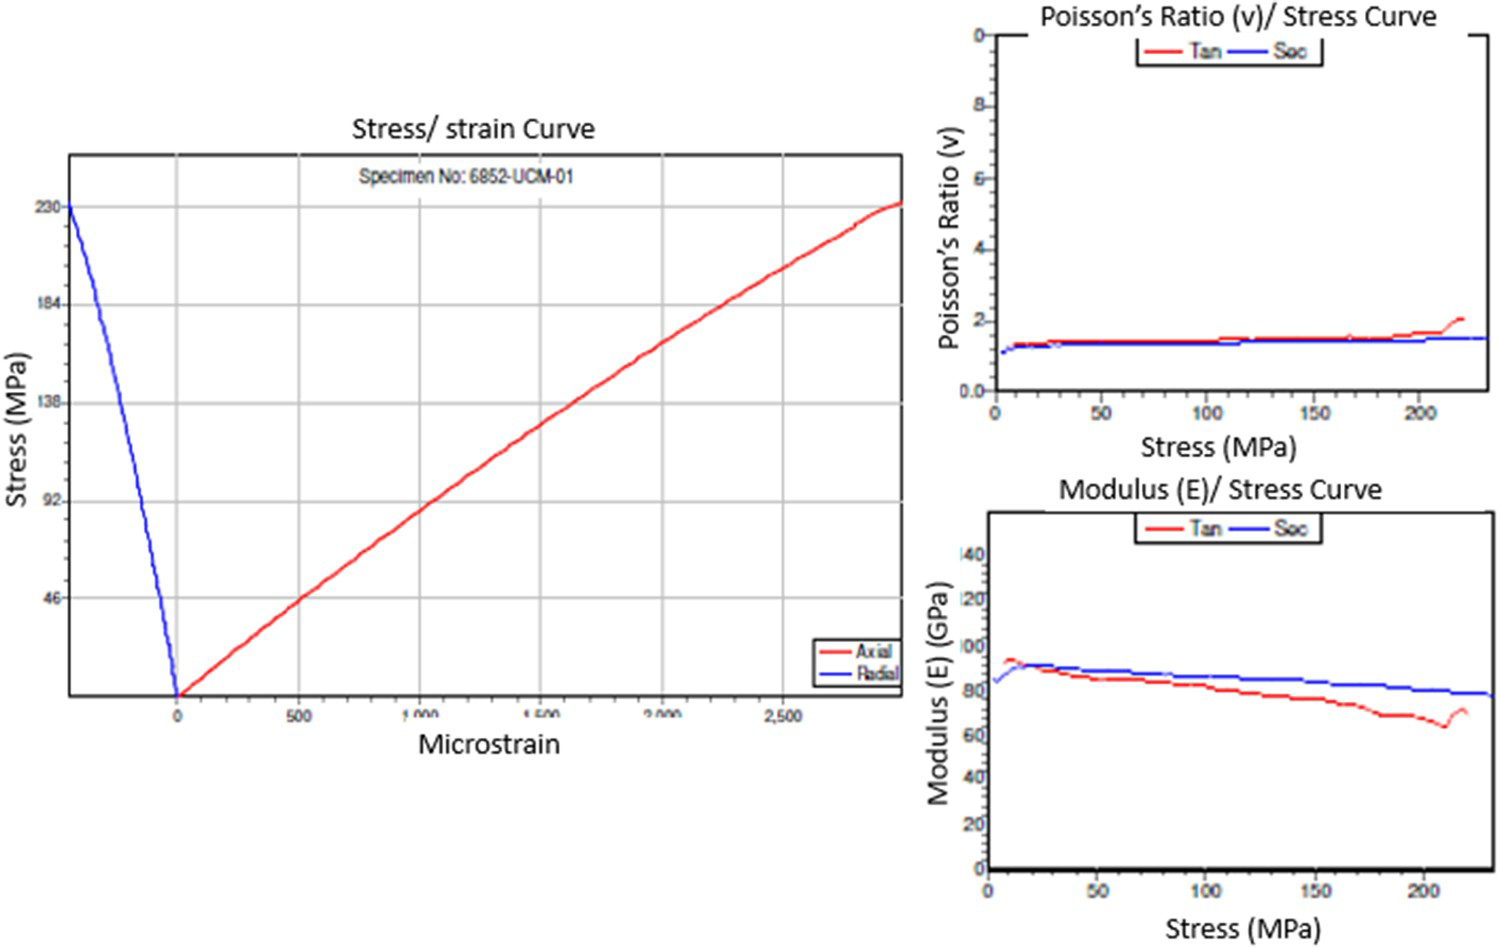
Stress analysis using core discs
Core discs are considered to be an indirect method to determine in situ rock stress levels based on rock behaviour. A borehole core often appears to have discing at certain intervals along the length of the drilled core. This discing is formed as a result of stress relief after the core has been drilled. Fracture trajectory experiments conducted by Matsukia et al. (2004), have shown that the concave axis gives the direction of the maximum principal stress, while the intermediate principal stress is oriented in the convex axis and the minimum principal stress is normal to the core axis (see Figure 5).
Disc end indicating direction of principal stresses (Matsukia et al. 2004).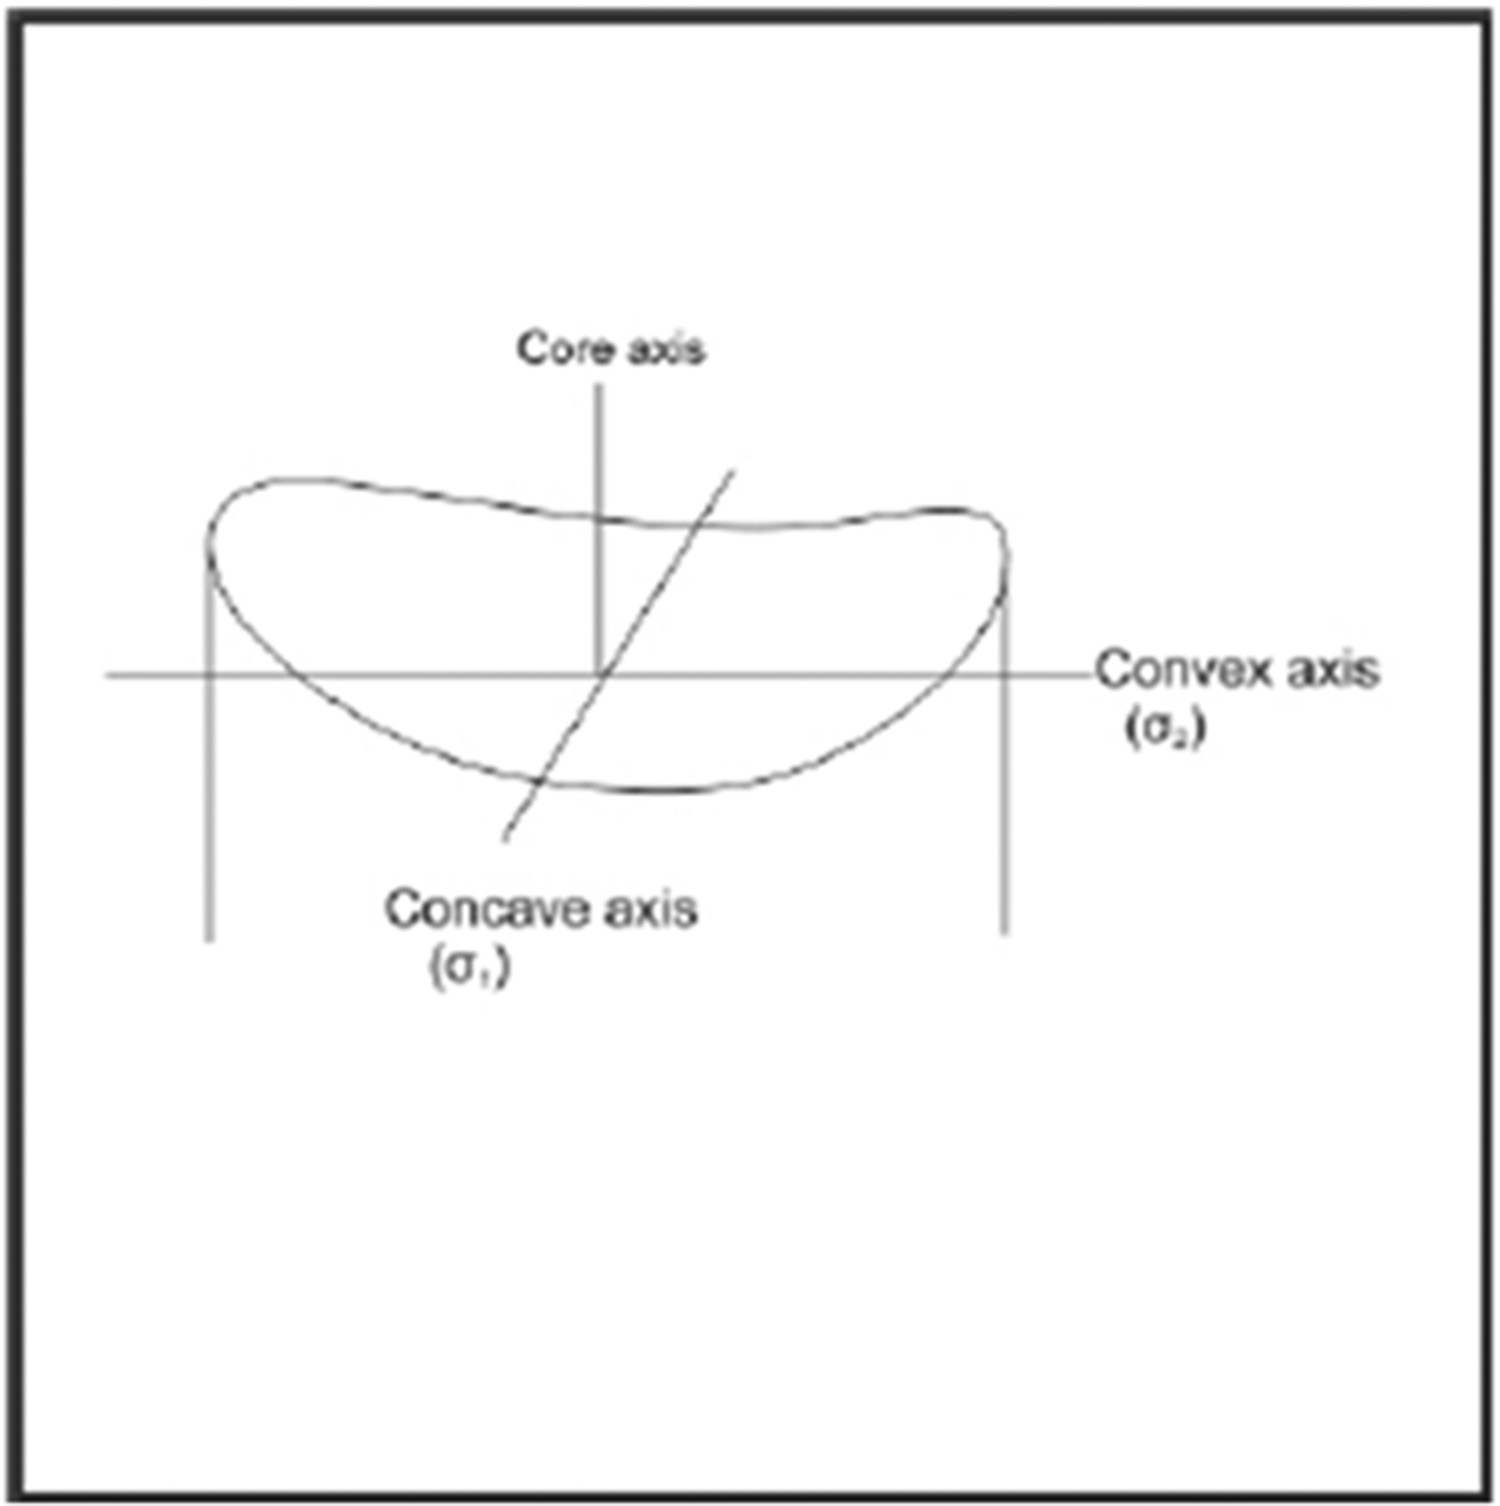
Further studies by Stacey and Wesseloo (2012) have shown that the stress orientations can also be approximated by observing the shape and symmetry of the discs. Their study has shown that when the core has symmetrical discs about the core axis, such a situation is an indication that drilling took place in the direction of one of the principal stresses. This can be illustrated in Figure 6.
Symmetrical core disc (Stacey and Wesseloo 2012).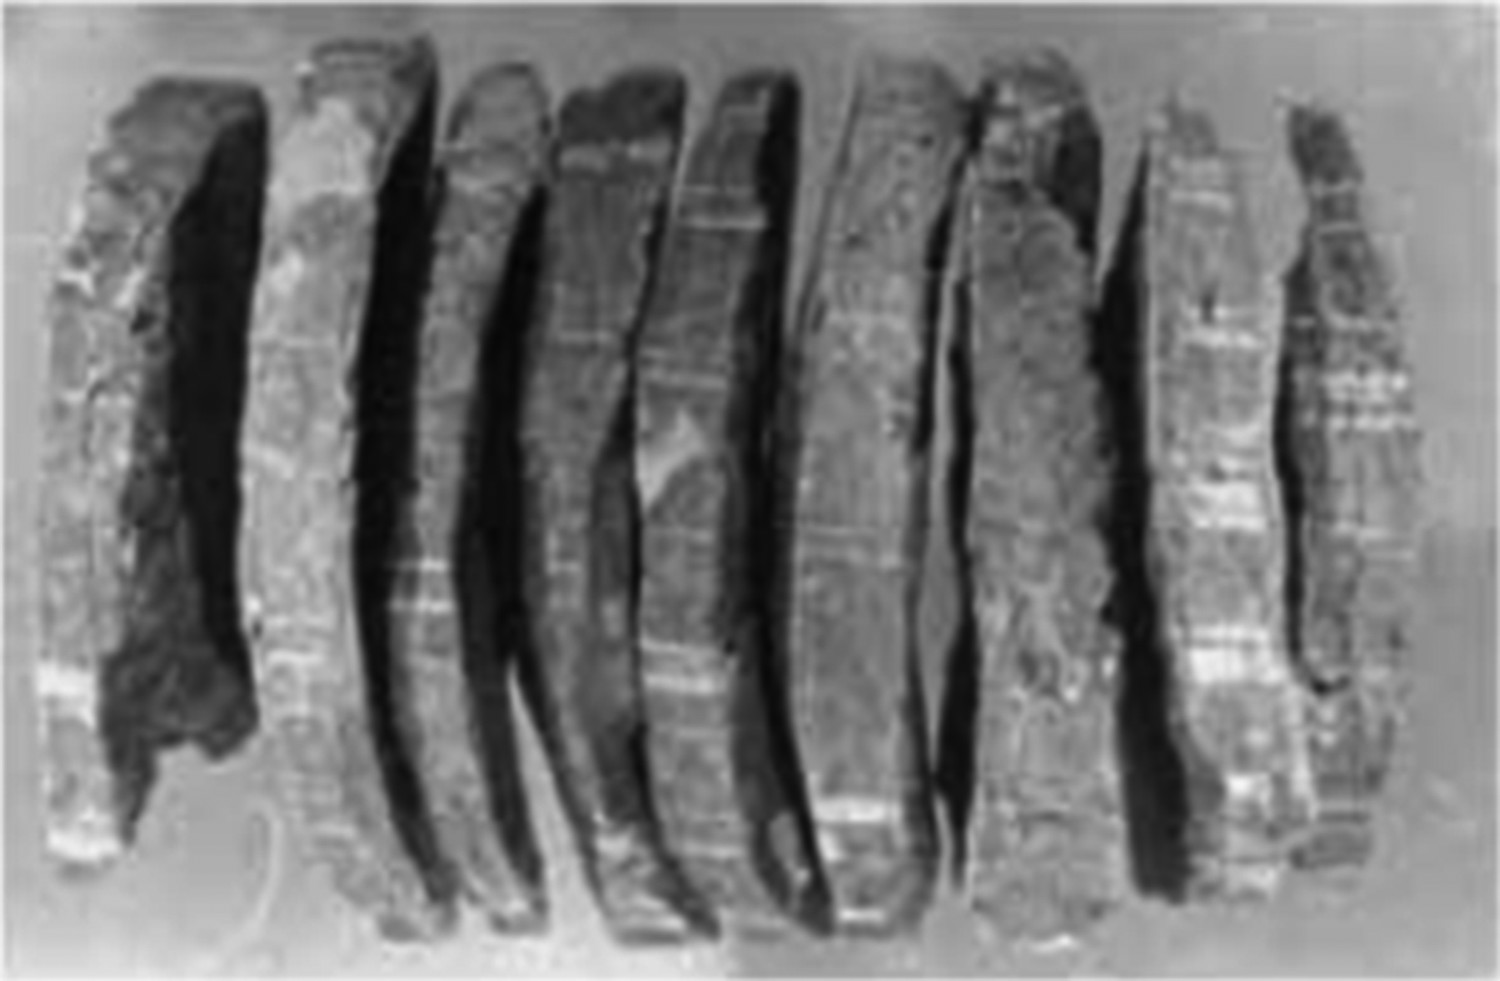
Their study discussed some of the cardinal points concerning core discs resulting from unequal stresses. They concluded that a principal stress that is at an inclination to the borehole axis can be gauged from the relative asymmetry of the disc when the stresses are perpendicular to the core axis are not equal. The core circumference will peak and trough and the line drawn between the peaks of the disc indicate the direction of the minor secondary principal stress (see Figure 7). Their study also provides clear discussion on a core that is not symmetrical. They noted that such a core indicates the presence of shear stress orientated across the borehole axis or that the borehole axis is not in the same direction as the principal stress (see Figure 8).
Core disc resulting from unequal stresses (Stacey and Wesseloo 2012). Non-symmetrical core disc (Stacey and Wesseloo, 2012).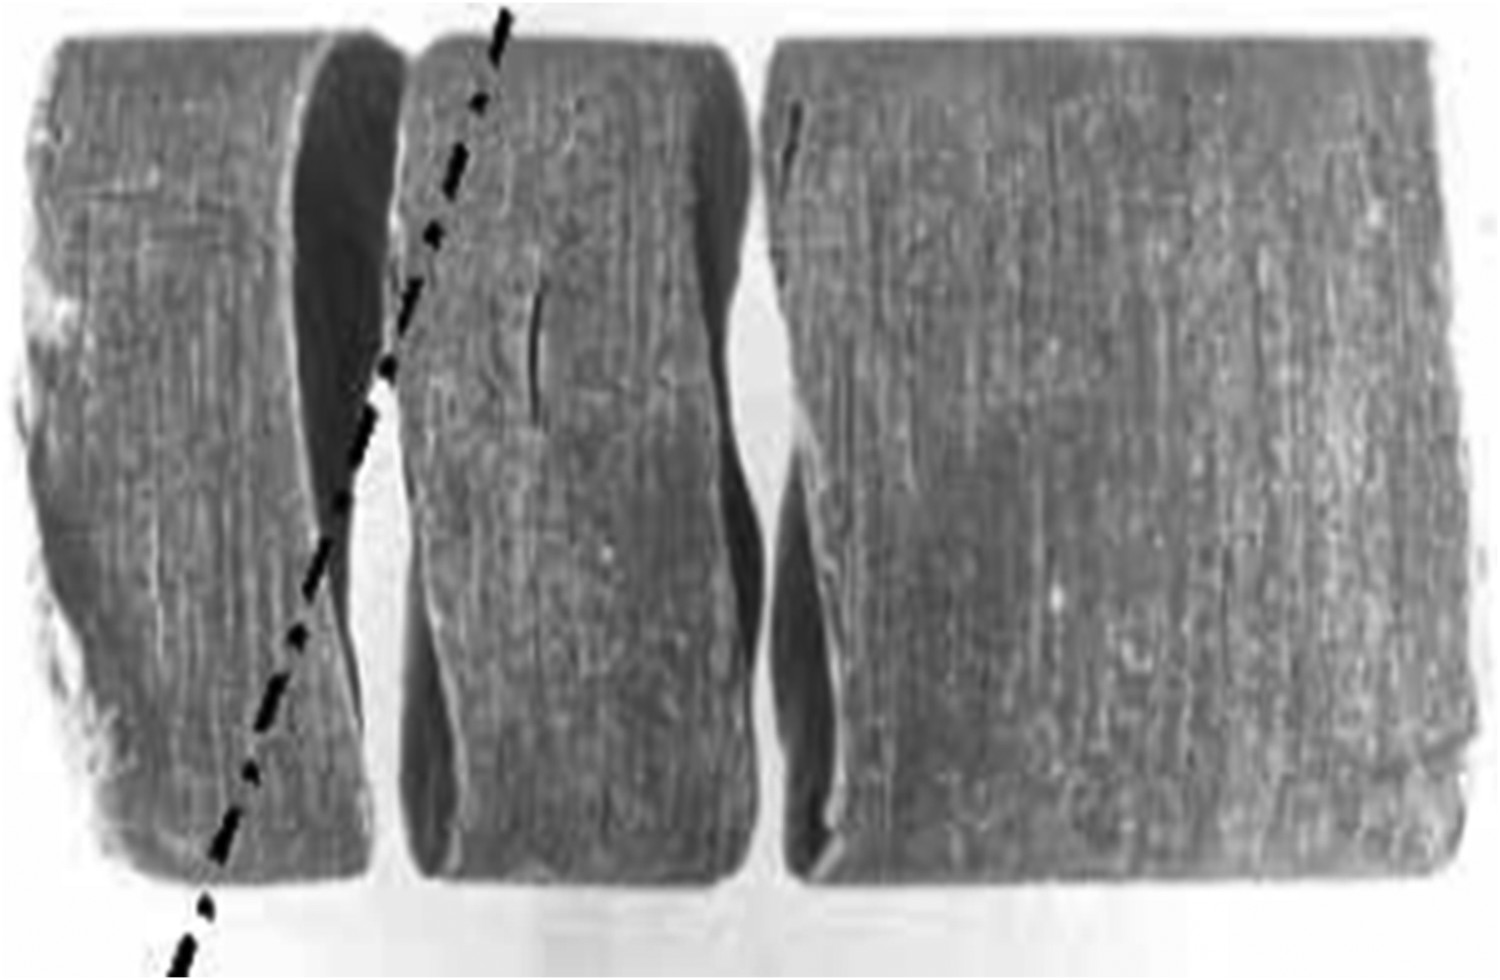
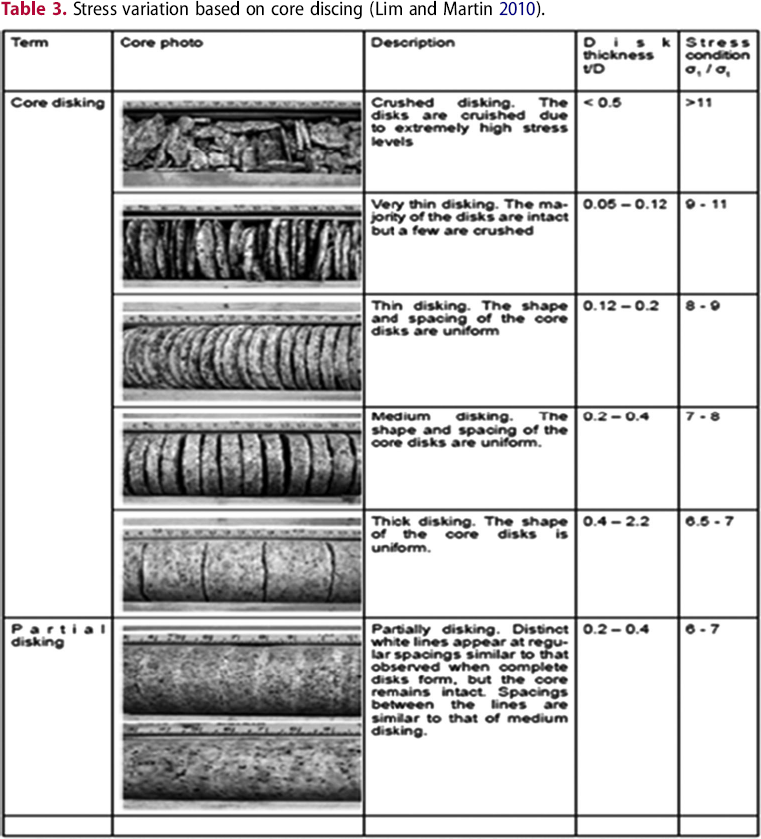
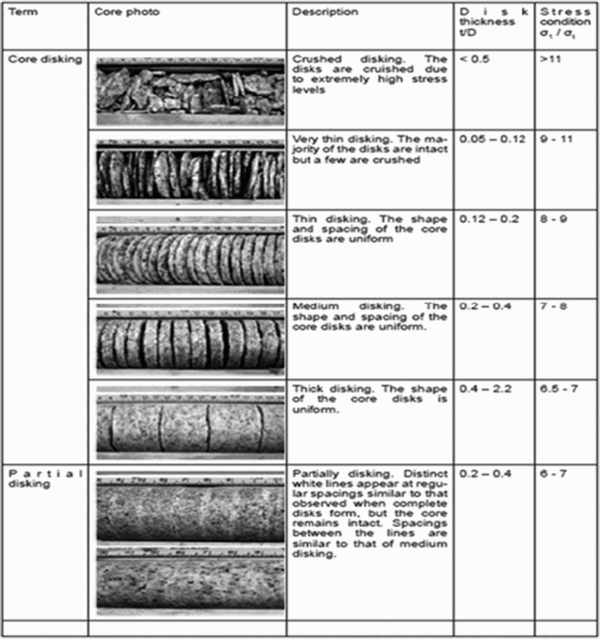
Stress variation based on core discing (Lim and Martin 2010).
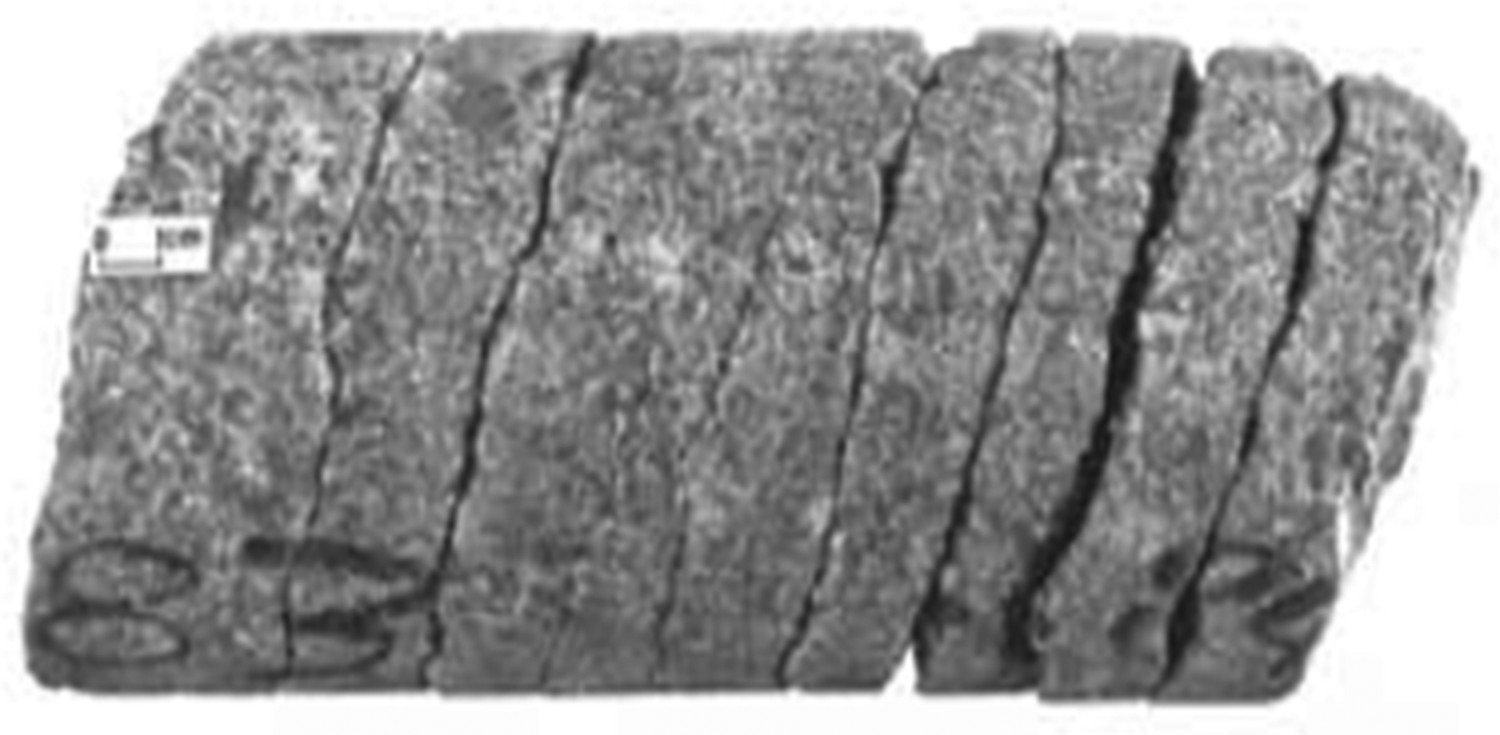
Similarly, the same concept was applied in order to understand the relationship between the simulated model and the actual observations. It was then noted that a high stress was experienced at the collar of the borehole up to 3–4 m towards the solid ground. This high stress could be the major influence of extensive fracturing along the beginning of the bore-hole (see Figure 9).
Depicting the core recovered from 100 4 West, showing the dyke intersection. Images are available in colour online.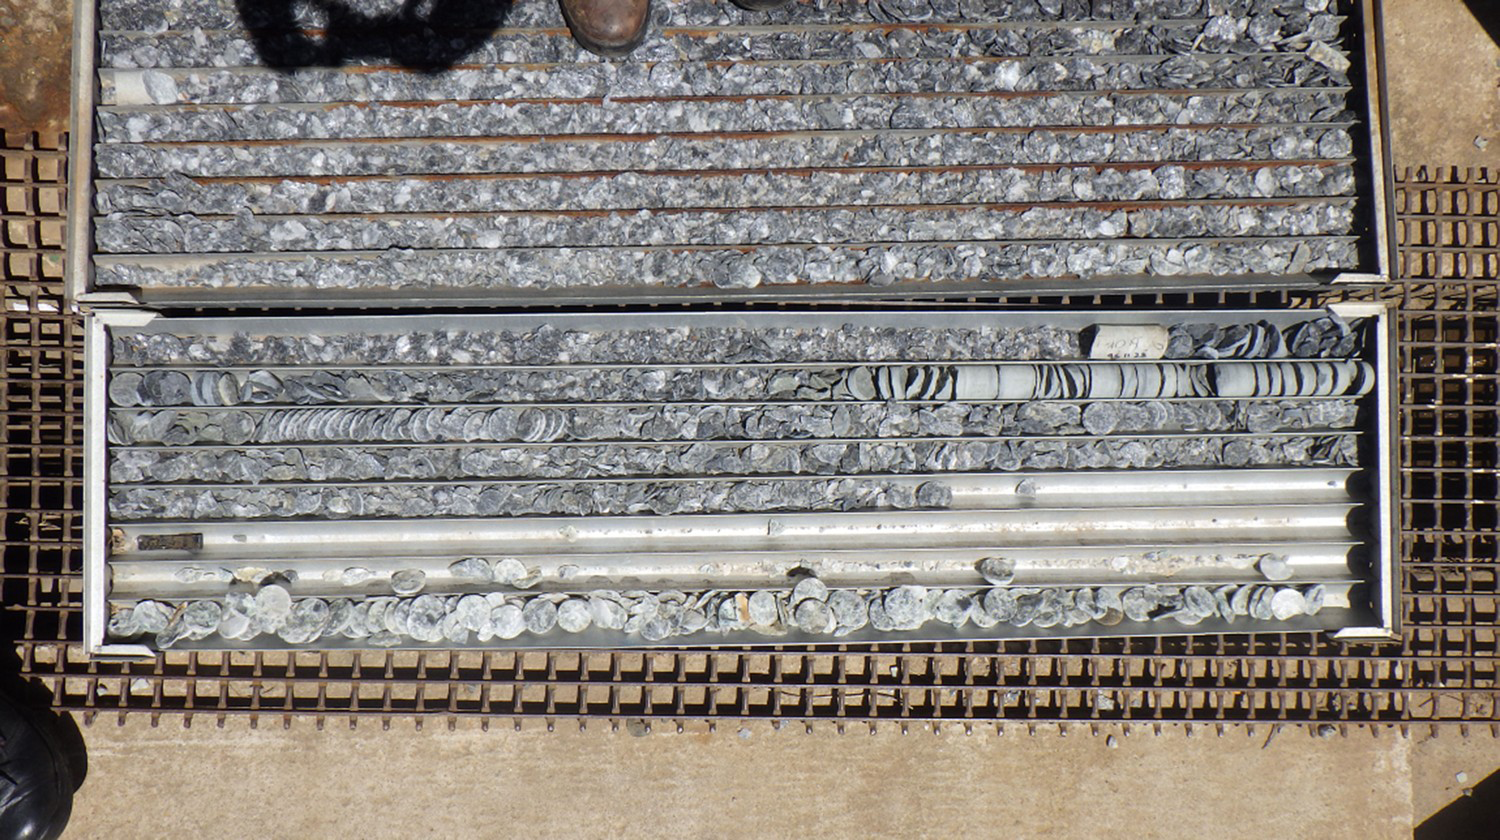
Underground observations
Toper (2002) pointed out that one of the beneficial side effects of preconditioning is an improvement in the ground conditions of the hangingwall. The comparison of ground fracturing on both hangingwall and mining faces as well as sidewalls were compared. The data obtained from the hangingwall assessments show a smoother hangingwall on the mining faces after de-stressing the dyke. Intermediate to minor fracturing on the hangingwall was observed before the implementation of the practice. On the other hand, fracturing in the vicinity of the mining faces was observed to improve with extensive fracturing on the mining faces, especially around the normal preconditioning holes. This extensive fracturing was only observed after de-stressing the dyke, in addition, there was no face burst reported for a period of three months along all the mining faces intersected by the dyke. Before the implementation of the practice, the mining faces were observed to be fractured but several face bursts were reported along the mining faces that intersected the dyke (see Figure 10).
Hangingwall fracturing before and after implementation of long-hole preconditioning hole blast. Images are available in colour online.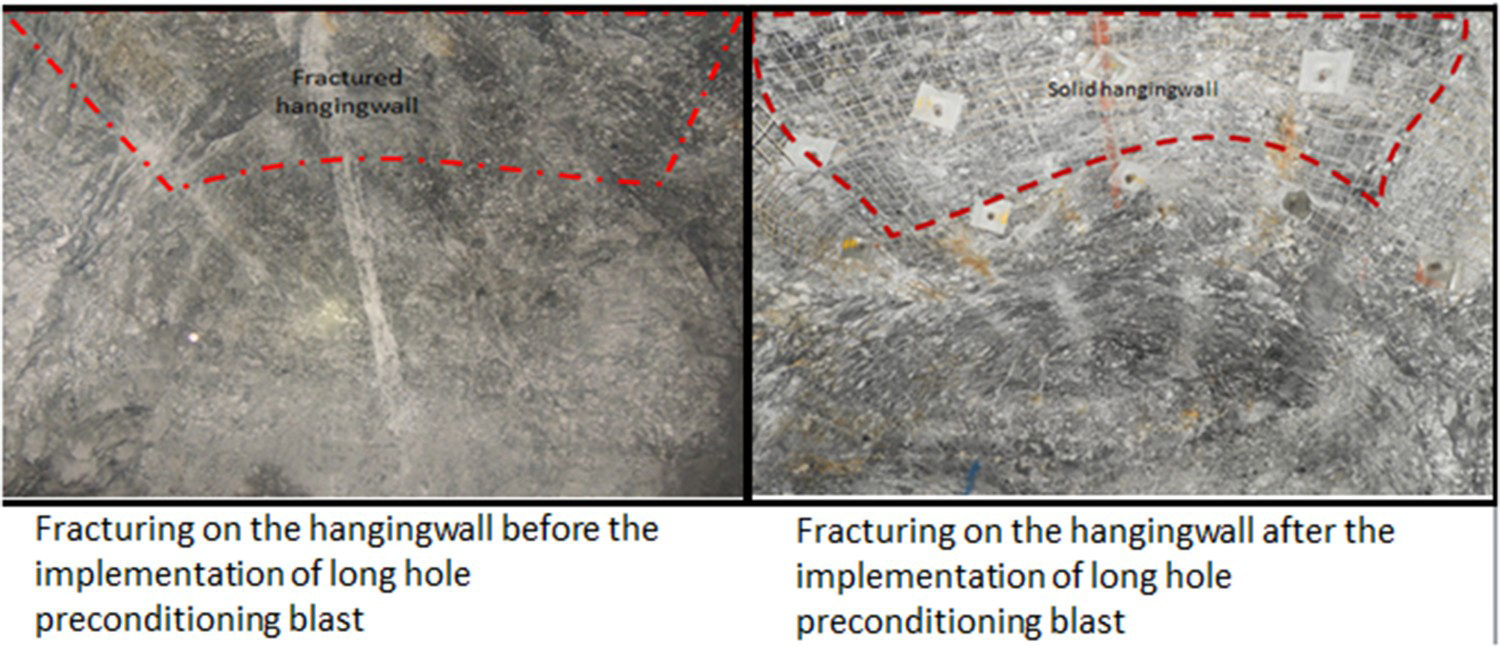
Monitoring instrumentation results
This section outlines detailed results of the microseismicity, borehole camera, Ground Penetration Radar after and before the implementation of the practice.
Seismicity monitoring results
The results of the study were based on the seismic event that took place in the vicinity of the dyke; this was done before preconditioning the dyke and after preconditioning the dykes. As expected the results of the study show a large quantity of seismic events taking place before the long-hole preconditioning blast. However, this was based on the six months of seismic plots along the dyke. Six months after preconditioning the dyke, seismic plots were also conducted and it was noted that the seismicity along the dyke was rapidly reduced and no face bursting reported within the sections (see Figure 11). This method has some benefits, such as solid hangingwalls with minor fractures on the sidewalls. Besides that, the mining faces advanced more rapidly.
Seismic events plotted in the vicinity of the dyke and ahead of the mining faces before and after de-stressing the dyke. Images are available in colour online.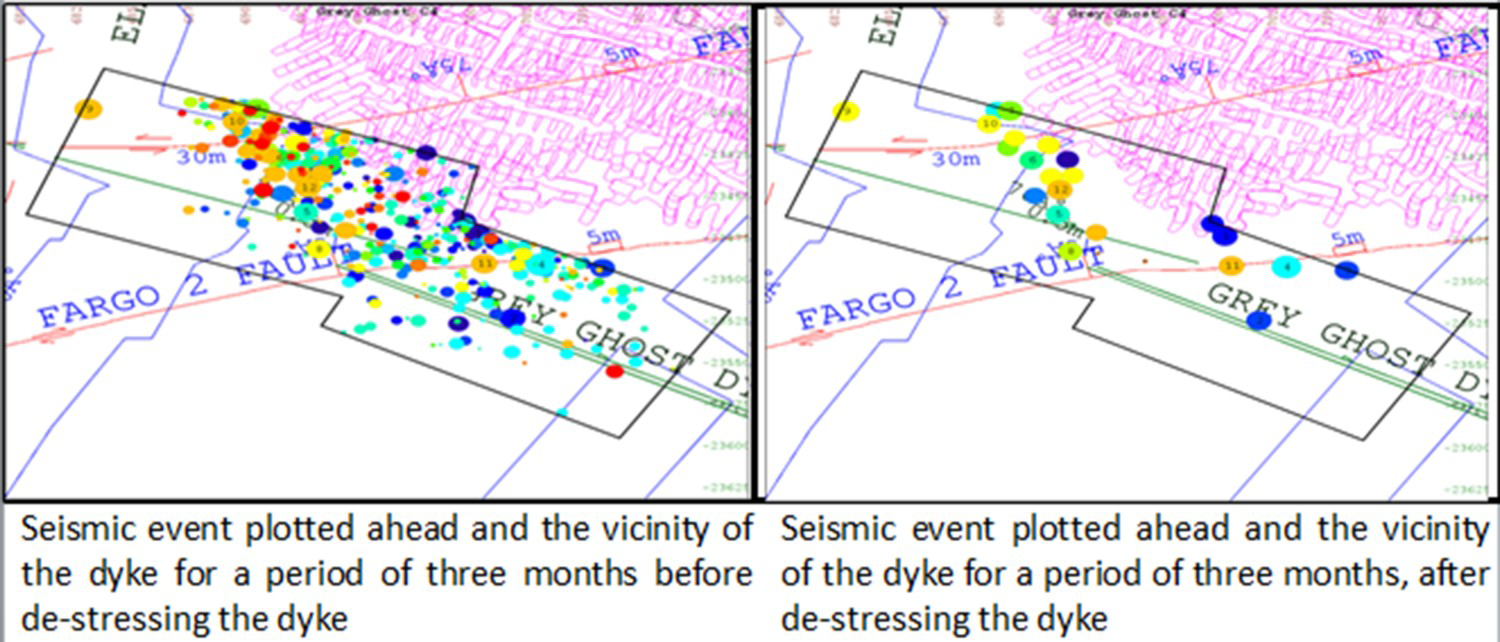
Borehole camera results
The borehole log results show that mining faces in the vicinity of the dyke were only fractured for approximately 1.5 m beyond the mining faces before the implementation of the practice. Previous work has shown that a face with such short depth of fracturing is prone to face bursting. In this study, although some of the faces did not experience face bursting, the majority of the faces were prone to face bursting (Figure 12). Because of this, borehole cameras were also used after the implementation of the practice, the cameras showed that the mining faces in the vicinity of the dyke were extensively fractured; the intensity of fracturing was noted between 0 and 3 m within the mining faces (see Figure 13). Furthermore, results have shown that fracturing was extensive but decreased with increasing depth from the mining face.
Borehole fracture frequency with fewer fractures before the implementation. Borehole fracturing with intensive fracturing after the implementation.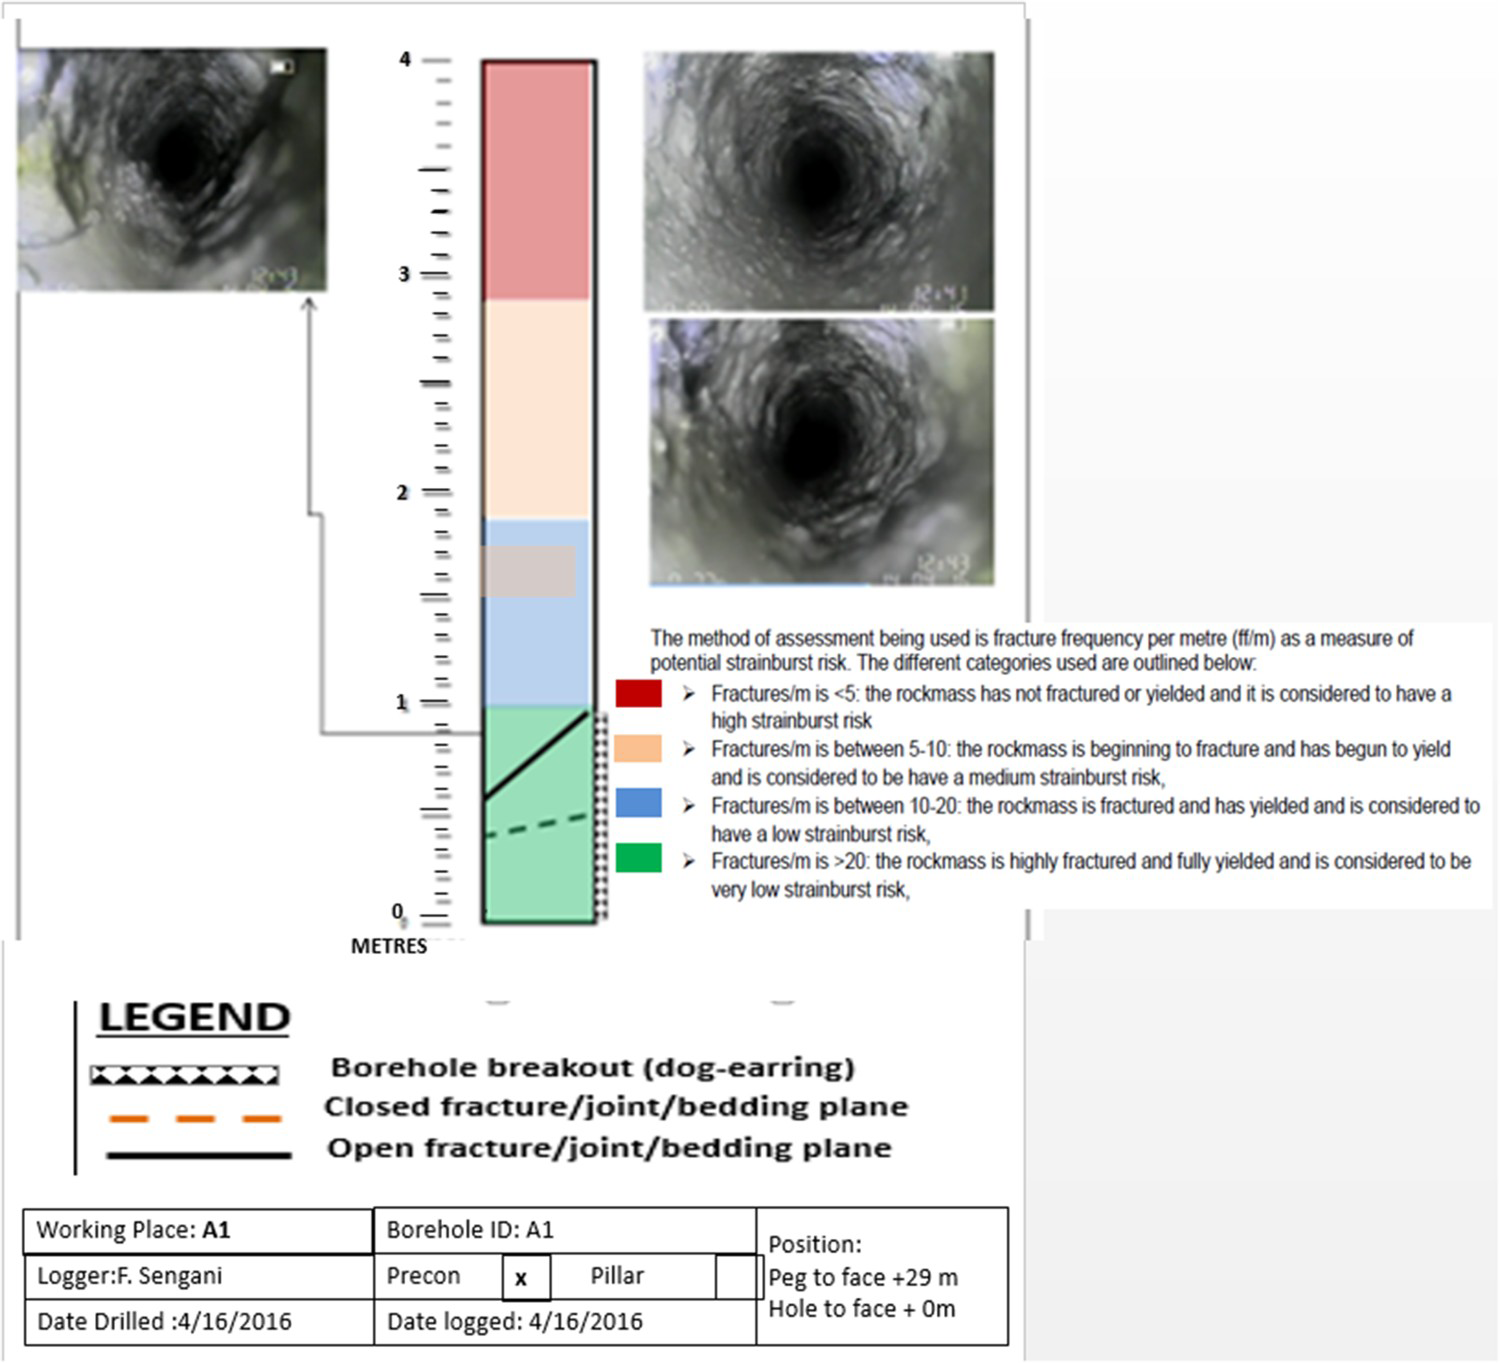
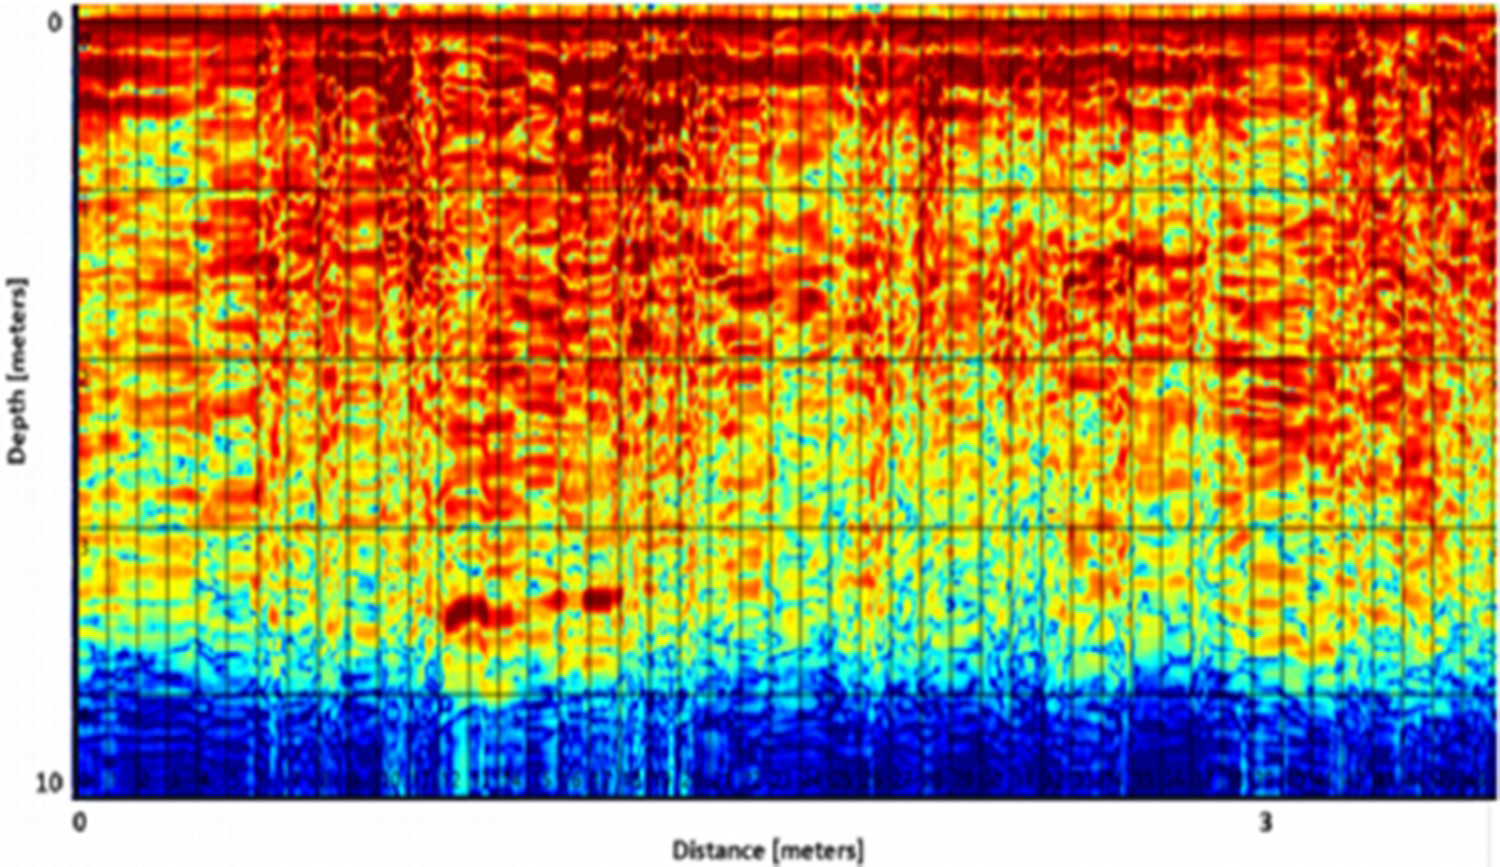
Ground penetration radar results
GPR images before the implementation of long-hole face-perpendicular preconditioning were found to produce weak reflections within 1–3 m ahead of the face. This indicated that there were fewer changes in the material properties and the fewer discontinuities. Underlying that, the rock mass ahead of the face was not properly fractured and is therefore prone to face bursting (see Figure 14). Note that the bright red colour in the GPR image indicates stronger reflections within the material under test. The reflections are caused by discontinuities in the material and a change in material properties. Figure 15 shows the intense bright red colour in the GPR image at greater depths (up to 4 m) than Figure 14. After the implementation, the mining faces were noted to produce a significant difference in the nature of fracturing ahead of preconditioned faces as compared to before the implementation of the practice. This is evident in the GPR images (see Figures 14 and 15). The density of open fractures was also much higher in the implementation of the practice.
Less deep fracturing before the long-hole face-perpendicular preconditioning. Deeper intensive fracturing after the implementation of long-hole face-perpendicular preconditioning.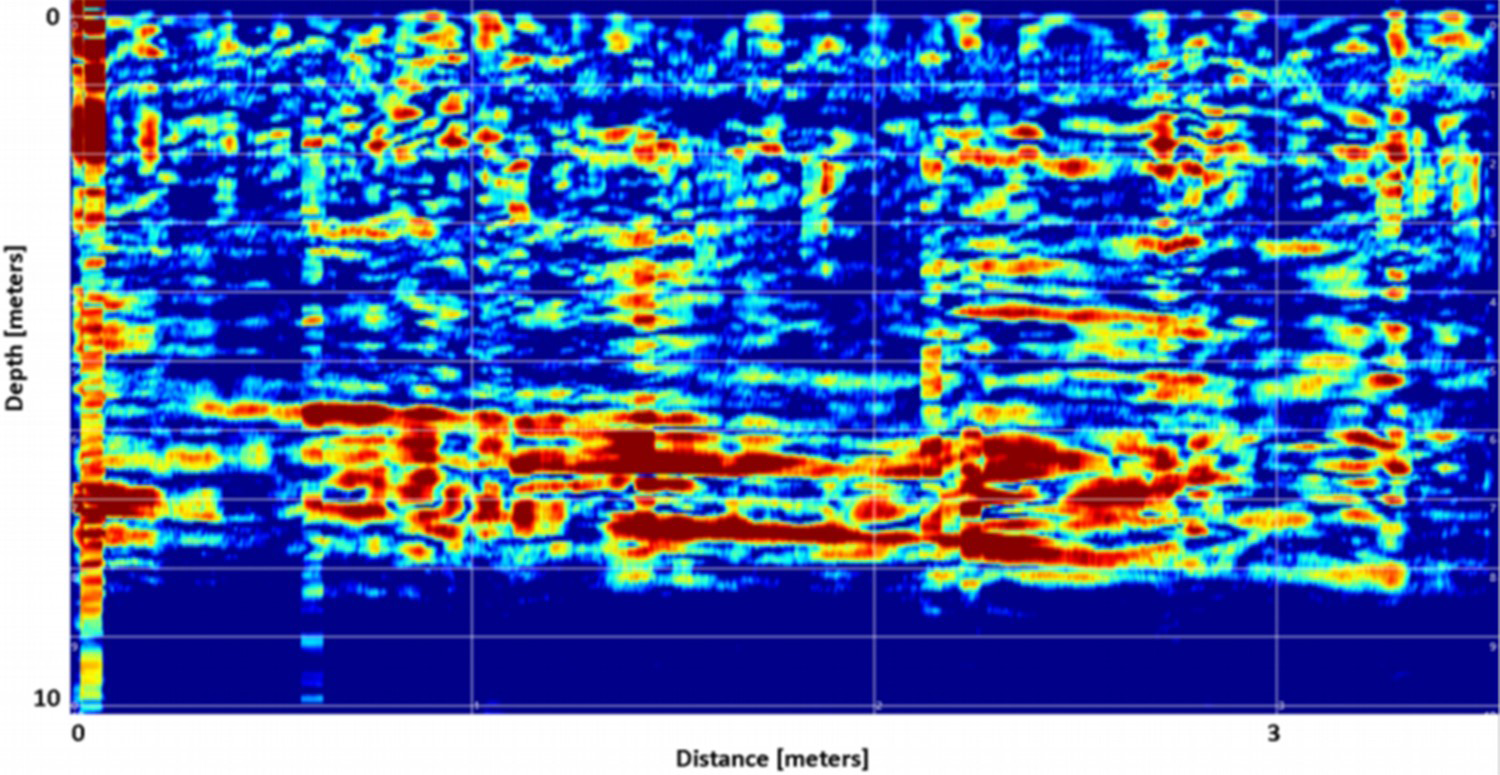
An effective face-perpendicular preconditioning practice has several benefits. It produces deep fracturing away from the face. This transfers stresses away from the production areas and thus reduces face bursting risk. This, in turn, improves the hanging wall and sidewall fracturing (less shallow dipping fractures). It also reduces fracturing of the hanging walls and improves face conditions (i.e. fewer sockets and face shape). The extended fracturing ahead of the face induced by the long-hole face-perpendicular preconditioning practice reduced the seismicity, rockburst incidents, accidents and injuries resulting from rockburst and falls of ground.
Numerical modelling results
This section provides results on the major principal stress ahead of the mining faces using Vantage and Abaqus numerical modelling software, Rate of Energy Release was also simulated using Abaqus and lastly, the ride was simulated using MAP3D to estimate the occurrence of seismic events within the area.
Vantage numerical modelling results
The Vantage software is an elastic model that does not simulate failure. In this study, the Vantage model was used to simulate sigma 1 ahead of the mining faces and in the vicinity of the in-stope pillar. To simulate sigma1 stresses using Vantage software, a 4 m slice/ increment was developed along the depth of mining(from the hangingwall to the footwall of the de-stress cut). A high stress (sigma1) of approximately 200 MPa was observed around all the mining faces. However, the stress levels were also noted to decrease gradually further ahead from the dyke and rapidly decrease moving further away from the dyke. Figure 16 shows the Vantage numerical modelling results, which indicate that the dyke contributes significantly to the increase in the stress level along the mining faces that intersect the dyke. Furthermore, the results show that the dyke was stiff and could cause seismic damage if major interventions were not implemented. Although Vantage numerical modelling is elastic, this model provides better clarity of the estimated behaviour of the structure when ground conditions remain the same, however, further analysis was then undertaken using Abaqus numerical modelling (inelastic).
Stress simulated using Vantage numerical modelling.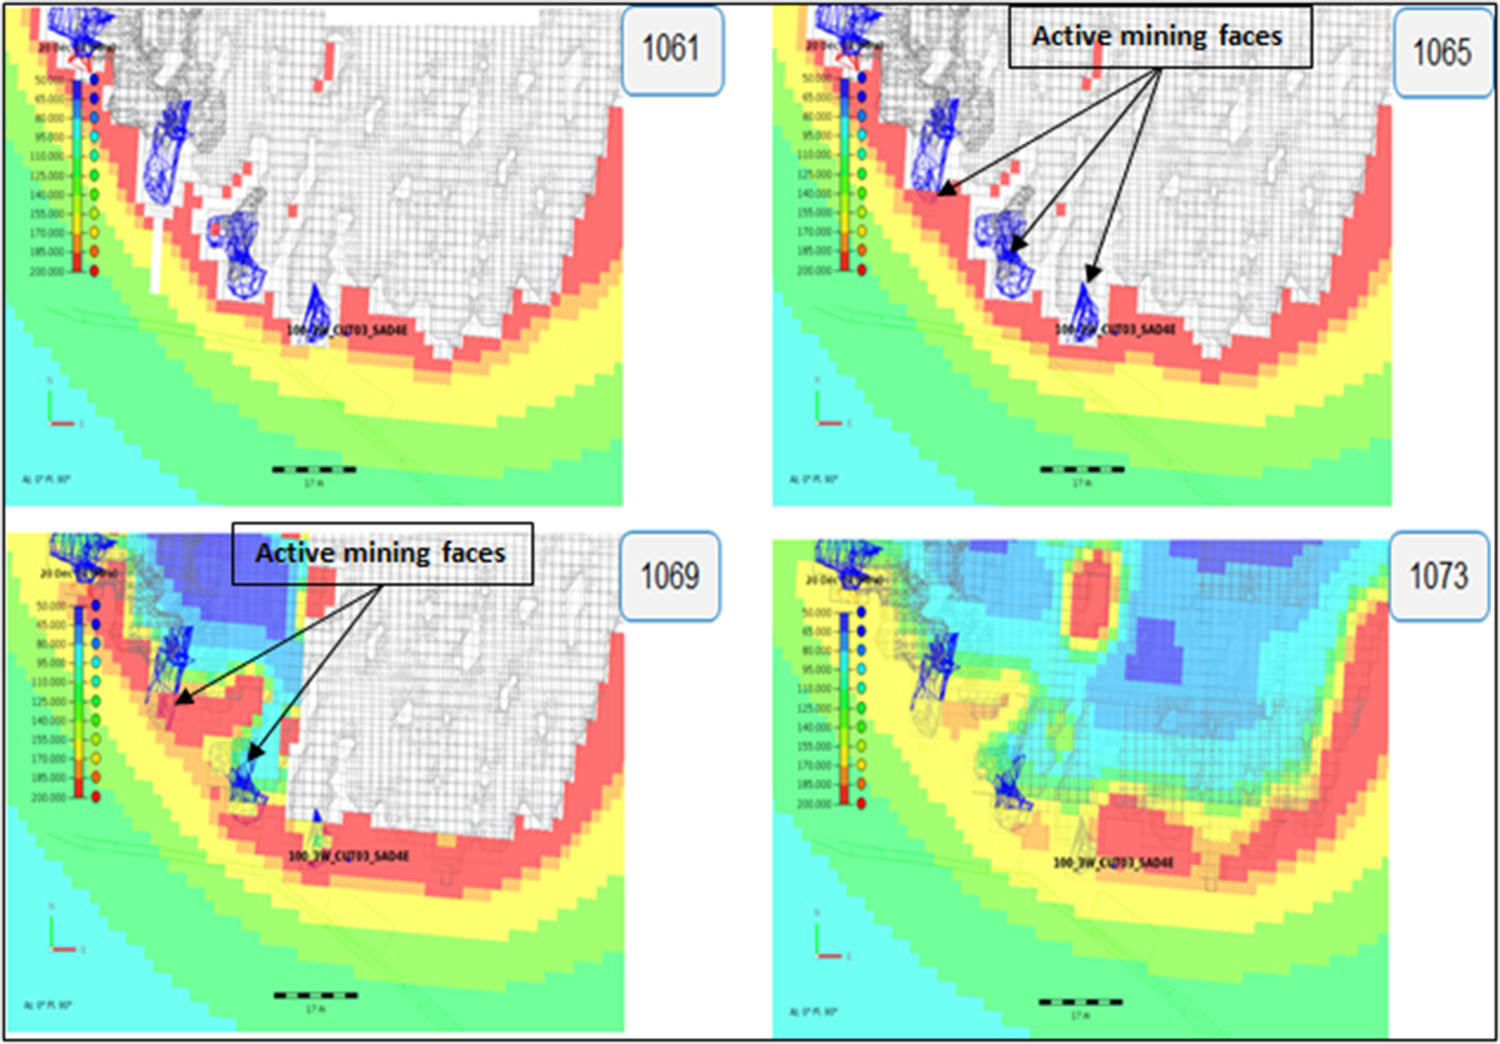
Abaqus numerical modelling results
Detailed analysis of stress concentrations was conducted using Abaqus numerical modelling (inelastic). It should be noted that the disintegration of the dyke was incorporated to assess the stress level after de-stressing the dykes. The results from the model show a gradual decrease in the stress level as mining progresses after the dyke and in the stress concentration in the vicinity of the dyke which were normal after the implementation of the practice. In summary, the model simulation around the dyke shows that the stress level should be less after mining through the dyke. However, the model also shows that the behaviour of the dyke was controlled through the de-stressing technique, which was noted through by comparing the two models (vantage and Abaqus) wherein Vantage simulated the high stresses along the dyke and ahead of the mining faces and Abaqus simulated the normal stress along the dyke and the reduction of stress after mining through the dyke. Figure 17(A–E) illustrates the stress distribution along the dyke through the mining sequences.
(A–E) Stress distribution after de-stressing the dyke.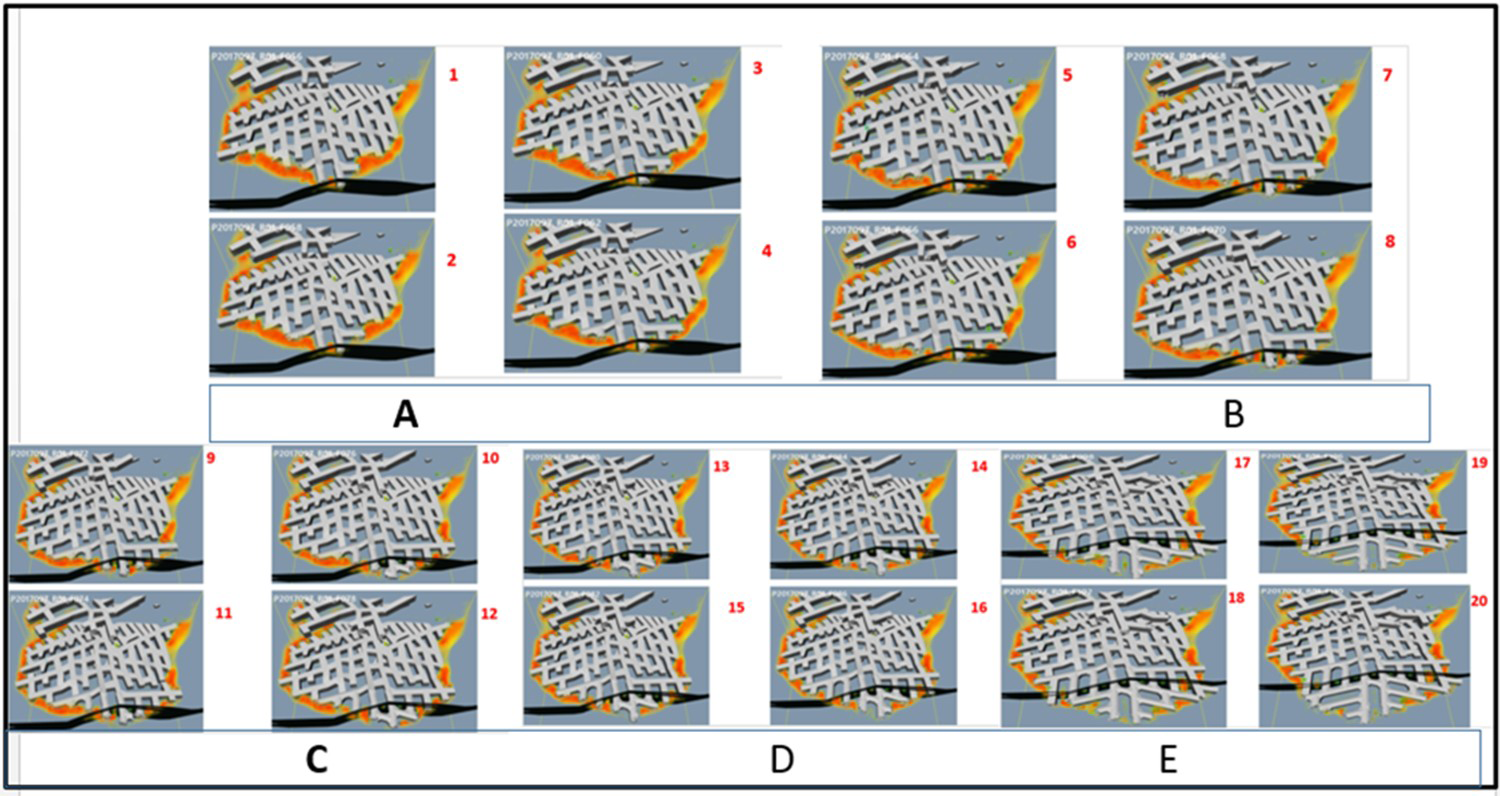
ERR results
The ERR of the mine was simulated using a non-elastic model called Abaqus Explicit. This analysis was conducted three months before the implementation of the techniques for de-stressing the dyke and three months after de-stressing the dyke to compare the ERR of the mine. However, in this analysis, the dark red colour was used to denote high ERR and light grey was used to denote low ERR. Three months before the practice, higher ERR was simulated along the mining faces, regional pillars, and the dyke. Three months after the implementation of the practice, the ERR rate decreased gradually, with low ERR simulated along the regional pillars and scattered high ERR rate in some portions of the dyke as shown in Figure 18. It was then noted that the gradual decrease of ERR was influenced by the implementation of a long-hole preconditioning blast through de-stressing and transferring stress far ahead of the mining faces and in the vicinity of the dyke.
ERR simulated before and after the implementation of long-hole preconditioning blast. Images are available in colour online.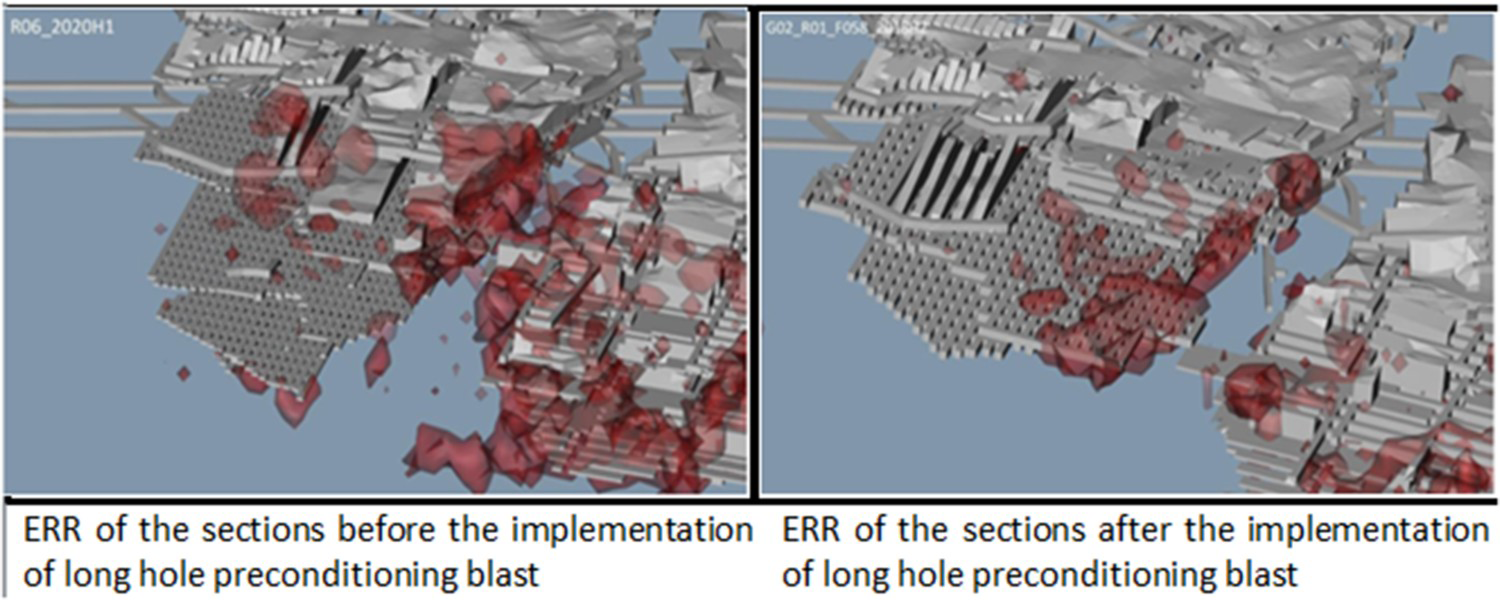
MAP3D results
MAP 3D was used to analyse the ride or displacement that can take place alone the dyke. The purpose of simulating ride was to correlate ride with the probability of a seismic event taking place along the structure. It was assumed that when the ride increases as large seismic event should be expected within that area. Based on the results of the study, the model indicated that during mining step 1, small seismic events were expected to take place in the footwall of the excavation. Furthermore, results have shown that two seismic events can occur on the footwall of the structures. Those events were expected to occur at the contact between the footwall of the excavations and the dyke with large events far from the contact. Figure 19 shows the ride distribution during step 1 of mining.
Ride distribution in mining step 1 for the dyke. Images are available in colour online.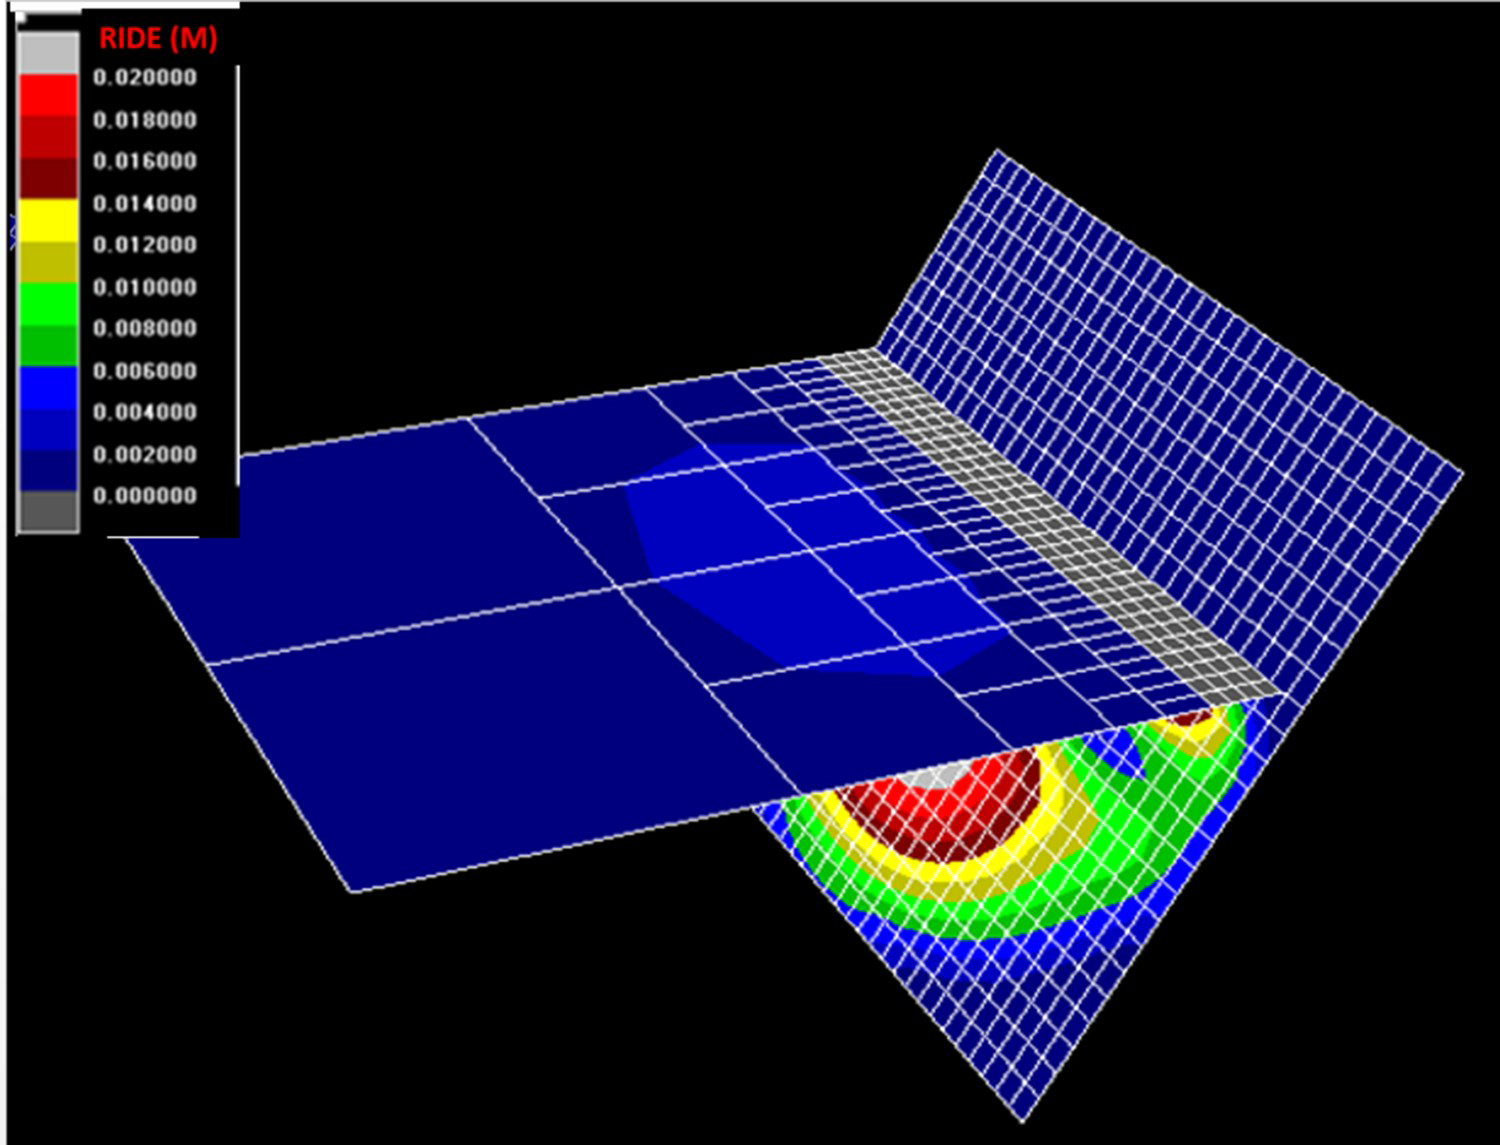
The second step of mining shows that large and small seismic events occur on the footwall of the excavation with very small seismic events taking place on the hangingwall of the excavations. Similarly, the ride was noted to increase on the footwall of the structure and gradually appear on the hangingwall of the excavation (see Figure 20).
Ride distribution in mining step 2 for the dyke. Images are available in colour online.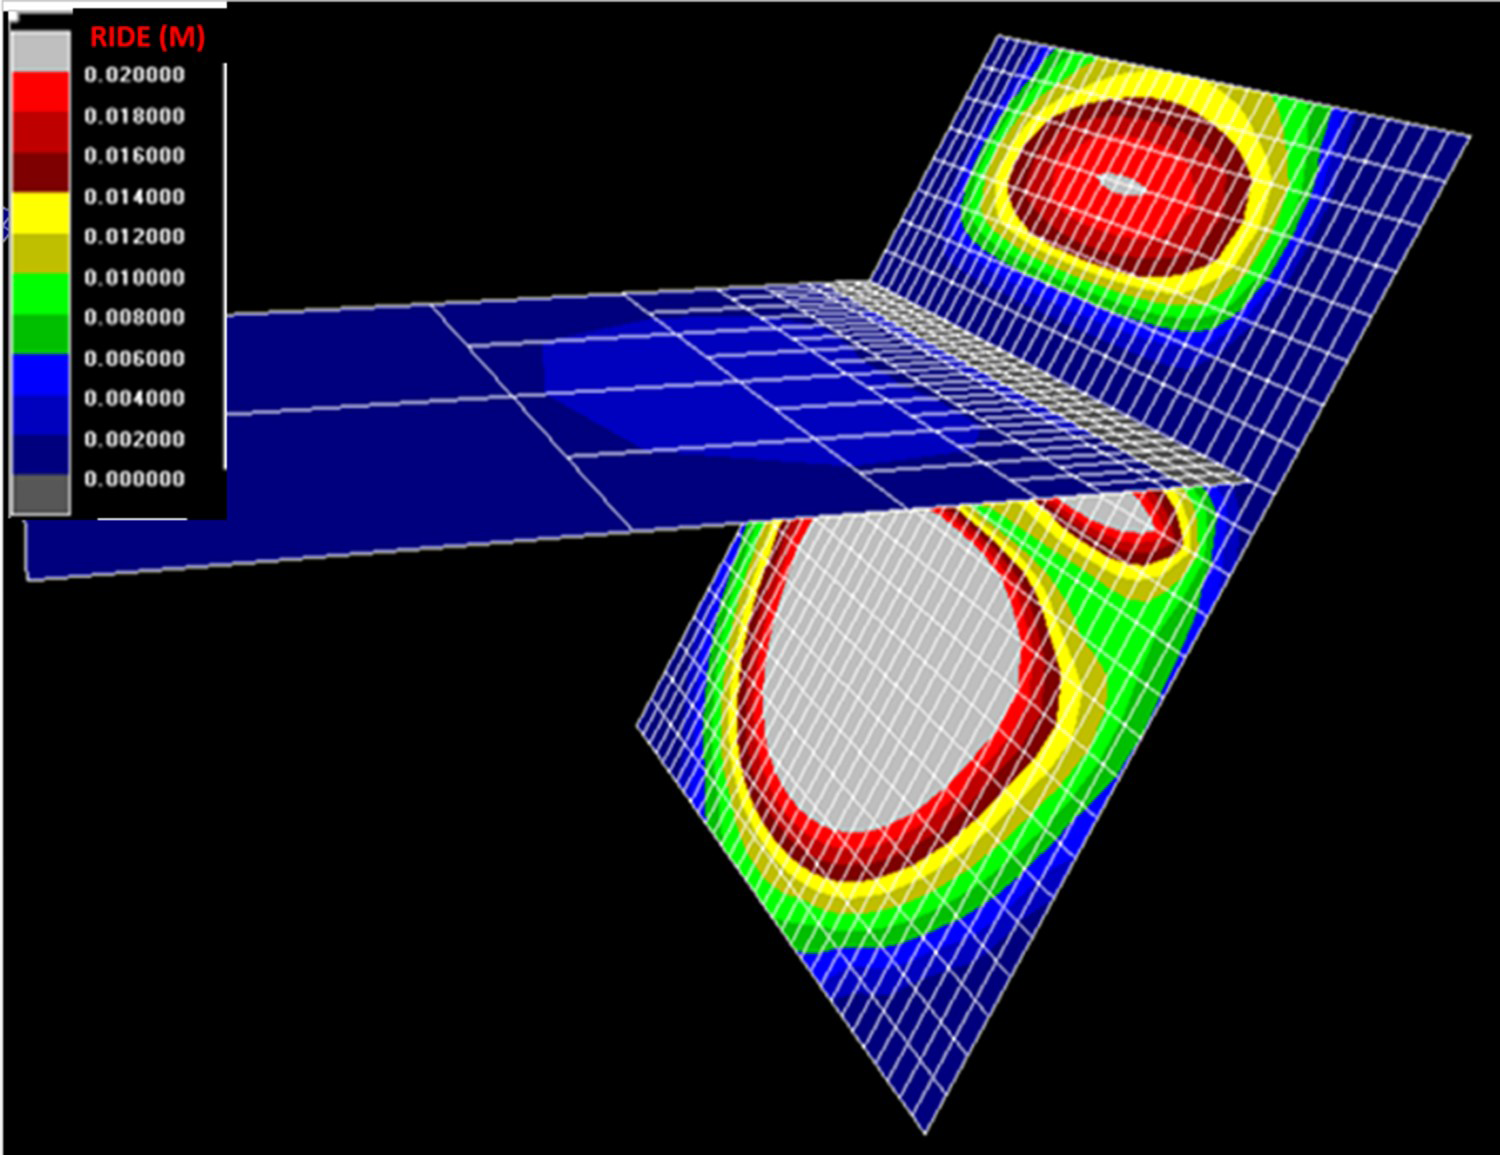
Further analysis during the third mining step has shown that the ride increased in both footwall and hangingwall of the excavation with the large seismic event expected on both sides. This is an indication that in this mining step the probability of the fault to slip was very high. On the other hand, ground closure can also take place rapidly if excavation stability strategies are not implemented. Figure 21 shows the increase in ride in both footwall and hangingwall.
Ride distribution in mining step 3 at the dyke. Images are available in colour online.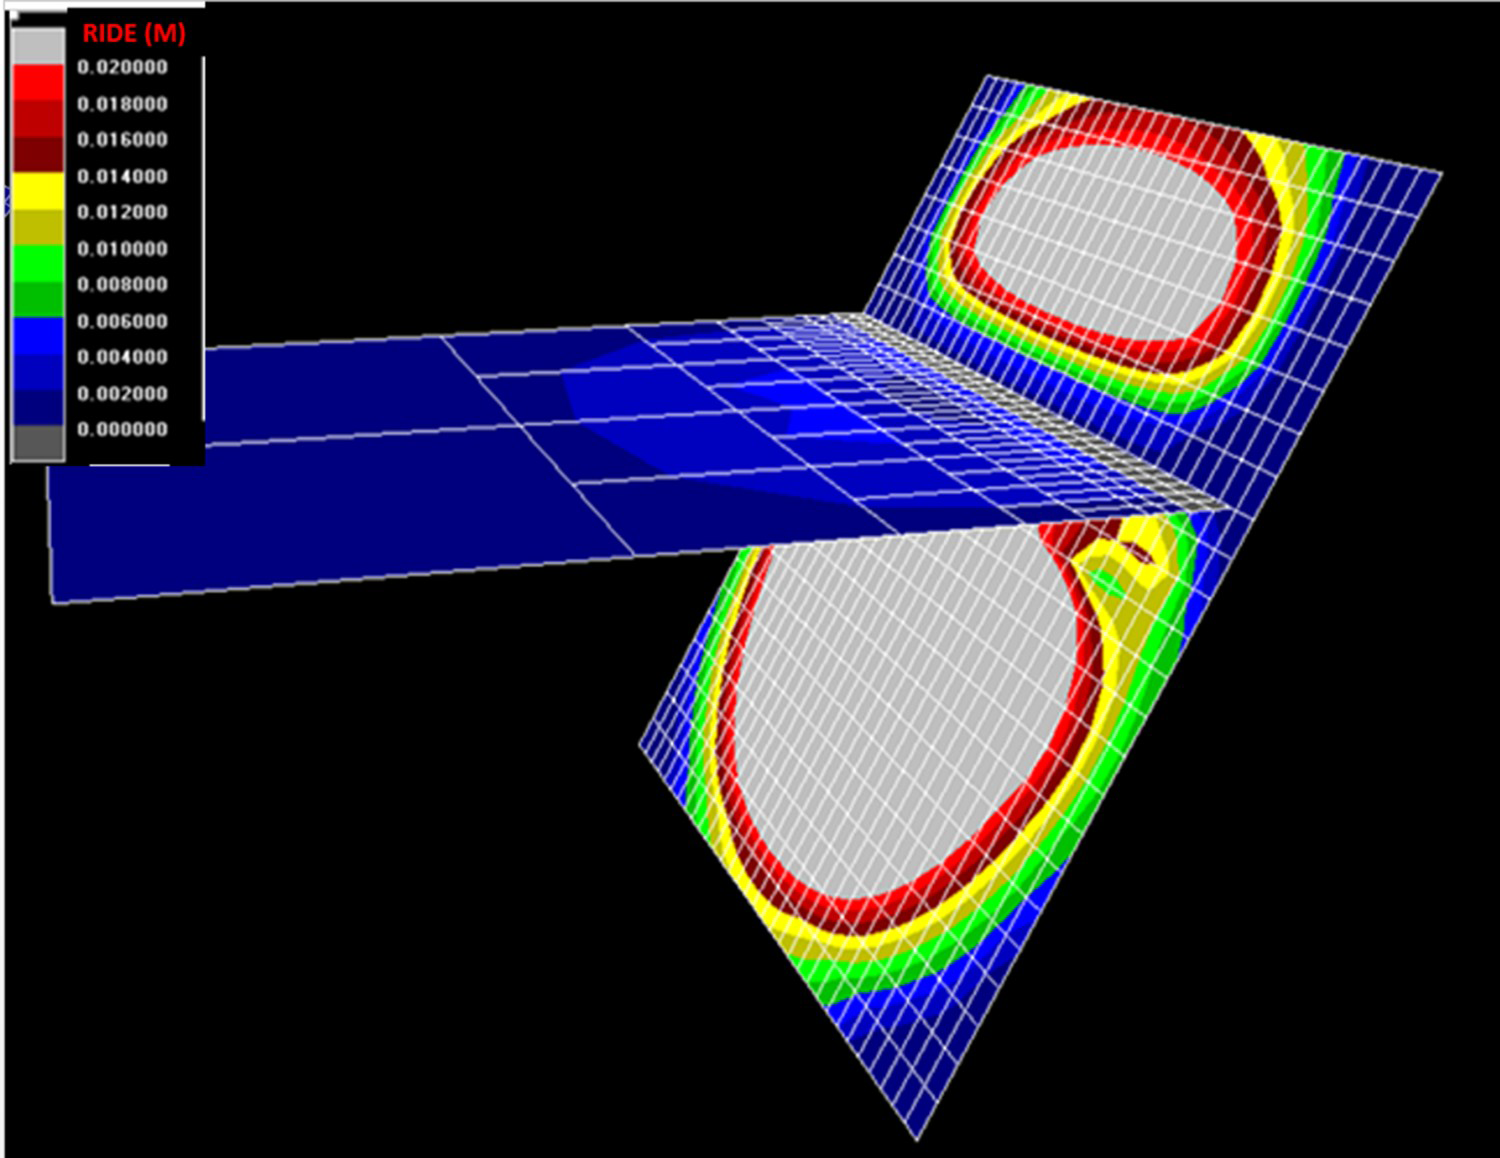
Based on the results obtained from the model, it was noted that during mining step four, ride was introduced within the previous mining areas. This was an indication of ground closure simulated at the back area due to deterioration and ground movement as well as seismically active geological structures within the vicinity of the excavations. Figure 22 shows mining step 4.
Ride distribution in mining step 4 after the dyke. Images are available in colour online.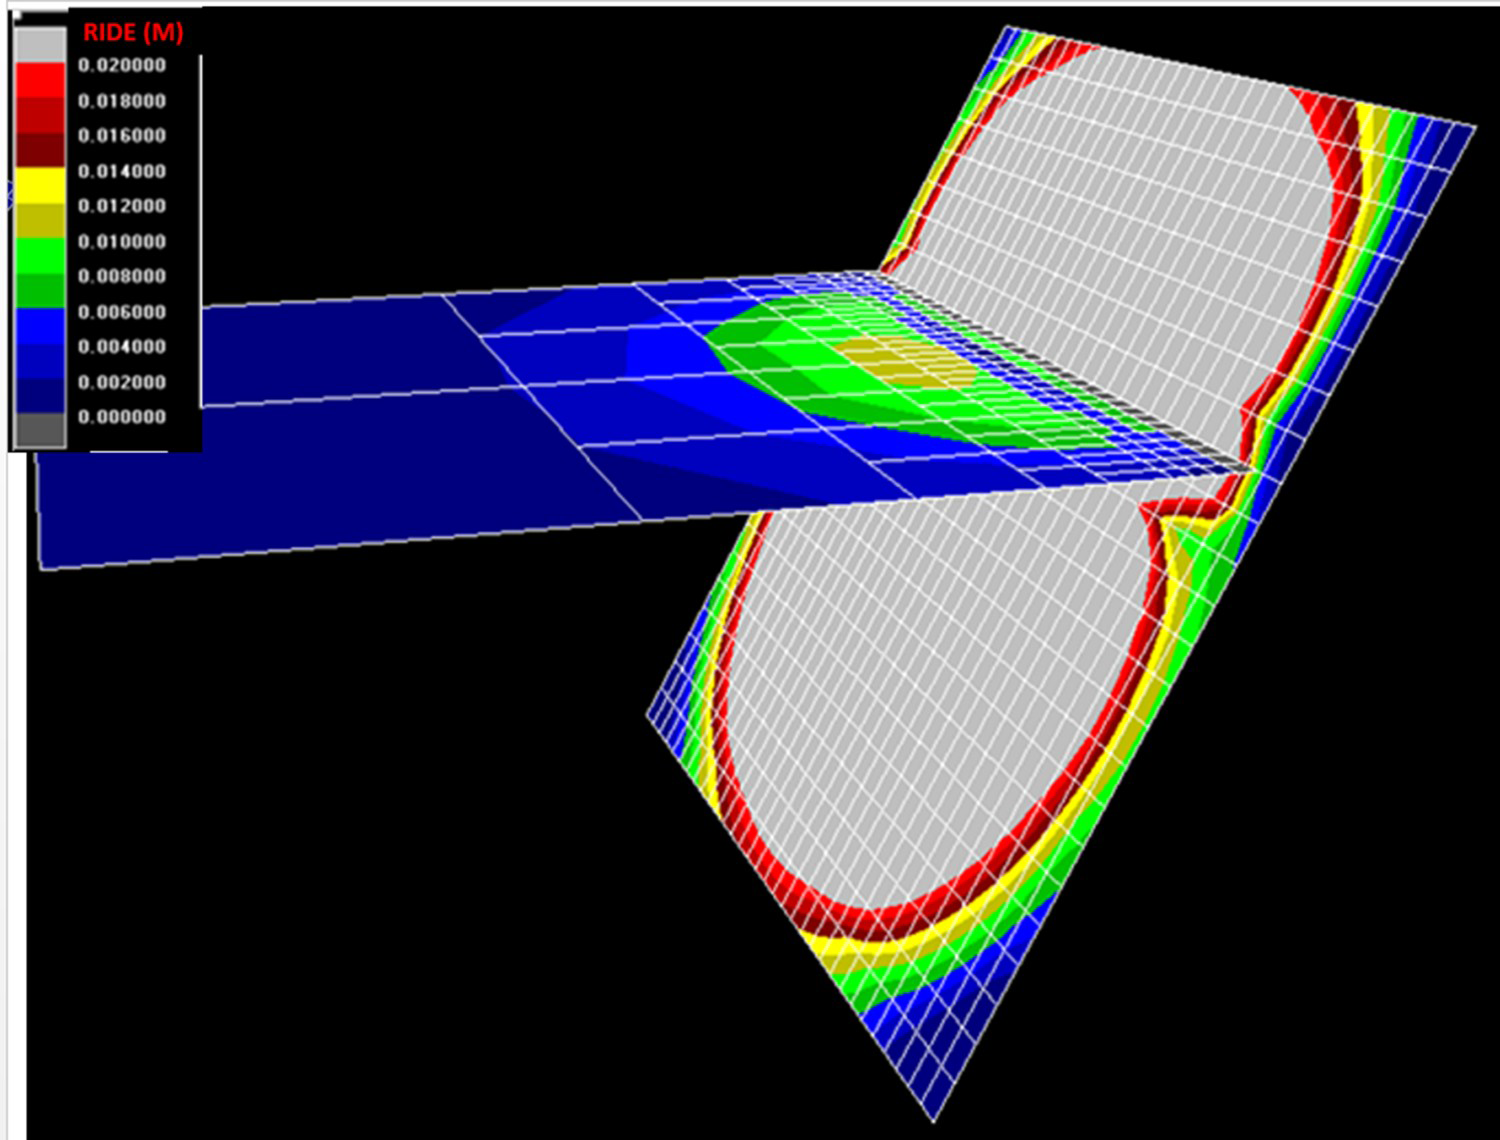
The final stage of mining after passing through the fault showed a ride of about 0.0200 m to take place along the structure in both hangingwall and sidewall. The ground movement was also noted along the previously mined out excavation. It was then concluded that strategic preconditioning should be implemented in order to mine through the dyke without experiencing difficulties (fractured hangingwall, multiple seismic events, faceburst and pillar burst) (see Figure 23).
Ride distribution in mining step 5 after the dyke. Images are available in colour online.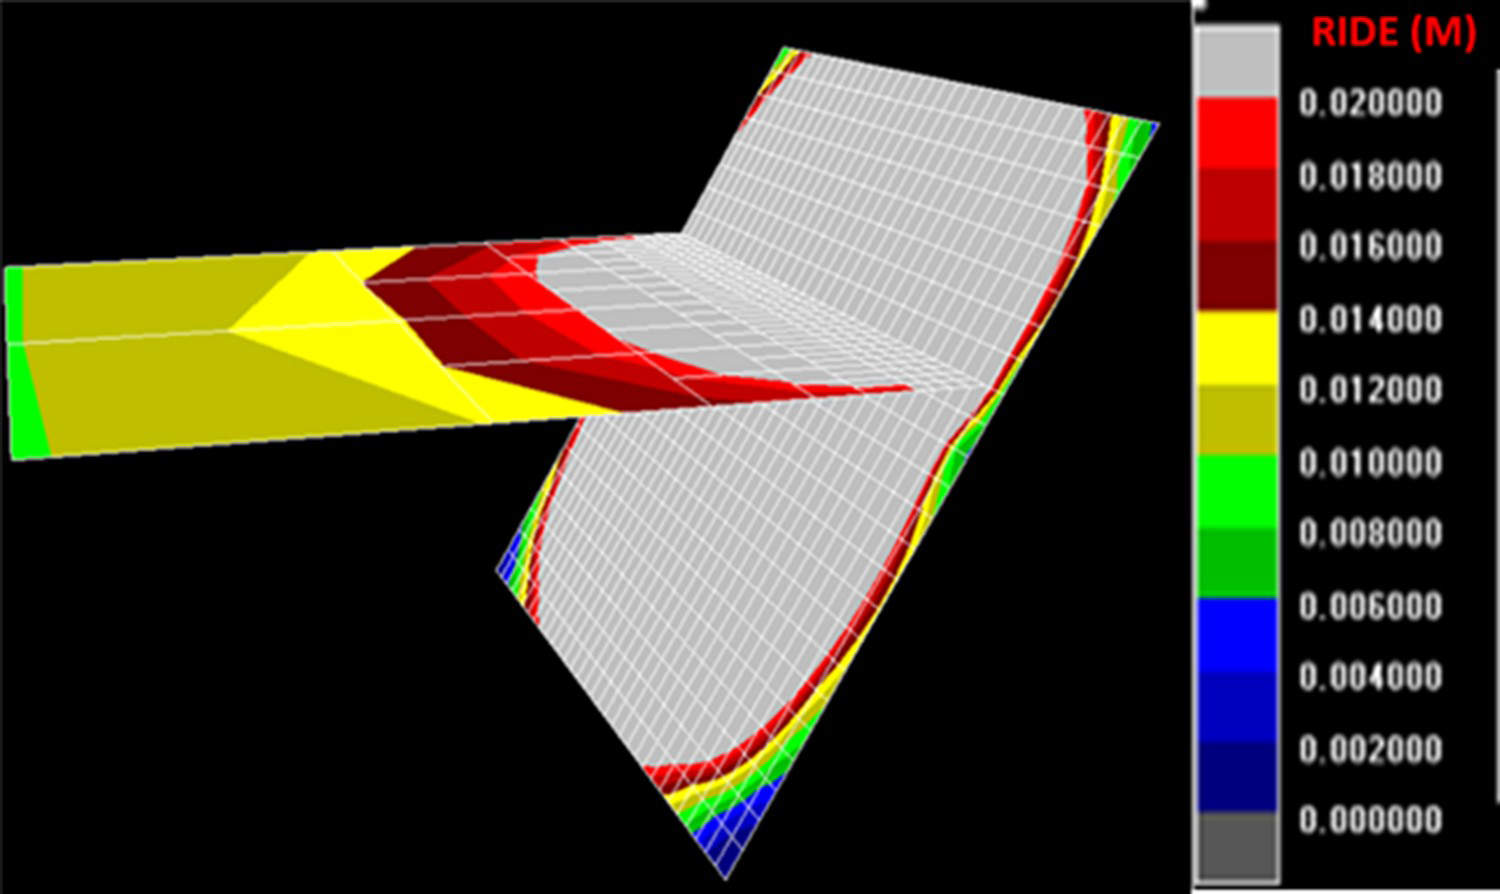
Conclusions
After detailed research on the impact of de-stressing the Grey Ghost dyke using a long-hole preconditioning blast, it was concluded that the practice of de-stressing the dyke was successful. This was validated by the improvement in the hangingwall fracturing, sidewall fracturing and extensive fracturing on the mining faces. As a result, seismic events plotted ahead of the mining faces and in the vicinity of the dyke have shown a gradual decrease in recorded events along the dyke and ahead of the mining faces. Furthermore, analysis has shown that the ERR along the sections gradually decreases after de-stressing the dyke. The major principal stress along the dyke was also noted to reduce as mining progressed. However, further analysis using MAP3D has shown that large seismic events were expected to take place during mining step five; in reality, those large seismic events were not encountered due to the implementation of the preconditioning practice. It can be concluded that the use of long-hole preconditioning blasts successively de-stresses seismically active geological structures.
Footnotes
Acknowledgements
The authors acknowledge the support provided by the mine and the University of Venda. This paper forms part of the MSc thesis of the first author and further research on this topic will be conducted during the PhD candidature of the first author. This work was sponsored and supported by South Deep goldfields mine.
The authors and mine acknowledge the extensive modelling and rock strength tests performed by the following consulting companies, Dr. Charles Lily from BECK Engineering (Australia) conducted the Abaqus modelling in this project, the Institute of Mine seismology conducted the Vantage modelling and lastly Dr. Chen from Rocklab conducted the extensive rock strength analysis of the dyke samples. The analysis of the modelling and rock tests were performed by the authors. The first author is employed at South Deep gold fields mine in the Rock Engineering Department and is responsible of projects and research at the mine.
It is our great pleasure to acknowledge the support and dedication provided by the Rock Engineering Department, all technical services departments as well as the mining team.
Disclosure statement
No potential conflict of interest was reported by the authors.