
Abstract
Several of the world's largest open-pit mines are expected to consider making a transition to underground mining because of the opportunity to access an increased amount of reserves and extend a mine's life. A case study exploring the optimal transition depth from open pit to underground mining at AngloGold Ashanti's Geita gold mine in Tanzania is presented herein. The approach considered assesses the problem by evaluating the profits of a set of candidate transition depths, which have been identified by the mining operation as viable opportunities. An accurate valuation for each candidate's transition depth is derived by producing yearly mine plans based on uncertainty, which outline expected yearly cash flows. Compared with the conventional deterministic approach, the results of this study show a 23% net present value increase for the stochastic mine plans, as well as an improved production performance and the ability to meet mill requirements throughout the life-of-mine.
Keywords
Introduction
The Geita gold mine is a large gold mining complex located in northern Tanzania. The mine is completely owned and operated by AngloGold Ashanti. The mining complex is comprised of six operating open pits that feed a carbon-in-leach processing plant and produces roughly 500,000 ounces of gold per year. Initial mine plans show a concerning deficit in ore production below the mill's capacity in a few years. To supplement this deficit and to keep the mill operating at full capacity, a transition to underground mining is being reconsidered to provide additional ore. An approach that relies on stochastic mine planning techniques is applied to evaluate the decision to go underground at the Nyangkanga pit within the Geita gold mining complex.
The motivation for considering the transition to underground mining includes gaining access to a large supply of reserves and subsequently extending a mine's life. As well, existing production facilities can be utilized during underground production. The task of determining an optimal transition depth from open pit to underground mining incorporates several aspects of mine planning that are combined to address the decision. Extensive work has been done on long-term mine planning for open pit and underground mines separately (Hustrulid and Bullock 2001; Hartman and Mutmansky 2002; Osanloo et al. 2008; Newman et al. 2010; Dimitrakopoulos 2011; Little et al. 2011; Hustrulid et al. 2013; Asad et al. 2016; Erdogan et al. 2017; Nhleko et al. 2018; Sotoudeh et al. 2020) however, to date, the work on the transition problem has been limited. Recent efforts have been aimed at incorporating the decision to transition from open pit to underground into an optimization framework (Bakhtavar et al. 2009; Roberts et al. 2009; Newman et al. 2013; Chung et al. 2015; Chung, Topal and Azad 2016; Chung, Topal and Ghosh 2016; Whittle et al. 2016, 2018; Ben-Awuah et al. 2016; King et al. 2017; Dagdelen and Traore 2018; Afum and Ben-Awuah 2021). Work by Dagdelen and Traore (2018) attempts to determine the optimal transition depth for an open-pit mine currently operating in the context of a mining complex, which contains several other mines and processors. The authors test the financial viability of a number of transition scenarios by iteratively increasing the size of the open pit resource until they have identified a maximum value. Carli and Peroni (2013) present a similar approach to Dagdelen and Traore (2018) by considering five separate candidate transition depths based on pit shells produced using price factors that range from 60 to 100%. The authors report a 9% increase in NPV for making the optimal transition when compared to mining through solely open pit. Newman et al. (2013) decompose the problem using a network flow formulation, where each possible extraction sequence is represented as an arc in the flow. The method is limited as it provides a solution that is restricted to two dimensions and is not operationally implementable. King et al. (2017) combine formulations for open-pit and underground mine production scheduling into a single optimization model and propose decision variables related to possible elevations for crown pillar locations. A major limitation of the approach is that the open pit operation is massively aggregated into bench-wise panels within predesigned pushbacks. The underlying assumption of the homogeneous mining of panels misrepresents the selectivity of open-pit mining. Whittle et al. (2018) extend the so-called opportunity cost approach for determining the open pit to underground mining transition. In this method, the economic value of a block considered for underground mining is treated as negative weight, and directed graphs are added to model the opportunity costs and crown pillar requirements. Finally, given this modified graph, a conventional open-pit maximum closure algorithm is used to solve the problem. The main drawback of opportunity cost approaches is that the time value of money is neglected, while the transition depth is not determined by the production scheduling process. The recent review of open pit to underground mining transition methods by Afum and Ben-Awuah (2021) provides additional information on related approaches.
Each of the mentioned works fail to consider geological uncertainty throughout the planning process, which has been extensively demonstrated to have a large impact on a mine's profitability (Ravenscroft 1992; Dowd 1994, 1997; Vallée 2000; Dimitrakopoulos et al. 2002; Godoy 2003; Myers et al. 2007; Tavchandjian et al. 2007; Dimitrakopoulos and Grieco 2009; Jewbali et al. 2015; Rendu 2017). Geological uncertainty can be effectively integrated into the planning process through the use of several stochastically simulated orebody models (Ramazan and Dimitrakopoulos 2005, 2013; Grieco and Dimitrakopoulos 2007; Carpentier et al. 2016; Goodfellow and Dimitrakopoulos 2016; Montiel and Dimitrakopoulos 2018; Sepúlveda et al. 2018; Villalba Matamoros and Kumral 2018; Mai et al. 2019; Huang et al. 2020; Paithankar et al. 2020; Furtado e Fariaet al. 2021; Nesbitt et al. 2021). A set of orebody simulations encapsulates the inherent variability within the grades of the deposit (Goovaerts 1997; Remy et al. 2009; Rossi and Deutsch 2014; Gómez-Hernández and Srivastava 2021; Minniakhmetov and Dimitrakopoulos, 2022). Developed geostatistical algorithms, such as the single normal equation simulation or SNESIM (Strebelle 2002) and direct-block simulation or DBSIM (Godoy 2003; Boucher and Dimitrakopoulos 2009), can be used to efficiently simulate lithologies (categorical attributes) and mineral content (continuous attributes). Some initial attempts to integrate the grade uncertainty into the open pit to underground mining transition decision-making have been made (Opoku and Musingwini 2013; Bakhtavar et al. 2017). However, the proposed approaches do not consist of stochastic optimization models, thus the management of the related uncertainty and variability is limited.
A real case study at the Geita gold mine (Nyangkanga pit) is detailed herein, where the method described in MacNeil and Dimitrakopoulos (2017) is used to determine the optimal open pit to underground mining transition given the specific requirements of this operation. The case study begins with identifying a number of viable candidate transition depths where the switch can be made from open pit to underground mining. Subsequently, stochastic production schedules dictating the yearly extraction for each of the open pit and underground portions of a deposit are then produced for each candidate transition depth. These stochastic schedules provide an accurate projection of yearly cash flows under uncertainty, by utilizing a resource model that is comprised of several equally probable geostatistical simulations. The summation of the underground and open-pit mine's NPV results in the NPV of the act of transitioning at a given candidate transition depth. The most profitable of all depths considered is deemed optimal. This approach improves upon previous works by jointly describing the optimal transition depth in three dimensions, while predicting cash flows with optimized schedules and incorporating geological uncertainty into the decision-making framework. In the next sections, the approach used is first outlined; then, the case study at the Geita gold mine is detailed. Conclusions follow.
Method
Quantifying geological uncertainty
Before the scheduling process commences, orebody simulations are produced to quantify geological uncertainty. These simulations encapsulate the inherent variability within the orebody, which allows for an accurate valuation along with a quantitative description of the level of technical risk associated with a certain deposit. Simulations can be created for continuous or categorical attributes. Three separate types of simulations are produced for this case study: lithology simulations, open-pit gold grade simulations, and underground stope gold grade simulations. The lithologies are represented as categorical attributes during the simulation process, while grades are continuous.
Lithologies are first simulated by using an implementation of SNESIM (Strebelle 2002) within SGeMS (Remy et al. 2009). Three different lithologies were simulated: Banded Iron Formation, Diorites, and Feldspars. Figure 1 shows a strong visual reproduction of the drill hole data in a simulation. Further validation of the simulations through comparing indicator variograms from these simulations to that of the original drill hole data was also completed.
Visual reproduction of lithology simulations. Images are available in colour online.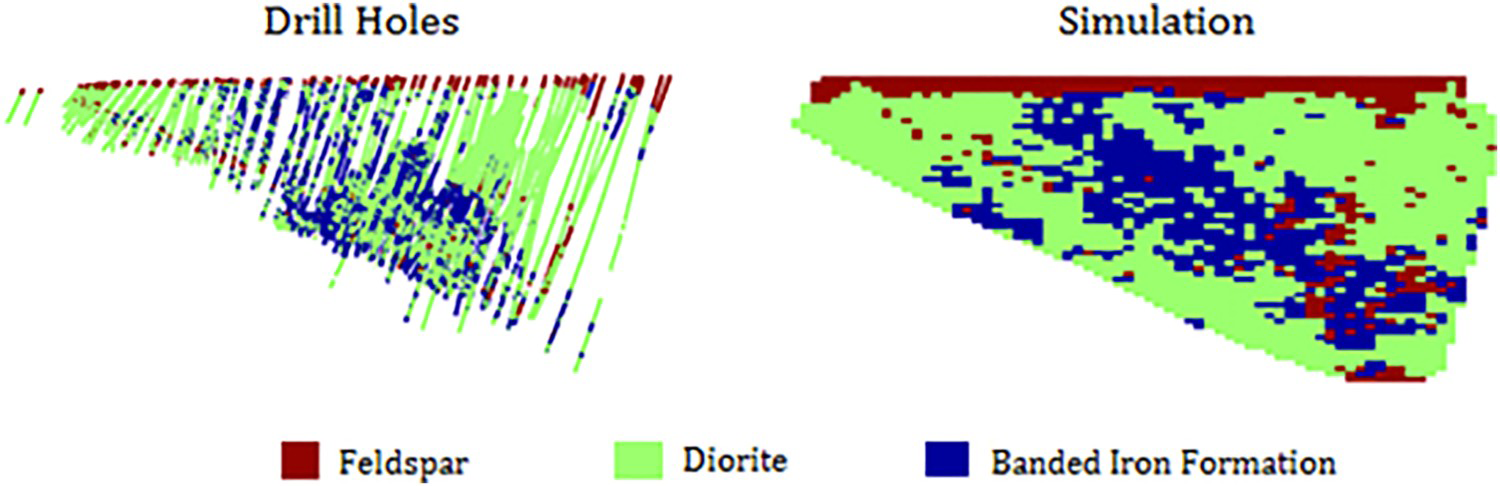
Once these lithological boundaries have been simulated, gold grade can be separately simulated within each lithological domain. In Figure 2, the different simulated portions of the orebody for each lithology can be seen. These gold grade simulations were produced using direct-block simulation (Godoy 2003). Variograms produced from the simulations showed a strong reproduction of the original drill hole data.
Simulating gold grades within separate lithologies. Images are available in colour online.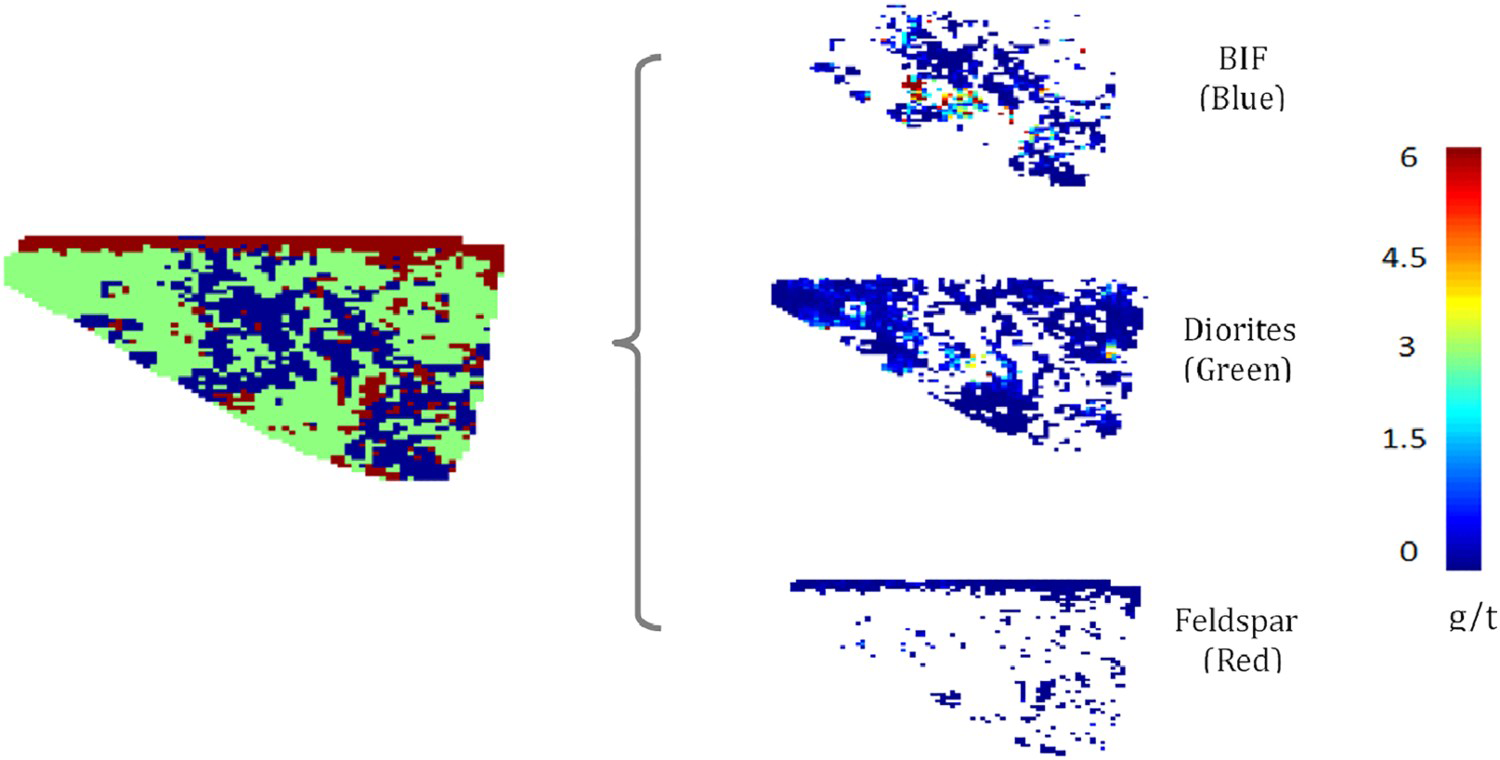
Stope simulations are created by filtering gold grade simulations on point support into the volume of each stope using Datamine Studio 3. Once points have been grouped together for each stope and across each simulation, the average is taken. This provides a series of simulated values for each stope.
Candidate transition depths
To decompose this large problem, the solution space is broken down into a finite number of scenarios where the mine will be able to make the transition. It is important to describe these transition situations in three dimensions, so they can be easily understood and implemented at the mine site. Therefore, transition depths are described through three components: a feasible ultimate pit contour, the extent of underground orebody, and crown pillar location, as shown in Figure 3. In order to produce a practical, implementable result for this type of problem, a thorough geotechnical investigation is required; however, for the following case study, the dimensions and location of the crown pillar are assumed to be known for each of the candidate transition depths evaluated. It is assumed that the dimension of the crown pillar is constant while the location varies. As well, the size of the ultimate pit contour impacts the amount of underground resources that are able to be accessed. As the size of the ultimate pit contour grows and OP mining continues toward deeper depths, the crown pillar is subsequently shifted deeper into the deposit. This results in the underground resource will be accessed more at depth as the upper zones may be not mineable due to the crown pillar's new location. This trend is seen throughout the case study as the material mined through OP and UG methods are inversely related.
Layout of a candidate transition depth.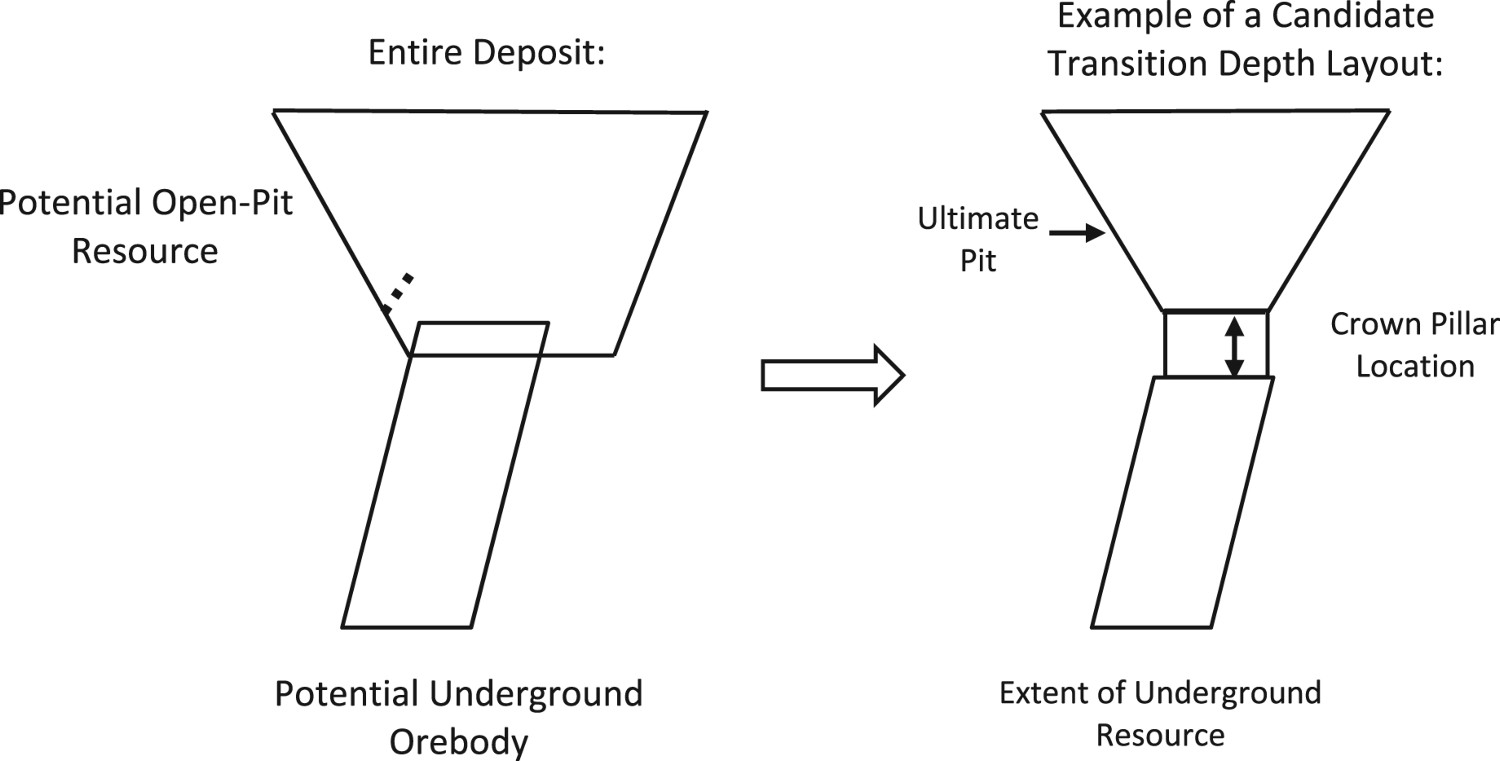
Stochastic mine planning
In order to accurately assess the economic value associated with transitioning at each of the identified transition depths, optimized schedules are produced under geological uncertainty, which accurately project yearly cash flows. The open pit and underground mines are scheduled with the common goal of jointly keeping the processing plant operating at full capacity throughout the mine's life. An interaction between the mill and the mine was not modelled since the focus was on the strategic decision of open pit versus underground mining. The direct and dynamic linking between the mine and mill, and the integration of all related elements into a single simultaneous optimization formulation that considers uncertainty in the materials extracted from mines in a mineral value chain from mines to products (Goodfellow and Dimitrakopoulos 2016; Montiel et al. 2016; Farmer 2016; Montiel and Dimitrakopoulos 2018) is beyond the scope of the present study. In the approach adopted and applied herein (MacNeil and Dimitrakopoulos 2017) production scheduling uses an optimization framework that relies on stochastic integer programming (SIP) to maximize value, while minimizing the risk of failing to meet productions targets on a yearly basis. The SIP model is unique in its ability to accommodate several orebody simulations, as opposed to a single estimated orebody model required for deterministic optimization. Note that previous studies (e.g. Albor and Dimitrakopoulos 2009; Montiel and Dimitrakopoulos 2017) have documented that 10–15 orebody simulations are sufficient to generate stable results. In order to gauge the benefits of including uncertainty, a similar deterministic optimization can be executed in parallel for the results to be benchmarked against the outputs of the stochastic framework.
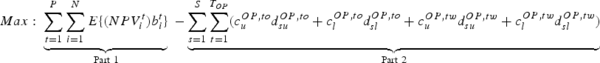
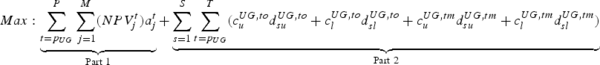
The formulations utilized for scheduling the OP and UG are quite similar. Both require an input of about 15 or so orebody simulations and share the common objectives of maximizing discounted value while minimizing deviations from targets, as seen in Equations (1) and (2). The objective function for the OP scheduling formulation can be seen in Equation (1). Part (1) of Equation (1) represents the discounted profit  generated by mining an OP block i in period t, an action governed by the binary decision variable
  . NPV is defined as net present value or discounted profit, which is equal to the discounted revenue minus operating costs for each mining block based on the year it is scheduled for extraction. For the underground mine portion, the discounted profit for each stope considers only operating costs, as the capital investment required for ramping up the UG mine was not considered. To improve upon the accuracy of this costing and mine sequence, a detailed development plan outlining the capital required should be produced, which can then be included in an overall cost per tonne for the underground stopes. The second part of Equation (1) is included to minimize deviations from ore and waste tonnage production targets on a yearly basis. Here, the d variables relate to the magnitude of deviation within each scenario from yearly ore and waste targets. The magnitude of such deviations is based upon the scheduling variables in part (1) -
  . Within each simulation, extracting a block will correspond to a different amount of ore, metal, and waste since the grade values vary between simulations. Minimizing these unique deviations above
  and below
  targets across all simulations aims to mitigate geological risk throughout the scheduling process. The parameter c in part (2) of Equation (1) represents the unit cost of deviation. Altering this c parameter value shifts the focus of the optimizer between maximizing NPV (part 1) and minimizing deviations from yearly production targets (part 2). The objective function for the UG scheduling optimization seen in Equation (2) is similar to what was seen in the OP objective function, except stopes are scheduled for extraction through the binary decision variable
  . The OP and UG scheduling formulations contain constraints that govern the logistics of the mining process. Such expressions constrain the optimizer to mine every unit, meet yearly ore tonnage targets, and to acknowledge precedent relationships between mining units. Further details of the two-stage SIP formulation implemented for open-pit scheduling can be found in Ramazan and Dimitrakopoulos (2013) and MacNeil and Dimitrakopoulos (2017).
The cardinal difference between the OP and UG optimization processes lies in the solution method, since their size varies greatly. Despite recent work that has suggested that UG optimization is more cumbersome due to complex constraints (O'Sullivan et al. 2015), in the case study evaluated within this paper, the OP problem is much larger as only long-term scheduling constraints are considered for the UG portion. To overcome the complexity of the OP scheduling problem, metaheuristics can be used (Lamghari and Dimitrakopoulos 2012). Here, a parallel implementation of tabu search (Lamghari and Dimitrakopoulos 2012; Senecal 2015) is utilized, which has been demonstrated to provide a high-quality solution in a reasonable amount of time. Since the UG scheduling optimization is smaller, a commercially available tool, IBM ILOG CPLEX (IBM 2011), is conveniently used, which relies on mathematical programming techniques to find the optimal solution.
Case study at the Geita gold mine
General information
The proposed methodology for determining an open pit to underground mining transition depth is applied at the Nyangkanga pit of the Geita gold mine in northern Tanzania. Figure 4 shows the corresponding pit layout. It was discovered prior to this study that, in the next few years, the ore production from the current operating pit will not be able to meet the yearly mill tonnage target. This deficit was noticed within the organization operating this mine and generated a cause for concern. Several different mine plans were produced through conventional methods, but none of the outputs were able to alleviate the mill deficiency issue, thus other strategic options were evaluated, such as a transition to underground mining. In order to compensate for this deficit, those operating the mine within AngloGold Ashanti are considering a transition to underground mining to provide supplemental ore production.
Open-pit layout and zones for potential future underground mining development. Images are available in colour online.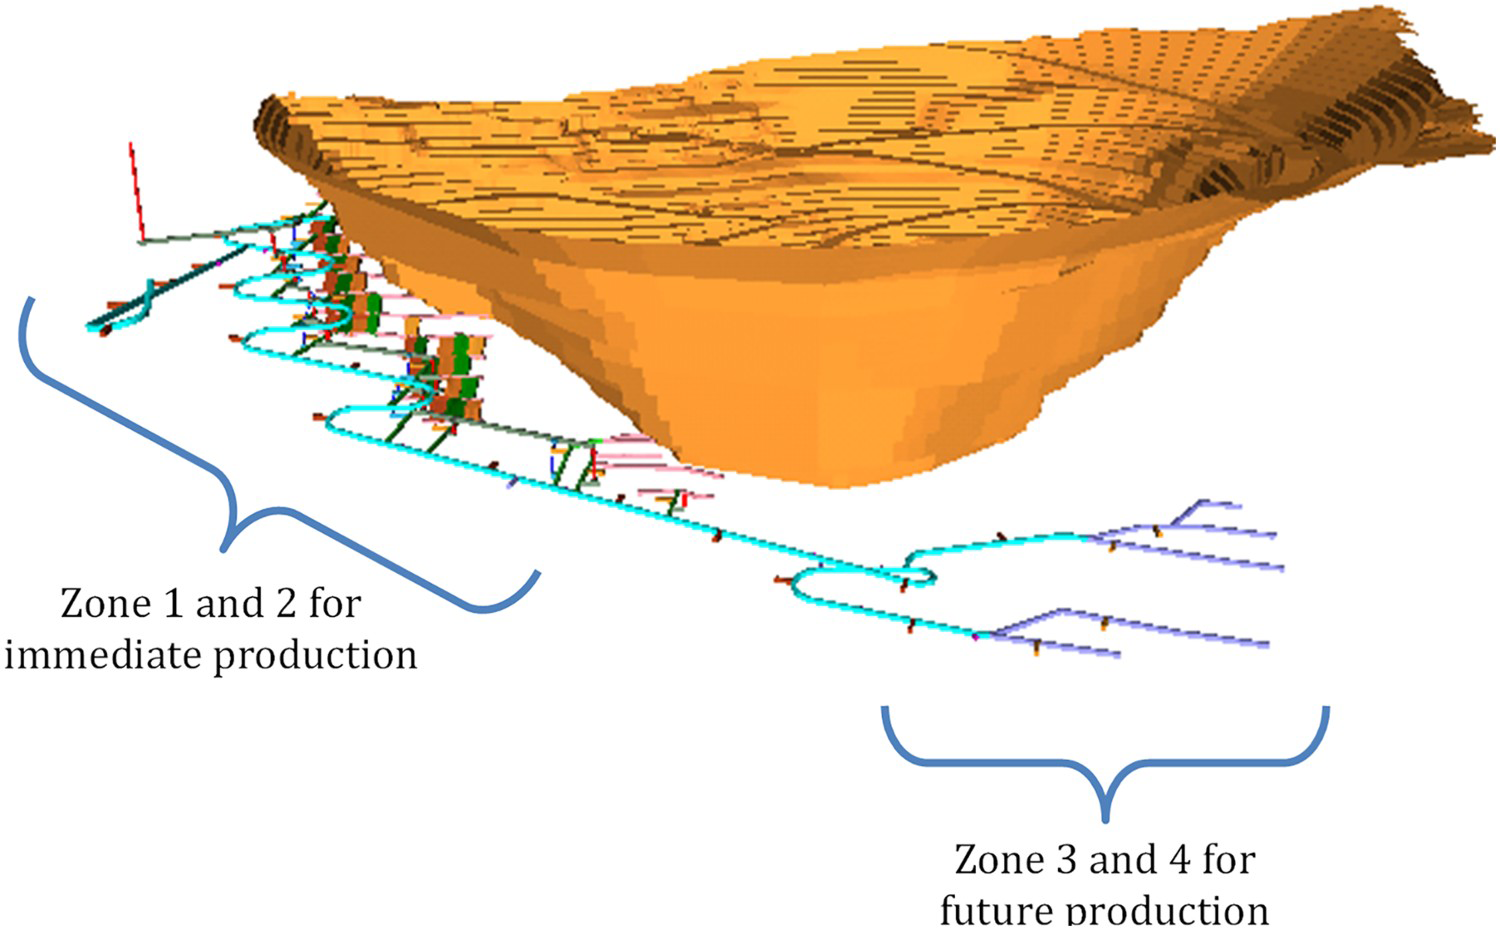
Site specifics
Within the area of the deposit identified for underground potential, there are four zones. Zones 1 and 2 have preliminary stopes designs completed and are being targeted for immediate production, while zones 3 and 4 are areas for future production. The strategy at the mine site is to use the cash flow generated through mining zones 1 and 2 in order to fund further delineation drilling in zones 3 and 4. Since stopes have not yet been designed for zones 3 and 4, they are not directly incorporated into the following financial analysis, but the upside potential of this area is considered when making a final recommendation.
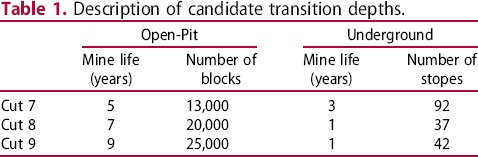
A set of practical candidate transition depths is available, which is generated based on three pushback designs serving as the potential ultimate pit contours. These pushback designs, labelled Cut 7, Cut 8 and Cut 9, along with each of their own unique corresponding underground orebodies, will be considered for transitioning. These candidate transition depths will be referred to as Cut 7, Cut 8, and Cut 9. Open-pit production is planned to continue until the extent of a given pushback design is reached, while underground production is scheduled to commence in production year 4 across all candidate depths, as required by previously conducted studies. Figure 5 shows the three feasible candidate transition depths tested.
Candidate transition depths to be evaluated. Images are available in colour online.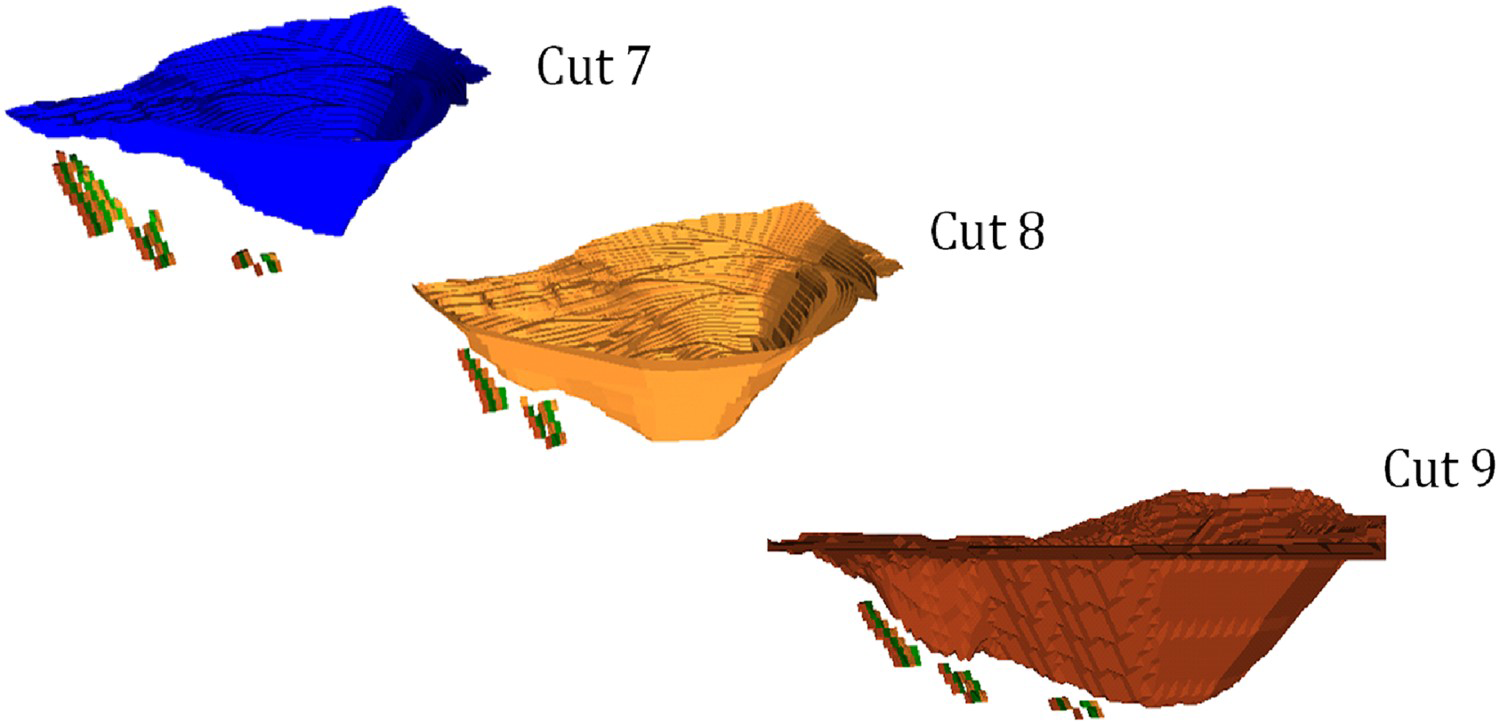
Description of candidate transition depths.
Results and analysis
Figure 6 shows the cash flow resulting from the decision to transition at Cut 7, 8 or 9, based on the proposed stochastic approach. It is apparent that transitioning at Cut 9 is the best choice, and corresponds to the transition depth of the largest open pit and longest combined mine life. Regarding Cut 7 and Cut 8, note that in the cases when the underground mine life is only one year, it is important to use the optimization method proposed and to highlight that the deterministic and stochastic optimizers choose to mine different stopes. Although there is no sequencing, the objective functions for the different methods observe different economic values within each stope and select to mine different material groups.
Risk profiles on cumulative cash flows of the stochastic framework. Images are available in colour online.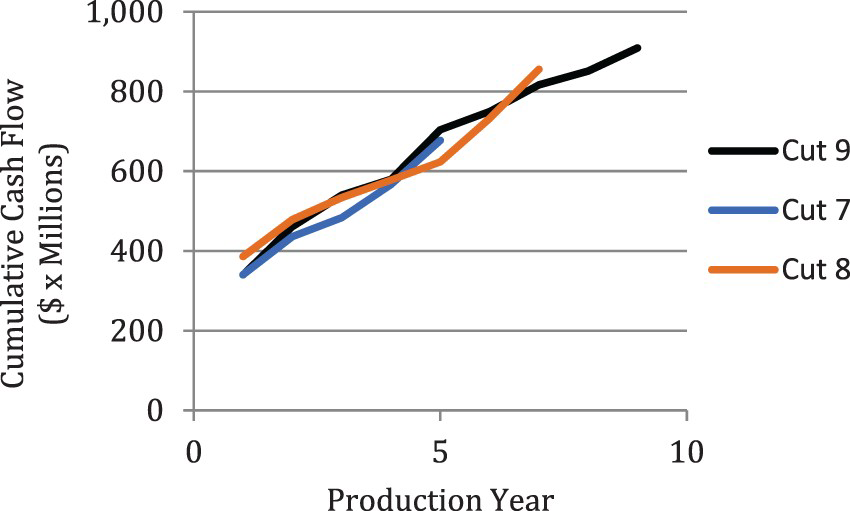
In order to quantify and evaluate the risk associated with the stochastic solution and related decision-making, a risk analysis is performed on the life-of-mine plans corresponding to the optimal transition depth stated above. A similar analysis has been done extensively on open-pit case studies (Godoy 2003; Leite and Dimitrakopoulos 2007; Ramazan and Dimitrakopoulos 2013; others). To do so, a set of 20 stochastic simulations of the deposit are used and passed through the long-term production schedule determined for the optimal transition depth, which in this case is Cut 9. This process provides the yearly figures for mill production tonnages and cash flow projections for each simulation, if the schedule was implemented and the grades within a given simulation were realized throughout mining. Figure 7 shows that the stochastic schedule produced for transitioning at Cut 9 has a high probability of meeting mill input tonnage targets on a yearly basis. This ability to meet ore targets solves the issue of a deficiency in future ore production, which was the original motivation for considering the transition to underground mining. As well, this result translates into a high level of certainty with regards to realizing yearly cash flow projections once production commences.
Yearly mill tonnage input for the stochastic schedule at Cut 9. Images are available in colour online.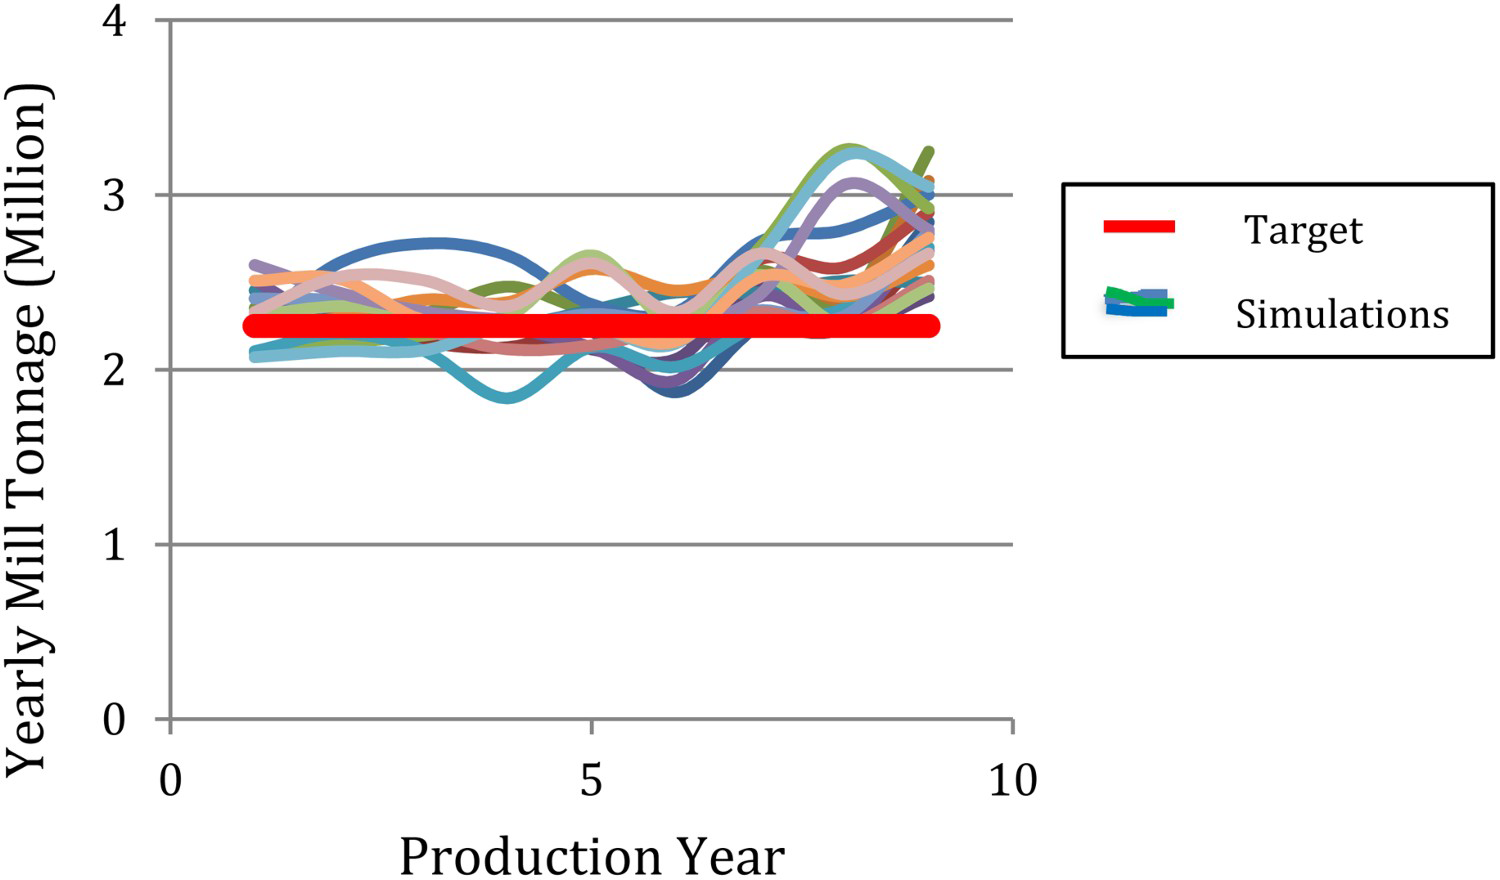
To benchmark the benefits of the stochastic approach and related decision-making, a deterministic framework using a similar optimization formulation is applied to the present case study. The difference between stochastic and deterministic frameworks lies within the orebody model input that the optimizer receives and uses. In stochastic optimization, the optimizer receives a set of twenty equally probable simulations of the actual deposit in the ground, which quantifies the uncertainty associated with a deposit. For the determinstic framework, a single estimated orebody is used that contains smoothed grades and minimal, if any, information about uncertainty. Currently, the majority of the mining industry relies on deterministic frameworks to make their long-term strategic decisions.
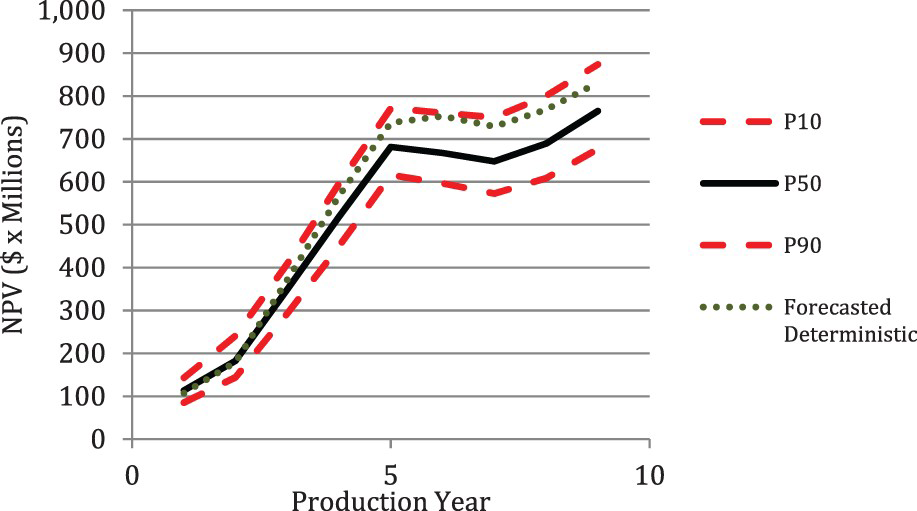
Figure 8 shows that transitioning at Cut 9 is also optimal for the deterministic framework. As done for the stochastic case above, risk analysis can be performed on the production schedule created by the deterministic optimizer for Cut 9. Upon performing this analysis, there are two different cumulative cash forecasts to be compared and assessed. The first is the forecasted cash amounts that the deterministic scheduler expects to produce, representing the typical type of forecast in a conventional mine planning optimization upon which decisions are made. The second, and a more realistic and accurate cumulative cash flow forecast, is the one from the cash flow risk profile, where cash values are recalculated using the proposed (same) deterministic production schedule and each of the simulated equally possible models of the actual deposit. It is useful and typical to summarize the resulting values for a group of simulations using the so-called P10, P50, and P90 percentile curves. The P90 represents the 90th percentile curve where 90% of the simulations fall beneath that value for a given year. Similarly, P50 represents the 50th percentile or median, and P10 the 10th percentile. Figure 9 shows the results of cash flow risk analysis for the deterministic schedule produced for transitioning at Cut 9. Here, a projected NPV of $831M from the conventional deterministic schedule is seen, while the P50 of the risk profile, or the expected value based on risk analysis, is $765M. This implies that the expected value of the deposit, when considering possible scenarios of the actual deposit in the ground and related geological uncertainty, is 8% or $66M less than what was originally projected by the deterministic optimizer based on a single estimated orebody used for scheduling. Furthermore, 17 of the 20 simulations provide an NPV through risk profiles that are below the originally projected NPV, which suggests that there is an 85% chance that this projected cash value will not be realized once production commences.
Cumulative cash flows of the deterministic framework for each candidate transition depth. Images are available in colour online. Risk profiles of cumulative cash flow for deterministic schedules at Cut 9. Images are available in colour online.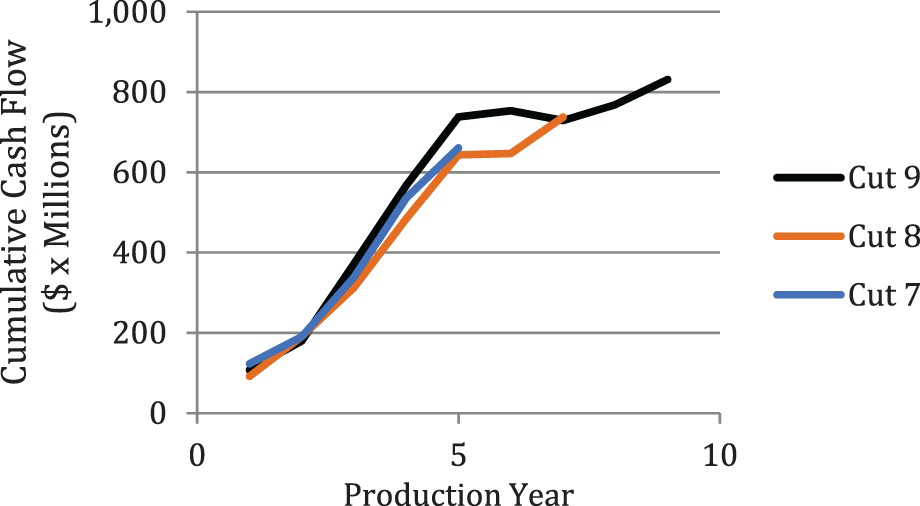
In addition to this financial valuation and risk assessment, the deterministic schedule produced for transitioning at Cut 9 fails to meet a key project indicator, namely the annual mill tonnage. Figure 10 shows that, on a yearly basis, the deterministic schedule struggles to meet the yearly mill production target. Upon closer inspection, a drastic decrease in input tonnage in production years 6 and 7 can be seen and, as was mentioned earlier, this deficit is the original motivation for considering the transition from open pit to underground mining. Therefore, within the deterministic framework, making a transition to UG mining at Cut 9 does not solve the important ore deficiency issue. Conversely, Figure 7 shows that the stochastic schedule has the ability to meet the ore production target throughout the entire life-of-mine.
Mill tonnage forecast for Cut 9 deterministic schedule. Images are available in colour online.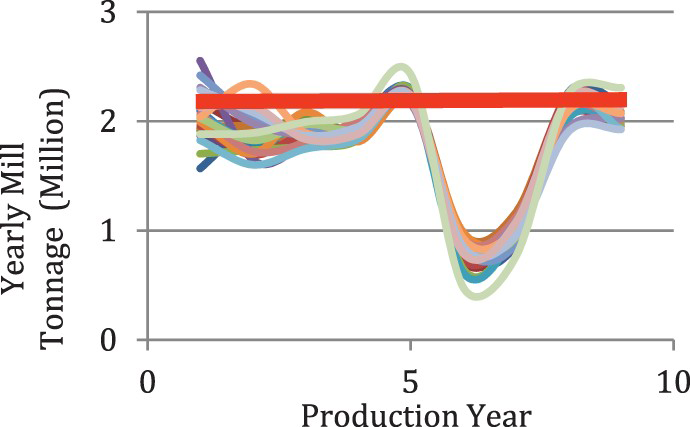
Along with the ability to meet annual ore targets, the stochastic schedule also significantly increases the value of the mine. When considering the schedules produced for making the transition at Cut 9, there is a 23% or $145M increase in the NPV of the stochastic solution, as predicted by related risk profiles (P50) when compared to the NPV risk profiles (P50) of the deterministic schedule. This comparison is shown in Figure 11.
NPV comparison for stochastic and deterministic results at Cut 9. Images are available in colour online.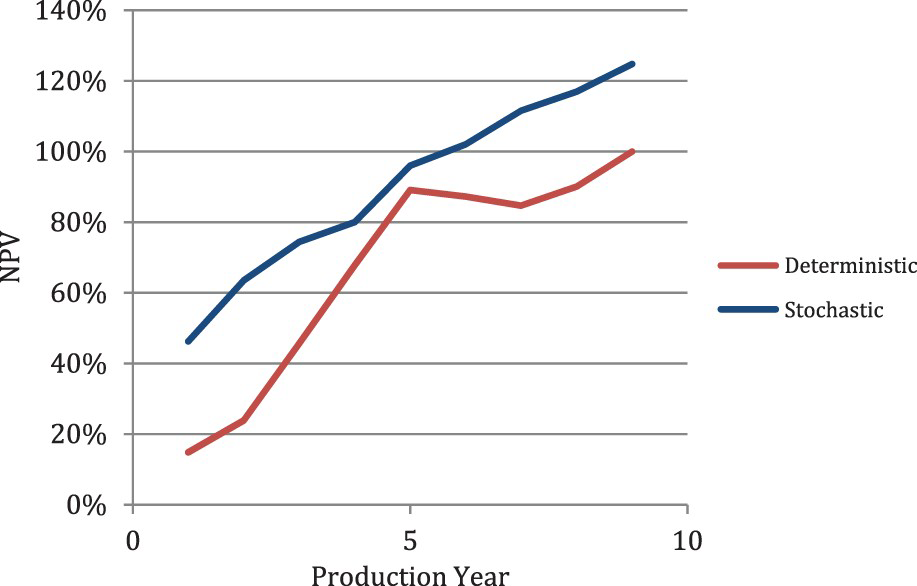
The above risk-based evaluation of the candidate transition depths leads to the conclusion that transitioning at Cut 9 is the best decision. Although the underground mine below Cut 9 has an NPV of $1.1M over its mine life, the open pit has an NPV of $908M. As well, the magnitude of variation between P90 and P10 for the UG mine is $11.9M. This low NPV and high variation of cash are a cause for concern in the capital intensive process of underground mining and suggest that there is a very high level of technical risk associated with the current underground mine design.
Conclusions
This manuscript presented a case study of an approach aimed at determining the optimal transition depth from open pit to underground mining at the Geita gold mine, Tanzania, based on the stochastic mine planning optimization framework that considers and manages technical risk. The case study was motivated by the fact that production forecasts based on conventional approaches showed a consistent deficit in meeting mill production targets. Thus, the transition to underground mining was investigated.
The three alternative transition depths that were identified as viable opportunities to commence underground mining were evaluated by producing life-of-mine plans based on a stochastic mathematical programming optimization approach that manages geological (gold grades/metal content and related volumes of materials) risk to minimize deviations from production expectations, while maximizing NPV. Based on the results of the study, the decision to transition from open pit to underground mine for two of the three options is ruled out and the recommendation is to continue mining through open pit until Cut 9, the largest one, since cash is consistently generated late in the mine life. Importantly, there is a stable mill feed based on the yearly optimal stochastic mine schedule, as documented through risk analysis, and resolves a key issue faced by the mine's operators. Since the underground mine beneath Cut 9 has low profits and high technical risk, a further investigation to improve the financial benefits is required before a decision to begin underground mining is recommended. It is notable that the applied stochastic mine planning approach succeeds in addressing a strategic decision with a large financial impact. Moreover, the benefit of stochastic mine planning over conventional deterministic methods has also been documented, as the schedule produced by the stochastic optimizer is shown to be able to meet the mill requirement throughout the life-of-mine, thus providing a low-risk alternative to transitioning to underground mining. In addition, an increase in NPV of 23% is demonstrated.
Footnotes
Disclosure statement
No potential conflict of interest was reported by the author(s).