
Abstract
This article details two geometallurgical case studies using classification schemes developed for Mn fine and lump ores. For the first, the relative abundance of 15 material types was compared to chemistry by size fraction. Positive correlations were evident between the proportion of aluminosilicate-bearing ore groups and Al2O3 content, the ratio of Mn oxide/Fe oxide ore groups and the Mn/Fe content, the proportion of cryptomelane-bearing groups and the K2O and BaO contents, and the ratio of hard to moderately hard + friable particles and the K2O + Ba + Na content. For the second, agreement was observed between the types of predominant material types in the two different ores and their mass distributions, major and trace element chemistries. Different material types had clear variances in their envelope and apparent particle densities. These two case studies support the expanded use of particle-based ore classification schemes for the characterisation of Mn ores to better predict their downstream processing performance.
Keywords
Introduction
Through the 1970s and 1980s, it was apparent to iron ore producing companies in the Pilbara region of Western Australia that head chemistry and bulk mineralogy alone were insufficient to accurately predict an ore's downstream processing performance, e.g. beneficiation, agglomeration and blast furnace performance (Kneeshaw 1984; Box et al. 2002). Ores with very similar mineralogy and head chemistry sometimes exhibited very different metallurgical indices, e.g. reduction degradation index (RDI), reducibility index (RI), tumble index (TI), decrepitation index (DI), etc. (Clout 2003).
In recent decades, there has been a push to characterise iron ore deposits in terms of their material types and downstream processing characteristics, rather than just by their head chemistry and bulk mineralogy (e.g. Box et al. 2002; Clout 2003; Donskoi et al. 2014; 2016; Suthers et al. 2016). Classification systems that are ore deposit or deposit-type specific can be devised to characterise each lump or fines ore particle in terms of its mineralogy, mineral chemistry, mineral texture, particle texture and physical properties. These classification systems should have a practical number (∼15–20) of ‘ore groups’ or ‘material types’ each with a distinct mineralogy and texture that can be recognised using readily available techniques, such as optical microscopy, scanning electron microscopy/energy dispersive spectroscopy (SEM/EDS) and infrared (IR) or Raman spectroscopy. In addition, each ore group should have a distinct geometallurgical ‘signature’ or characteristics arising from its distinct mineralogy, texture, etc. defined by accepted metallurgical indices/parameters (e.g. DI, TI, RDI, RI, etc.). This approach has led to significant research into particle texture, mineral texture and mineral chemistry in conjunction with particle physical properties such as hardness, permeability, magnetic susceptibility, etc. Robust mineral and textural ore characterisation systems that are ore deposit specific, or that are non-genetic and can be applied across deposit types (e.g. supergene-hypogene upgraded banded iron formation (BIF), have been developed for iron ore fines to help better predict their beneficiation and agglomeration performance (e.g. Suthers et al. 2016).
Manganese ore is predominantly used as a feedstock for steel making in the blast or electric arc furnace; however, there has not been the same level of development of a predictive geometallurgical ore characterisation scheme. Some work has been done in recent years linking manganese lump ore and pellet mineralogy and texture to a lump ore's decrepitation potential (e.g. Faria et al. 2012, 2013, 2015), while other research has been conducted into high temperature performance in the arc furnace of different prominent Mn ores, e.g. thermal conductivity and diffusivity, melting behaviour, etc. (e.g. Tangstad et al. 2004; Gaal et al. 2007; Sorensen et al. 2010; Ksiazek et al. 2011, 2013). However, these studies focus on bulk or size fraction ore mineralogy, chemistry, porosity/permeability to inform processing outcomes and do not utilise ore particle texture in conjunction with these other inputs.
Ringdalen et al. (2015) note that the temperature of initial melting at the top of the coke bed, where most of the reduction takes place, cannot be predicted from the chemical composition of the Mn ore, as melting occurs in disequilibrium. Hence, the mineralogy and the size distribution of the different minerals present influence the melting behaviour (Ringdalen et al. 2015). Further work on the influence of different Mn ore textures on furnace behaviour would therefore seem necessary and Ringdalen et al. (2015) state that an increased understanding of the effect of different Mn ore properties is required to better understand their influence on the temperature at the top of the coke bed and its effect on silicomanganese alloy production.
This contribution aims to summarise the existing understanding of the influence of Mn ore mineralogy and texture on its downstream processing performance and to develop a path to a Mn ore characterisation scheme based on the principles utilised in the development of non-genetic, texturally based geometallurgical characterisation schemes for Fe ores. It will illustrate the latter aim with the assistance of two case studies of Mn ores.
Manganese ores
Manganese ores exhibit some textural similarities to many common haematite and/or goethite Fe ores (e.g. foliated particles, pisolitic textures, macro and microporosity, etc.). Mn ores have the potential to be more mineralogically complex (i.e. they have the potential for greater numbers of oxides to be present, some with more variable mineral chemistry, e.g. the coronadite-group minerals – see Biagioni et al. 2013). This is in part due to the fact that Mn occurs in three valence states (i.e. +4, +3 and +2) and may be present as Mn oxide/oxyhydroxides, Mn carbonate and Mn silicate minerals in Mn ores (e.g. Maynard 2010). Fe is present in only two valence states in Fe ores (i.e. +3 and +2) and is present as Fe oxides/oxyhydroxides and sometimes as Fe carbonates and Fe silicates, the latter two more commonly present in lower grade magnetite BIF ores or magmatic ores.
Common Mn ore minerals.a
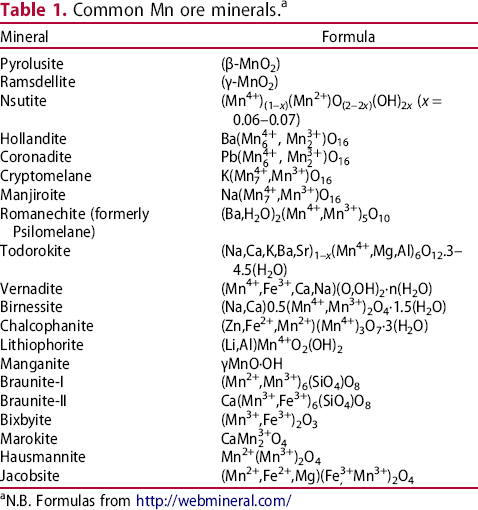
aN.B. Formulas from http://webmineral.com/
As with Fe ore minerals, Mn ore minerals have natural textural and compositional variations depending upon the ore genesis. Many of the mineral compositions listed in Table 1 are ideal compositions, and natural samples (e.g. cryptomelane) may show substitution of a variety of minor elements (e.g. Al, Fe, Si for Mn, etc.; e.g. Frenzel 1980; Ostwald 1988; Post 1999). Variations in Mn ore texture (e.g. microporosity) and mineral chemistry have potential impacts on beneficiation, agglomeration and furnace performance, as well as on transportable moisture limit (TML) during bulk shipping and downstream environmental implications.
Ore characterisation
Principles
Ore characterisation with respect to the prediction of downstream processing performance takes into account that ore particles (not discrete or distinct chemical species or mineral species) are the unit inputs to processes (e.g. Clout 2003). Therefore, particles are characterised as ‘material types’ based upon their geometallurgical parameters with respect to the downstream process or processes. Iron ore geometallurgical schemes consider an ore particle's mineralogy, chemistry, mineral association, mineral chemistry, mineral texture and particle texture (e.g. Donskoi et al. 2016). Particle texture in this sense means the size, shape and relative arrangement of the constituent mineral grains/crystals in the particle, as well as the size, shape, and relative arrangement of any pore space present. For example, particles with elongate crystal grains/crystals all strongly aligned into planes are referred to as showing a strong foliation. This has implications for breakage during comminution, amongst other downstream processing implications. Mineral texture in this sense means the size, shape and internal porosity of each of the mineral crystals/grains present in the particle.
In order for a geometallurgical ore characterisation scheme to be both practical and predictive, it must necessarily have sufficient material types, with distinct processing characteristics, to characterise the ore, as well as having as few material types as possible to make the scheme practical for geologists/mineralogists using it at the mine or exploration site or in the laboratory. Manganese ore deposits formed from distinctly different ore genesis processes (e.g. supergene-upgraded ores and metamorphic-hypogene ores) can be classified using the same geometallurgical principles, but some deposits will require the definition of material types that reflect the different ore and gangue mineralogy, ore textures, grain size, etc.
Techniques
Characterising an ore sample in terms of the relative proportion of various material types per size fraction or product type requires characterisation techniques that are suited to a variety of particle size ranges (e.g. on the scale of strata at the mine, or in lump ore, or in fines ore).
There are numerous techniques available to characterise the physical, mineralogical, chemical, mineral chemistry, mineral texture and particle texture of lump and fine ore samples. Commonly used techniques include X-ray fluorescence (XRF), inductively coupled plasma mass spectrometry (ICP–MS), X-ray diffraction (XRD), electron probe microanalysis (EPMA), SEM/EDS, optical microscopy, He pycnometry, nitrogen porosimetry, microhardness testing, Raman spectroscopy, IR spectroscopy and micro-computed tomography. Physical testing with regard to metallurgical outcomes can involve tests such as RDI, RI, TI, DI, and softening and melting tests.
Clearly, some techniques are better suited to bulk samples or for use at the mine scale, e.g. blast hole samples, drill core samples and mine face characterisation (e.g. XRF, XRD and IR spectroscopy) whereas other techniques are more adept at determining very small-scale differences in crystal size/shape and in mineral chemistry (e.g. SEM and EPMA).
Manganese ore types
Manganese ore deposits formed from (usually combinations of) different ore genesis processes (diagenesis, metamorphism, hydrothermal alteration and supergene alteration) also exhibit somewhat different mineralogy, mineral associations, textures and physical properties. Therefore, predictive geometallurgical ore characterisation schemes for Mn ores will be able to more effectively characterise the material types if they are informed by ore genesis. Manganese ore deposits with significant supergene and/or lateritic weathering inputs (e.g. Moanda, Gabon or Groote Eylandt, Australia) are dominated by tetravalent Mn oxides such as pyrolusite, nsutite and the coronadite group minerals (e.g. Ostwald 1992a). These ores also tend to have a high proportion of the gangue mineralogy present as clay (kaolinite or illite), quartz and goethite.
Manganese deposits with significant metamorphic and hydrothermal/hypogene inputs with lesser supergene overprints may be dominated more by divalent and trivalent Mn minerals, such as bixbyite, braunite and hausmannite (e.g. the ore deposits of the KMF in South Africa; e.g. Gutzmer and Beukes 1996). These ores have gangue and lower Mn content ore mineralogy dominated by carbonates such as calcite (often Mn-bearing), kutnohorite and dolomite as well as notable haematite in some cases (e.g. the Wessels and N'chwaning deposits in the KMF).
However, Mn ores which have major hypogene/hydrothermal inputs and only a minor to moderate supergene overprint (e.g. the Bootu Creek and Woodie Woodie deposits in Australia) can be primarily composed of braunite, the coronadite-group minerals and pyrolusite/nsutite, with quartz, kaolinite, haematite and goethite being the predominant gangue phases (e.g. Scriven and Munson 2007; Jones and McNaughton 2010; Jones et al. 2013; Harvey et al. 2017; Jones 2017). Other Mn ores from other geological environments, e.g. lower grade Mn carbonate ores from Ukraine and Ghana and siliceous ore from India (e.g. Orissa), will have their own textural and mineralogical peculiarities.
Mn ores – physical properties
Mn ores formed by different geological processes have particles with variable but somewhat distinct physical properties (e.g. macro- to microporosity (even nanoporosity), hardness, microhardness, particle size distribution, production of ultrafines/adhering fines, crystal size and shape, etc.).
The Mn ores of the KMF in South Africa have some distinct mineralogical and textural characteristics. Researchers have divided the main styles of economic Mn mineralisation into Mamatwan-type (e.g. the Mamatwan and Gloria deposits) and Wessels-type (e.g. the Mamatwan and Nchwaning deposits) based largely upon differences in their ore genesis and mineral assemblages (e.g. Gutzmer and Beukes 1996 and references therein). Wessels-type ore is formed from hydrothermal alteration of the metamorphic mineral assemblage of the Mamatwan ore (Gutzmer and Beukes 1996). Wessels-type ore contains both braunite-I and braunite-II, more bixbyite, more haematite and less carbonate (especially kutnohorite) than Mamatwan-type ore and also tends to be more coarsely microcrystalline. Both ore types are characterised by particles with low levels of intra- and inter-crystal microporosity.
Other prominent globally shipped Mn ores formed with the significant input of supergene processes, such as Groote Eylandt and Moanda, are mineralogically dominated by pyrolusite, nsutite and cryptomelane and exhibit relatively higher levels of microporosity. Moanda lump ore is considered to be more microporous than Groote Eylandt lump ore (e.g. Olsen et al. 2007; Pochart et al. 2007; Faria et al. 2012). Lump particle microporosity has implications for moisture uptake and TML, e.g. for fines and ultrafines generation during comminution, for solid–gas reactivity during pre-reduction in the upper part of the electric furnace, and for decrepitation potential during high temperature processing (e.g. Clout 2003; Pochart et al. 2007; Faria et al. 2012; Turkova et al. 2014).
The Azul and Urucum deposits in Brazil are other notable globally shipped ores. The Azul and Urucum Mn ores have somewhat similar Mn mineralogy to Groote Eylandt and Moanda, i.e. they are predominantly composed of cryptomelane and pyrolusite, with lesser todorokite, braunite and nsutite, but the Azul deposit is higher grade than Urucum. The Azul lump ore can contain notable gibbsite and magnetite whereas the Urucum lump ore can contain notable proportions of haematite, quartz and goethite (Faria et al. 2013). Porosity determinations using nitrogen indicated that Azul lump ore was more porous than Urucum (Faria et al. 2012).
Mn ore mineral chemistry – some complexities
Many Mn ore deposits contain Mn minerals that are mixed Mn valence oxides or silicates (Table 1), whereas the only common Fe oxide mineral with mixed Fe valence is magnetite (FeO·Fe2O3). The combination of the valence states of some Mn minerals with mixed Mn valencies has also been the focus of debate and dispute (e.g. braunite – see De Villiers 1975 for a discussion) and the coronadite-group minerals. For example, coronadite-group minerals have variably been considered to comprise both Mn4+ and Mn3+ cations (the present consensus, e.g. Post 1999; Pasero 2005) or to comprise both Mn4+ and Mn2+ cations (e.g. Frenzel 1980, p. 60; Ostwald 1988). There is also significant propensity for the mineral chemistry of Mn ore minerals to deviate from that of the reported ideal formula, e.g. cryptomelane (e.g. Frenzel 1980; Post 1999; Pasero 2005). In a further example, Gutzmer and Beukes (1997) have identified braunites of three distinctly different compositions from the Postmasburg manganese field in South Africa. Ostwald (1992b, 1993) also identified three different types of braunite with different CaO contents from manganese deposits in the Pilbara, Western Australia (i.e. ‘sedimentary-diagenetic’, ‘recrystallised/corroded’ and ‘supergene’, the latter having the highest CaO content and also a tendency to have the highest Fe2O3).
An ability to at least qualitatively link cryptomelane mineral texture/microporosity with cryptomelane mineral chemistry (e.g. the presence of structural water) would be of potential benefit to the application of geometallurgical Mn ore classification schemes. This should include a better understanding of the nature and extent of differences in the crystallinity, texture and microporosity of supergene and hypogene cryptomelane (cf. summary of Kudo et al. 1990). It would also be beneficial to determine if supergene cryptomelane has different K levels to hypogene cryptomelane and if there are any systematic differences in the proportion of elements such as Fe, Al and Si. Supergene cryptomelane from oxidised zones of the Miura Belt in India apparently had higher Fe and lower Mn (but similar K contents) than metamorphic recrystallised cryptomelane (Miura et al. 1987).
Ultimately, a better understanding of the range of coronadite-group mineral compositions in an ore and the presence of and evolution of structural water during sintering of Mn ore fines, and also during pre-reduction heating of Mn lump ore (e.g. Tangstad et al. 2015), would better inform an understanding of the sintering, pre-reduction and furnace performance of coronadite-group mineral-rich ores (e.g. Kitive, Zambia; Groote Eylandt, Australia; Azul and Buritirama, Brazil).
Samples
Three Mn fine ore samples from Australia were analysed for the first case study. Two of the fine ore products were lower grade and sized −2 mm (largely −1 mm) whereas the high-grade fines sample was −15 mm (largely −15 + 1 mm).
Two Mn lump ores (lump ore A from Australia and lump ore B from Africa) were analysed for the second case study. These Mn ore deposits were considered to have formed via supergene upgradation of Mn-bearing strata (Mn carbonates) to form the mineral assemblage: nsutite–pyrolusite–cryptomelane ± lithiophorite ± todorokite ± quartz ± kaolinite/illite ± goethite ± hydrohaematite. The size distribution of the two lump ore samples was quite different, lump ore A being sized −37.5 mm and also containing a notable amount of −10 mm sized particles, whereas lump ore B was sized −75 + 6.3 mm.
Methods
Case study 1
The first classification scheme aimed to characterise three samples of Mn ore fines using manual point counting of multiple size fractions with an optical microscope and some subsequent automated optical image analysis. The characterisation work focussed on beneficiation, particularly to link improvements in the fine ore chemistry after processing (i.e. increasing the Mn/Fe ratio and lowering the silica content) to the removal of specific problematic particle types. It compared the ore group proportions of a low-grade Mn fines, a beneficiated product of that low-grade Mn ore fines and a high-grade Mn ore fines from the same ore deposit. Therefore, it was important that the mineralogical/textural groups devised for the classification scheme were present and could be recognised at these different particle size ranges. The classification scheme was devised to account for the deportment of silica (e.g. quartz) and aluminosilicates (e.g. kaolinite) as well as the deportment of Fe-bearing minerals (e.g. goethite and hydrohaematite). Thus, the association of these minerals with one another, as well as with the various Mn oxides, was characterised on a particle by particle basis.
Nevertheless, the nascent classification scheme was devised to also characterise the mineralogy, mineral and particle texture, and mineral association of individual ore particles comprised only of Mn ore minerals (oxides and hydrous oxides in this case). The scheme considered the hardness/density of each particle, which was determined optically by the microporosity of each constituent mineral phase and the macroporosity of each particle. Therefore, for example, one monomineralic ore particle composed of pyrolusite could be classified differently from another particle of the same mineralogy based on mineral/particle microporosity. These differences might reflect differences in crystal size and alignment which in turn, for example, could affect the particle's processing behaviour during transport, comminution or its granulation behaviour and/or reactivity during agglomeration or/decrepitation potential in the electric furnace (e.g. Clout 2003; Donskoi et al. 2016; Faria et al. 2012, 2013, 2014, 2015; Ksiazek et al. 2011, 2013).
Head and size-by-size chemistry was conducted by XRF and qualitative mineralogy on the head samples by XRD. EPMA analyses were conducted and back-scatter electron images acquired on selected particles from one size fraction of one of the Mn ore fines samples. Together, these techniques determined/confirmed the main ore Mn ore minerals as pyrolusite, nsutite, cryptomelane and todorokite and the main gangue minerals as quartz, goethite, kaolinite and hydrohaematite.
Fifteen ‘material type’/‘ore group’ categories were determined, which was considered to be practical, yet broadly representative, of the samples observed (Table 2). Six of these 15 ore groups were allocated to particles with Mn oxide mineralogy only but which had varying mineralogy, mineral associations and mineral/particle texture (Figure 1). Six ore groups were allocated to particles with varying gangue mineralogy and three ore groups were allocated to binary particles of Mn ore and gangue minerals. This ore group allocation was heavily influenced by the aim of this characterisation study and the nature of the samples. Typically, the proportion of gangue groups would be less in an ore classification scheme.
Representative reflected light optical photomicrographs of ore groups. Nascent ore classification scheme for low-grade Mn ore fines.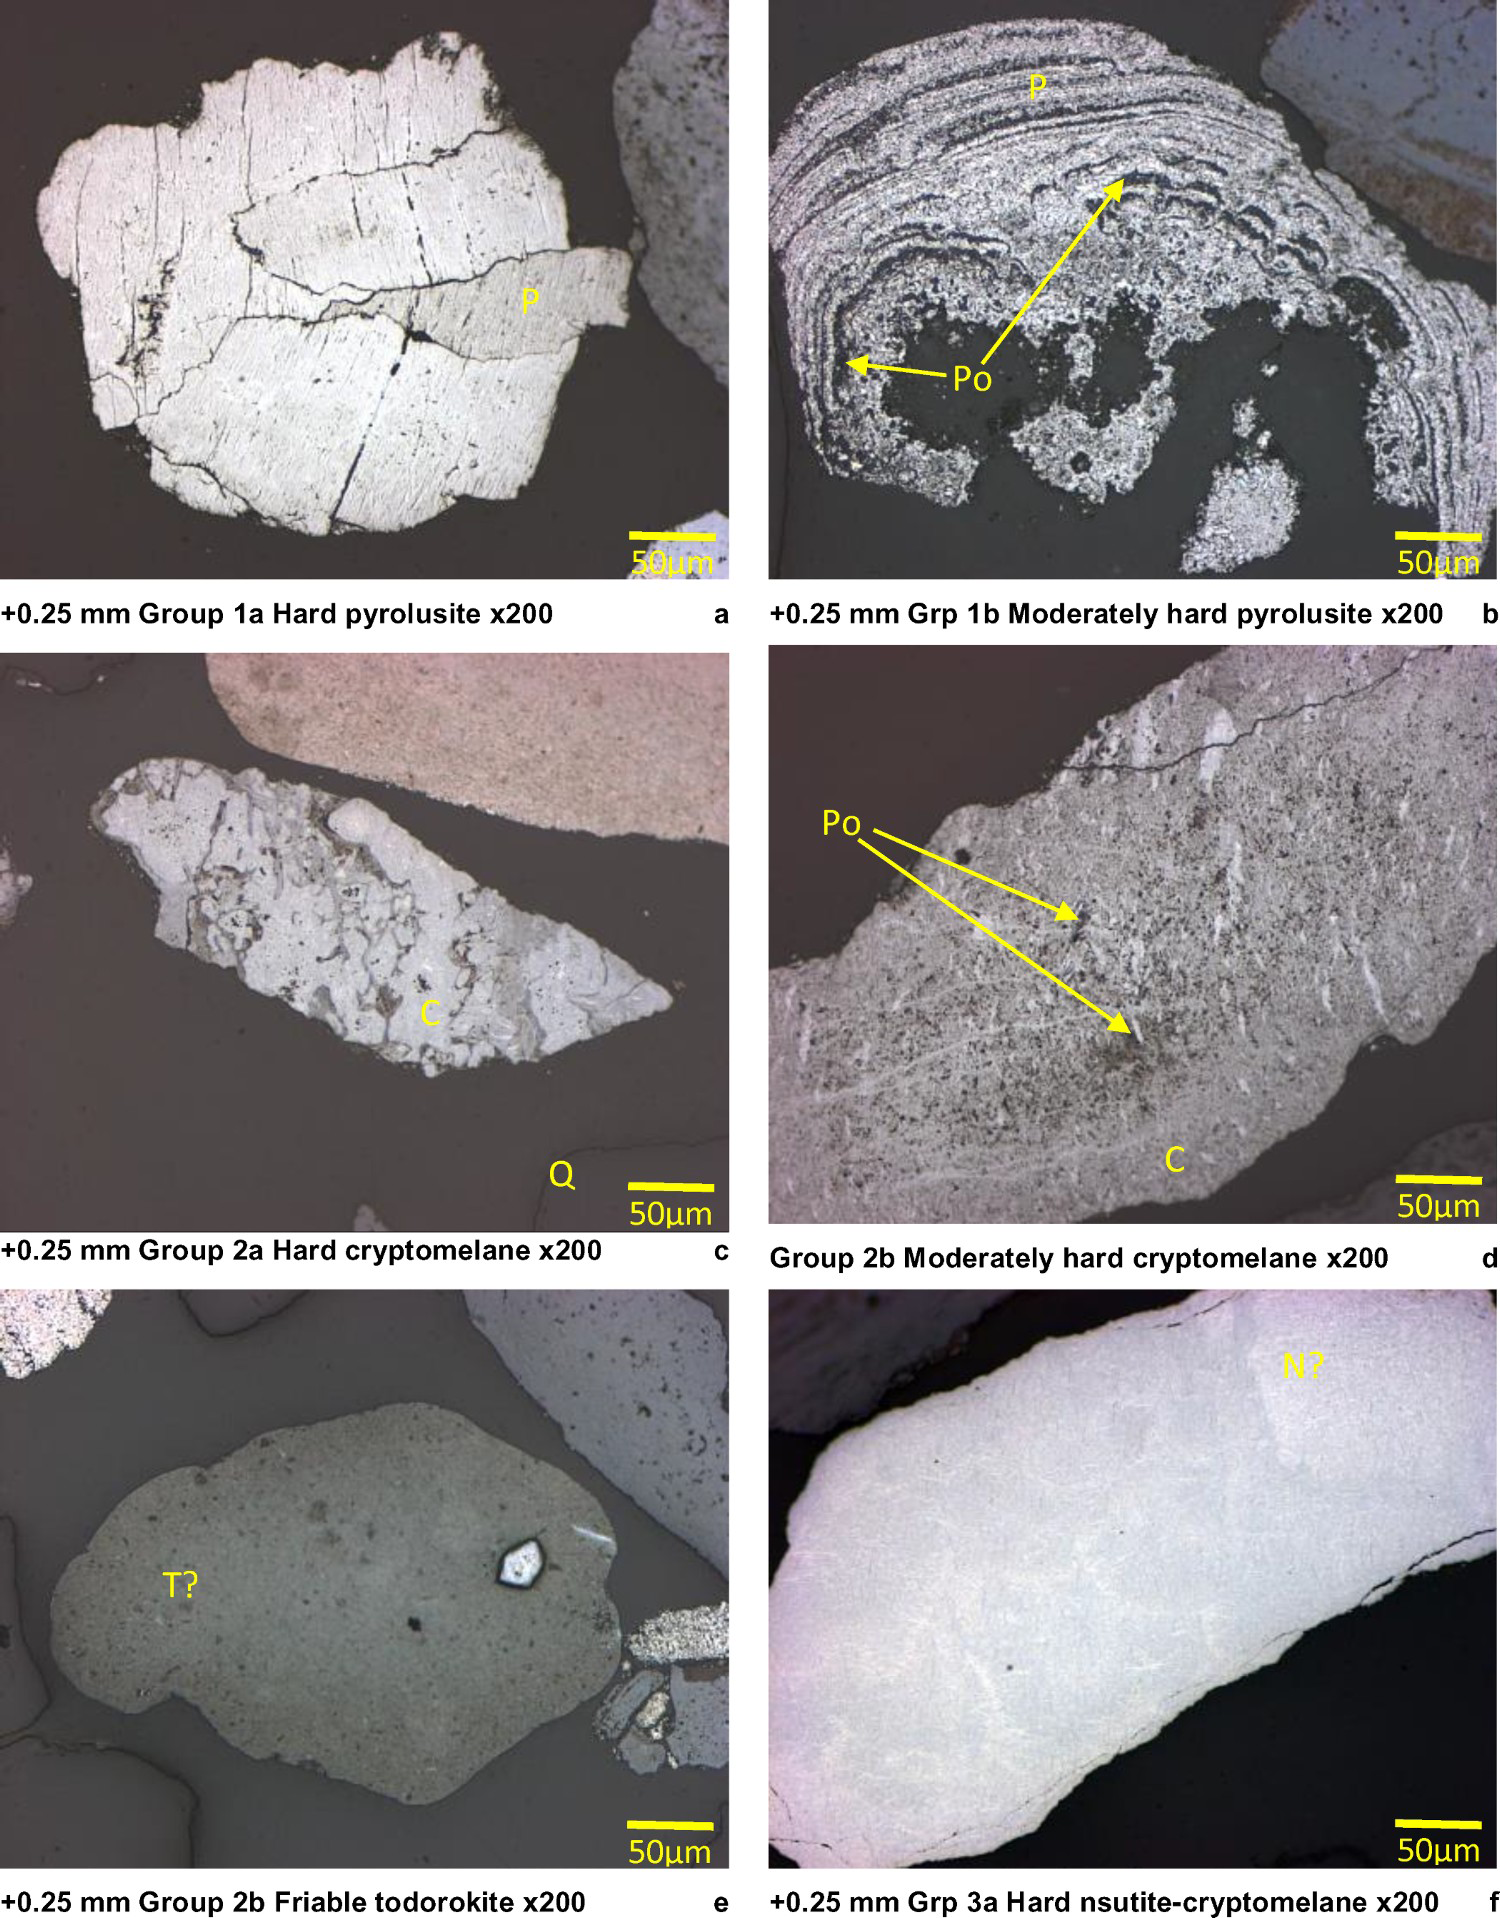
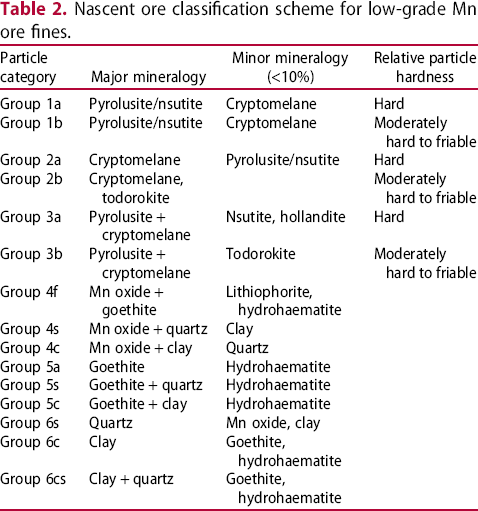
Particles composed entirely of Mn oxides were sub-divided into ‘hard’ and ‘moderately hard to friable’ sub-types based upon estimated particle microporosity and texture, mineral microporosity and texture and mineral association (e.g. Figure 1(a–d)). Mineral microporosity was qualitatively estimated based upon the mineral's optical properties (colour, shade, reflectivity, internal reflections under crossed polars and texture, e.g. botryoidal, colloform, fibrous, etc.). Binary Mn oxide-gangue and gangue particles were not sub-divided into hardness types. Where a particle consisted of more than two mineral phases, e.g. Mn Oxide + quartz + clay, it was counted in the category it most represented (i.e. group 4s or 4c if Mn oxide was the predominant particle phase – see Table 2).
Key to mineral labels in Figure 1: C – cryptomelane, Q – quartz, T – todorokite, N – nsutite, P – pyrolusite and Po – pore.
As this was the first attempt at a geometallurgical Mn ore classification scheme, the distinction of various Mn oxide mineral/textural types was quite conservative, e.g. no attempt was made to distinguish hollandite from hard, dense cryptomelane and todorokite from microporous earthy cryptomelane during point counting. As supergene todorokite is often poorly microcrystalline, it can be difficult to reliably distinguish using optical microscopy alone (e.g. Frenzel 1980; Ostwald 1988). Hollandite was considered most likely to be present in group 3a particles, while todorokite was considered most likely to be present in group 2b particles (see Figure 1(e)), due to its association with porous cryptomelane and pyrolusite in higher porosity (i.e. >10%) particles. Furthermore, no attempt was made to distinguish nsutite during point counting and thus it was counted as pyrolusite, as very fine grained pyrolusite can appear similar to nsutite under the microscope (e.g. Zwicker et al. 1962; Ostwald 1984). Nsutite was considered most likely to be present in group 3a particles (see Figure 1(f)) due to its common association with cryptomelane in low porosity (i.e. ≤10%) particles (and perhaps also some higher density particles) (cf. Sorem and Cameron 1960; Ostwald 1984, 1988).
To be allocated to group 3, an ore particle had to contain ≥10% pyrolusite and ≥10% cryptomelane. Therefore, group 1 particles can contain 0–9% cryptomelane and group 2 particles can contain 0–9% pyrolusite. Hence, the dominant Mn oxide mineralogy in group 3 ore particles was not clear under the classification scheme, e.g. a group 3a particle could be composed of 90% pyrolusite and 10% cryptomelane, or 90% cryptomelane and 10% pyrolusite, or 50% pyrolusite and 50% cryptomelane, etc. (see the particle textures in Figure 1(f–h) for an example). Thus, the particle chemistry of these particles could be quite different due to the different K ± Ba ± Na content of cryptomelane. Therefore, for any future work on a similar ore thought would be given to modifying this category type to reflect which Mn oxide mineral is predominant, which would then necessitate the introduction of an additional ore group.
Case study 2
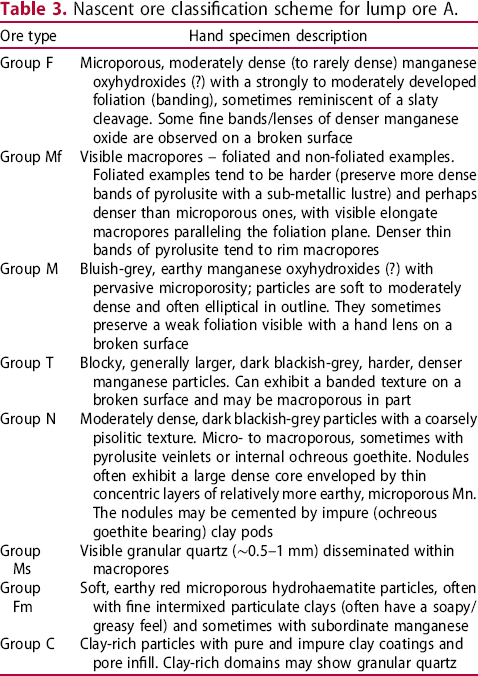
Nascent ore classification scheme for lump ore A.
Nascent ore classification scheme for lump ore B.
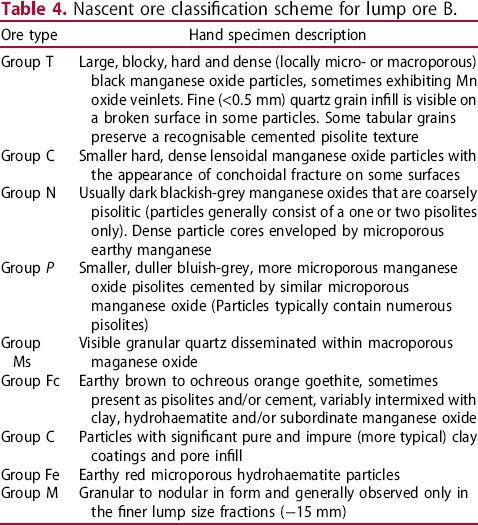
Selected particles from each ore group from the respective −25 + 20 mm and −20 + 15 mm size fractions were then sectioned and examined under the optical microscope to confirm hand specimen observations. These schemes utilise similar principles to those underpinning the schemes used for point counting but had differently defined ‘ore groups’, suitable for ready use in hand specimen, that were designed to highlight the main textural differences between the predominant particle/textural types in two different lump ores.
The classification schemes devised for each lump ore were predominantly based around the particle hardness/density (relatively and qualitatively determined), particle texture/morphology (e.g. pisolitic, foliated, etc.), mineral texture (e.g. microporous) and the proportion of/association with gangue mineralogy. The hand sorting of the lump ore particles into distinct ore groups was qualitative, as the difficulty of accurately determining the composition and relative proportions of Mn oxide minerals in lump ore particles in hand specimen meant that only general conclusions could be drawn about Mn mineralogy.
Hand sorting was completed prior to the lump ore being crushed and pulverised and sent for XRF/ICP–MS and quantitative XRD analysis. Therefore chemistry, mineralogy, optical mineralogy and EPMA informed an interpretation of the hand sorting post sorting but not the hand sorting itself. The amount of material separated to produce epoxy resin mounts for optical examination was not considered to be sufficient to affect the size-by-size chemistry and mineralogy of the selected size fractions. If the head chemistry of the sample, with loss on ignition data at several temperatures, is available prior to sorting, it is a valuable asset for the mineralogist.
EPMA and SEM analyses were conducted on selected particles from three size fractions of one of the lump Mn ores (lump ore A). Quantitative XRD and major and trace element chemistry by XRF were also performed for each size fraction for each lump ore. The −10 mm sized material for lump ore A was dry screened and sub-samples of each size fraction were then mounted in epoxy resin for qualitative mineralogical and textural examination by optical microscope.
Selected lump ore particles types (from the −20 + 15 mm size fraction) for both lump ores were sectioned with a diamond saw for further textural examination and for density tests. The particles selected represented common particle types/ore groups, as well as those impure particles, e.g. mixtures of Mn oxide, Fe oxyhydroxide and clay or Mn oxide plus quartz. Apparent density for each particle type was determined by gas (He) pycnometry using the AccuPyc™ II 1340 Gas Displacement Pycnometry system. Envelope (or apparent) density was determined by solid phase (graphite) pycnometry using the GeoPyc™ 1360 Envelope Density Analyser. Envelope density measurements by the graphite medium method included open and closed porosity when making particle density calculations whereas apparent density measurements by He gas pycnometry included closed porosity only. Closed porosity essentially means porosity which the He gas cannot penetrate, whether because it is truly entirely enclosed by solid particle matter or whether because the device used was not able to pump the He gas into some restricted zones of very fine nano to microporosity within the particle.
Mn ore classification system
Any geometallurgical Mn ore characterisation scheme would ideally be able to predict a Mn lump ore's performance with respect to common metallurgical indices, such as those routinely used to characterise the metallurgical performance of Fe ores: RDI, DI, TI, etc., for example, through quantifying the mineral association and porosity of ore particles bearing hydrous Mn and/or carbonate minerals. In addition, such a scheme would better inform a Mn fine ore's beneficiation performance, using a reflux classifier for example, by characterising the deportment of alumina and/or silica, within both minerals and particles, and its relationship to particle micro- and macroporosity. A geometallurgical Mn ore characterisation scheme could also help model the proportion of different Mn phases produced during sintering, assuming all other sintering parameters were the same.
Nascent Mn ore classification schemes – two case studies
Case study 1 – manganese ore fines
Ore group proportions were compared to major element chemistry by XRF for each size fraction for all three fines products. Clearly, the two techniques had quite different focusses and approach (i.e. the proportion of mineralogical/textural particle types within a size fraction versus the proportion of oxide species by size fraction); however, it is not unexpected for trends in one technique to be at least somewhat reflected in trends in the other technique (e.g. differences in the proportion of SiO2 by size fraction would be accompanied by differences in the proportion of ore groups containing notable silica-bearing phases).
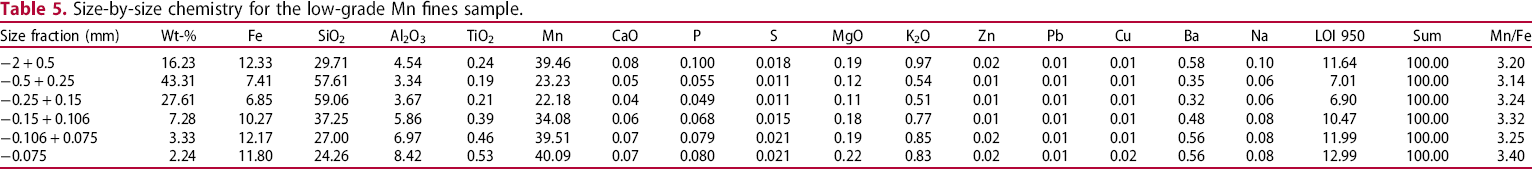
For the purposes of this article, we will consider the lowest grade Mn fines sample only. Most of the sample mass reported to the −0.5 + 0.25 mm (∼43%) and to the −0.25 + 0.15 mm (∼28%) size fractions, and, to a somewhat lesser extent, the −1 + 0.5 mm size fraction (∼16%) for the low-grade Mn fines sample (Table 5). Due to the low sample masses reporting to the +1 mm, −53 + 38 µm and −38 µm fractions, the +1 and −1 + 0.5 mm fractions were combined, and the −75 + 53, −53 + 38 and −38 µm fractions were combined to produce a −2 + 0.5 mm and a −0.075 mm fraction for the purposes of chemical analysis (Table 5). Point counting was undertaken on all size fractions however (Figure 2). The ore group proportions shown in Figure 2 can also be normalised to the mass returns by size fraction, if required, to give the ore group proportions of a composite size fraction (e.g. −1 + 0.038 mm).
Modal proportions on ore groups by size fraction for the low-grade Mn fines sample. Size-by-size chemistry for the low-grade Mn fines sample.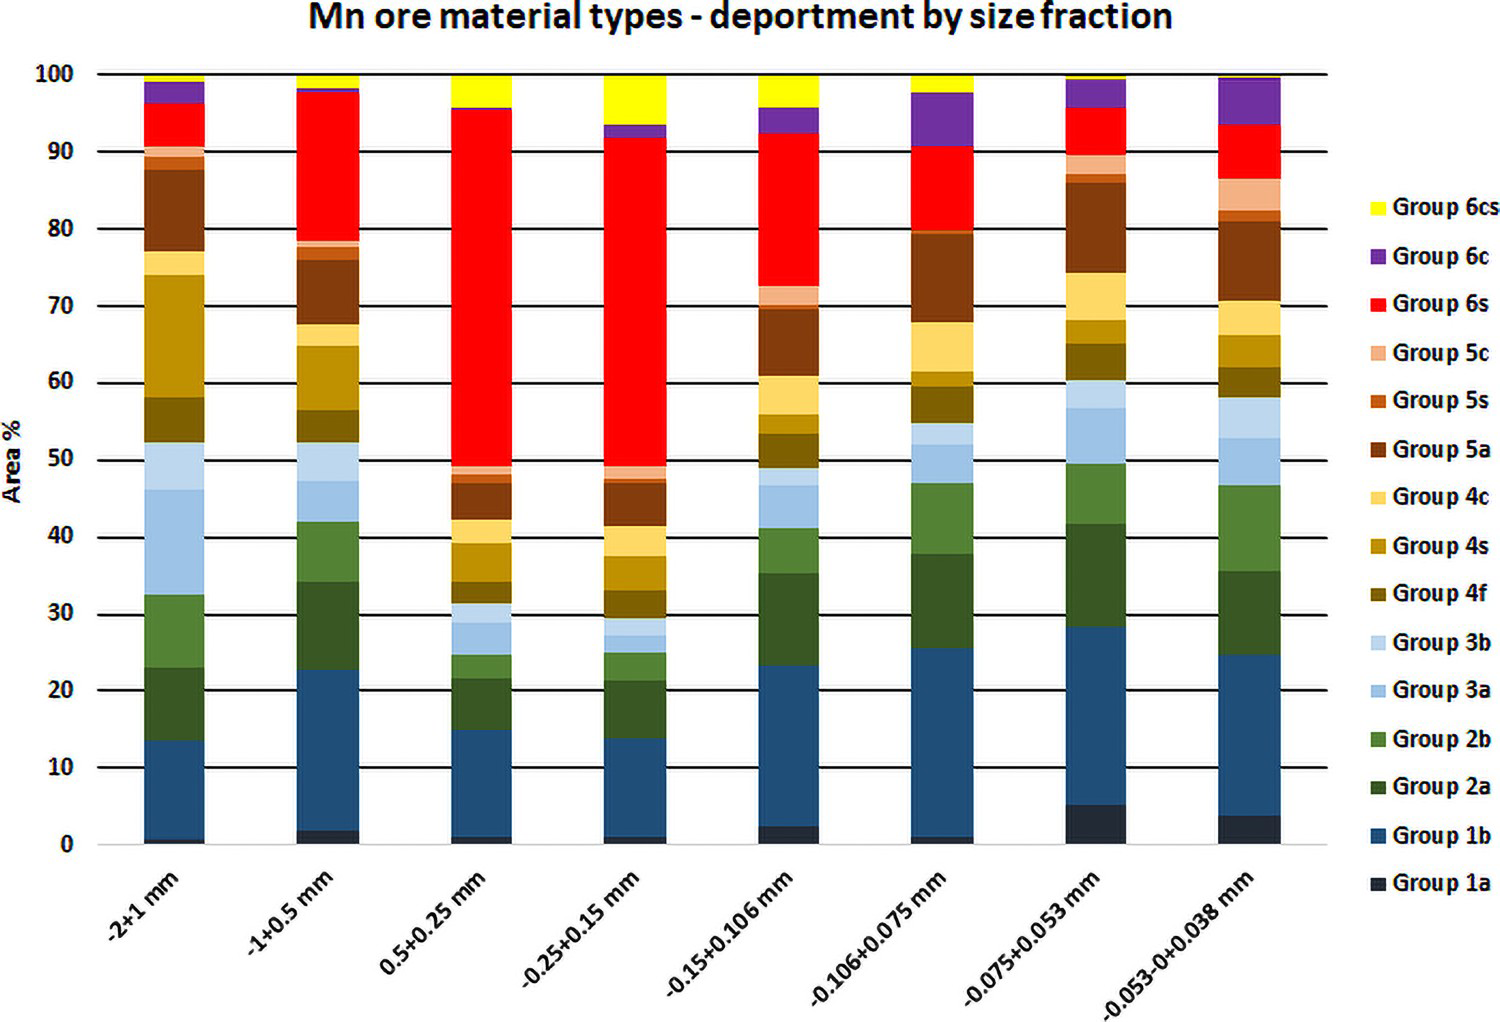
A comparison of the datasets in Table 5 and Figure 2 shows that an obvious characteristic of the lowest grade Mn fines sample was that the size fractions with the highest proportion of discrete quartz grains identified during manual point counting also had the highest SiO2 and lowest Mn and Fe contents by XRF. Other notable correlations include the Al2O3 content and the proportion of ore group particles with substantial clay (group 6c) (Figure 3(a)) and the Fe2O3 content and the proportion of ore group particles with significant goethite and/or hydrohaematite (groups 5a, 5s and 5c) (Figure 3(b)). Note that point count data for the −2 + 1 mm and −1 + 0.5 mm size fractions was combined, as was point count data for the −0.075 + 0.053 mm and −0.053 + 0.038 mm size fractions, to facilitate comparison with the XRF data.
Plot of the modal proportion of group 6c (clay-rich) particles against Al2O3 (a) and all group 5 particles against Fe (b) by size fraction for the low-grade Mn fines.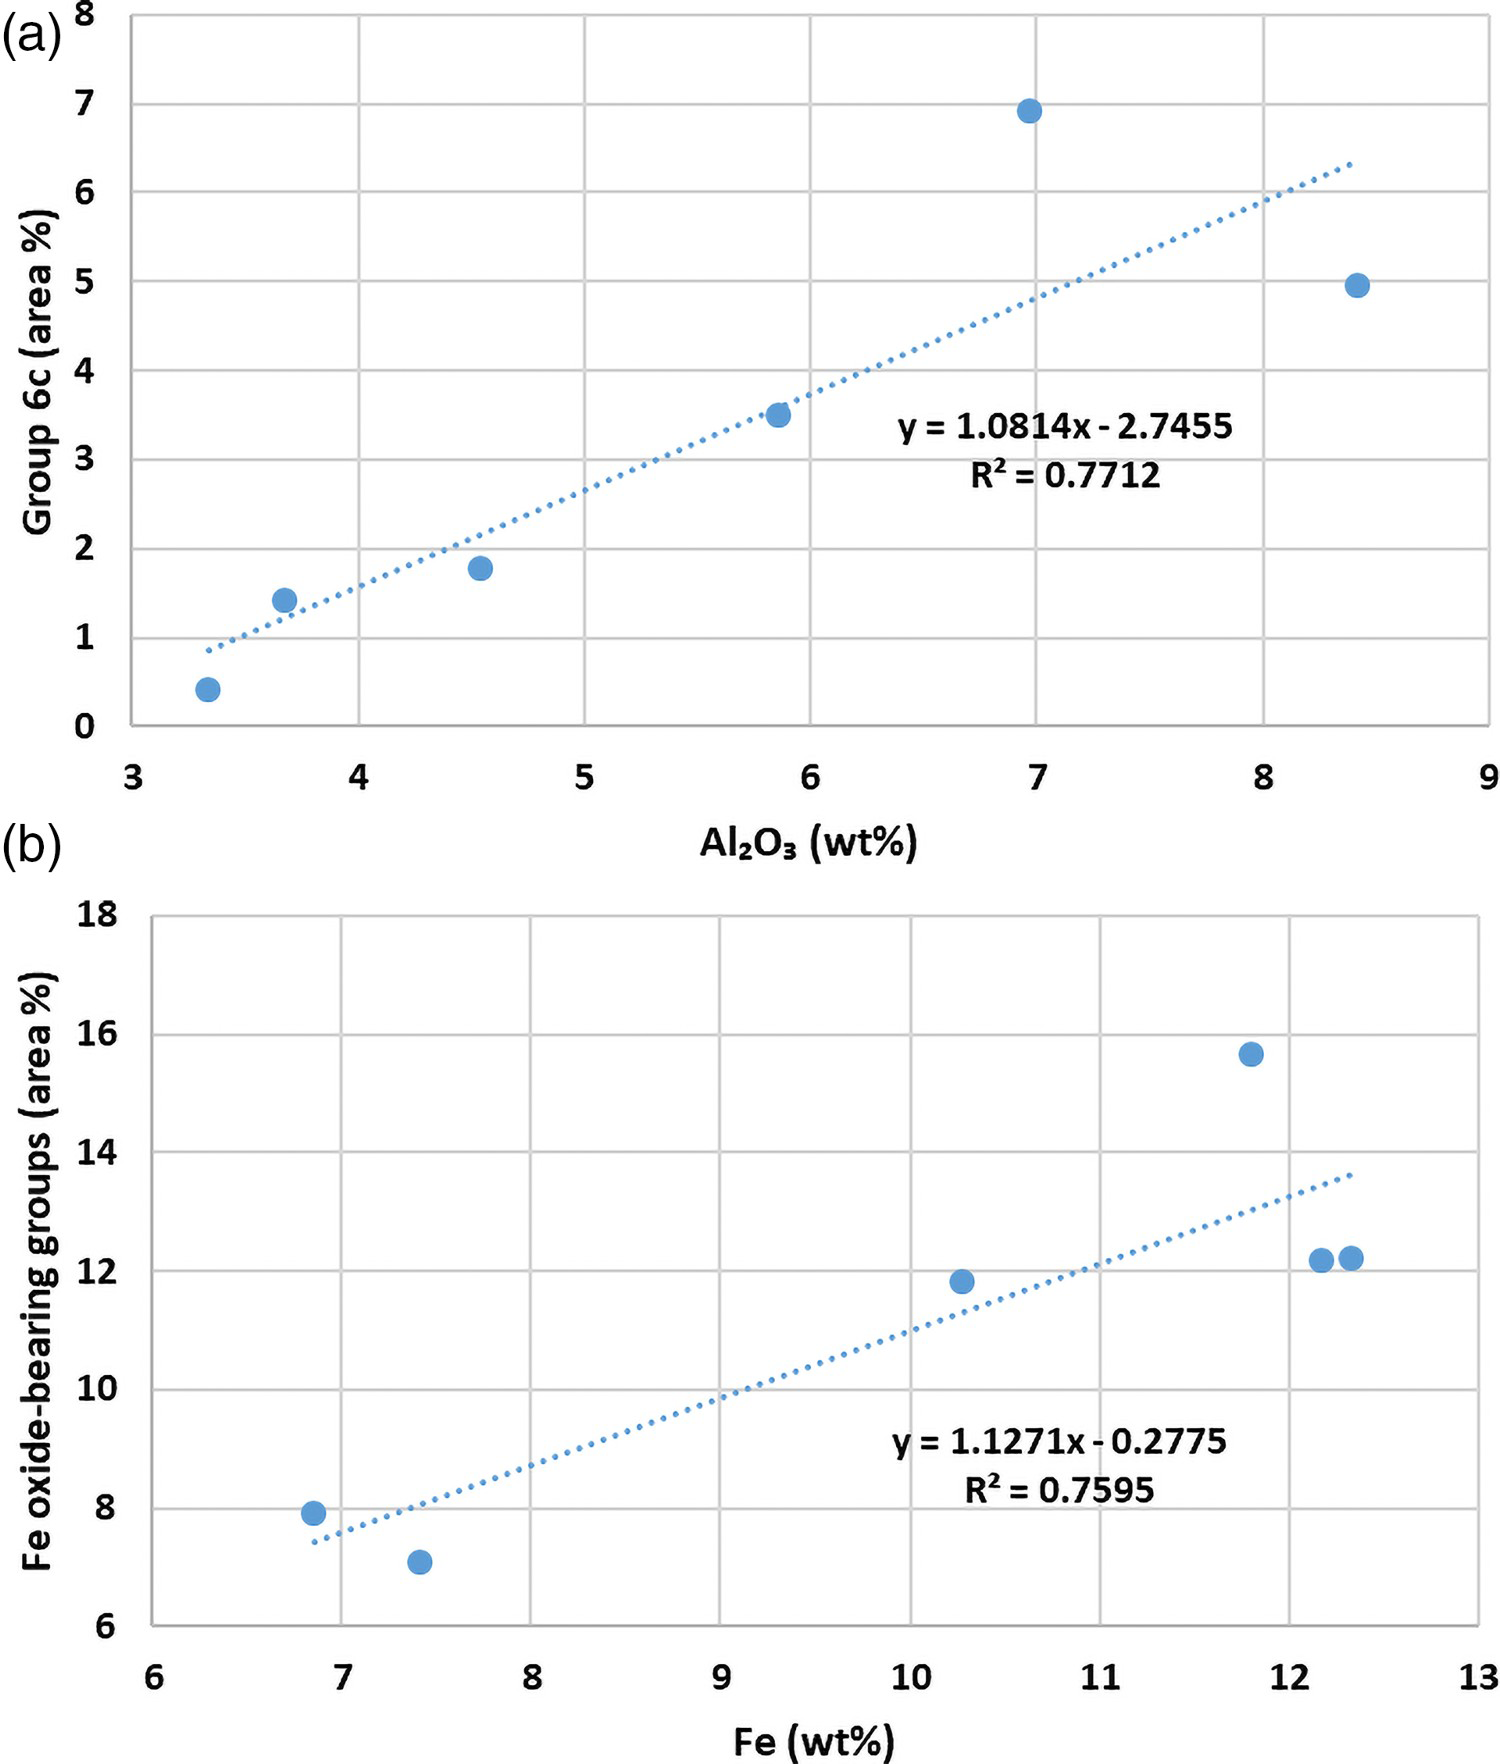
However of more importance for the wider application of the classification scheme to characterise Mn ores were the trends in the Mn oxide dominant ore groups (i.e. groups 1–4) not only with respect to major element chemistry (e.g. Mn, Fe, K, Na, Ba – Figures 4(a), (b), and 5(a)) but also with respect to the relative proportions of each hardness sub-group (Figure 5(b)). For example, the proportion of cryptomelane-bearing particles showed a good correlation with both K2O and Ba, elements present in cryptomelane in varying amounts, as determined by XRF (Figure 4(a) and (b)).
Plot of the modal proportion of all group 2 + 3 particles against K2O (a) and Ba (b) by size fraction for the low-grade Mn fines. Plot of the ratio of group (1 + 2 + 3)/group 5 particles against Mn/Fe ratio by XRF (a) and plot of the ratio of hard to (medium + friable) Mn oxide particles against (K2O + Ba + Na) (b) by size fraction for the low-grade Mn fines.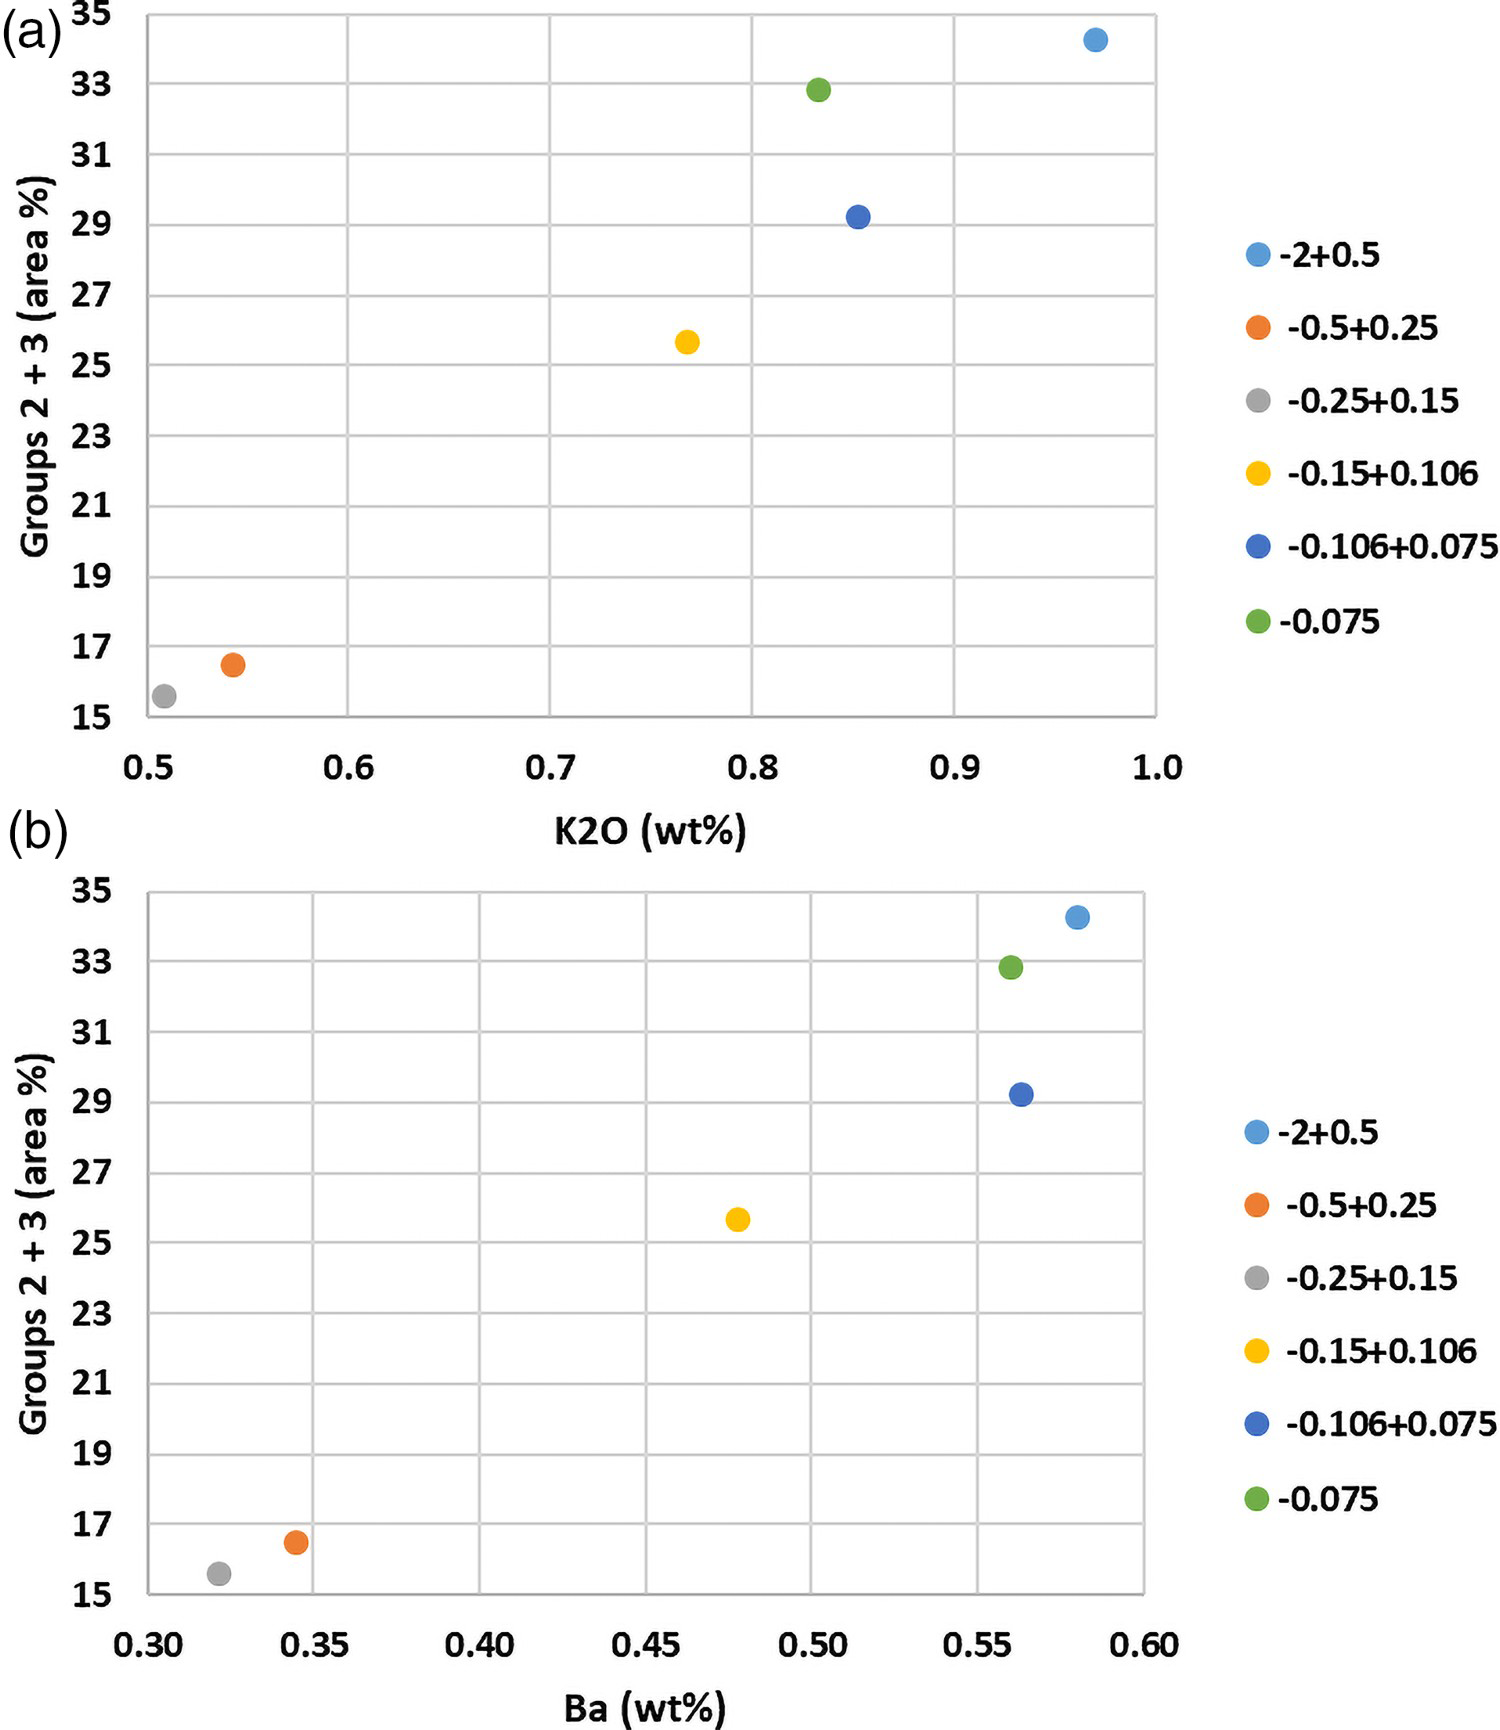
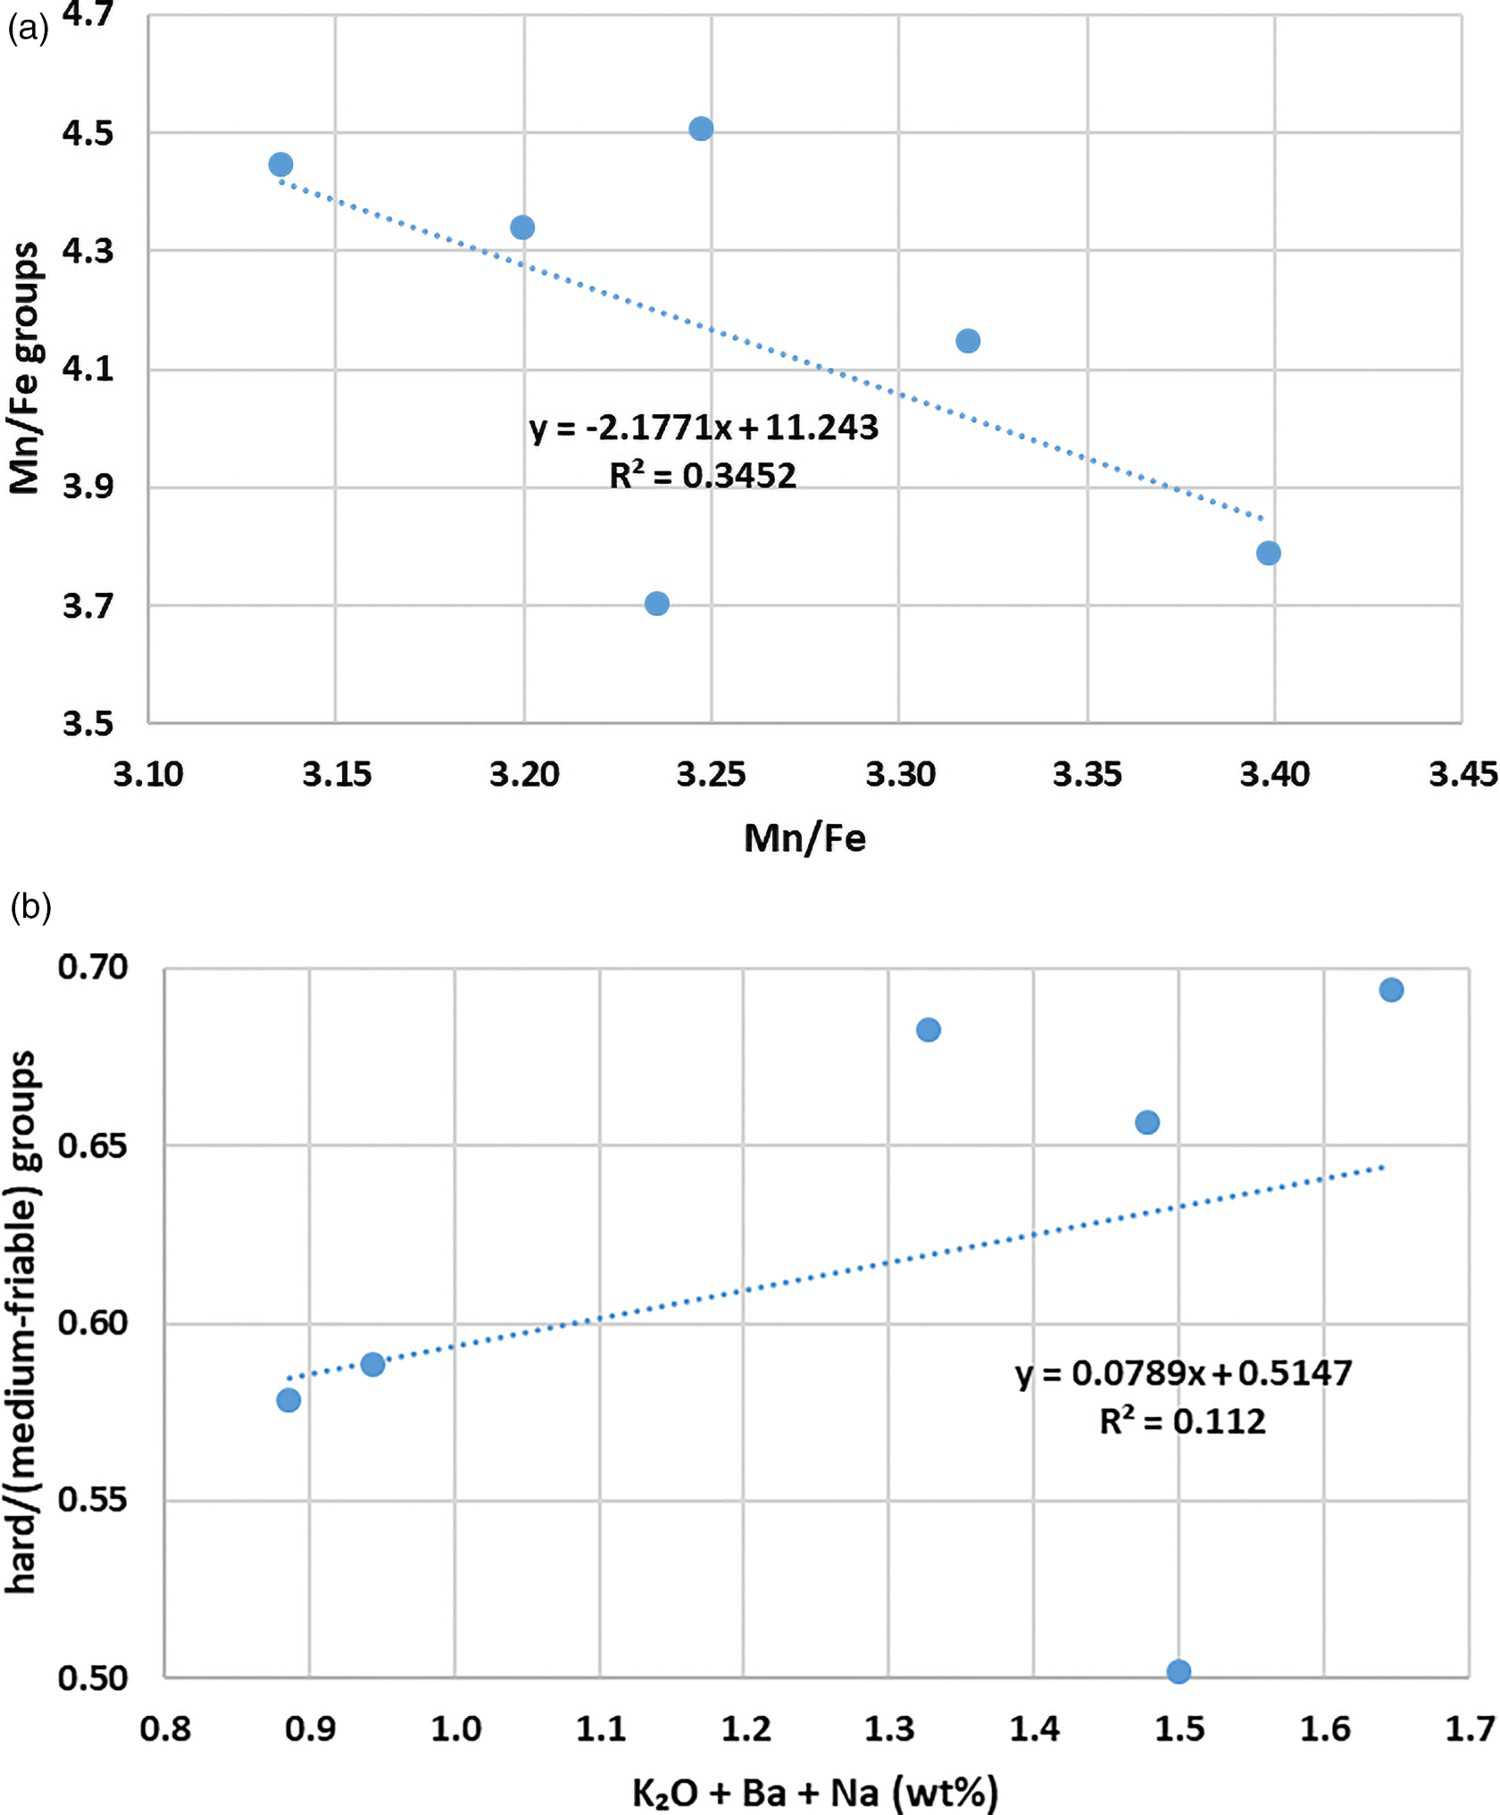
The ratio of Mn oxide-only particles to Fe oxide-only particles determined by point counting exhibited a good correlation (R2 = 0.75 with one omission) with the Mn/Fe ratio by XRF (Figure 5(a)), especially considering that this did not include group 4f particles (Mn oxide + goethite).
The ratio of hard to more porous Mn oxide particles versus total alkalis plus Ba also exhibited a good correlation (R2 = 0.88 with one omission), suggesting that cryptomelane-bearing particles tended to be denser than those without appreciable (<10%) cryptomelane (Figure 5(b)). A visual perusal of the ratios of group 1a:1b, group 2a:2b and group 3a:3b from Figure 2 shows that this was also the finding of manual point counting without relying on major element chemistry.
The ore group proportion–major element chemistry relationships discussed are not meant to be exhaustive but are included to demonstrate the potential merit of the ore group approach to link trends in particle mineralogy and texture with trends in size-by-size (or head) chemistry to better characterise the geometallurgy of Mn ores. Similar trends were exhibited for the other two Mn ore samples analysed utilising the same ore classification scheme.
Mineral chemistry by EPMA
The composition of cryptomelane by EPMA was variable with apparent substitution of Fe, Al and Si into the structure (although the presence of fine intergrowths of goethite and kaolinite with Mn oxide cannot be precluded in some cases) as well as the variable presence of K and Na (Ba was not analysed for). BaO contents by size fraction by XRF ranged from 0.32 to 0.87 wt-% across all three samples. Coronadite-group minerals are known to have variable composition of the tunnel cations between coexisting grains and even along a single crystal (Miura et al. 1987; Post 1999). The varying contents of K, Na, Fe, Al, etc. for cryptomelane determined by EPMA on the lower grade Mn fine sample in this study is consistent with the published literature for cryptomelane. EPMA element totals also suggest the presence of structural water, which has previously been noted in synthetic and natural samples (Miura et al. 1987; Ostwald 1988; Vasconcelos et al. 1994; Biagioni et al. 2013).
Vasconcelos et al. (1994) noted an inverse relationship between the Mn content and the (Fe + Al + Si) content for EPMA analyses on cryptomelane samples from Brazil, suggesting that these elements substituted for Mn4+ in the octahedral sites. A similar relationship was exhibited for cryptomelane EPMA analyses in this study (Figure 6). Charge balance could possibly be maintained by vacancies and/or by the presence of Mn3+ (e.g. Miura et al. 1987; Vasconcelos et al. 1994).
Plot of Mn content vs. (Fe + Al + Si) content by EPMA for cryptomelane from the low-grade Mn fine sample.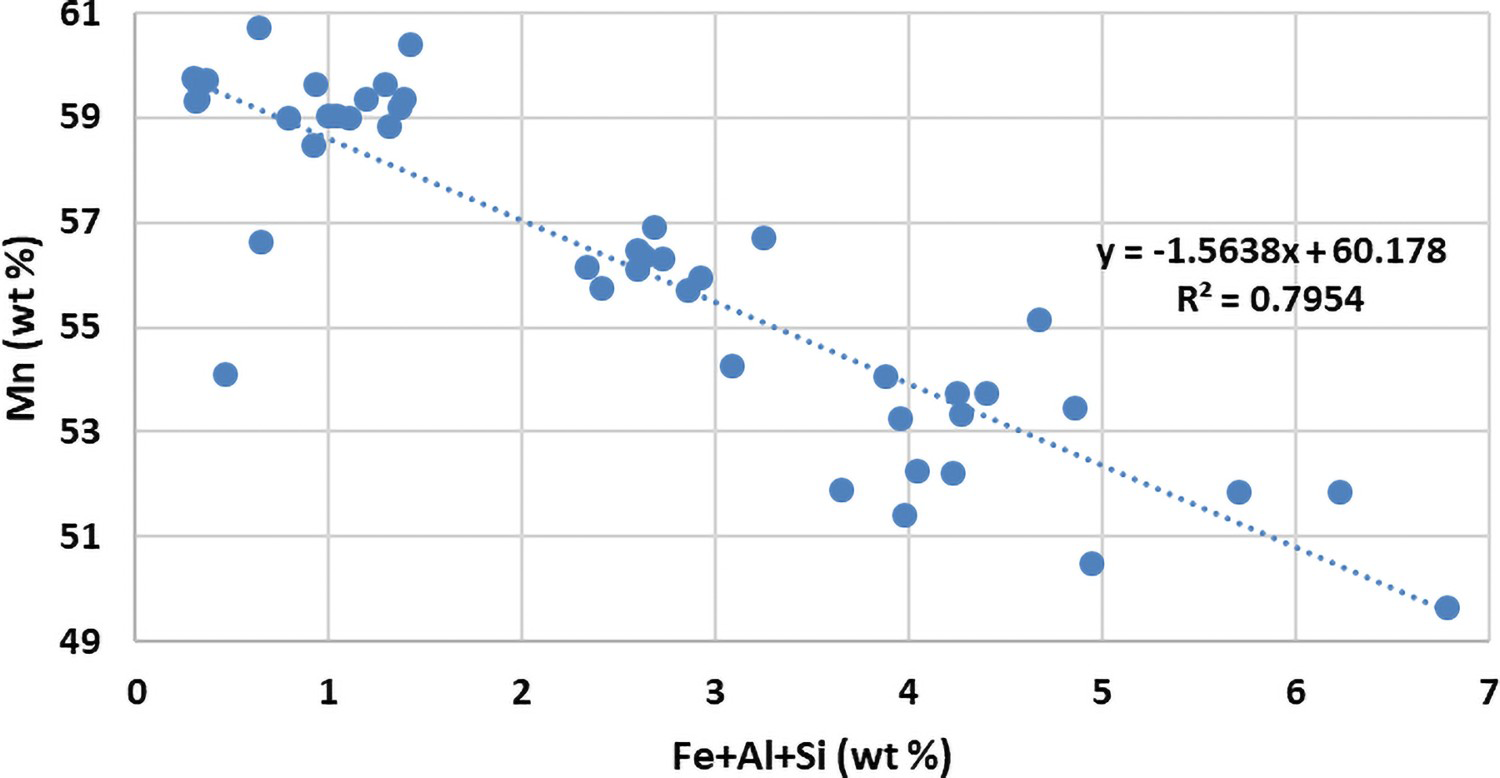
Todorokite like compositions were identified by EPMA (and it was also tentatively identified under the microscope with the aid of microhardness testing – Figure 1(e)) but todorokite was not identified by XRD. Todorokite can be distinguished from earthy, less reflective, microporous cryptomelane by its very low microhardness (mean of ∼80 kgf mm–2). It is possible that some of this material could be vernadite as it has a somewhat similar composition (although vernadite has lower Mn and higher H2O) and microhardness to todorokite and they are known to be associated in some supergene Mn ore deposits (e.g. Ostwald 1988). The total element and minor element contents by EPMA for some fine grained pyrolusite were suggestive of nsutite and nsutite was subsequently identified by optical microscopy, in conjunction with microhardness testing. Nsutite can be distinguished from pyrolusite by its very high microhardness (mean of ∼1080 kgf mm–2). Nsutite was not identified by XRD.
Implications for further development of Mn ore classification schemes for fine ores
With the addition of targeted EPMA analysis and other techniques such as microhardness testing, it is possible to improve the mineralogical aspect of the ore group approach for Mn ore fines. For example, nsutite might be able to be more reliably distinguished from pyrolusite under the optical microscope in ores where they coexist and where there are distinct differences in crystallinity (e.g. Mohapatra et al. 1995). This is potentially important as it often has a different microcrystallinity (e.g. Figure 1(a) and (f)), has a different mineral chemistry, containing a wider range of trace elements and more structural water than pyrolusite (Table 1; see also Turner and Buseck 1983; Mohapatra et al. 1995; Post 1999) and much higher microhardness (e.g. Ostwald 1988). It could also be possible to more reliably optically distinguish todorokite from microporous cryptomelane based on microhardness, and also Mg and K content and total element content by EPMA (due to its higher H2O content).
Modifications to the initial classification scheme
Proposed expanded Mn oxide ore classification scheme for tetravalent Mn-dominated ores.
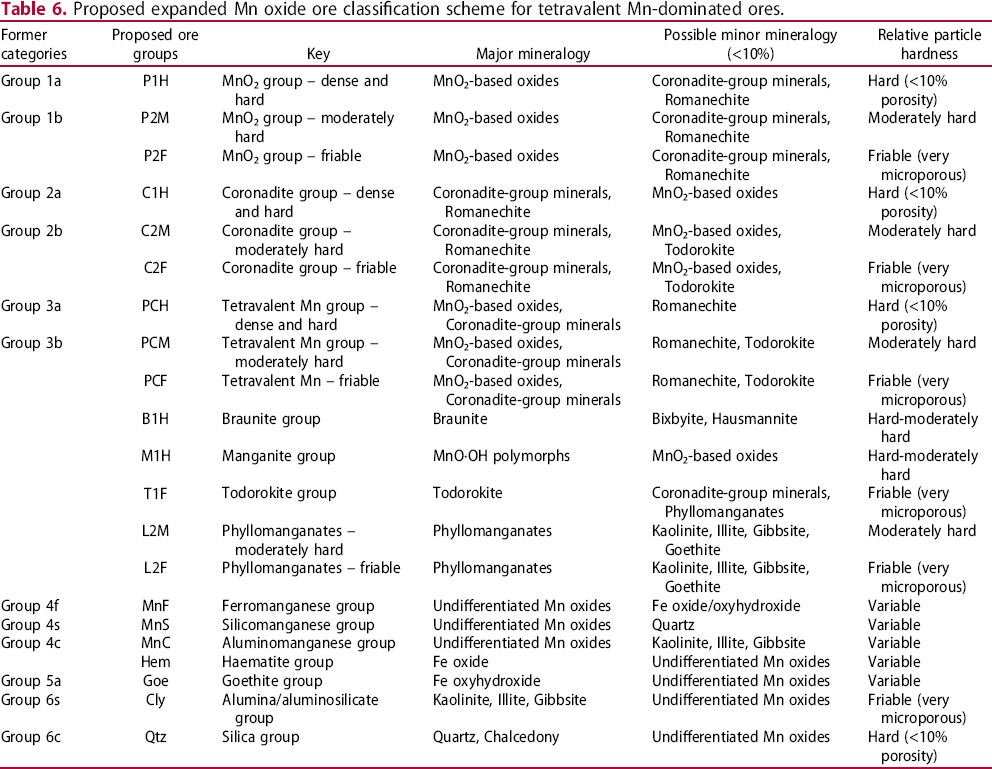
In addition, generally fewer gangue groups would be required for most tetravalent Mn-dominated ores, perhaps a maximum of three to represent Fe-bearing, SiO2-bearing and alumina/aluminosilicate-bearing particles to account for common minor element impurities in tetravalent Mn oxide ores (Table 6). In supergene Mn ores where vitreous goethite (hard brown dense goethite, sometimes exhibiting a vitreous or glassy lustre, ochreous goethite (friable, highly microporous, ochre-coloured goethite) and hydrohaematite are present, it will probably not be practical to set up separate ore groups to separately account for each mineral/mineral form without burdening the scheme with too many extra categories. The distinction of these Fe oxyhydroxides is important for downstream processing in Fe ores (e.g. Donskoi et al. 2014).
Case study 2 – manganese lump ores
Hand sorting of lump ore particles into textural types clearly showed why there was a difference in the size distribution of the respective lump ores. Lump ore A had a much higher proportion of softer, microporous particles composed of earthy Mn oxides than did lump ore B (Figure 7). Lump ore A particles were also more likely to be strongly and finely foliated (Figure 7(a–c)), hence there was relatively more potential for textural disintegration during, mining, crushing and transportation. Particles sectioned and mounted for optical examination confirmed the presence of notable lithiophorite, whose presence was suspected from XRF and ICP–MS analysis and then identified by XRD analysis. There was a notably higher proportion (∼5–10 wt-% by size fraction) of lithiophorite in lump ore A compared to lump ore B, where it was not identified by XRD. Lithiophorite was confirmed by EPMA in lump ore A and was identified in trace amounts by optical microscopy in lump ore B. Lithiophorite has a low microhardness, has a high alumina content and is known to be often intimately associated with clay minerals (e.g. illite and kaolinite) in supergene or lateritic Mn oxide deposits (e.g. Ostwald 1992a). Where present, lithiophorite was often found lining or infilling macropores.
Representative photographs of selected ore groups for the lump ore samples A and B.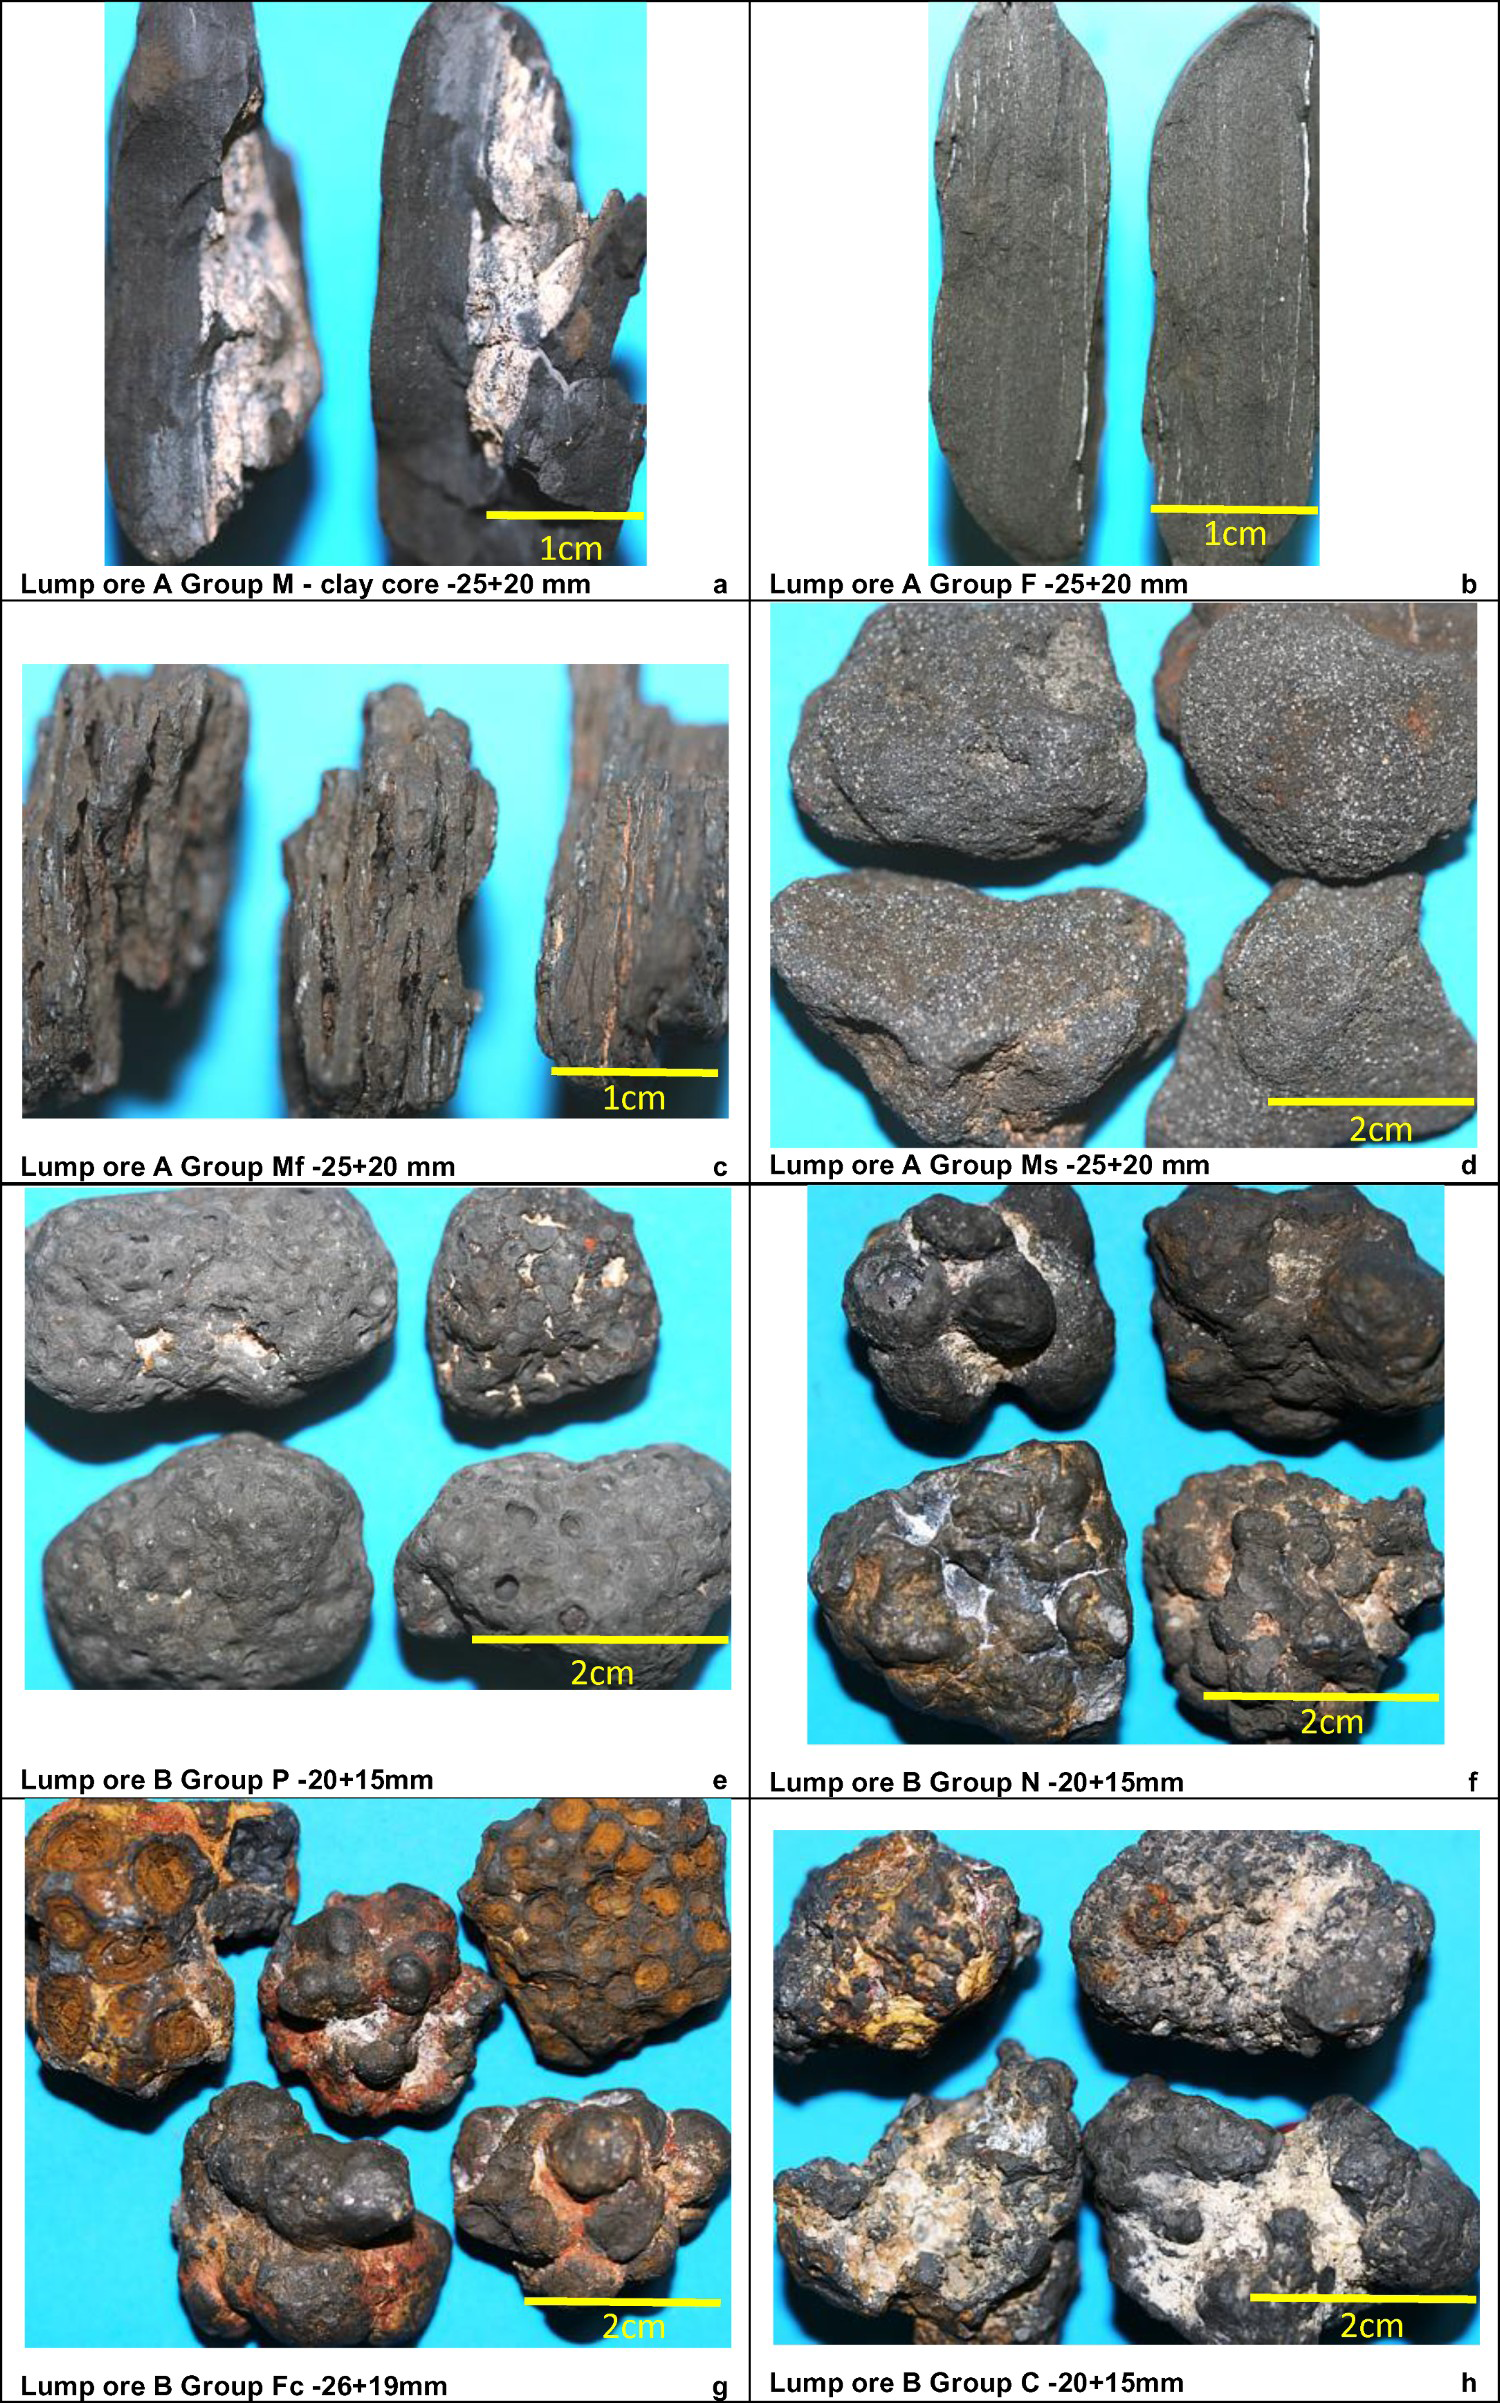
Major (a) and trace (b) element chemistry by size fraction for lump ores A and B.
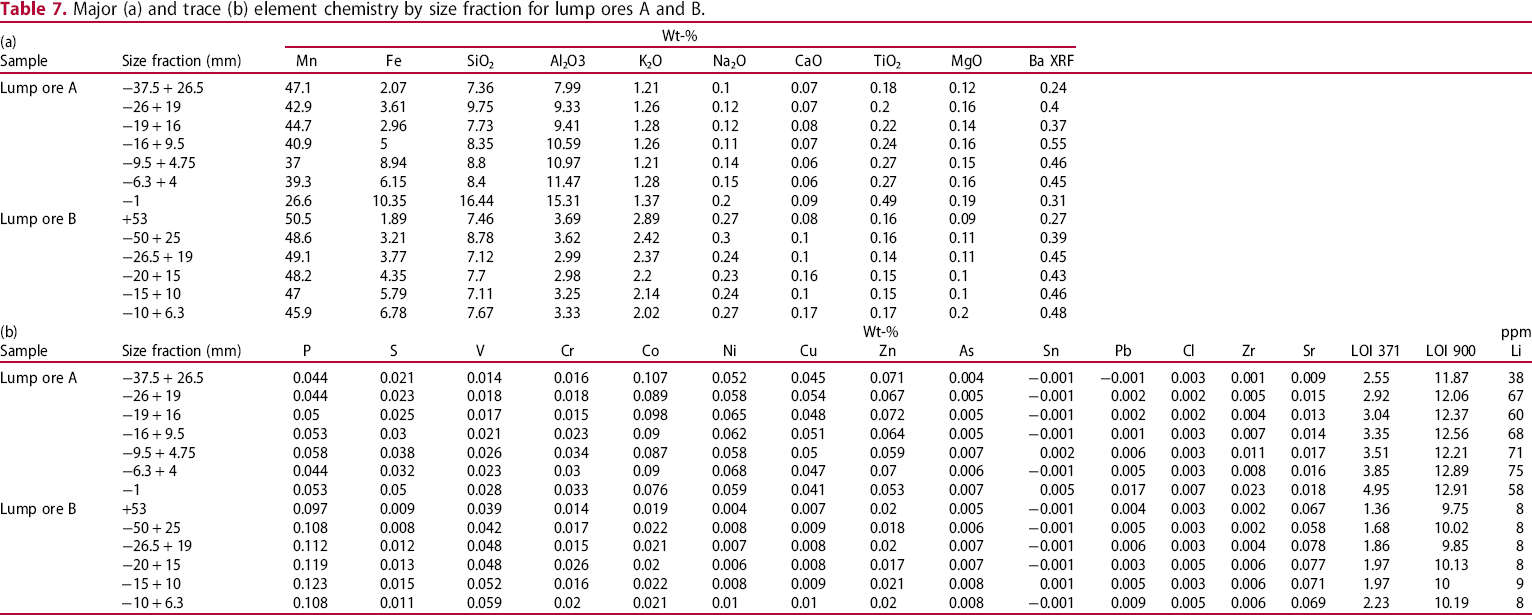
The Mn and Fe contents of the −10 mm material for lump ore A were notably distinct from that of the +10 mm sized particles, with relatively much higher Fe and lower Mn. The major element chemistry of the −1 mm material was especially distinct, with relatively much higher SiO2 and Al2O3 contents. However, the kaolinite quantified by XRD was very similar for all lump ore A size fractions, which was similar to the kaolinite content by XRD for each size fraction for lump ore B. The difference in the Al2O3 and SiO2 contents can be apportioned, at least in part, to the presence of illite and lithiophorite in lump ore A, quantified by XRD as 3–7 wt-% and 5–10 wt-%, respectively, by size fraction, which were absent, or present in trace quantities only, in lump ore B.
There were also notable differences in the trace element chemistries of the two lump ores. Lump ore A had higher Li, Co, Ni, Zn and Cu contents than lump ore B, but lower P. Many of these trace elements are known to be present in lithiophorite (e.g. Li, Co and Ni), while P may be present in goethite or pyrolusite (e.g. Pracejus and Bolton 1992). SEM and EPMA analysis indicated partial replacement of some Mn minerals by other Mn minerals (e.g. nsutite or cryptomelane/hollandite by lithiophorite), or gangue minerals by Mn minerals (e.g. illite by lithiophorite), leading to mixed probe analyses (e.g. high in Mn, Fe and Al in some instances) and also the possible presence of structural Mn in illite (Fonteneau, pers. commun.).
XRD analysis of both lump ores revealed a very high background level which was initially interpreted to reflect a very high level (i.e. 68–77 wt-% by size fraction for lump ore A) of ‘amorphous’ or very fine grained or poorly microcrystalline material in the sample, as this amount of poorly microcrystalline was not readily apparent during optical examination of selected lump ore particles, especially for lump ore B. Sub-samples of the −1 mm size fraction of the ‘lump’ ore A were subsequently reanalysed at two different laboratories. This size fraction of this ore was considered to have the greatest potential for high levels of X-ray ‘amorphous’ material. Interpretation of these diffraction patterns led to the conclusion that the high background level was actually a series of broad diffraction peaks, most likely reflecting the presence of significant nsutite. This was in agreement with the qualitative optical microscope examination which revealed significant amounts of pyrolusite/nsutite in the selected particles.
The relatively higher proportion of more friable, microporous particle types with an earthy feel/lustre identified in lump ore A during hand sorting was in agreement with the XRF, XRD and EPMA data which indicated a relatively higher proportion of mica (likely illite) and lithiophorite (and possible todorokite) compared to lump ore B. These minerals have a lower macro and microhardness, lower density and tend to be more microporous than other ore minerals present, e.g. cryptomelane, pyrolusite and nsutite.
Particle apparent densities ranged from 3.01 to 5.13 g/cm³ (mean of 4.18 g/cm³), particle envelope densities ranged from 1.90 to 4.31 g/cm³ (mean of 3.07 g/cm³), while the differences between the particle bulk and envelope densities (regardless of sign) ranged from 0.07 to 3.23 g/cm³ (mean of 1.13 g/cm³) (Figure 8). The envelope densities better reflect the particle and mineral texture observed in hand specimen, by which the particles were assigned to specific ore groups, as all particle porosity is taken into account, whereas the apparent densities better reflect the mineralogy of the particles and the combined input of their respective densities.
Apparent and envelope density determinations for selected sectioned lump ore particles (−20 + 15 mm) sorted by apparent density measurements.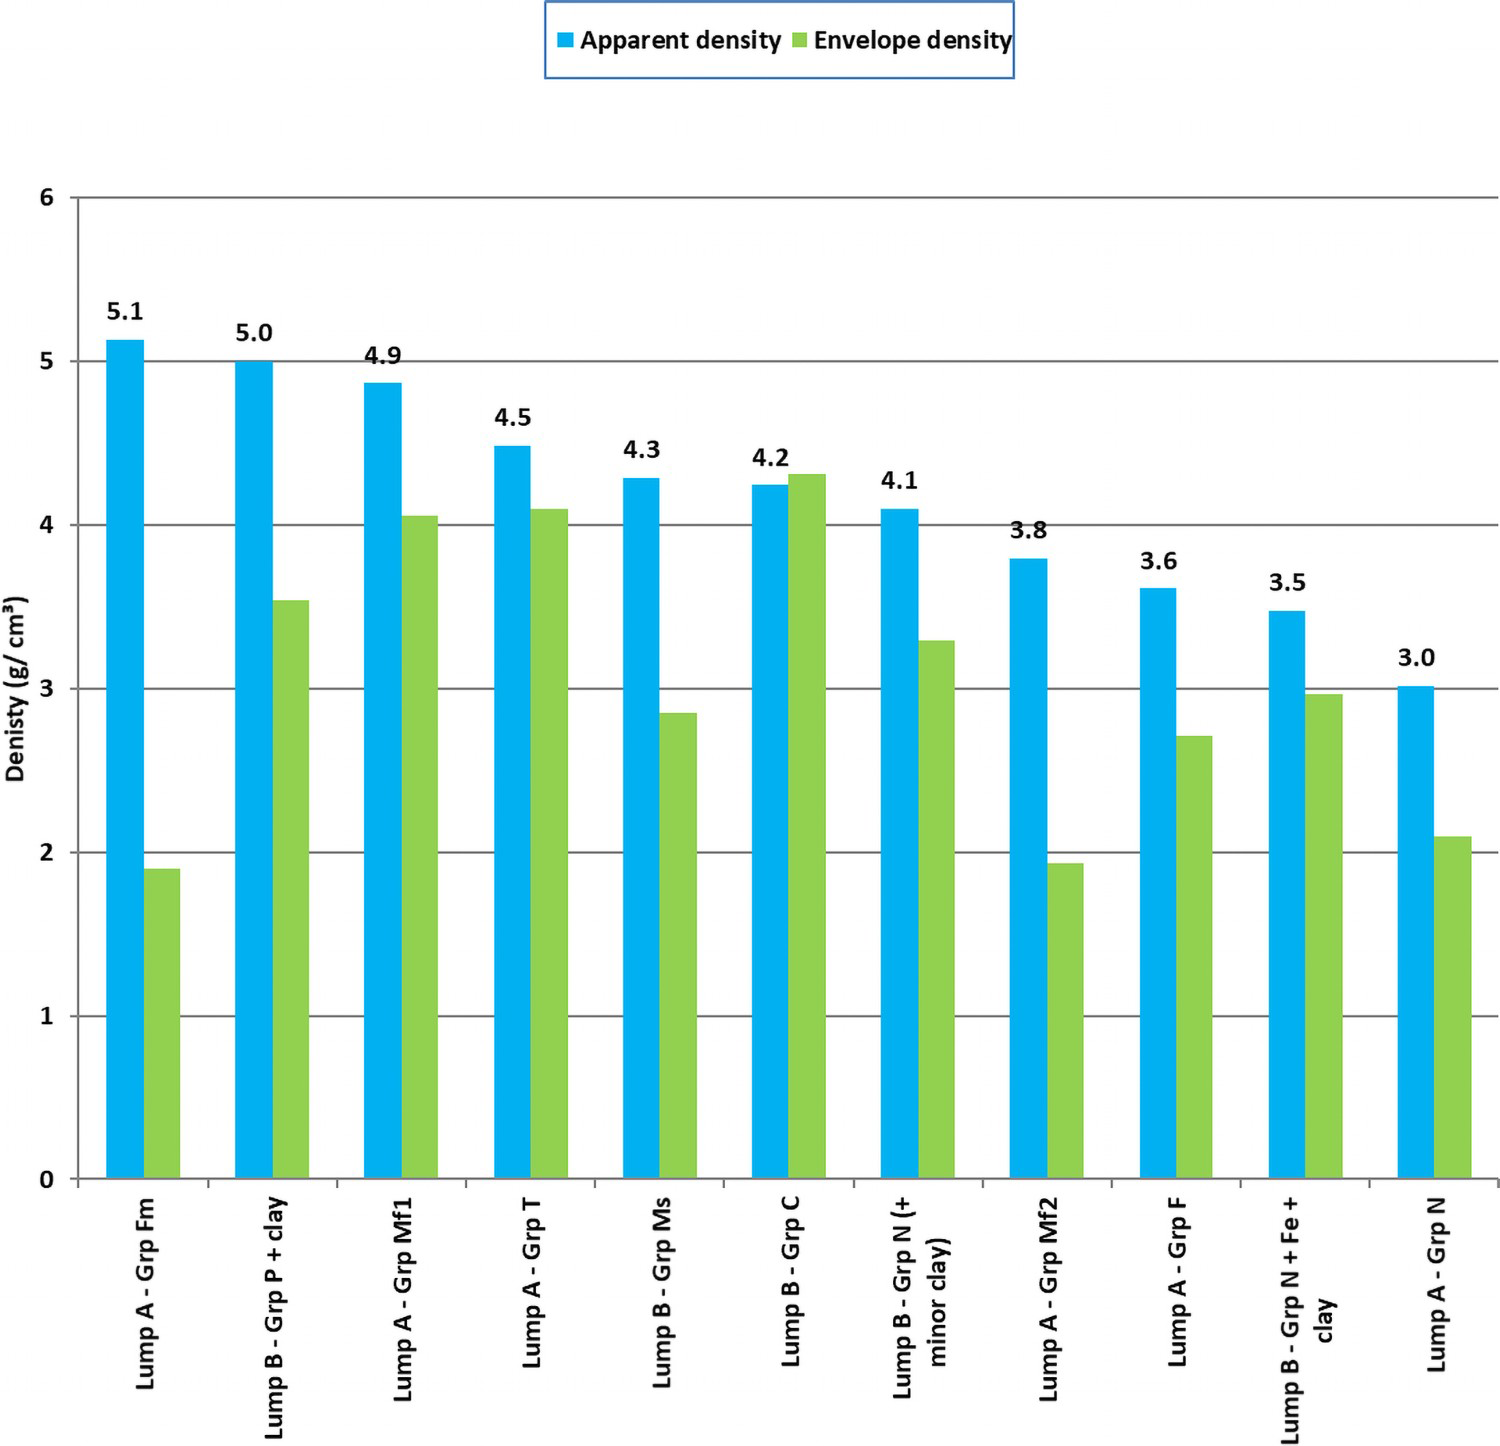
Ore group C (see Table 6 and Figure 9(a)), a dense conchoidal particle of Mn oxide from lump ore B (most probably a mixture of cryptomelane and lesser pyrolusite), exhibited the smallest differential between apparent and envelope density (0.07 g/cm³). Cryptomelane has a listed density of 4.17–4.41 g/cm³ whereas pyrolusite has a listed density of 5.04–5.08 g/cm³ (source: http://www.mindat.org/). The envelope density was actually higher than the apparent density in this instance only, most probably reflecting the respective error margins of the two measurement techniques, as much as the very low porosity of the particle.
Photographs of selected lump ore particle textures subjected to apparent and envelope density testing.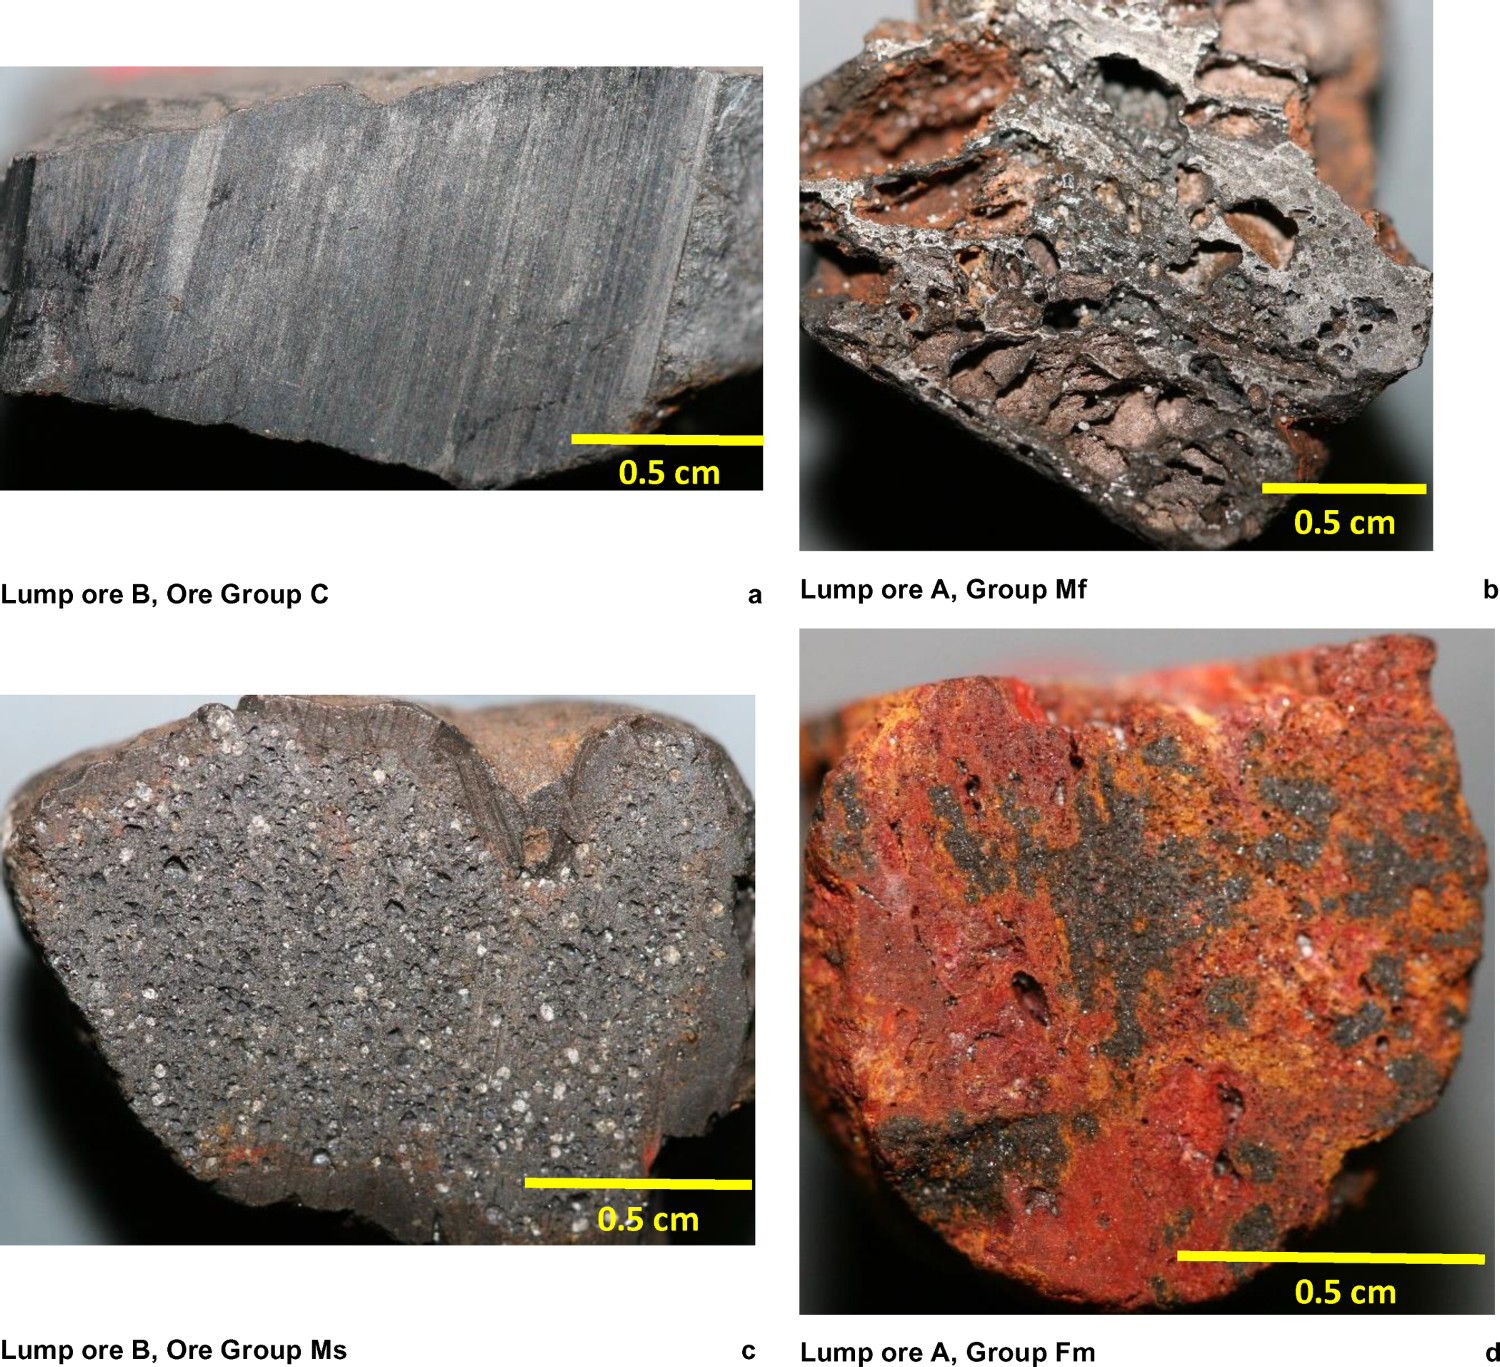
The particles with the largest differential between apparent and envelope densities (i.e. >1 g/cm3) were those with obvious larger pore space (‘macroporous’) or those with notable proportions of associated microporous Fe oxyhydroxide and/or clay (Figures 8 and 9(b) and (d)). A Group Ms particle from lump ore B composed of nodular Mn oxide with disseminated visible quartz crystals also had a large differential between the apparent and envelope densities (Figure 9(c)). This was interpreted to arise from the numerous larger pores visible in the sectioned particle that were not apparent on the external surface of the particle prior to sectioning. The very large differential (>3 g/cm3) between the apparent and envelope densities for a ferruginous particle from lump ore A was interpreted to be due to significant presence of microporosity (Figure 9(d)). The apparent density of 5.13 g/cm3 is similar to the listed haematite density of 5.26 g/cm3.
Implications for further development of Mn ore classification schemes for lump ores
This case study showed that differences in the physical properties of lump ores can be readily determined by hand sorting of lump ore particles into their constituent textural types. The deportment of some forms of silica, iron, and alumina can be ascribed to quartz, goethite/hydrohaematite and clay (e.g. illite/kaolinite). However, reliable determination of the type and relative proportions of Mn oxide minerals present in a particular lump Mn ore particle is a much more difficult task than, for example, determining the type and relative proportions of Fe oxide minerals present in a particular lump Fe ore particle. The task is complicated in tetravalent Mn-dominated ores by the following major attributes: the potentially larger number of Mn oxide/oxyhydroxide minerals (also some Mn silicates such as braunite), the potential for Mn oxide minerals to replace one another and/or to be intimately intergrown on a very fine scale, the similar appearance of hard, dense Mn oxide minerals in hand specimen, e.g. pyrolusite and cryptomelane, and the variable chemistry but similar appearance of the coronadite-group minerals.
Historically, geologists identified hard, dense Mn oxides which did not stain their hand when handled in outcrop/hand specimen as ‘psilomelane’ (literally ‘hidden black’ – e.g. Frenzel 1980; Post 1999). In contemporary use, psilomelane is now not a recognised mineral name and its accepted equivalent is romanechite (Table 1). By way of comparison, more friable, earthy microporous, Mn oxides/oxyhydroxides were historically referred to as ‘Mn wad’ by field geologists. Wad was likely composed of some combination of earthy, often poorly microcrystalline Mn minerals such as todorokite, birnessite, vernadite, lithiophorite, and perhaps some more porous, hydrous forms of the coronadite-group minerals (e.g. cryptomelane). To some extent, the Mn mineral constituents of these samples could be distinguished by reflected light optical microscopy. However not until the development of techniques such as Rietveld refined XRD, SEM/EPMA, HRTEM, Thermogravimetric Analysis (TGA), etc. has it been possible to reliably distinguish all the Mn mineral constituents of Mn ores.
Another important distinction between the hand sorting of lump Fe ores and lump Mn ores into geometallurgical types is the greater number and more complex deportment of major and minor elements in Mn ores. The most notable major element impurities in Mn ores with relatively high levels are Fe, Al, Si, K, Ba and to a lesser extent Ca, Na and Mg. All of these elements can be present in significant quantities in Mn ore minerals and some can be present in several minerals (e.g. Fe). Important minor element impurities with technical or environmental implications include P, Hg and B (e.g. Hunsbedt et al. 2007). Using Al as an example, for tetravalent Mn-dominated ores, Al can be present in the gangue minerals kaolinite or gibbsite, as well as illite, but also in the Mn minerals lithiophorite, todorokite, and cryptomelane, as well as in trace amounts of other Mn minerals, e.g. nsutite (e.g. Frenzel 1980; Ostwald 1984; Mohapatra et al. 1995; Post 1999). Lithiophorite in particular can contain up to 13% Al, so the ability to reliably identify it in hand specimens of Mn ore in which it occurs in reasonably significant quantities would be a great benefit for alumina deportment in supergene/lateritic Mn oxide deposits in particular.
Therefore, when hand sorting manganese lump ore particles into geometallurgical material types, it is beneficial to include supplementary information (e.g. EPMA, XRD, IR spectroscopy, conductivity, magnetic susceptibility, etc.) to complement observations made about particle texture and physical properties, if it is to better characterise Mn ore mineralogy and major element deportment on a particle by particle basis. Over recent years, automated on-line sorting of lump ores particles have utilised a variety of sensors to distinguish, for example Fe-rich and Mn-rich particles in ferromanganese ores (e.g. Gryshan and Kulish 2015).
Conclusions
Geometallurgical classification of ore samples (at the mine, product or size fraction scale) enables particle inputs to downstream process models to incorporate inherent mineralogical and textural variability in Mn ore particles.
Particle-based classification schemes were devised to characterise samples from two different manganese ore deposits during manual point counting of fines ore and hand sorting of lump ore size fractions. There was good correlation between major element trends by size fraction with textural/mineralogical trends by size fraction for the fine ore samples. Differences in the size distribution, physical properties (e.g. particle hardness/microporosity, bulk and apparent particle density) and head chemistry of two different lump ore samples were well characterised by differences in the textural and mineralogical characteristics of the major ore groups identified. Ore group characterisation in hand specimen or under the optical microscope was supplemented by qualitative or quantitative XRD and selected spot EPMA.
For the first case study, positive correlations by size fraction were evident between the proportion of aluminosilicate-bearing ore groups and Al2O3 content, the ratio of Mn oxide/Fe oxide ore groups and the Mn/Fe content, the proportion of cryptomelane-bearing groups and the K2O and BaO contents, and the ratio of hard to moderately hard + friable particles and the K2O + Ba + Na content.
For the second case study, good agreement was observed between the types of predominant ore groups/material types in the two different ores and their different size distributions, major and trace element chemistries. Different ore groups had clear variances in their envelope and apparent particle densities and in the differences between these two densities, based on observed distinctions in their mineralogy, mineral texture and particle texture.
These preliminary studies show that there is considerable scope for the further development of particle-based Mn ore classification schemes that incorporate mineralogy, mineral texture, particle texture, physical properties such as hardness and, where possible, mineral chemistry inputs. Such generic schemes would need to be flexible enough to characterise the different mineralogy and textures present in supergene Mn4+-oxide dominated deposits and metamorphic-hypogene Mn2+–Mn3+-oxide-silicate deposits due to differences in their predominant ore and gangue mineral assemblages. Therefore, these schemes would need to be able to be somewhat flexible to account for different modes of ore genesis. For example, some hypogene oxide facies Mn ore deposits might also need to incorporate modified or additional ore groups to account for the significant presence of lower valence Mn ore minerals such as braunite, and perhaps bixbyite and hausmannite, as well as those of Mn4+-oxides. It is also common for many hypogene Mn ore deposits to a least have a small supergene overprint.
Such schemes would ideally be utilised from the resource development and evaluation phase through to blending of ores with distinctly different material types to improve agglomeration and alloy production performance. The need to use several high-end techniques to delineate material types when characterising Mn ores is a potential practical limitation of the approach. However, portable and minesite analytical techniques such as HyLogger™, GEOSCAN and XRF are increasingly being utilised during resource exploration and extraction to provide detailed chemical and mineralogical data (Haest et al. 2013; Durance et al. 2014; Balzan et al. 2019). Work is ongoing in the iron ore industry to use these or similar techniques to define and characterise not just ore mineralogy but also material types (Haest et al. 2017).
Ultimately, these classification schemes would be capable of providing inputs to models for processes such as beneficiation of lower grade ores, agglomeration of fine ores and electric arc performance of lump ore, as is now increasingly commonplace and accepted in the Fe ore industry (cf. Donskoi et al. 2016; Suthers et al. 2016).
Footnotes
Acknowledgments
The authors wish to thank all who have contributed to the work reported, in particular Mark Raven and Lionel Fonteneau for XRD interpretation and their valuable comments, Tirsha Raynlyn for pycnometry and Bureau Veritas for XRD and XRF analysis. The authors are grateful to Dr Mark Pownceby for reviewing a draft of the manuscript and to CSIRO Mineral Resources for funding the work and for permission to publish.
Disclosure statement
No potential conflict of interest was reported by the author(s).