
Abstract
ABSTRACT
In this study, by using the algorithm of the U-statistic and fractal methods and combining them with each other, a new combined method as U values fractal model (U-N and U-A) is introduced. Then, the proposed method is employed to determine the boundaries of background and anomalous populations. Results show that in U-N and U-A fractal models, the first fracture boundary is much clearer and more accurate than previous fractal models (C-N and C-A) in the same condition. In U-N model, due to the nature of the U method algorithm, there is a discontinuity as exact threshold between background and anomaly that in U-A model, this does not exist due to the homogenization of U values. In this method, the exact threshold between background and anomaly is determined by U-statistic method and by its combination with the fractal method, in each population, sub-populations are identified more accurately and simply than concentration fractal model.
Keywords
Introduction
Exploratory geochemistry, based on the behaviour principles of chemical elements and their group relations and also careful study of their properties, seeks to find the keys to identify promising areas and mineralisation zones. Exploration techniques, including geochemical explorations, have proven their effectiveness in searching for blind deposits in recent decades. Characteristics of geochemical explorations are discovery of low-grade surface mineralisations or high-grade deep mineral deposits (Butt and Mazzucchelli 2010; Hezarkhani and Ghannadpour 2015a).
Geochemical explorations are especially important for deposits that leave larger halos than the deposit itself. Geochemical sampling environments include water and soil samples (undercover areas), stream sediment samples and rock samples (rock outcrop areas and core-drilling) environments. These studies by using modelling geochemical anomalies, based on the type of sampling at the study area, could lead to the identification of geochemical halos formed at the surface of the deposit and also mineralisation on the surface (surface sampling) or lead to the identification of mineralisation zones at depth (borehole sampling) (Hezarkhani and Ghannadpour 2015a; Hu et al. 2020).
Familiarity with geochemical models is a good guide for exploring mineral reserves. Sampling and geochemical mapping of areas, where tectonic information, lithological models and alteration models confirm the existence of a mineral potential, will lead to a better understanding of the mineralisation system, its location and expansion (Chardon et al. 2018).
Parkam located in the north of Shahr-e Babak (Kerman province) as a copper porphyry system is considered as an uneconomic reserve (nearby to cut off grade). In fact, the study area lies in the Kerman Copper Belt which encompasses a number of important porphyry Cu±Mo deposits (PCDs) of Iran (e.g. Sarcheshmeh porphyry Cu–Mo deposit and Miduk) and therefore has metallogenic importance (see below). Additionally, several traces of old copper mining and smelting activities are observed at Parkam. Kerman belt, which forms southern section of metallogenic country of Urumieh-Dokhtar (Sahand–Bazman), is the most significant porphyry copper belt in Iran (Figure 1) (Hezarkhani and Ghannadpour 2015b). Therefore, conducting research and complementary exploratory studies especially geochemical exploratory studies by applying the best approaches to follow distributions is pretty vital in the Parkam porphyry system.
Litho-tectonic zones of Iran. Enlarged part shows the location of the Parkam porphyry system and the giant Sarcheshmeh porphyry Cu–Mo deposit. Hatched zone refers to the Sahand–Bazman strip (modified from Berberian and King, 1981).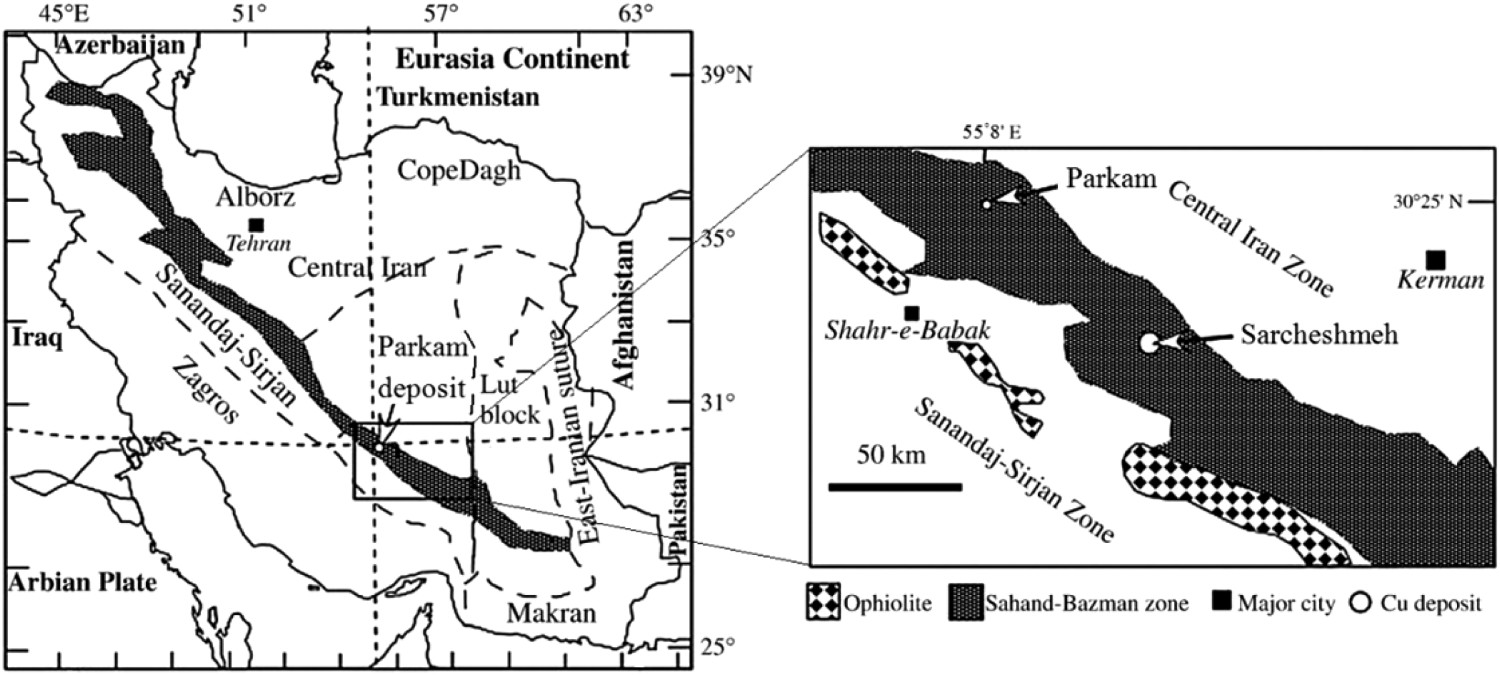
PCDs are the main source of copper (Cu) and molybdenum (Mo) worldwide. The deposits are commonly associated with Mesozoic-Cenozoic magmatic belts that occur in subduction- and collision-related tectonic settings. A typical PCD would be 1–2 km across, with one to several hundred million tons of ore averaging a half to 1% copper. Figure 2 shows idealised cross-section through a PCD along with its alteration halos (Lowell and Guilbert 1970). The extensive Cenozoic magmatic activities in Iran were associated with the formation of a variety of ores, including PCDs. During the last two decades, NICICO (National Iranian Copper Industries Co.) has been conducting comprehensive exploration throughout the country, particularly in the Cenozoic magmatic terrains. PCDs worldwide share some key features, such as association with shallow intrusions and overall alteration assemblages and mineralisation style; however variations exist from one deposit to the other. Owing to the existence of very important reserves of this mineralisation type in this belt, the spatial distribution of Cu and Mo concentrations (as the two main elements) in areas with a potential for porphyry-type mineralisation is important both for estimating the extent of a primary geochemical halo and for identifying the mineralisation (Jébrak 2006). Moreover, the study of changes in the Cu and Mo concentrations of different zones of alteration can be useful in determining the type of the porphyry copper system (Gent et al. 2011; Xu et al. 2012).
Idealised cross-section of a porphyry copper deposit (modified from Lowell and Guilbert 1970).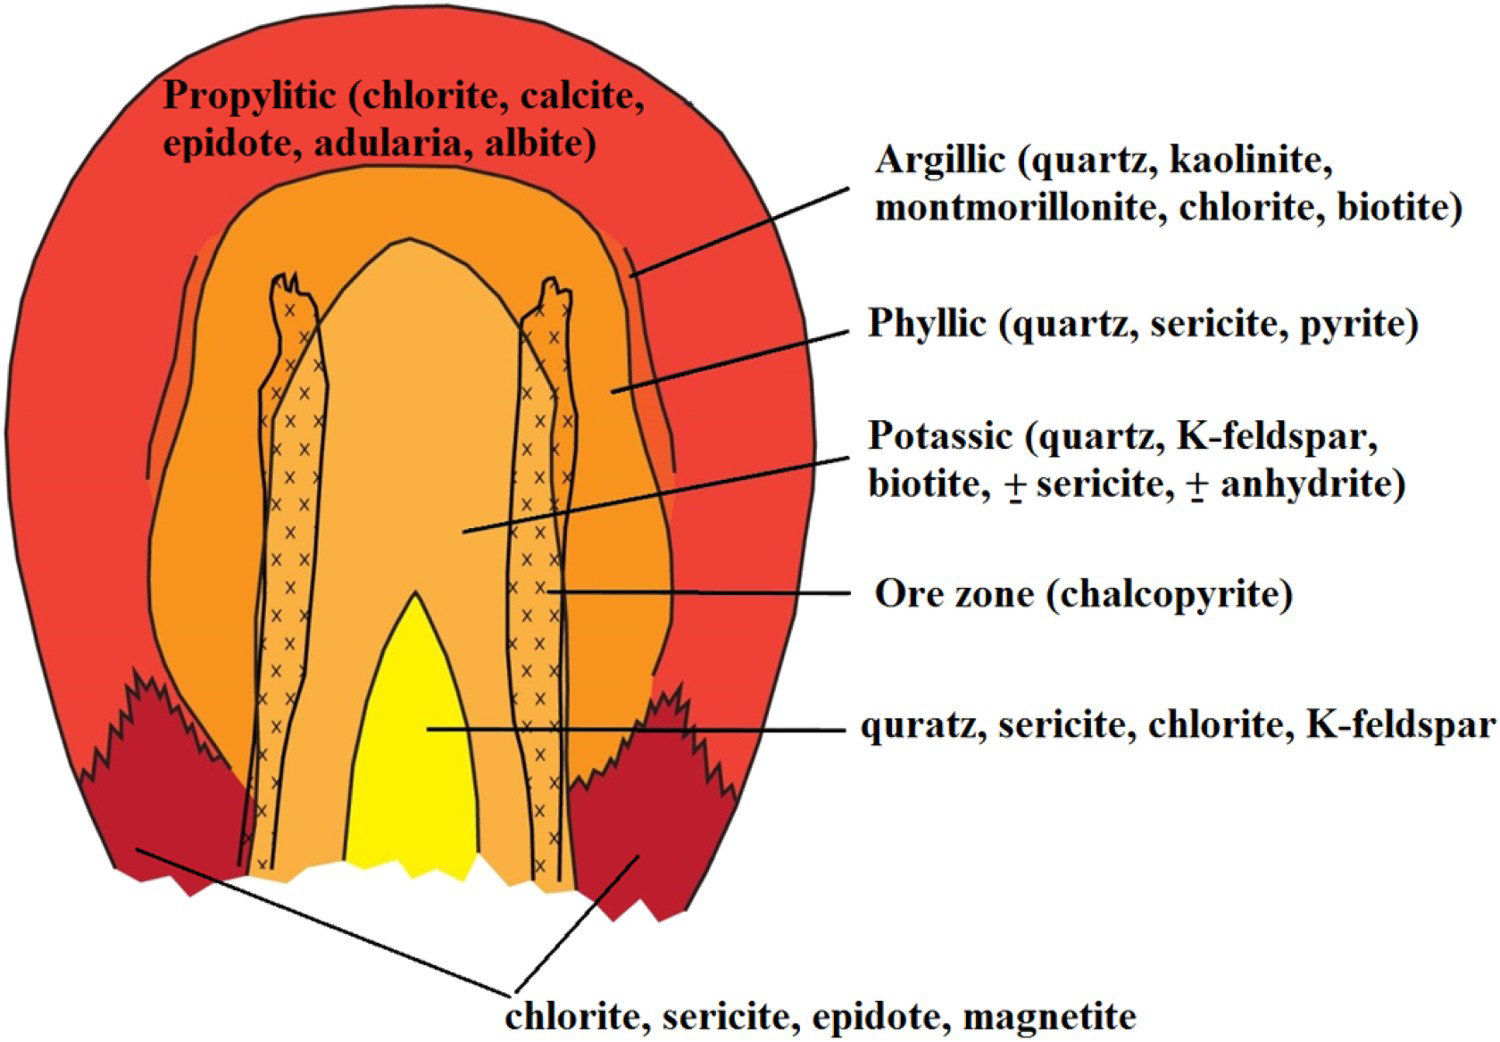
In order to achieve this goal, the statistical characteristics of lithogeochemical data such as the mean grade and variance of different grade variates must be determined to separate anomalous values from background, and to produce maps of mineral prospectivity. To discern geochemical distribution in an area, different statistical approaches have been devised (e.g. Hawkes and Webb 1962; Miesch 1981; Sinclair 1991; Cheng et al. 1996; Goncalves et al. 2001; Li et al. 2003; Agterberg 2009; Zuo 2011; Afzal et al. 2010; Luz et al. 2012; Hashemi and Afzal 2013; Ghannadpour and Hezarkhani, 2015a; Ghannadpour, Hezarkhani, Maghsoudi et al.2015; Ghannadpour, Hezarkhani, Sabetmobarhan 2015; Nguyen and Vu 2019; Gonçalves and Mateus 2019; Liu et al. 2020; Behera and Panigrahi 2021). These methods ranged from simple approaches to complicated ones are divided into the nonstructural and structural ones following a general objective which is based on decreasing the error of distinguishing anomaly from background. The latter includes approaches which consider sampling point coordinates and their spatial relation in the estimation of anomalous areas. As the examples of structural or objective methods, techniques like discriminant analysis, fractal models, fuzzy clustering and U-spatial statistic can be noted (Kramar 1995; Cheng et al. 2000; Goncalves et al. 2001; Li et al. 2003; Afzal et al. 2010, 2011; Zuo 2011; Ghannadpour and Hezarkhani 2016a, 2016b, 2018, 2019, 2020).
The U-statistic method is one of the structural methods. This method is considered as an applicable approach to separate anomalous population from background (Cheng et al. 1996). Actually, it is a window-based method which applies window dimensions for averaging in each particular point by utilising surrounding points. This method is way effective to separate anomaly from background and has been compared with the other separation methods (Ghannadpour et al. 2015b, 2017a). One of the advantages of this method is ability of the U-statistic method in combining with other methods. Because it devotes a new value to each sample as U value (Ghannadpour et al. 2017b; Ghannadpour and Hezarkhani 2018).
One of the major applications of fractal geometry is in estimating threshold and consequently, separating the geochemical anomalies from the background based on the variation of their fractal dimension. If the study area has no anomalies about a geochemical variable and only the background exists in it, fewer increases and decreases appear in the distributions diagram of that variable. Therefore, its fractal dimension will be close to 2. However, as soon as it crosses from the background range and enters the anomalous populations, due to the appearance of high peaks in the variability of the geochemical variable, the fractal dimension increases relative to the anomalous intensity. Therefore, the background and anomalous values could be separated from each other using the difference between the fractal dimensions of the two populations.
There are different algorithms and methods such as variogram analysis, number-size (N-S) model, concentration-area (C-A) model, concentration-volume (C-V) model, concentration-perimeter (C-P) model, concentration-number (C-N) model and fractal model of power spectrum–area to calculate the fractal dimension that were investigated in many studies (Afzal et al. 2010, 2011; Hashemi and Afzal 2013; Hassanpour and Afzal 2013; Nazarpour et al. 2015; Momeni et al. 2016).
In the present study, for employing U-statistic and fractal technique (C-N and C-A models) as two structural methods for separating anomaly from background, U-N and U-A fractal models are introduced for the first time as new combined methods. This method is a combination of two powerful methods and the new method will be expected to be very useful for separating background and anomalous populations and their sub-populations.
Parkam is selected as case study and in order to evaluate the proposed combined U-N and U-A models because this area and its condition (sample type, their grid, alteration map, etc.) is very suitable for validation of methods performance based on previous studies (Ghannadpour et al. 2015b, 2017a; Ghannadpour and Hezarkhani 2018, 2020). It should be noted that sampling in Parkam was superficial and the samples located in sediments were collected either from rock outcrops or from trenches having access to rock. Therefore, this research results will be obtained in the form of geochemical halo distribution models on the surface (prospective area maps of Cu and Mo).
Geology
The Parkam porphyry system, previously named Sarah with the coordinates of 55° 08′ 54″ E and 30° 26′ 24″ N represents an area of approximately 4 km2 (Figure 3(a)), is located in approximately 50 km north of Shahr-e Babak and hosts one of the porphyry systems of the Kerman Copper Belt which is part of the larger Sahand–Bazman zone (Figure 1). This ore deposit is one of the important mineralisation-alteration systems of Miduk ore deposit cluster (Kan Iran Consulting Engineers 2008). There are several traces of old copper mining and smelting activities in the Parkam area such as holes and slags.
The Parkam exploration district. (a) Panorama of the study area (view to the north). (b) Enlarged image of a dacite dome. (c) Enlarged image of the diorite to micro quartz-diorite subvolcanic body (the Parkam porphyry). (d) Enlarged image of a diorite dyke.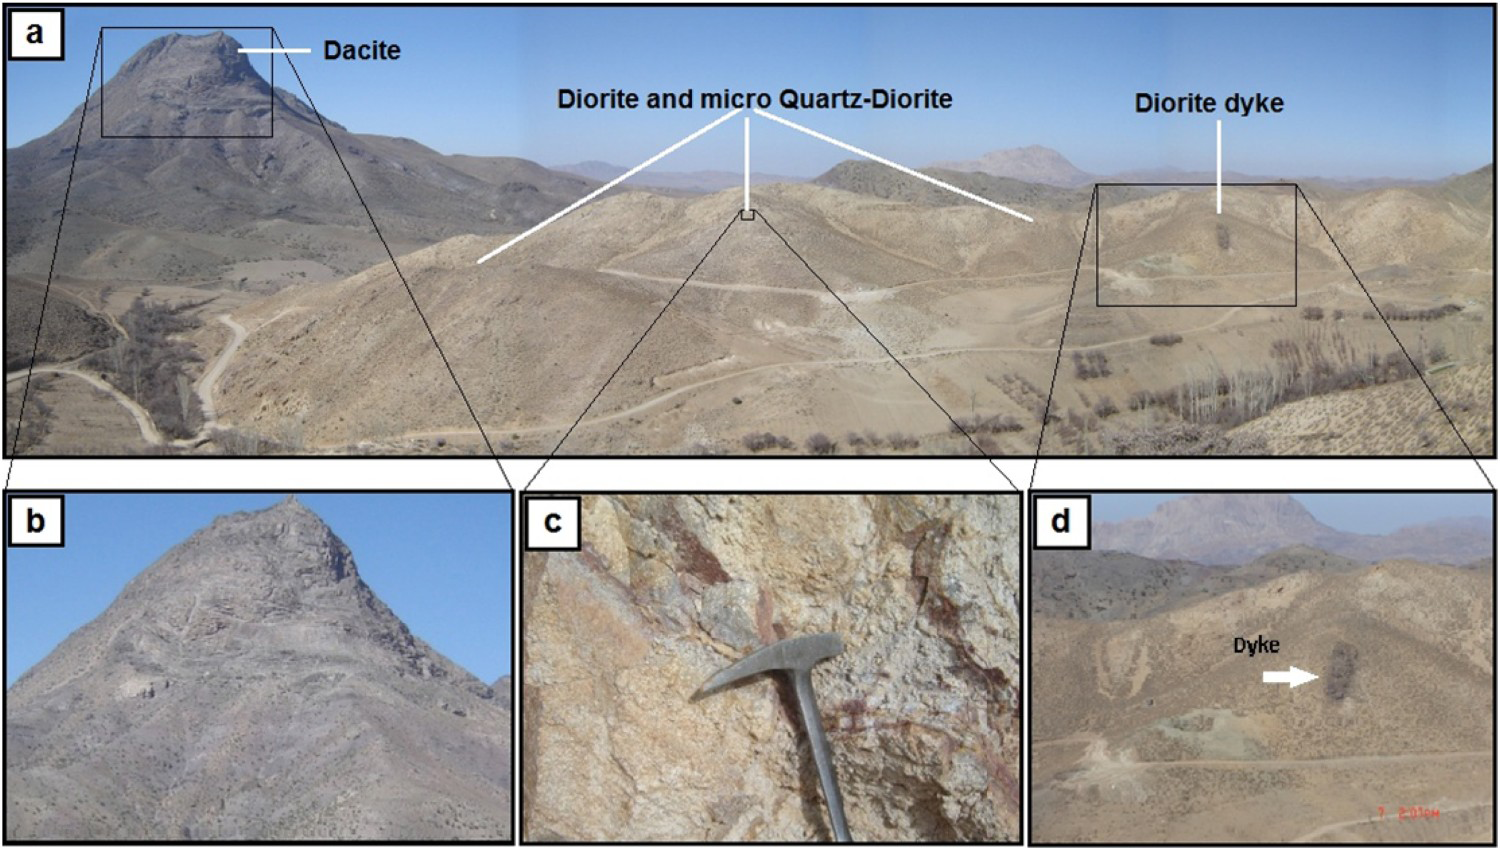
Rock units in Shahr-e Babak sheet (especially Parkam ore deposit which is located in its northern part), mainly consist of Eocene igneous-volcanic rocks. Moreover, northeast part of the sheet belongs to Eocene sedimentary rocks and central parts, especially north parts, could be considered Neogene volcanic-sedimentary rocks domain. Large part of Shahr-e Babak sheet (1:100, 000 geological map) (south part of the area) is Quaternary alluvium (Kan Iran Consulting Engineers 2008).
The summary of geological units (from old to recent) is as follows (Kan Iran Consulting Engineers 2008).
Cretaceous
There are several outcrops of coloured melange existing as accumulations of serpentinite to gabbroic rocks at western parts of the area. These minor outcrops are to be the oldest rocks of the area.
Early Eocene
Early Eocene strata are flysch, conglomerate, red sandstone, limestone and limy to marly sedimentary units chronologically. The oldest formation of Eocene is the flysch sedimentary unit which contains outcrops of Eocene conglomerate units and is intersected by some dykes. Moreover, there are outcrops of Eocene red sandstone and marl units in Eocene volcanic rocks.
Late Eocene
The late Eocene is generally comprised of volcanic rocks which have been described chronologically as follows:
(I) andesitic basalts (II) red tuffs and tuff sediments (III) trachyandesite and trachybasalt rocks; (IX) tuff and tuff sandstone (X) trachyandesite and trachybasalts along with basaltic lavas and agglomerate; (XI) porphyritic rocks having phenocrysts of plagioclase, monoclinic pyroxene and olivine and a matrix of plagioclase, pyroxene, feldspar and microliths.
Early Neogene
Early Neogene strata are comprised of red layers of sandstone and andesitic agglomerate. The sandstone layers could be observed in a small part of northwest of the area and the andesitic agglomerates which are younger than Eocene volcanic have outcrops in some parts of the area as well.
Middle Neogene
Middle Neogene strata are comprised of volcanic rocks of Neogene. The Neogene volcanic sequence begins with pyroclastic material which has been stratiform-deposited and are followed by dacite, biotite and augite-bearing hornblende dacitoid and andesite rocks. Conglomerate and volcanic sandstone units also overlie pyroclastics and spread over several large areas. There are also hornblende andesite rocks (20 m thickness).
Late Neogene
The late Neogene rocks are comprised of altered rocks, diorites and conglomerates. The altered rocks contain sulphide minerals and the altered rocks of Miduk district formed with Neogene volcanic rocks. The conglomerate units of late Neogene are also observed at two small areas of the west part of Shahr-e Babak.
Quaternary
There is a vast land of quaternary deposits formed at northern areas of Shahr-e Babak as well as covers of sandstone and alluvial fan.
The geologic map of the Parkam exploration district was prepared based on detailed field studies (Figure 4). According to observations, a set of volcanic rocks accompanied by recent unconsolidated sediments comprise the host to the subvolcanic body and associated porphyry copper mineralisation in the Parkam exploration district. The volcanics vary from mafic to felsic, but are mostly intermediate in composition and include andesitic volcanic rocks, basaltic to andesitic lavas, and andesitic pyroclastic rocks widespread in the area (Figures 4 and 5(a)). These lithological units are intruded by diorite dykes (Figure 3(d)) and subvolcanic bodies of diorite and micro quartz-diorite (Figures 3(c) and 4) which are associated with alteration system (see the next section; see also Tangestani and Moore 2001). The latest stage of magmatism was accompanied by the emplacement of the dacite dome in the northwestern part of the district (Figure 3(b)).
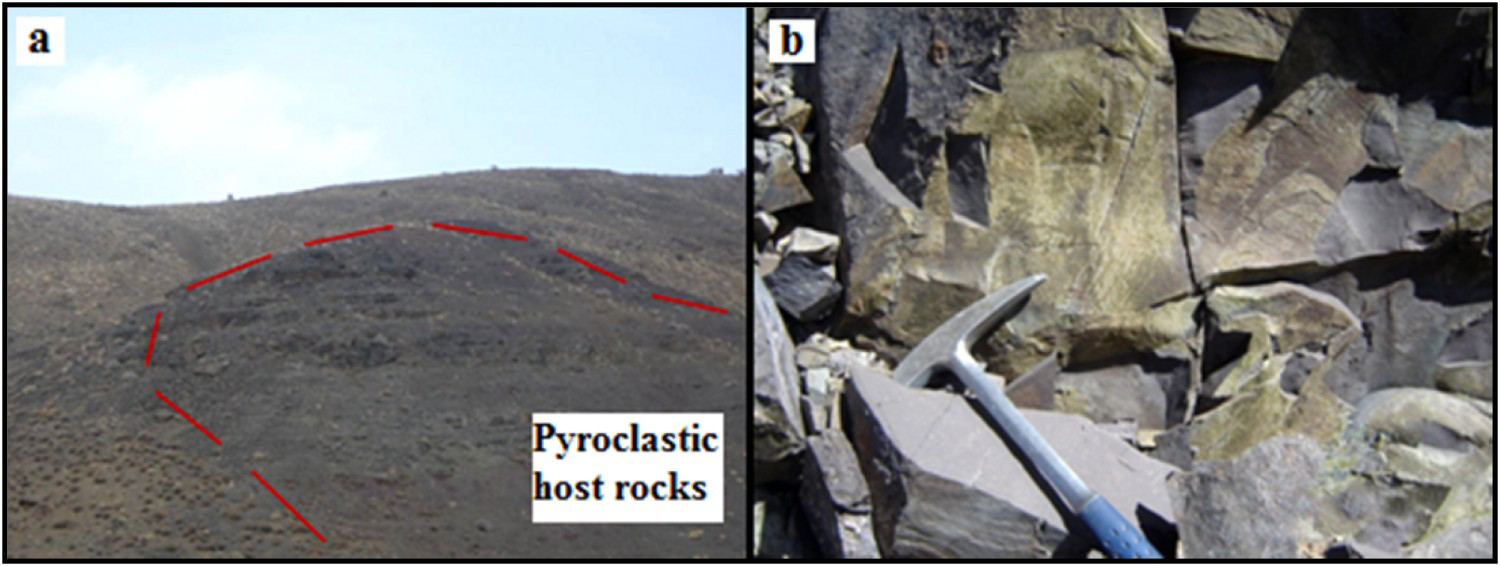
Geologic map of the Parkam exploration district with a cross-section describing the vertical and lateral distribution of different lithological units. Pyroclastic rocks of the Parkam area. (a) Andesitic pyroclastic rocks which are widespread in the study area and constitute the main host lithology to the porphyry system. (b) Epidote in the fractures of andesitic pyroclastic rocks indicating propylitic alteration.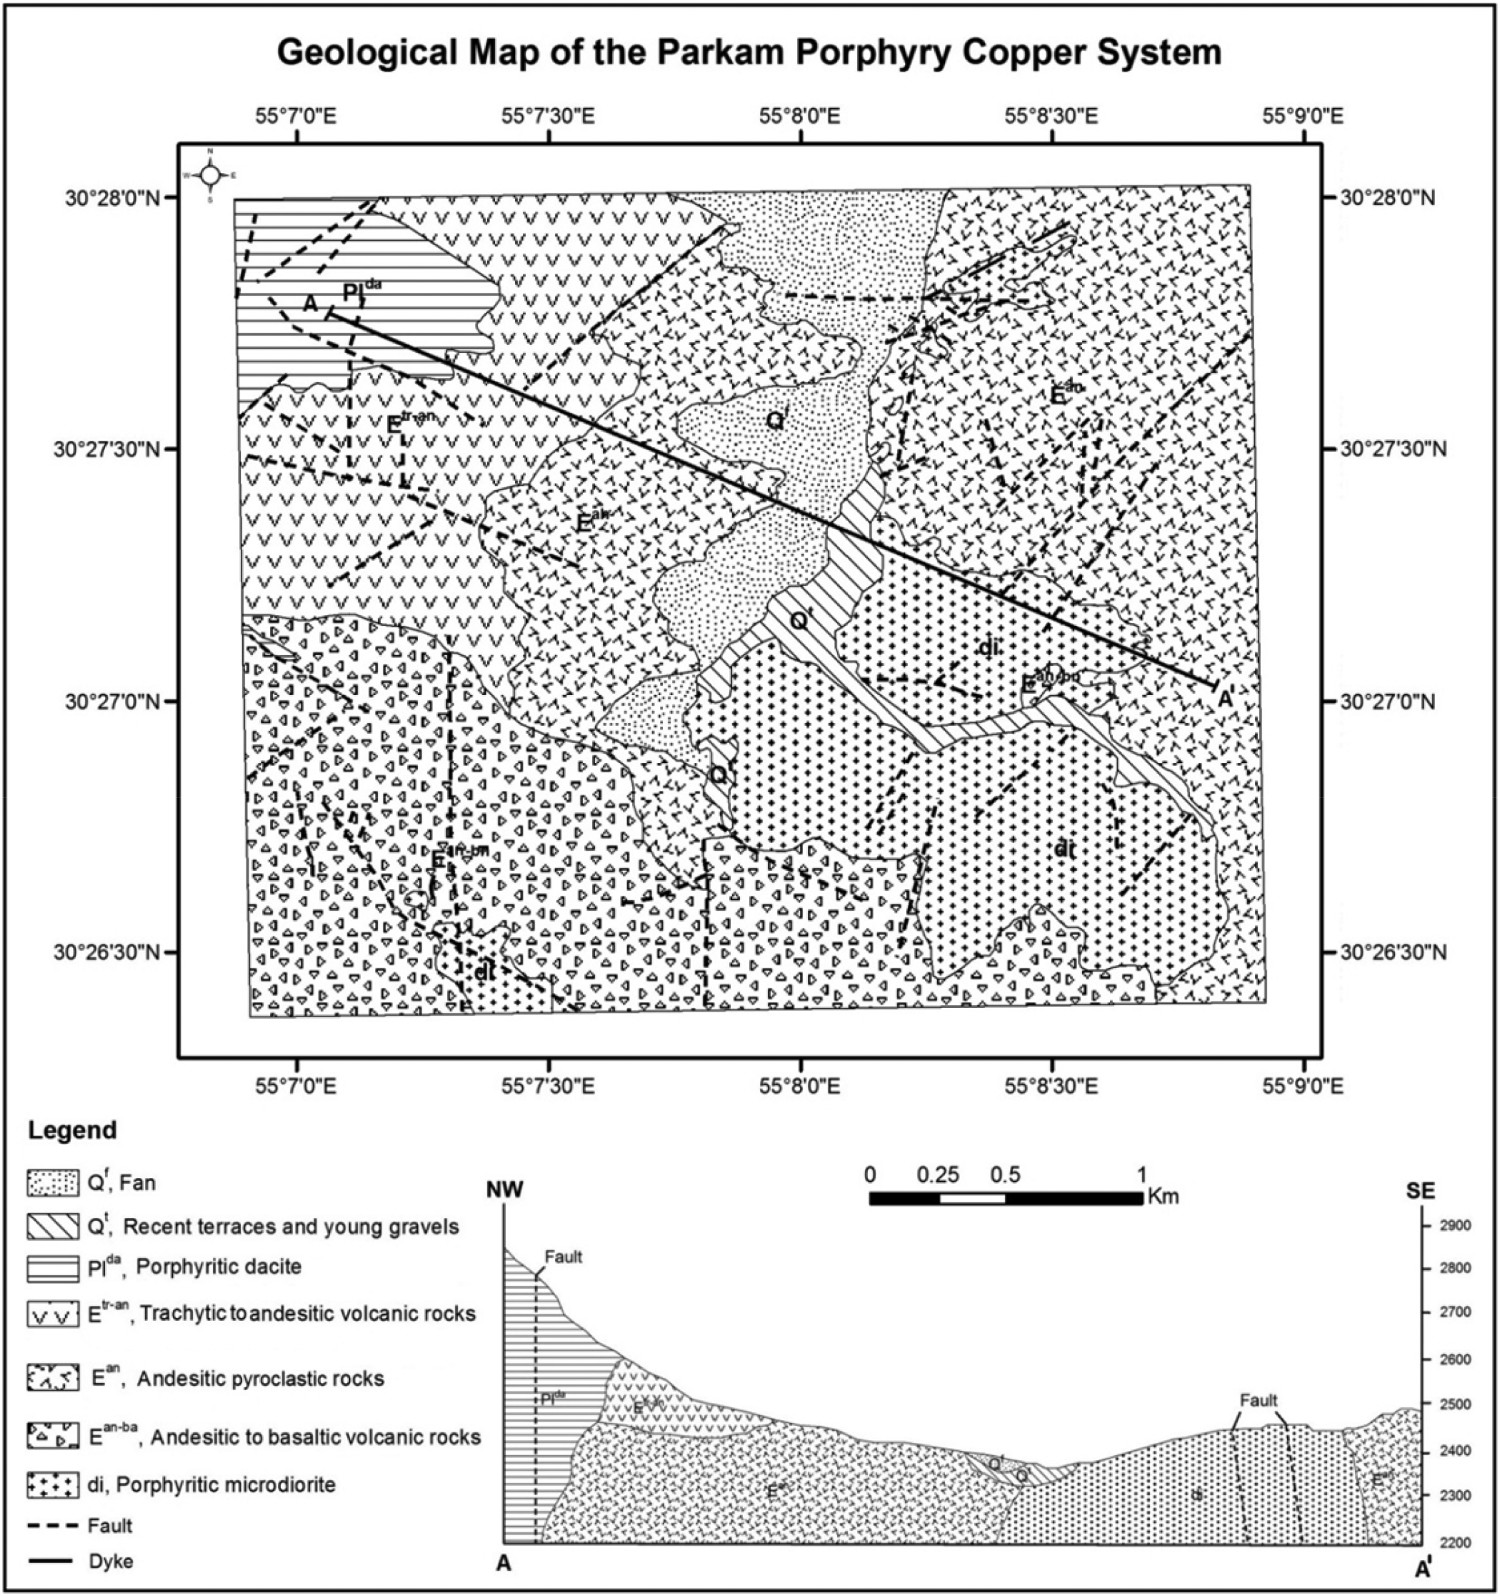
Alterations and mineralisation
Hydrothermal alteration is widespread in the Parkam area and includes propylitic, phyllic, argillic and potassic types in order of extent. The phyllic alteration constitutes the central zone of the alteration system and is associated with the potassic alteration in the east and west, as well as with the argillic alteration toward the south. The propylitic alteration surrounds the other types of alteration in the study area (Figure 6). The presence of the potassic alteration in the peripheral zone of the porphyry system (in addition to the central zone) is a characteristic of the Parkam exploration district (Figures 4 and 6). Expect for the propylitic alteration which extends mostly over the host volcanic rocks (Figure 5(b)), the other types of alteration are associated mainly with the dioritic subvolcanic body (Figures 4, 6 and 7).
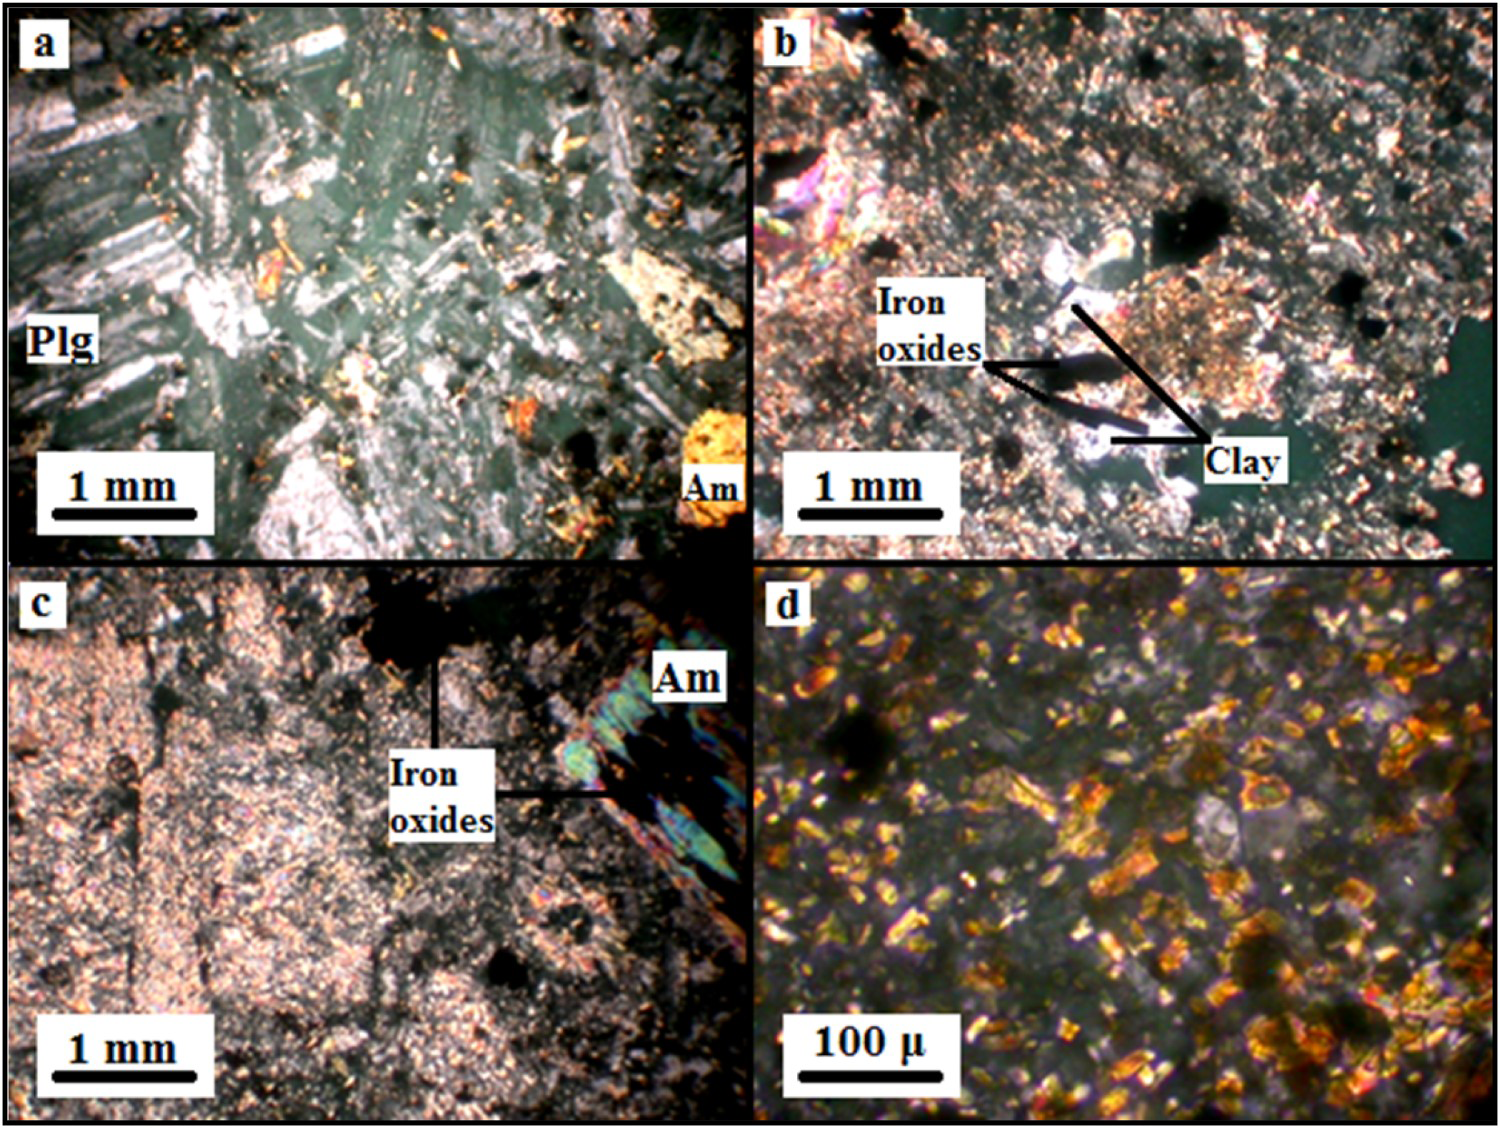
Alteration map of the Parkam exploration district prepared based on field investigations and petrographical data, and a cross-section describing the vertical and lateral distribution of different alterations (Ser: sericite; Qtz: quartz; Py: pyrite; Chl: chlorite; Epi: epidote; Bio: biotite; Mag; magnetite; K-feld: potassium feldspar; Car: carbonates; Clay: clay minerals). Photomicrographs of the dioritic subvolcanic rocks in thin section (XPL). (a) Diorite with unaltered plagioclase and amphibole. The sericites indicate moderate phyllic alteration. (b) Clay minerals associated with iron oxides in a sericitised matrix indicating phyllic and argillic alterations in the subvolcanic rocks. (c) Amphibole crystal altered to iron oxides and chlorite, and intense sericitisation in the groundmass representing propylitic and phyllic alterations in the dioritic rocks respectively. (d) Secondary biotite indicating potassic alteration in the dioritic subvolcanic body (Plg: plagioclase; Am: amphibole).
Mineralisation occurs predominantly as fracture-filling hydrous copper carbonates with subordinate amounts of chrysocolla and primary sulphides at the outcrops of the Parkam porphyry system, and is mostly associated with the potassic alteration and its adjacent zone of phyllic alteration; however, malachite may occasionally be observed in other parts of the alteration system including in the fractures of the pyroclastic rocks of the propylitic alteration zone (Figures 4, 6 and 8).
Surface mineralisation of copper in the Parkam porphyry system. 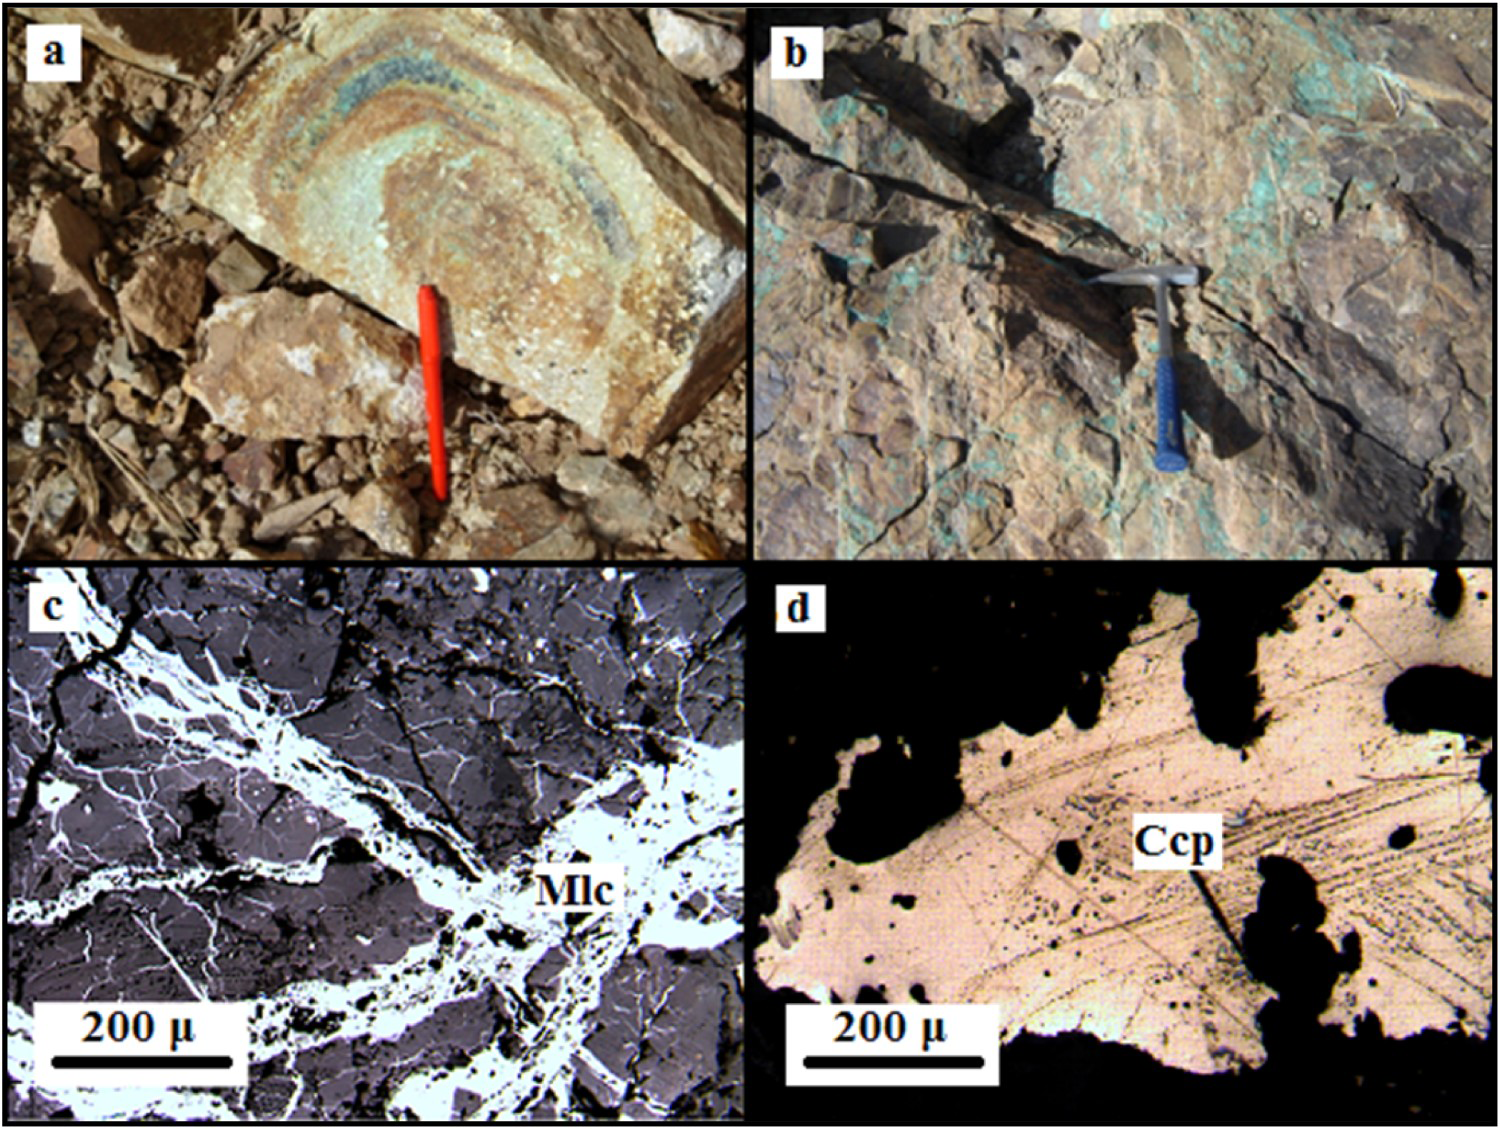
Sampling and geochemical analytical methodology
In the Parkam exploration district, regular sampling grid with square cells having a side of 100 m has been executed. Accordingly, one network of 2 by 2 km in dimensions is considered and each sample is representative of an area of 10, 000 m2. As mentioned before, the samples located in sediments were collected either from rock outcrops or from trenches having access to rock, and mostly shared the lithology of their adjacent igneous units. Locations with no sample in the grid had no access to rock at these locations due either to the absence of outcrops or the relatively great thickness of the sediments or soil that obstructed manual digging.
Regarding to this matters, 377 lithogeochemical samples were collected from 400 numbers of designed cells in the incipient stage of the field operations. The location of sampling points is shown in Figure 9.
Magnified part of the geologic map in Figure 1 displaying the sampling locations.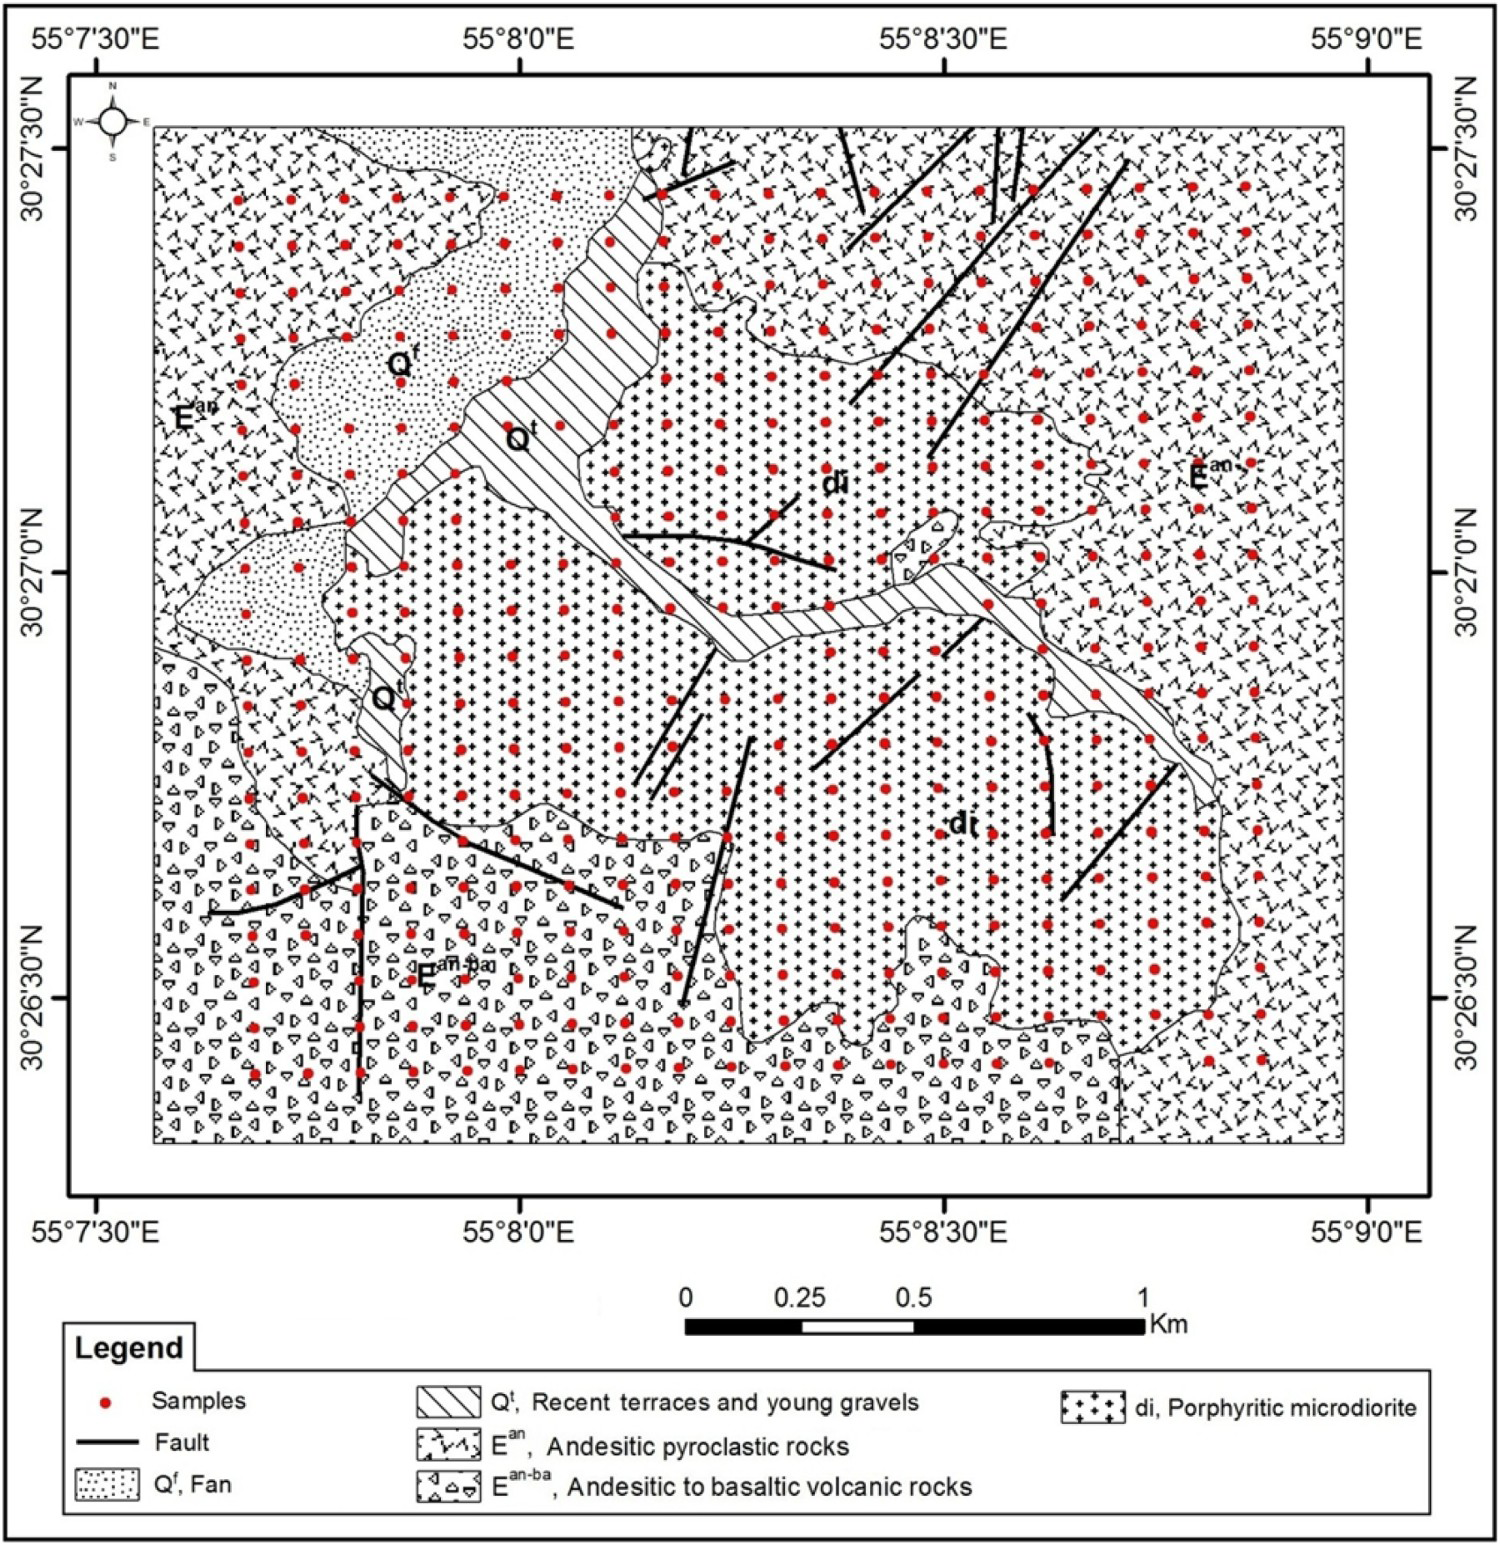
The method of collecting lithogeochemical samples was row-random that was picking up 30 piece of stone with 100–150 g weight from each cell of network and all of existent outcrops with the chip sampling method and at last, mixture of them would be the samples of the cells.
Detection limits of ICP device for different elements.
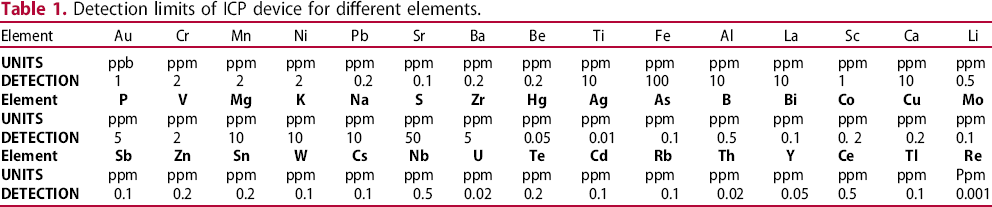
It is noteworthy that in addition to above-mentioned samples, 30 duplicate samples were selected to check the precision.
Methodology
U-N and U-A fractal models
The U value-number fractal method (U-N) is the same as type of the C-N fractal model that the basis of this method is based on the inverse relationship between U values (related to each sample) and the cumulative frequency of each U value along with larger U values. This method is introduced based on the following equation:

The U value-area fractal method (U-A) is also the same as the C-A fractal model that is considered as the most common separation methods for preparing and drawing contour maps. If the value of each contour is considered ρ value, a power equation could be presented as follows:

In the above equation, ρ represents the U value of the element (contour value ρ), A (ρ) denotes the area with concentration values greater than contour value
 is the threshold; values and
 are the fractal dimensions. By plotting the U value-area in logarithmic scale, the dimension of each population could be calculated through the line fitted to it. To obtain the values of U, the U-statistic method should be employed which has been presented as a powerful method to separate anomalous area from background. It is a kind of moving averaging method that changes dimensions of window which is under averaging. Therefore, in each special point, some U-statistics values would be prepared using surrounding points (Cheng et al. 1996).
Arbitrary variable U is defined by:


So, the distance criterion should be determined based on the below quantity which introduces the distance between two points:
 coordinate then the weight of j point is as follows:
So it is obvious that the sample dispersions in the search area should be considered as
At last, the U value is acquired as follows (Cheng et al. 1996; Cheng, 2000):
 and
and
 are mean and standard deviation of all data, respectively. According to the above equation, the U value depends on r value so by varying r different values of U will be appeared. Hence, for each unknown point, different U values should be calculated and finally the greatest absolute value of them should be selected as U value for the mentioned point (Cheng et al. 1996; Cheng, 2000).
Results
Data preparation
Statistical parameters of elements (original sample and logarithmic values).
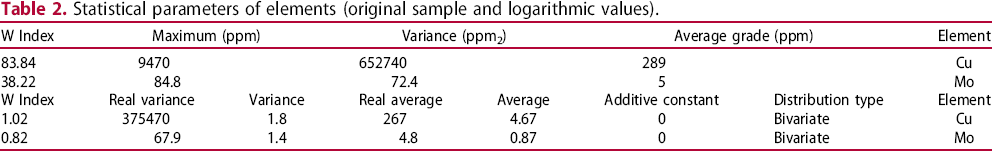
But after taking logarithm of data and conducting research on the population distribution type, the resulted data were available to be processed. By applying some applications (Ghannadpour and Hezarkhani 2012, 2015b; Ghannadpour et al. 2015a; Hezarkhani and Ghannadpour 2015a), distribution of Cu and Mo data is lognormal and W indexes approve it (Table 2). So statistical parameters of data prepared for processing are presented in Table 2, in confidence level of 95%. In order to display lognormal distribution of Cu and Mo, frequency diagram of logarithmic standardised values of them and their probability plots in logarithmic scale are respectively shown in Figures 10 and 11.
Frequency diagram of logarithmic standardised values of Cu (a) and Mo (b). Probability plots of Cu and Mo in logarithmic scale.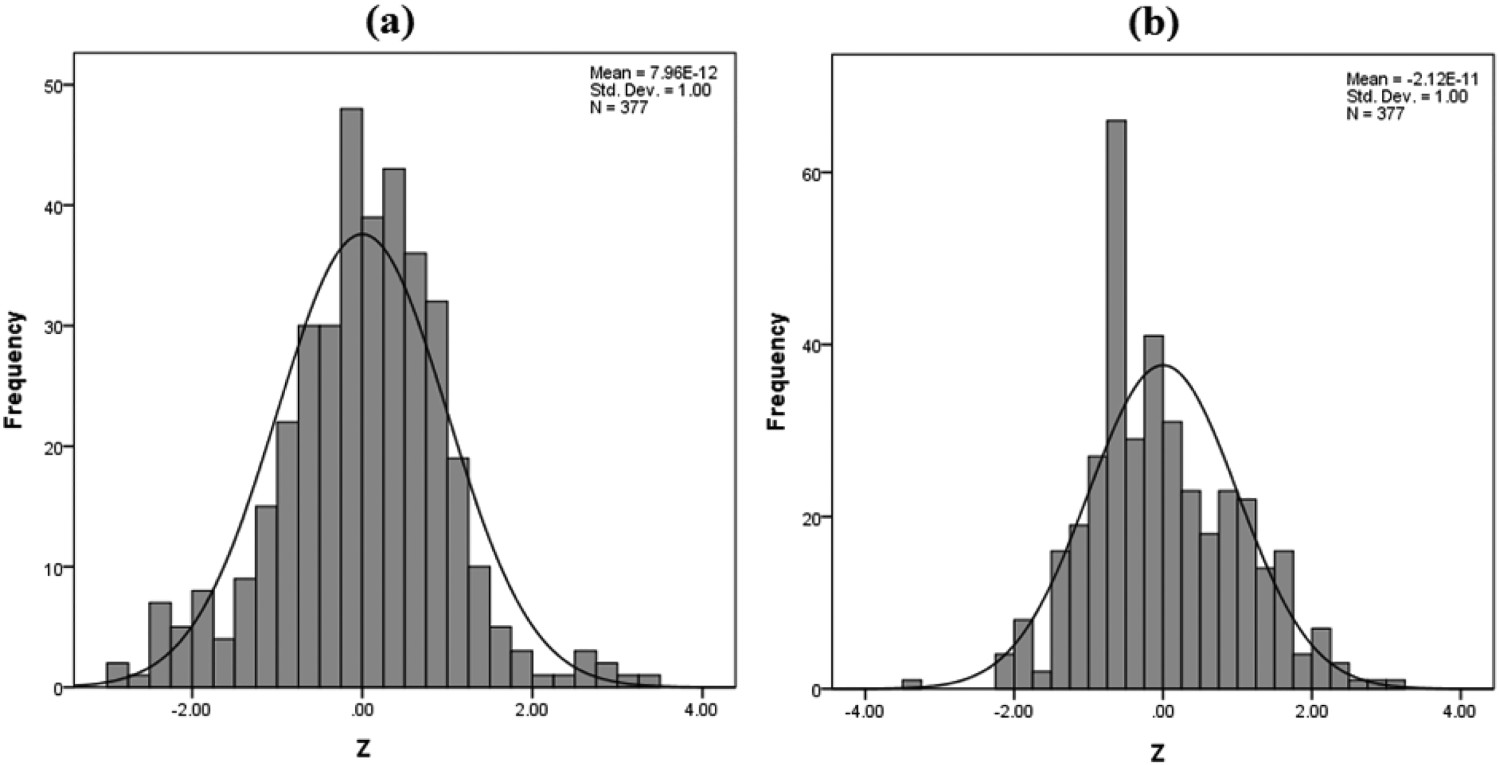
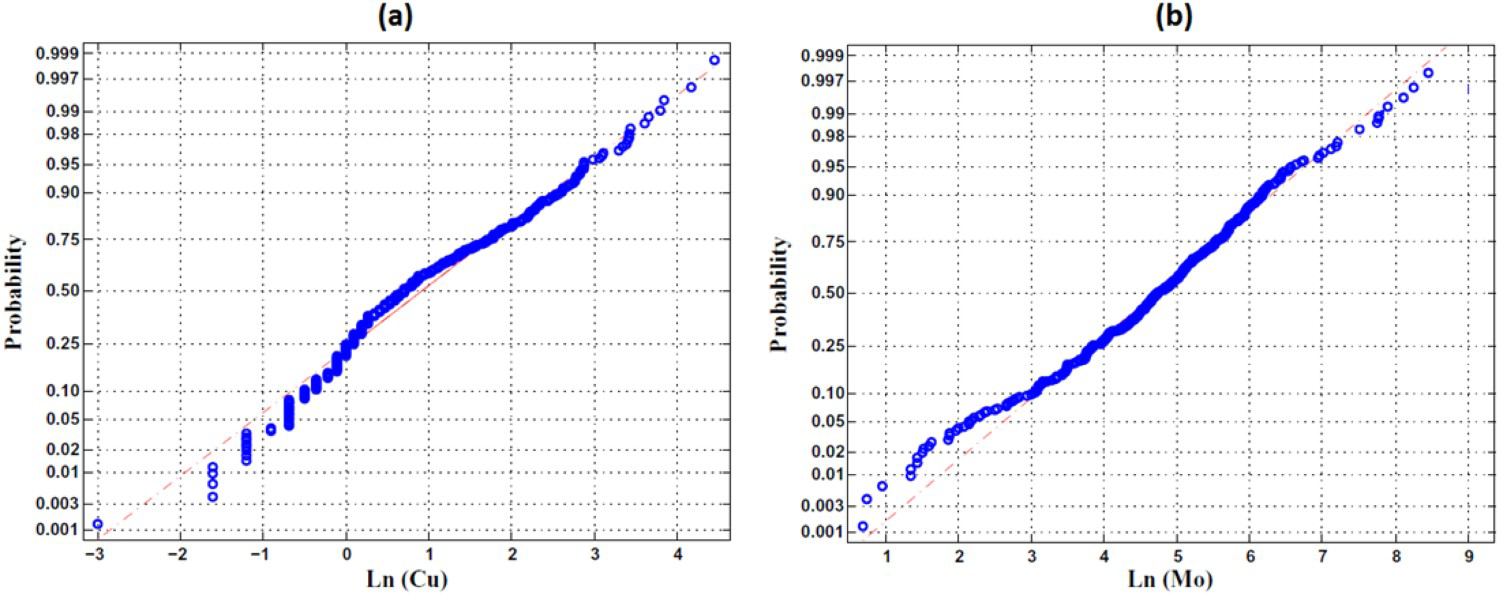
Therefore, according to Figures 10 and 11 and also reported W Index in Table 2, the Cu and Mo data could be considered as a bivariate lognormal population. Moreover, as shown in Figure 11, no point of inflection and curvature can be seen in the probability plots, which indicates that there is no combined data populations.
In the next section, by considering the prepared data, we combine the U-statistics method with the C-N and C-A fractal method for separating anomaly from background. For this purpose, after calculating the U values of Cu and Mo grades, C-N and C-A fractal methods will be applied on U values of Cu and Mo.
Assessment of threshold using C-N and C-A fractal
At the first, the C-N fractal method was applied to the Cu and Mo that results are shown in Figure 12(a, b).
C-N log-log plot for concentration of Cu (a) and Mo (b), the straight fitted lines to geochemical populations of C-N log-log plot for concentration of Cu (c) and Mo (d) and C-A log-log plot for concentration of Cu (e) and Mo (f).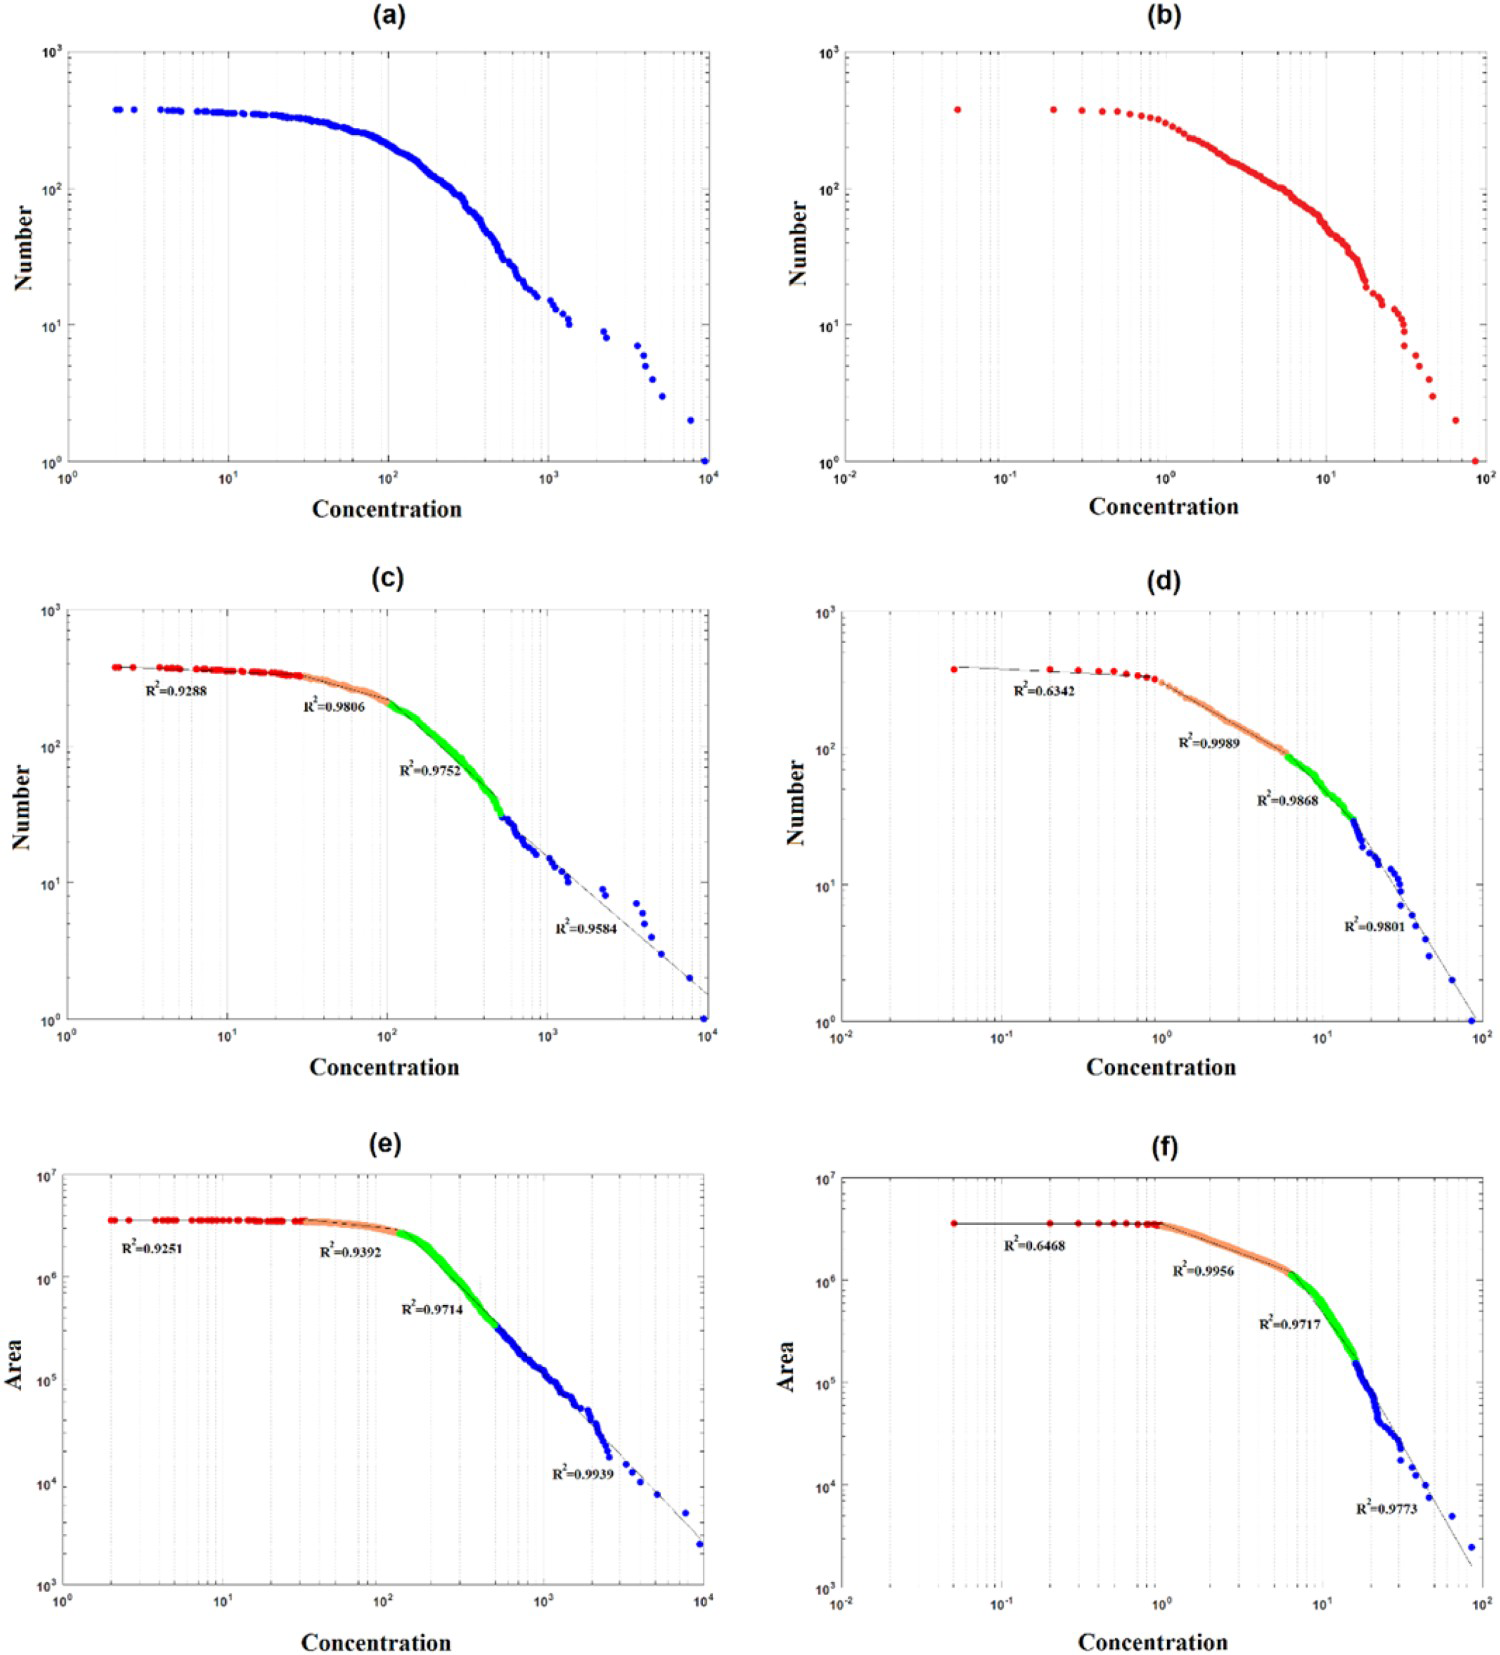
In the following, the different line segments related to geochemical populations were fitted to the above models in order to define geochemical populations (based on least-square regression). The straight fitted lines can be seen in Figure 12(c, d).
Then, at the second step, concentration values in places for which there is no data are generated using applying regular networking by analogy and interpolation, which are possible by different methods and software. For this purpose, inverse distance weighting (IDW) interpolation and Surfer software were selected and finally, by considering 50 × 50 m2 pixels, univariate geochemical surface map of the study area was prepared based on the IDW method and finally, concentrations related to each pixel were calculated.
In the last step, by applying the C-A fractal method to the data related to Cu and Mo elements (reported from Surfer software based on IDW), the C-A fractal model, their threshold and finally the concentration ranges related to populations were resulted. The C-A fractal models are observed in Figure 12(e, f).
Separating anomaly using U-statistics
In order to combine two separation methods (to achieve U-N and U-A models), first the U-statistics method should be applied on the Cu and Mo grades. So, the initial radius is 60 m and its rate of increase is 60 m, too. After calculating U value for each sampling point, frequency diagram of U values distribution for two elements of Cu and Mo with circular neighbourhood for sampling region are provided and has presented in Figure 13.
Frequency diagram of U values for Cu (a) and Mo (b).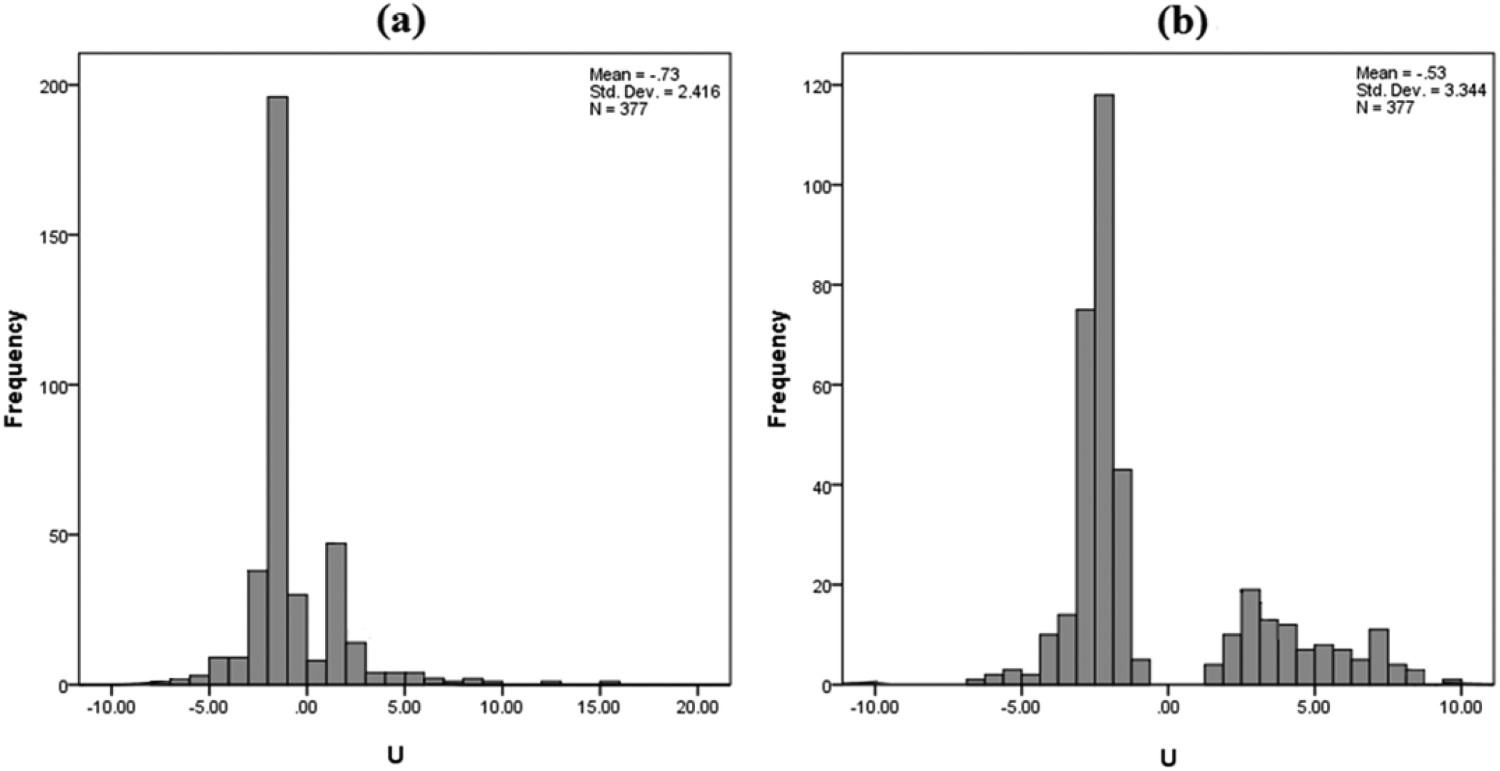
In the next section, C-N and C-A fractal methods will be used in order to apply on the U value of Cu and Mo for introducing the proposed method.
Assessment of threshold using U-N and U-A fractal
In fact, in proposed method, with a simple shift, U values replace the amount of raw data (elements concentration), and finally the effective and efficient U-N and U-A fractal methods are created.
In order to achieve this purpose, the algorithm of C-N and C-A fractal methods will be applied to the U values calculated in section ‘Separating anomaly using U-statistics’ by the U-statistical method.
It should be noted that due to the existence of negative values between the values of U and finally the inability to draw these values in logarithmic diagrams, before running the algorithm, a constant value (C) is added to the matrix of U values. This causes all the matrix values to be positive. (In this study, positive values of C = 8 and C = 7 are considered for Cu and Mo elements, respectively). These results are shown in Figure 14(a, b).
U-N log-log plot for concentration of Cu (a) and Mo (b), the straight fitted lines to geochemical populations of U-N log-log plot for concentration of Cu (c) and Mo (d) and U-A log-log plot for concentration of Cu (e) and Mo (f).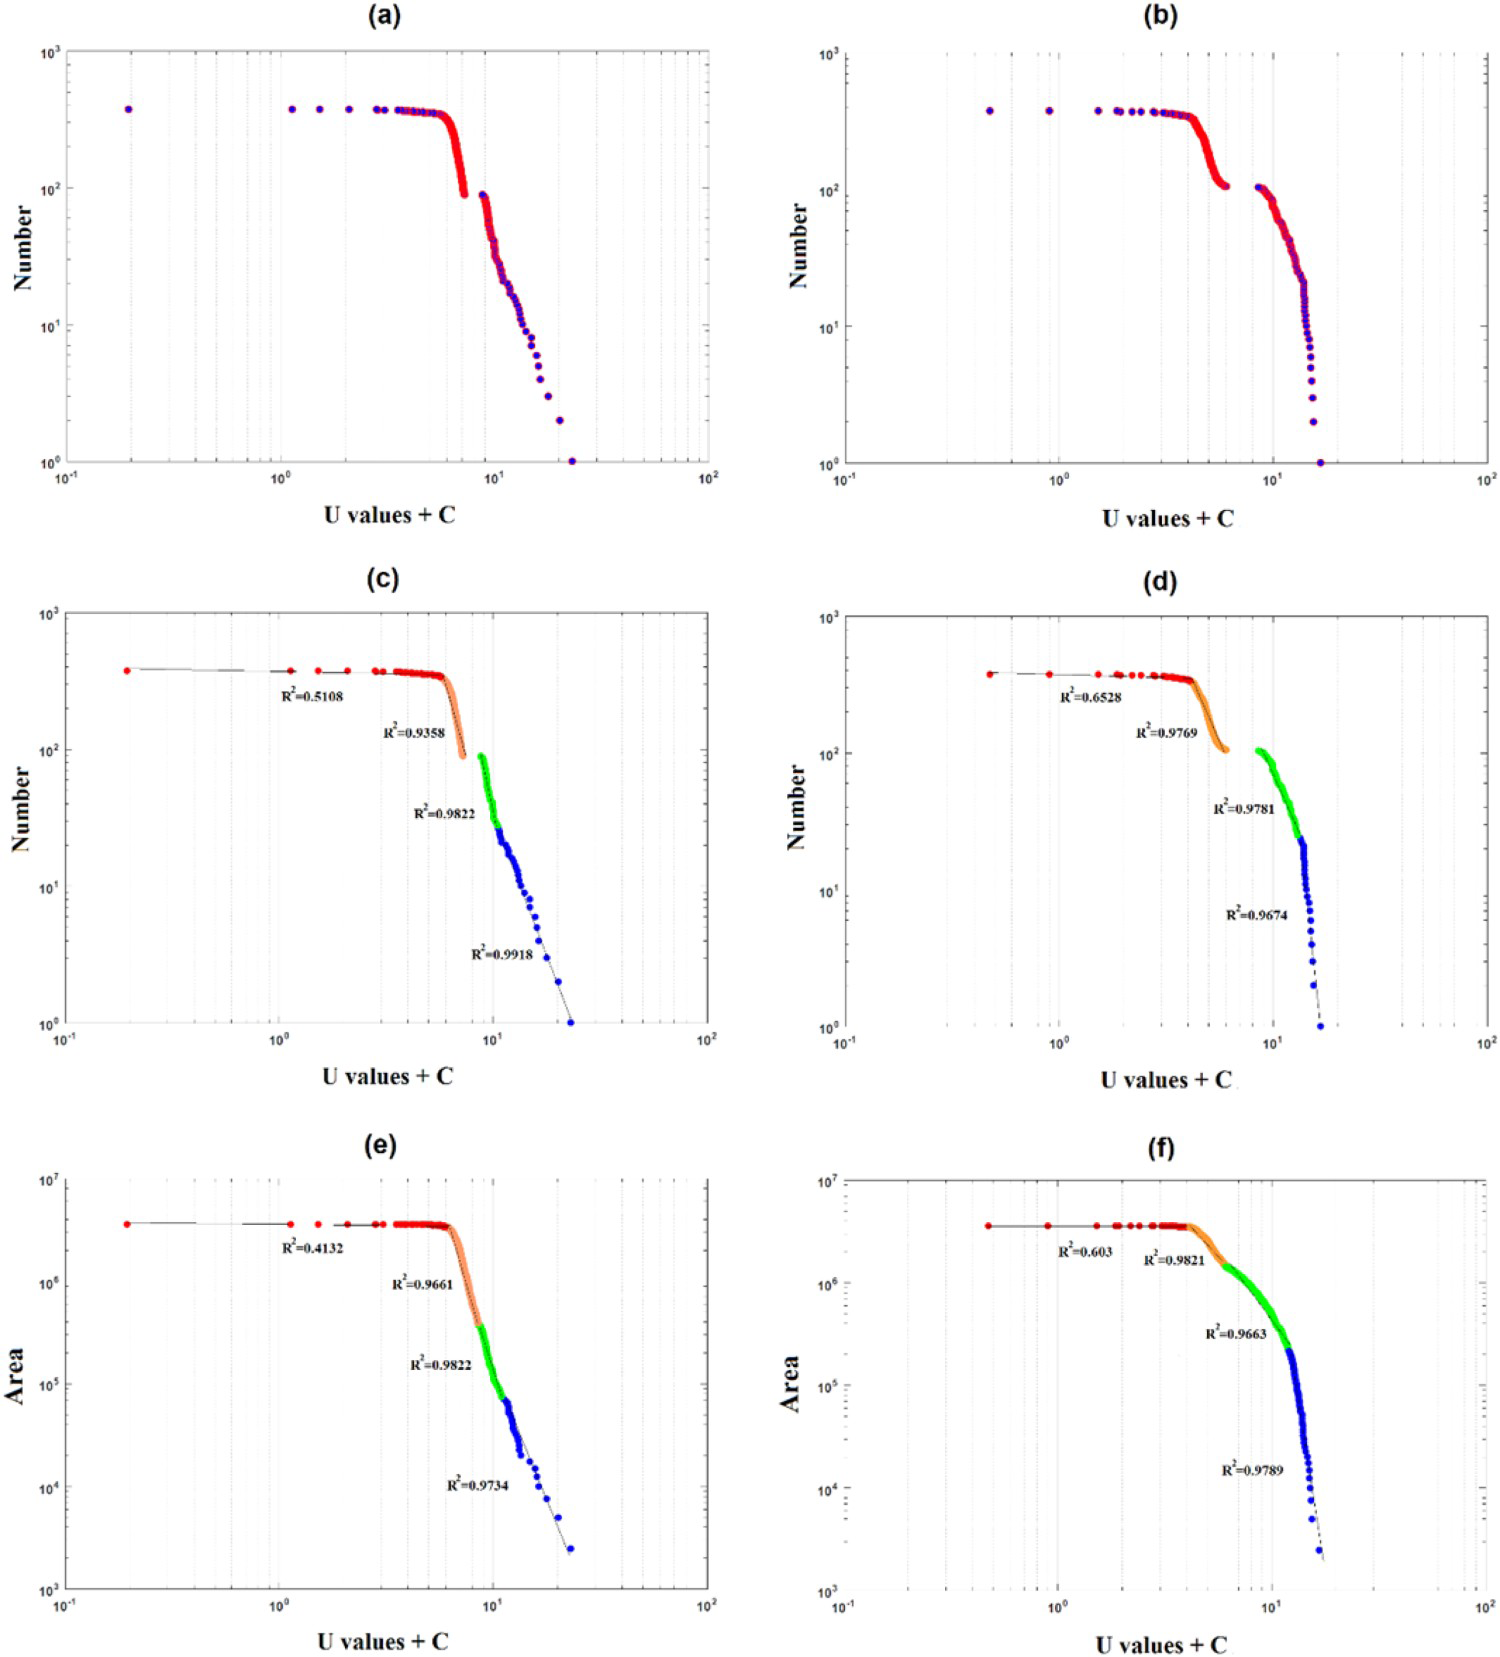
Then, at the second step, using IDW interpolation, U values related to each pixel (50 × 50 m2) were calculated and then, by applying the C-A fractal method to U values related to Cu and Mo elements, the U-A fractal model, their threshold and finally the concentration ranges related to populations were resulted. However, it should be noted that in this section, due to the homogeneity of the U values by the Surfer software, especially at the zero point where the separation was caused by the separation nature of the U-statistic, the discontinuity (which was created in the U-N model) may not be observed in its fractal model (U-A). However, it is still more appropriate to consider the threshold between background and anomalous populations at this point (i.e. equal to the constant amount (C) of additive added to the U values). The U-A fractal models are observed in Figure 14(e, f).
In the following, the different line segments related to geochemical populations are fitted to the above models in order to define geochemical populations (based on least-square regression), and the straight fitted lines can be seen in Figure 14(c–f).
Discussion
As expected, a clear breakpoint can be seen in the above diagrams (Figure 14(a, b)), which in addition to this breakpoint, there is also a discontinuity that represents the boundary between background and anomaly populations. In fact, it shows the performance of this method compared to the C-N fractal method.
Other advantages of this method include other breakpoints in these diagrams, which are much clearer than the C-N model (Figure 12(c, d)). In actually, in original fractal models of raw data, the breakdown boundaries and, consequently, the thresholds are not very clear and are determined visually and by taste. While in this method, by applying two structural separation methods simultaneously on the data, the breakpoints become clearer and their determination will be more accurate and much simpler.
As said in the previous section (results) about the absence of a discontinuity in the U-A fractal model and as can be seen in the above shown fractal models, the U-A fractal models for Cu and Mo did not have a discontinuity equal to the additive constant (C). But according to what has been said in the past, in the fractal method of U-A, even if we do not see a discontinuity at point zero (among the raw values of U) or at a constant amount of additive C (among the values of U + C), we continue to consider the threshold between background and anomalous populations according to the defined thresholds by the U-statistic method. In fact, this threshold is approximately equal to the breakpoint that is created near the constant value of the additive (even if the breakpoint is mild and imperceptible). Because this boundary has threshold which is much closer to reality than the considered boundary by fractal models (at the first breakpoint).
Finally, in order to see and compare performance of the C-A and U-A fractal methods, first the latitude and longitude of samples along with their concentration and then the calculated U values in section ‘Separating anomaly using U-statistics’ are provided to the Surfer software. Then, after comparing and interpolation using the Kriging method, prospective map of the study area for Cu and Mo elements is prepared (Figure 15(a, b) for the C-A model and Figure 15(c, d) for the U-A model).
Prospective map of the study area using the C-A fractal method for Cu (a) and Mo (b) and using the U-A fractal method for Cu (c) and Mo (d).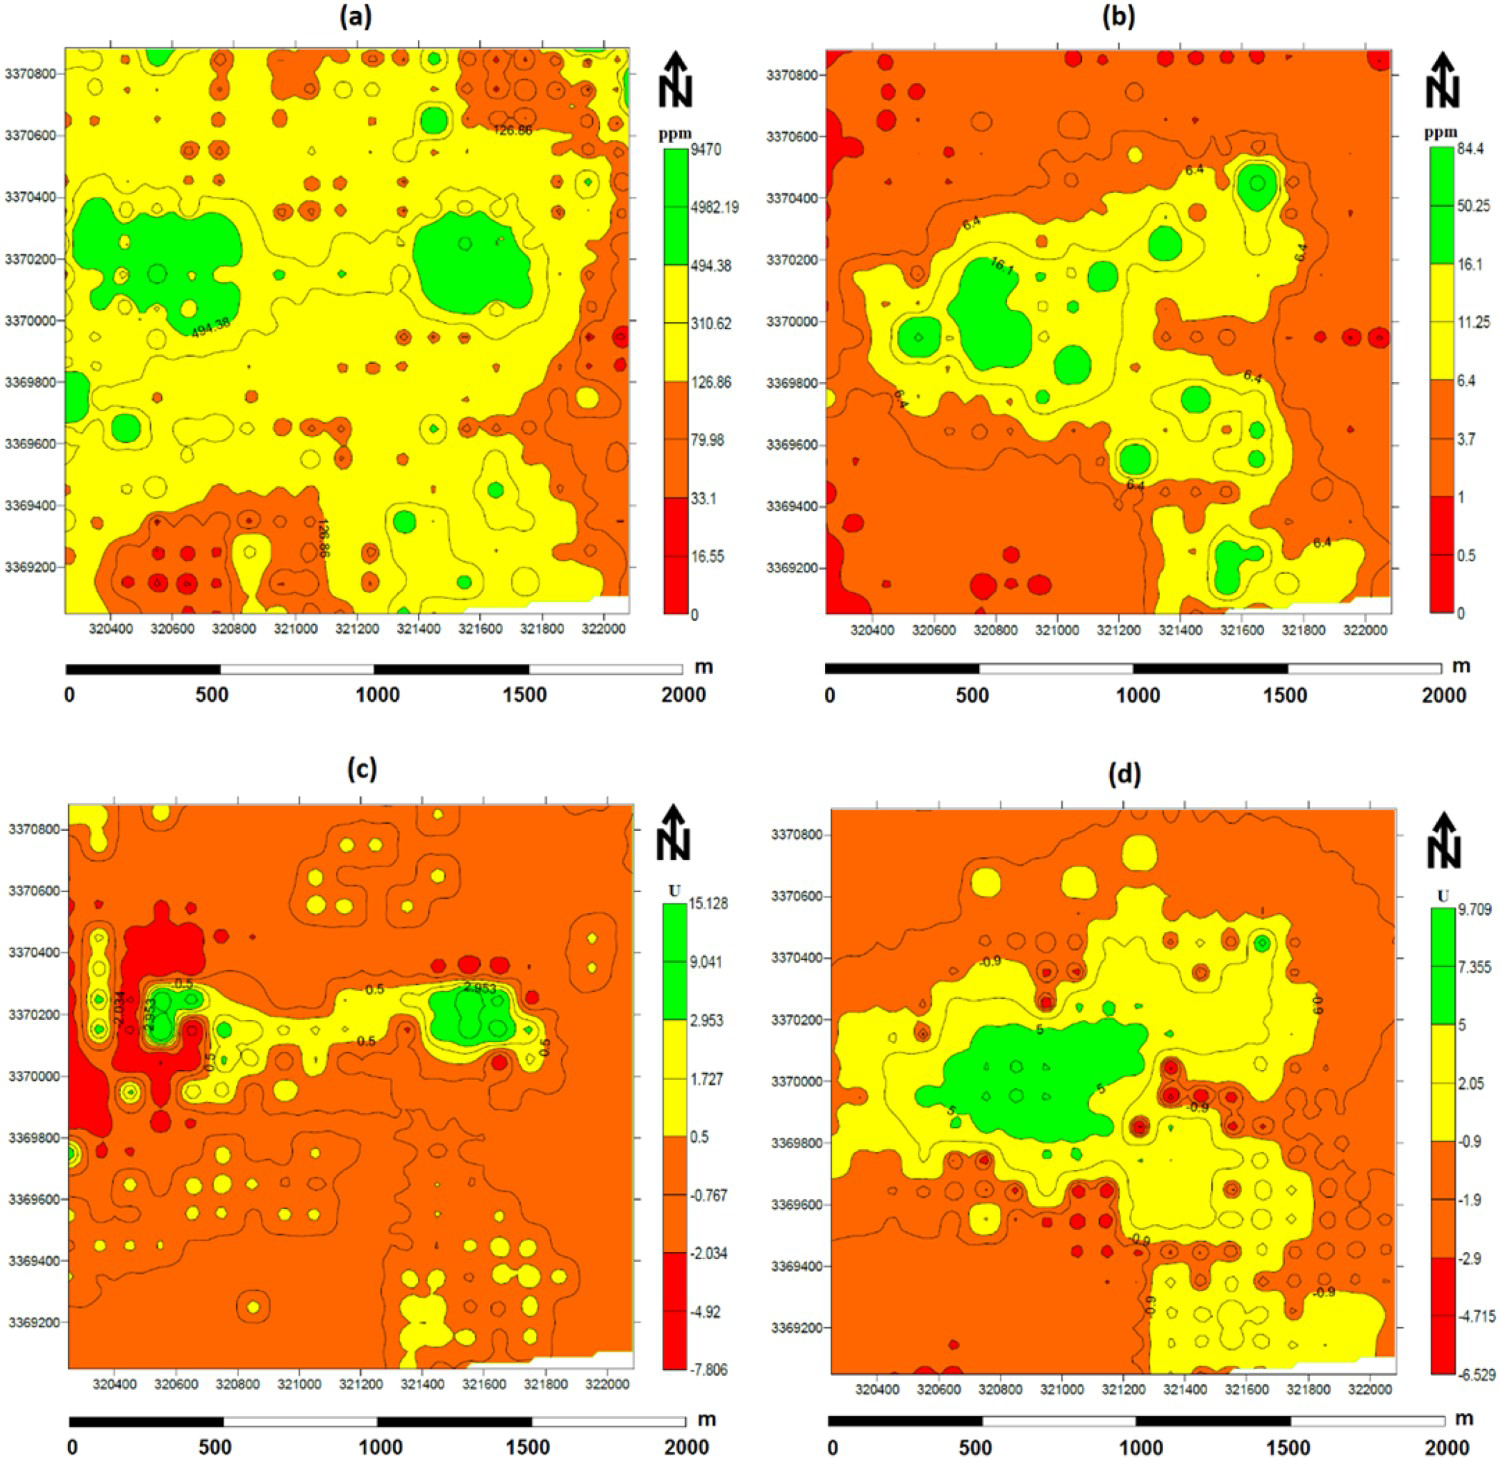
As can be seen, the boundary between background and anomaly in Figure 15(c, d) was decreased when compared with Figure 10(a, b). Moreover, it is observed that the delineated Cu mineralisation is closely associated with the defined zone of potassic alteration (see above; Figures 6 and 15(a)), which is also consistent with the field and microscopic observation of the Cu mineralisation in this alteration zone (Figure 8(a, c and d)). However, the Mo mineralisation delineated by the U-A model is mostly associated with the phyllic alteration and is spatially conformable with the zone defined for it (see above; Figure 6 and 15(b)). Therefore, the proposed combined methods could be introduced as effective tools in this field, so that determining the threshold between background and anomaly and also other fracture boundaries using them, is much simpler and more accurate than concentration fractal models (C-N and C-A) in a similar situation.
Therefore, it could be observed that the combination of U-statistics and the fractal technique is far more powerful combination than the others and this combination could be introduced as U-N and U-A fractal methods in the field of separation anomaly from background. Also, it should be noted that the other advantage of using this combination is detecting the anomalous values according to considering the location of samples (based on spatial structure of data).
It is noteworthy that this combined method (especially the U-A model) is more recommended for systematic lithogeochemical sampling. Because both methods are used (U-statistic and fractal techniques) to present combined models, taken into account, the spatial structure and consider the concentration and position of the surrounding samples.
Concentration fractal models and consequently, combined models proposed in this research are not suitable for samples related to stream sediments. Because in this sampling type, the samples do not belong to the sampling place and, in fact, represent another region. Therefore, in these cases, the Sinclair method (based on probability diagrams) is often recommended.
The Sinclair method according to some studies on stream sediments samples (Sinclair 1991; Saager and Sinclair 1974; Aral and Sarac 1988; Alexakis 2008; Ghannadpour et al. 2013; Ghannadpour and Hezarkhani 2017) shows itself as an effective approach for separating anomalous values in stream sediments sampling compared to structural methods. Conversely, it is not very efficient in systematic lithogeochemical sampling (as in this study and in Figure 11, there was no any effect of bimodal populations). Therefore, the Sinclair method is recommended for stream sediments exploration surveys and fractal models for systematic and non-systematic rock sampling.
Conclusion
Results obtained by combining the U-statistics and fractal techniques shown that fracture boundaries, especially the first breakpoint in the diagrams (as boundary of the first and second statistical populations) (Figure 14), are much clearer and more accurate than concentrations fractal models (C-N and C-A) in the same condition (Figure 12). In fact, it could be concluded that by becoming clearer the breakpoints, the boundary of populations will be determined simply and with high accuracy.
As observed, there is a discontinuity as exalt threshold between background and anomaly in the U-N model due to the nature of the U method algorithm that however, in the U-A model, this item was not seen due to the homogenisation of U values. Actually, in the results of the proposed combined method (U-N and U-A models), the boundary of anomaly and background is separated based on the U-statistic method (before the use of fractal models). So that it was seen in lithogeochemical maps that the delineated elements mineralisations are closely associated with the defined zone of potassic and phyllic alteration, respectively (see Figures 4 and 15). Actually, the delineated Cu mineralisation is closely associated with the defined zone of potassic alteration and the Mo mineralisation delineated by the U-A model is mostly associated with the phyllic alteration and is spatially conformable with the zone defined for it. While this conformity is not observed for concentration models results (due to the lack of accurate determination of the threshold between background and anomaly among the several breakpoints).
Indeed, in this combined method, the threshold between background and anomalous populations will be determined using the U-statistical method, and their sub-populations will be identified by the breakpoints created in the fractal models. Because the U-statistic method is a very powerful method in determining threshold between background and anomaly populations and the fractal technique in identifying their sub-populations.
Finally, it could also be said that U-N and U-A models are more effective than natural concentration models (C-N and C-A) in delineation of anomaly from background. According to this fact, it could be proposed that because the U-statistic method devotes a new value to each sample, it could be combined with other methods such as the C-V fractal model (as the U-V fractal model) to distinguish supergene enrichment and hypogene zones, from oxidation zones and barren host rocks, based on the distribution of elements grades such as Cu grades in three-dimensional condition.
Footnotes
Disclosure statement
No potential conflict of interest was reported by the author(s).